 Terrence A. McCloskey
 Christopher G. Smith
 Kam-biu Liu
 Paul R. Nelson4
- 1Cherokee Nation Technology Solutions, U.S. Geological Survey, Wetland and Aquatic Research Center, Baton Rouge, LA, United States
- 2U.S. Geological Survey, St. Petersburg Coastal and Marine Science Center, St. Petersburg, FL, United States
- 3Department of Oceanography and Coastal Sciences, Louisiana State University, Baton Rouge, LA, United States
- 4Independent Researcher, Tampa, FL, United States
Shoreline retreat is a tremendously important issue along the coast of the northern Gulf of Mexico, especially in Louisiana. Although this marine transgression results from a variety of causes, the crucial factor is the difference between marsh surface elevation and rising sea levels. In most cases, the primary cause of a marsh's inability to keep up with sea level is the lack of input of inorganic material. Although tropical cyclones provide an important source of such sediment, little effort has been made to determine the point of origin of the deposited material. In this study we use sedimentary, geochemical and biogeochemical data to identify the bed of the Pearl River and/or Lake Borgne as the source of a ~5 cm thick clastic layer deposited on the surface of the Pearl River marsh on the Louisiana/Mississippi border. Radiochemical chronologies and sedimentary evidence indicate that this layer was associated with the passage of Hurricane Katrina in 2005. As this material would otherwise have been lost to the system, this deposition indicates a net gain to marsh surface elevation. Accretion rates, determined from 137Cs and 14C profiles and the use of the Katrina layer as a stratigraphic marker, indicate that short-term (~50 years) rates are as much as an order of magnitude higher than the long- term (1000s of years) rates. We suggest that the marsh's geologic setting in an incised river valley with steep vertical constraints and a large fluvial discharge, promotes rapid accretion rates, with rates accelerating as the sea moves inland, due to extended hydroperiods and the input of clastic material from both the marine and terrestrial sides. These rates are especially large when compared to accretion occurring in the more common open marshes fringing the Gulf that lack fluvial input. The difference is particularly large when related to marsh recovery/regrowth following the deposition of thick hurricane-generated clastic layers. Given the number of similar incised river valleys along the Gulf Coast, we believe that understanding the processes controlling marsh accretion in such environments is essential in evaluating marsh sustainability on a regional basis.
Introduction
Sea level variability is a major concern globally. Along the northern coast of the Gulf of Mexico relative sea level rise (rSLR) has resulted in severe coastal erosion and rapid land loss (Day et al., 2007). Between 1932 and 2010 the state of Louisiana lost ~4,800 km2 of land (Couvillion et al., 2011), with projected loss of up to ~13,500 km2 by 2100 (Blum and Roberts, 2009; Moser et al., 2014). This loss of land has already resulted in significant landward migration of the population and infrastructure (Dalbom et al., 2014; Lam et al., 2016; Cai et al., 2018; Colten et al., 2018), including current government-subsidized resettlement of a threatened community Simms, 2018). The landward migration is characterized by the replacement of coastal marshes with open water. The resulting changes in bathymetric and topographic conditions and increased fetch can significantly increase both the wave power and storm-surge height associated with tropical cyclones, thereby increasing the vulnerability of inland areas (Young and Verhagen, 1996; Marani et al., 2011; Leonardi et al., 2016; Twilley et al., 2016; Karimpour et al., 2017), and a reduction in ecological services (Costanza et al., 2006; Peterson et al., 2008; Craft et al., 2009). Modeling studies generally predict an increase in both the number of intense storms and the maximum intensity of future tropical storms under global warming (Bender et al., 2010; Murakami et al., 2012; Emanuel, 2013; Holland and Bruyere, 2014), highlighting a large potential future increase in the societal costs of coastal erosion.
By accreting upward, coastal marshes can maintain a fairly stable elevation relative to sea level, until the rate of rSLR surpasses their rate of surface elevation increase (accretion rate minus subsidence rate). Vertical accretion in marsh environments is dependent upon both allochthonous sediment input and autochthonous biomass accumulation (Reed, 1990). Biomass-based accretion can track sea level during moderate rates of rSLR; however, there is an upper limit beyond which marshes will not be able to keep up (Morris et al., 2002, 2016). As a result, mitigation schemes aimed at reducing future losses are commonly based on increasing sediment supply, principally inorganic sediments (mud, sand), to the deteriorating marshes (CPRA, 2007, 2012, 2013, 2016; Day et al., 2007). Although a current debate concerns the relative importance of marine-generated sediment (delivered by tropical cyclones) vs. fluvially-delivered terrestrial material (Turner et al., 2006, 2007; Törnqvist et al., 2007; Tweel and Turner, 2012, 2014; Smith et al., 2015), the value of mineral deposition in mitigating the negative effects of rSLR rise is treated as a given (Delaune et al., 1978; Blum and Roberts, 2009; Allison and Meselhe, 2010; Day et al., 2011; Stralberg et al., 2011; Allison et al., 2012; Kemp et al., 2016).
Mineral sediments delivered to coastal marshes by tropical storms can contribute to marsh sustainability in a number of ways, including increasing surface elevation, providing essential nutrients, and reducing phytotoxicity (Guntenspergen et al., 1995; Turner et al., 2006; McKee and Cherry, 2009; Tweel and Turner, 2012, 2014). However, in open marshes fringing the coast, the sudden increase in surface elevation associated with the deposition of a thick clastic layer by a tropical cyclone may not be entirely positive (Osgood et al., 1995). In coastal marshes, vegetation type and biomass levels are highly dependent on the inundation regime, which is controlled by elevation (Eleuterius and Eleuterius, 1979; Rasser et al., 2013). As a result, not only can the deposition of a thick clastic layer kill vegetation, but it can also retard/prevent subsequent organic accretion, and thereby eliminating/reducing organic accumulation and vertical accretion until sea level rises sufficiently to increase the hydroperiods (Langlois et al., 2001; Stagg and Mendelssohn, 2010, 2011; Walters and Kirwan, 2016).
Incised river valleys are common geologic features along the Gulf of Mexico from Texas through the Florida panhandle. During the last oceanic lowstand Gulf Coast rivers formed braided channels, incising and widening their river valleys long distances upstream from the coast, which was far seaward of its present position. Rising Holocene sea levels then pushed sediments landward, filling and leveling the valleys as the bayhead deltas migrated upstream (Kindinger et al., 1994; Saucier, 1994; Greene, 2006; Yeager et al., 2012; Anderson et al., 2016). Marshes occupying these coast-perpendicular incised valleys are usually wide and flat, constrained by steep topographic gradients along both flanks. They are generally fresher and have a steeper salinity gradient than the more common coast-parallel fringing marshes situated along the coastal plain. Although spatially extensive, these environments have been largely ignored in regards to coastal retreat and their response to tropical cyclone-generated deposition. In this study we investigate accretion rates from the Pearl River (Louisiana) bayhead delta and compare recent (~ last 50 years) accretion rates to rates observed throughout much of the Holocene.
Study Site
The Pearl River, located along the border between Louisiana and Mississippi (USA), is one such valley, which during the Wisconsin glaciation incised a channel ~ 75 m below present sea level in a valley ~14 km wide (Frazier, 1974; Yeager et al., 2012) before entering the sea ~145 km south of the current mouth (Kindinger et al., 1994). The river currently drains ~22,000 km 2 in Mississippi and Louisiana; reaching the Gulf of Mexico at the border between those two states (Figure 1). Average daily discharge is 373 m3/s, the fourth largest volume for the eastern Gulf of Mexico (Ward et al., 2005). Average annual precipitation near the coast is 163 cm/year (Green, 2000). Approximately 75 km upstream from the present mouth the river diverges into two main channels, the East and West Pearl rivers, that flow through their respective sides of the 5–12 km wide valley. The oligohaline Pearl River marsh, which fills the valley floor, is dominated by very diverse, heavily-vegetated swamps, marshes, floodplains and a maze of interconnected channels (Ward et al., 2005). Surface elevations are low, ranging from 24 to 42 cm NAVD88 for the five CRMS sites (https://lacoast.gov/crms_viewer/Map/CRMSViewer), and from 23 to 43 cm NAVD88, for our marsh sampling sites. Human hydrological modification has been restricted almost entirely to the two major channels. The river drains into Lake Borgne, separated from the main Gulf of Mexico by the remnants of the St. Bernard lobe, an abandoned delta of the Mississippi River that was active from ~4,000 to 1,000 years ago (Otvos and Giardino, 2004; Rodgers et al., 2009).
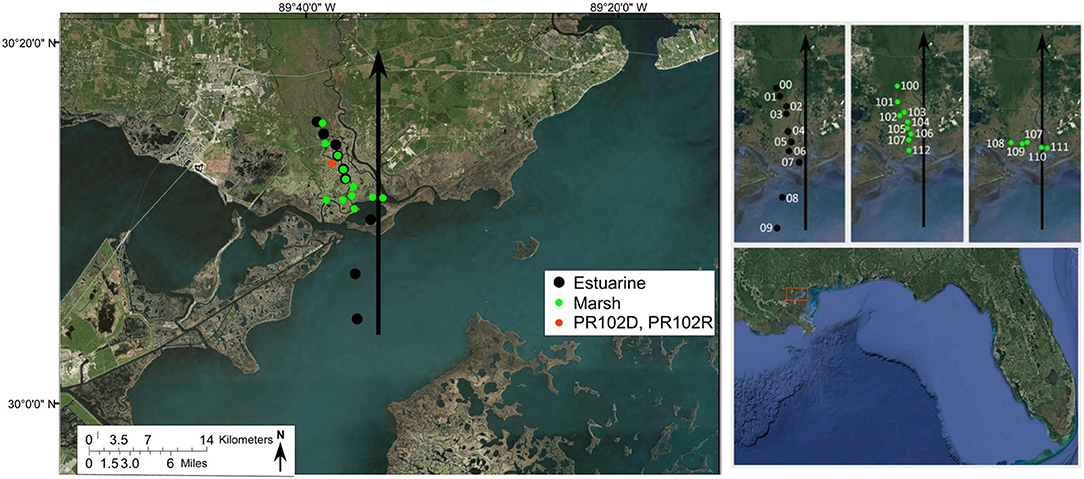
Figure 1. Location map. Study site showing location of marsh (green dots) and estuarine (black dots) surface samples. Site of example core PR10-2D and long cores PR102R and Li-1994 is marked by the red dot (left). The black line marks the path of the eyewall of Hurricane Katrina. Figure on top right displays the locations of samples from the n-s estuarine transect (left), n-s marsh transect (middle) and w-e marsh (right); inset on bottom right shows the location of the larger figure (red rectangle) in relation to the northern Gulf Coast. Base map: Esri, DigitalGlobe, GeoEye, Earthstar Geographics, CNES/Airbus DS, USDA, USGS, AEX, Getmapping, Aeogrid, IGN, swisstop, and the GIS User Community.
On August 29, 2005 Hurricane Katrina, a very large tropical cyclone, made landfall in the Pearl River marsh as a category 3 hurricane with a maximum sustained wind speed of 105 knots and a pressure of 928 mb. The storm tracked due north across the eastern edge of the marsh (Figure 1), producing a recorded storm surge of 4.87 m just west of the mouth of the East Pearl River (Knabb et al., 2005).
Methods
Field Methods
We extracted one long (690 cm) and seven short (~40 cm) sediment cores and 23 surface sediment samples from the Pearl River marsh. The surface samples were collected along two coordinated coast-perpendicular transects (marsh surface and river/estuary bed) down the salinity gradient, beginning at the upland forest and finishing in Lake Borgne, and a single (marsh surface) coast-parallel transect along the lower edge of the marsh (Figure 1). For both sample types, ~25 cm3 of the surface material was collected in sterile plastic bags, which were then sealed and labeled. Marsh surface samples were obtained by scrapping the top ~1-cm of surface sediments with a spoon. The riverine/estuarine samples similarly represent the top ~1-cm of sediments occurring at the water/sediment, scrapped from the top of materials collected from a ponar grab deployed over the side of the boat.
Five of the short cores (PR102D, PR107D, PR108D, PR109D, PR110D, PR11D) were collected along the same coast-parallel transect as the surface samples, ~1 km inland. Cores were extracted at the same sites as the surface samples, and received the same numerical designation, with the sample type indicated by the last letter; “S” formarsh surface sample, “D” for short cores and “R” for long cores. For example, surface sample PR102S, short core PR102D and long core PR10R were all extracted within a radius of 2-3m at site PR102. Short core PR112D was collected on the coast and PR102D was collected was ~7 km inland. All seven short cores were collected by a “sharpshooter” shovel as ~40 cm long slabs, which were then placed horizontally on PVC boards, sliced into rectangular shapes, wrapped in plastic and labeled. The long core (PR102R) was collected within a meter of the short core PR102D by a Eijkelkamp Peat Sampler with a 5.08 cm (inside diameter) hemispherical barrel. The core consists of Seventeen 50 cm segments, with a minimum 10-cm overlap between segments. Overlaps between core segments were resolve by a matching of loss-on-ignition values and visual inspection. At all sites photographs were taken in the four cardinal directions, and such salient physical, hydrological and geomorphological features as changes in topography or vegetation, the presence/absence of water bodies or channels, evidence of disturbance, distance to streams or open water, were recorded. Locations and elevations for all sites were determined by Ashtech Proflex differential GPS (dGPS) receivers. All cores were photographed in the field and stored in ice chests during field work and transport, and then stored in temperature-controlled core lockers after transport to the laboratory.
Laboratory Analyses
Water and organic content were determined for all surface samples, and at 1-cm resolution for the long and short cores, following the procedures of Liu and Fearn (2000) (methodology summarized in the Supplementary Material S1). Dry bulk density was determined for all surface samples and at 1-cm resolution for short core PR102D, as described in the associated Data Release (McCloskey et al., 2018b). Elemental concentration data was collected with an Innov-X Delta Premium DP-4000 handheld X-ray fluorescence (XRF) unit on all surface samples, all short cores and long cores PR102D and PR102R at the Global Change and Coastal Paleoecology Laboratory of Louisiana State University. Two readings were taken of each surface sample; these were then averaged. The cores were analyzed at 2-cm resolution, except in locations of interest, where readings were taken at 1-cm resolution. The XRF device analyzes each sample across three frequencies for 30 s per frequency, recording counts per second (cps) for over 30 elements. CPS are converted to parts per million (ppm) through calibration with certified standards NIST 2710a and 2711a. We report data for S, Cl, K, Ca, V, Cr, Mn, Fe, Co, Zn, Br, Rb, Sr, Zr, and the Br/Cl and Ti/Br ratios. We note that XRF is a semi-quantitative technique, producing relative rather than absolute values unless calibrated with quantitative geochemical techniques (such as ICP-MS). Because the recorded values remain the same relative relationship with absolute values, the shape of the downcore elemental profiles are valid, however, concentration comparison between elements must be used with caution (Brand and Brand, 2014; Young et al., 2016).
Four samples of terrestrial plant material were selected from long core PR102R to develop the multi-millennial chronology. Approximately 1–2 cm3 of bulk sediments were removed from interior locations in the core sections and passed through a 63-micron sieve to remove silt and clay. Plant fragments were selected from the remaining material under a dissecting microscope after being washed in de-ionized water. This material was dried and sent to the National Ocean Sciences Accelerator Mass Spectrometry (NOSAMS) Laboratory at Woods Hole Oceanographic Institution for radiocarbon dating. Radiocarbon dates were calibrated to calendar years, and median dates provided by Calib 7.1 (http://calib.qub.ac.uk/calib/calib.html) based on the Reimer et al. (2013) data set. BACON 2.2 age-modeling software (http://chrono.qub.ac.uk/blaauw/bacon.html) was used to display the results.
Grain size analysis was performed on the short core PR102D using a Coulter LS 200 particle-size analyzer. Two subsamples were prepared from homogenized material taken at 1-cm resolution down the length of the core. After removing organic material with hydrogen peroxide, a minimum of three runs was performed on each subsamples. The GRADISTAT software program (Blott and Pye, 2001) was used to calculate the size distribution, mean grain size, sorting, skewness, and kurtosis for each sample. Classification of sediment texture, automatically generated by GRADISTAT, was based on Folk (1954).
Sediments from the short core PR102D were measured for short-lived, atmospherically-derived radionuclides to provide chronology data (time and accretion rates) for the last 50 to 100 years. The procedures follow that of Smith et al. (2013) and is detailed in McCloskey et al. (2018b). Briefly, the core was sectioned at 1-cm (0–28 cm) and 2-cm (30–40 cm) intervals. The mass of each section was recorded prior to (wet) and after (dry) drying the sample at 60°C for 48 to 72 h. The dry samples were homogenized with a porcelain mortar and pestle, packed into air-tight containers, and allowed to age for approximately 30 days to allow daughter (222Rn) and granddaughter radioisotopes (214Po, 214Bi) to reach secular equilibrium with the parent isotope 226Ra. Following the aging procedure, each dried sample (section) was measured for 210Pb (photopeak 46.5 keV), 226Ra (via the granddaughter isotopes, photopeaks 295.7, 352.5, and 609.3 keV), 137Cs (photopeak 661.7 keV), and 40K (photopeak 1460.8 keV) on a low-energy, planar-style high purity germanium gamma-ray spectrometer (Canberra, Inc). All samples were corrected for self-absorption following the procedure of Cutshall et al. (1983), using a sealed 238U source with unattenuated count rates that are 500, 5000, 22000, 22000, and 25000 times greater than sample count rates for photopeaks 46.5, 63.3, 295.7, 352.5, and 609.3 keV, respectively. Efficiencies for U-Th series radionuclides were determined using the IAEA (International Atomic Energy Agency) RGU-1 standard. Following guidelines by McCurdy et al. (2008), maxima values of sample-specific critical limits for (ssLc) for all samples analyzed for photopeaks 46.5, 295.7, 352.5, 609.3, 661.7, and 1460.8 keV, were 4.9, 3.12, 1.77, 2.52, 1.51, and 21.7 Bq/kg, respectively.
Following the guidelines of Swarzenski (2015) and Corbett and Walsh (2015) and references therein (not repeated here), we evaluated the utility of the Constant Rate of Supply (CRS), Constant Flux: Constant Sedimentation (CF:CS), and Constant Initial Concentration (CIC) models to establish chronology from excess 210Pb (210Pbxs) data. Details of these models and the underpinning assumptions can be found in the reviews by Swarzenski (2015) and Corbett and Walsh (2015). For the CRS and CF:CS models, mass depth (g/cm2) were used to consider autocompaction based on the suggestion of Binford (1990) and Appleby (2001). Additionally, 137Cs occurrence in sediment were compared with historical 137Cs fluxes. 137Cs, an artificial nucleotide associated with above-ground nuclear explosions and the release from nuclear reactors (Ferreira et al., 2016), was not detectable in the atmosphere prior to 1954, with atmospheric concentration reaching a maximum ~1963, after which levels declined rapidly as a result of the Nuclear Test Ban Treaty (Zhang et al., 1990; Walling and He, 1999).
Sediment samples were collected from all surface samples and 18 intervals (2-cm resolution from 1 to 10, 17 to 38 cm; 1-cm resolution 10 to 15 cm) down short core PR102D and measured for bulk concentration and stable isotope composition of total organic carbon (TOC, δ13C) and total nitrogen (TN, δ15N). The dried, homogenized samples were divided into two parts, with one portion, placed in small silver capsule and fumigated with hydrochloric acid to remove inorganic carbon, used for the determination of TOC and associated δ13C, and the untreated, portion used for the determination of TN and associated δ15N. These samples were sent to the U.S. Geological Survey (USGS) Reston Stable Isotope Laboratory, where they were processed under the standard protocol described in Révész et al. (2012) (methodology summarized in the Supplementary Material S2). Isotopic abundances are reported as per mil (‰) and follow standard reporting practice with references for δ15N and δ13C being air and VPDB, respectively.
Principal Component Analysis (PCA) was performed on all surface and short core PR102D samples for both the XRF and carbon/nitrogen data. We used standardized and centered variables, entered into the C2 v1.75 software program (https://www.staff.ncl.ac.uk/stephen.juggins/software/C2Home.htm).
Hurricane tracks were downloaded from the NOAA Historical Hurricane Tracks website (https://coast.noaa.gov/hurricanes/).
Results
Surface Samples
There are significant differences between the sedimentological features of the marsh and river/estuarine sample sets; both wet and dry bulk densities were lower, and water and organic content higher for the marsh than the estuarine samples. Dry bulk densities ranged from 0.09 to 0.31 g/cm3 for the marsh samples (average 0.18 g/cm3) and from 0.25 to 1.39 g/cm3 (average 0.71 g/cm3) for the estuarine samples. Water and organic content averaged 4.4 and 36.6% for the marsh samples and 1.7 and 6.6% for the estuarine samples (Table S1).
The elemental data exhibit recognizable spatial trends. For the estuarine samples the relative concentrations increase downstream by > 30%, for K, Cr, Fe, Zn, and Zr and more than 200% for Cl, Ca, Mn, Rb, and Sr. For the marsh samples, the relative concentrations decrease downstream by >60% for Ti, Cr, Mn, Fe, and Co and >25% for V, Co, and Rb, while Cl, Zr, and Sr increase slightly downstream, and Br concentrations spike in the middle of the transect (Figure 2). Except for Br, which shows the reverse trend, concentrations are significantly higher for all elements in the estuarine than marsh samples. The PCA biplots of elemental concentrations neatly separates the two sample types along PCA1, the first (primary) component, which explains 72% of the variance. With the exception of one marsh and one estuarine sample, all estuarine samples exhibit positive values for PCA1 (corresponding to high concentrations of S, Cl, K, Ca, Ti, V, Cr, Mn, Fe, Co, Zn, Rb, Sr, Zr, Pb, and low concentrations of Br) and all marsh sample exhibit negative values (Figure 2).
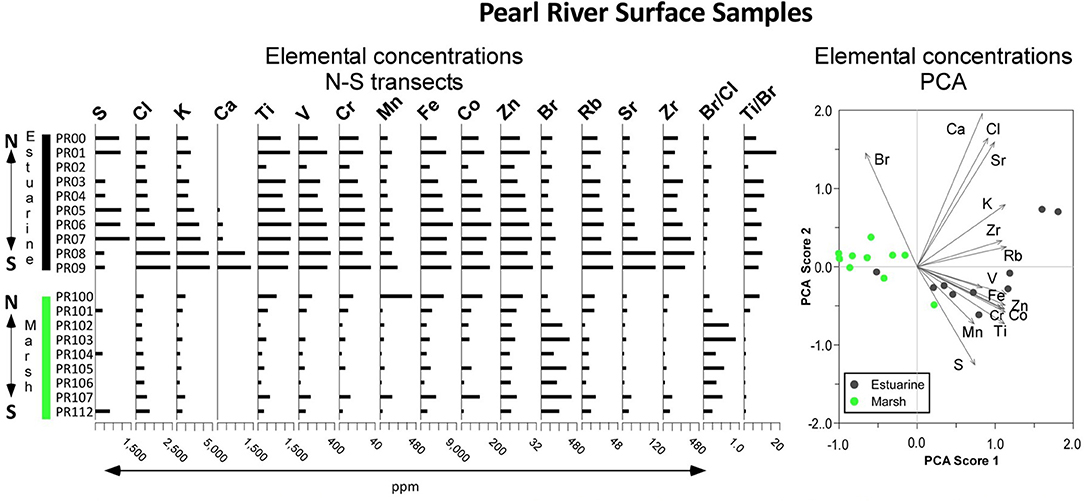
Figure 2. Elemental concentration data. Concentration profiles (left) profiles and PCA biplots (right) are displayed for surface samples. Both estuarine and marsh samples are arranged vertically along their respective north-south transects. Data for the samples along the west-east marsh transect are not shown.
The biogeochemical constituents of both the estuarine and marsh sediments vary spatially, yet are distinct from one another. (Figure 3, Table 1). For example, the average TOC and TN percentages are substantially different between marsh (16.38 and 1.03, respectively) and estuarine sediments (2.52 and 0.17, respectively). Spatially, TOC and TN in estuarine sediment decrease linearly downstream (5.01 to 0.58%, 0.24 to 0.06%, respectively), while TOC and TN in marsh sediment reach maxima at intermediate sites (28.2 and 2.12%, respectively). For both sediment types, TN has a very strong linear relationship with TOC (r2 = 0.93 and 0.69, for the estuarine and marsh samples respectively). Downstream, the TOC/TN ratio decreases for the estuarine samples (20.88 to 9.67), while increasing for the marsh samples. Isotopically, the δ13C signature of estuarine sediments are highly variable along the transect (−21.34 to −24.55 ‰), while δ15N generally becomes heavier downstream (1.76 to 4.51‰). In contrast, δ13C signature of marsh sediment tends to become heavier downstream and δ15N has no general trend. Based on PCA analysis, TOC and TN concentration are the biogeochemical variables that most fully distinguish the marsh and estuarine sediment samples (Figure 3).
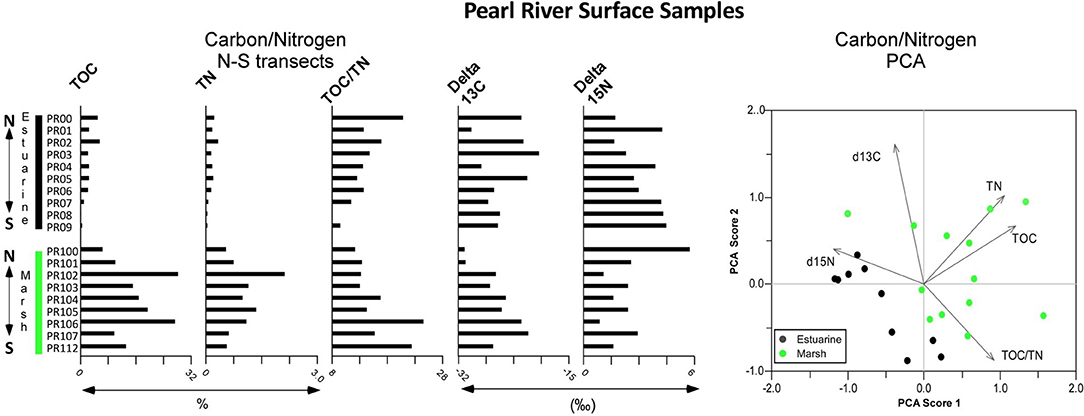
Figure 3. Biogeochemical (carbon and nitrogen) data. Concentration profiles (left) profiles and PCA biplots (right) are displayed for surface samples. Both estuarine and marsh samples are arranged vertically along their respective north-south transects. Data for the samples along the west-east marsh transect are not shown.
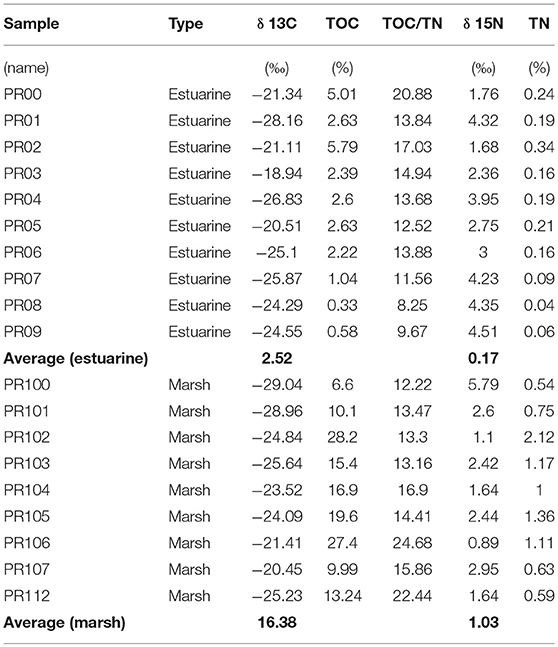
Table 1. Carbon and nitrogen data for surface samples.
Cores
Six of the seven short cores extracted from the southern end of the marsh display a distinct inorganic (low water and organic values) interval several centimeters below the modern marsh surface. The depth and thickness varies among the cores (Figure 4). The top of the layer occurs at an average of 10 cm (7, 9, 10, 10, 12, and 13 cm) in the six cores, and bottom at an average depth of 14 cm (12, 13, 13, 15, 16, and 17 cm). This layer has many features that distinguish it from the embedding organic matrix. As displayed by the example core, PR102D (Figure 5), the interval presents visually as a ~6-cm thick gray clay/silt/sand layer, classified as “sandy mud” (Folk, 1954), that completely separates the organic material below from similar material above. Buried grass rhizomes and unsprouted seeds, which do not penetrate the clastic layer, are often encountered immediately below the layer (Figure S1). The clastic layer is marked by heavier (higher wet and dry bulk densities), larger (increased mean grain size), better sorted and more finely skewed material (Figure 5), marked by distinct isotopic and geochemical signatures. Isotopically, the material displays positive shifts in the stable isotopes, δ13C and δ15N, and negative shifts in TOC, TN and the TOC/TN ratio (Figure 6). Chemically, the clastic interval has higher concentrations of S, Cl, K, Ca, Ti, V, Cr, Mn, Fe, Co, Zn, Rb, Sr, and Zr, and lower concentrations of Br, resulting in low Br/Cl and high Ti/Br ratios (Figure 7). Stratigraphic and elemental profiles for the other five cores display extremely similar patterns (Figure S2).
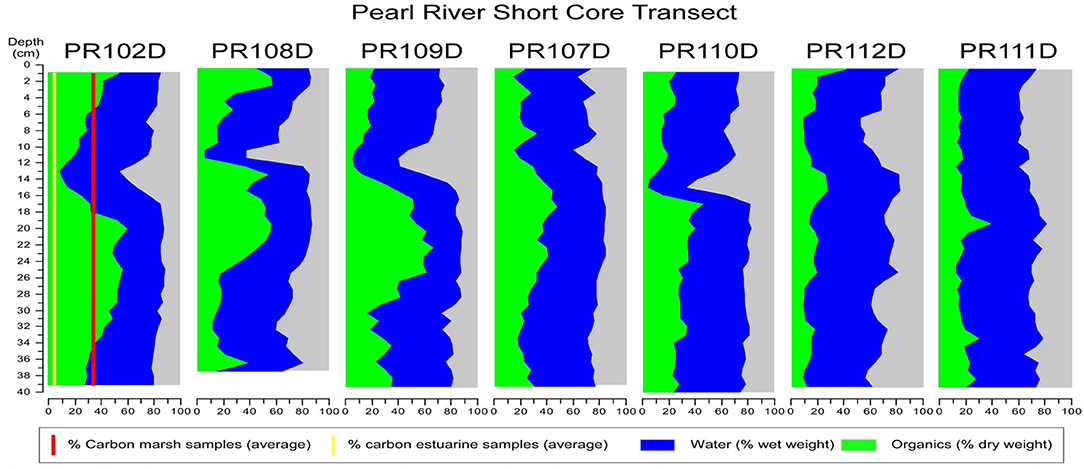
Figure 4. Water (blue) and organic (green) content of the seven short sediment cores. Significant dips in the water and organic content, indicating clastic input, occur ~ 10 cm depth in all but core PR11D. Average carbon percentage of the ten estuarine (yellow line) and thirteen marsh surface samples (red line), are superimposed on the graph of PR102D for comparison. Note the close match between organic content values for estuarine samples (yellow line) and clastic intervals (dips), and marsh surface samples (red line) and organic intervals.
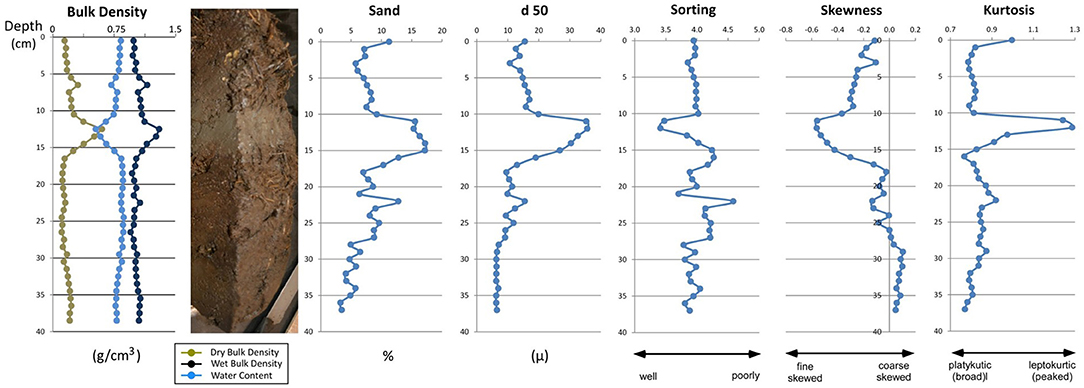
Figure 5. Sedimentary parameters of core PR102D. The light gray band at 10–15 cm of core PR102D corresponds to distinct changes in several sedimentological parameters, including skewness, sorting, and kurtosis, as well as larger mean grain size, and increased density and sand percentage.
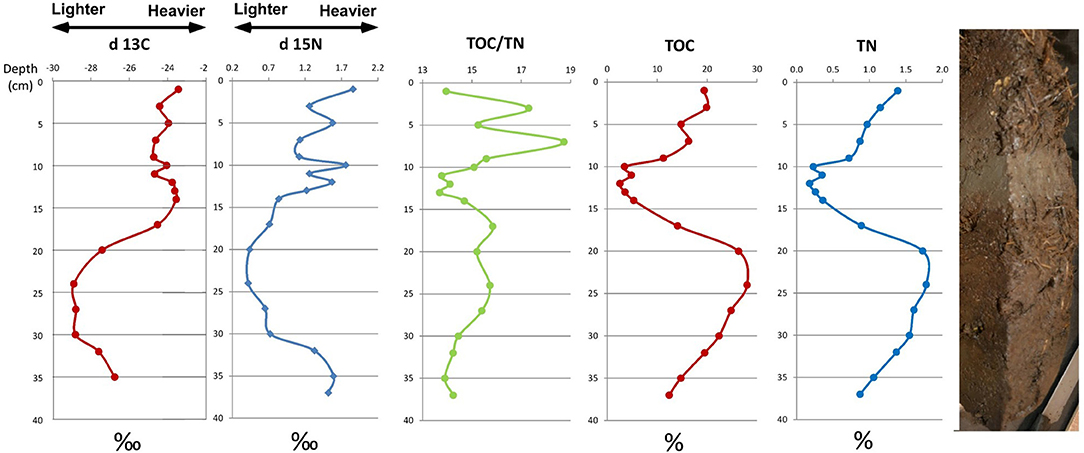
Figure 6. Biogeochemical (carbon and nitrogen) profiles for core PR102D. The light gray band at10–15 cm of core PR102D corresponds to distinct changes, including heavier δ13C and δ15N, a lower TOC/TN ratio, and reduced levels of TOC and TN.
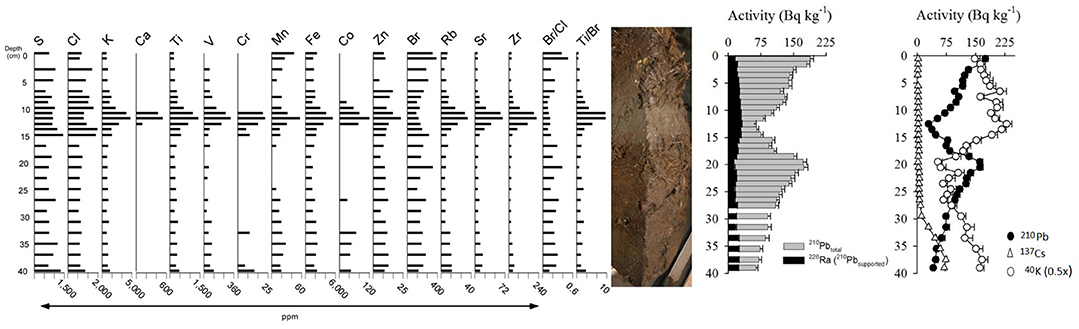
Figure 7. Elemental and radiochemical profiles of core PR102D. The light gray band at 10–15 cm of core PR102D corresponds to distinct changes in both elemental and radiochemical parameters, including increases in the concentration of a range of elements (mostly metals), and a decrease in Br (left). Within the band, 226Ra (supported 210Pb) increases slightly while excess 210Pb displays a prominent dip (center right). This dip is paralleled by the total 210Pb curve, and mirrored by the 40K curve; below ~28 cm 137Cs steadily increases downcore until peaking at a depth of 37.5 cm (far right).
Radiochemistry
The ages of the four AMS radiocarbon-dated samples from the long core PR102R are in stratigraphic order, with the uppermost, taken from a depth of 75 cm, producing a post-modern (>1950 AD) age. Samples from 196, 389 and 587 cm produce radiocarbon ages of 1,320 ± 15, 3,130 ± 20, and 4,470 ± 20 years, respectively, resulting in an extrapolated basal date of 6070 cal yr BP. These values and their calibrated date ranges and median probability age are shown in Table 2.
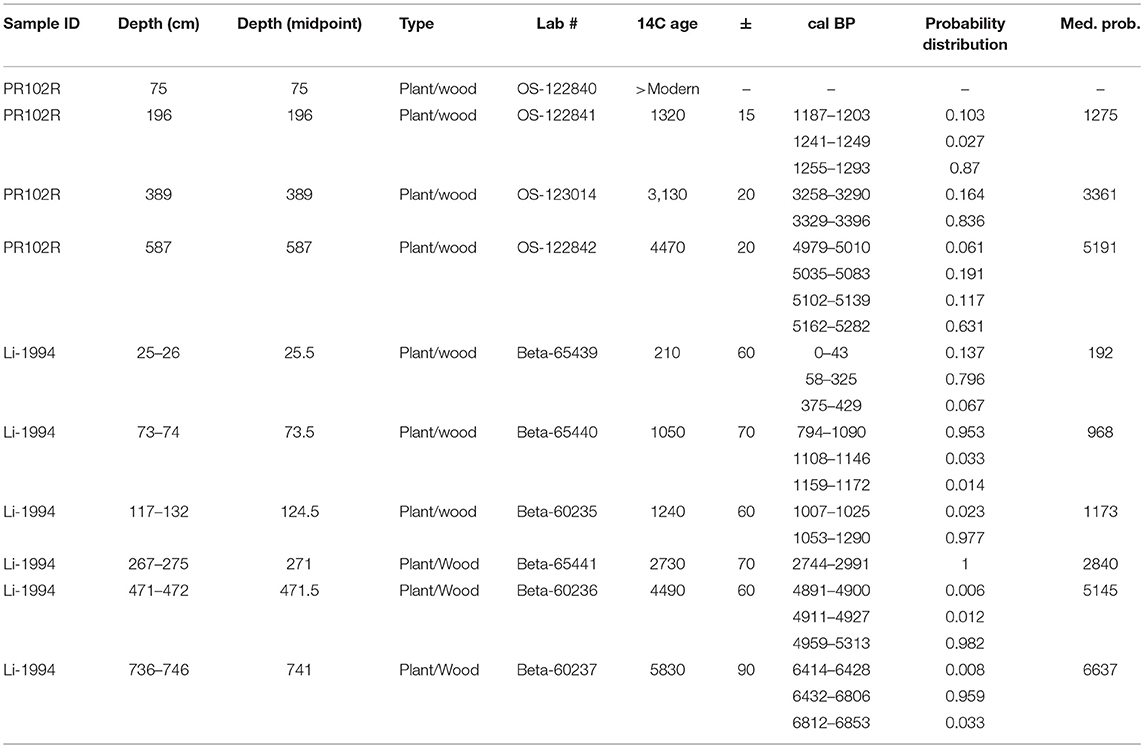
Table 2. Radiocarbon and calibrated dates for cores PR102 and Li-1994.
Gamma-emitting radioisotopes 137Cs, 210Pb and 40K, measured in Becquerels per kilogram (Bq/kg) (Figure 7), were measured in PR012D. Specific activity of 137Cs is quantitatively observed (i.e., above a minimum detection limit of 2.2 ± 0.9 Bq/kg) throughout the core, however it reaches a peak of 73.81 ± 2.90 Bq/kg at 37.5 cm. This falls within the range of peak-1963 137Cs activities (70 to 84 Bq/kg) recorded from studies conducted in salt marshes along the Louisiana coast (Terrebonne, Barataria, and St. Bernard basins) (Milan et al., 1995). This strongly suggests that 37.5 cm represents the year 1963.
The 210Pb profile deviates significantly from an idealized radioactive-decay profile and at the base of the core has total 210Pb (63.9 ± 4.5 Bq/kg) in excess of supported 210Pb (22.2 ± 1.47 Bq/kg). The deviation of the 210Pbxs profile is most notable between 9 and 20 cm, with activity in this zone much lower than the overlying and underlying sediment. Below 20 cm, 210Pbxs activity demonstrates a quantitative log-linear relationship with both depth (r2 = 0.989) and mass-depth (r2 = 0.968). Like 210Pbxs, the 40K profile has two dominant zones (0–20 cm and below 20 cm) with gradients at the upper and lower boundaries of each zone. In the lower zone, 40K is roughly half the activity (mean 203 Bq kg−1) of the upper zone (mean = 350 Bq kg−1). The zone of high 40K, a commonly-used proxy for clay concentration (Preston et al., 2013), coincides with the zone of low (below the expected values for simple radioactive decay) 210Pbxs zone; these zones also roughly correspond to the higher wet and dry bulk density regions of PR102D (Figure 7).
Chronologic results from the CIC or CRS models applied to the 210Pbxs data were either unattainable or incomplete due to the complex nature of the 210Pb distribution, down-core sediment variability (clastic layer), and the incomplete 210Pbxs inventory. However, applying the CF:CS model and its assumptions to the 210Pbxs profile from ~20 cm to the base of the core provide a mass accumulation rate of 0.72 kg/m2 /y and a corresponding accretion rate of 0.41 ± 0.10 cm/y. In comparison and assuming, conservatively, the 137Cs peak corresponds to 1963, mass accumulation rates post-1963 are 1.5 kg/m2/y and vertical accretion is 0.71 cm/y.
Discussion
Clastic Layer
Distinguishing Features
The prominent gray clastic layer present in six of the seven short cores clearly represents a depositional environment distinctly different from both the overlying and underlying organic matrix. Visually, the organic material directly beneath this layer, consisting of large, horizontally-oriented, relatively fresh, easily-identifiable marsh plant fragments (Figure S1), closely resembles the organic material that occurs above the clastic interval extending to the mash surface. The sharpness of the clastic layer's bottom contact indicates the rapidity of the change in depositional environments, as does the presence of smothered seeds and grass rhizomes, which suggest that the overlying sediments were deposited over a short enough time span to prevent germination/sprouting (Langlois et al., 2001). The dramatic compositional (organics to clastics) and geochemical changes (increased concentrations of alkali, alkaline and transition metals, and decreased concentrations of bromine) suggest an altered source of the material. This is supported by suppressed 210Pb activity levels, presumably resulting from the remobilization of previously deposited material or material from where atmospheric 210Pb is diluted, in either case reflecting an allochthonous source for these sediments (Figure 7). The increase in density and grain size suggests a more energetic transport process. Taken together, these features indicate a rapid deposition of allochthonous clastic material under high-energy conditions. As the isotopic changes (heavier δ13C and δ15N, decreased TOC/TN ratio, lower TOC and TN) are exactly the changes documented as occurring during marine intrusions along the northern Gulf Coast (Lambert et al., 2008; Das et al., 2013), and the complete burial of plant cover resembles documented effects of hurricanes (Guntenspergen et al., 1995), the most likely source of this anomalous material is transport by a large storm surge associated with a tropical cyclone. As the 137Cs chronology indicates that 1963 correlates approximately a depth of 37.5 cm, the causative storm must have occurred sometime after that year.
Candidate Events
Twelve tropical storms have passed with 150 km of the site at hurricane strength since 1963. Their tracks (Figure 8) and important parameters (Table 3) are presented below. Because the National Hurricane Center records storm data at 6 h intervals (https://coast.noaa.gov/hurricanes/) Table 3 provides data from three data points for each storm; the point which occurs closest to our site, and the points immediately preceding it (seaward), and immediately following (landward). Storm surge heights from adjacent coastal areas are listed as reported. Note: locations, measurement units, terminology, and methodology are variable; detailed information can be found in the references. Further, location-specific information was provided by height estimates from storm surge maps created from NOAA's Sea Lake and Overland Surge from Hurricane (SLOSH) model (https://www.nhc.noaa.gov/surge/slosh.php), which recreates storm surge heights for historical storms.
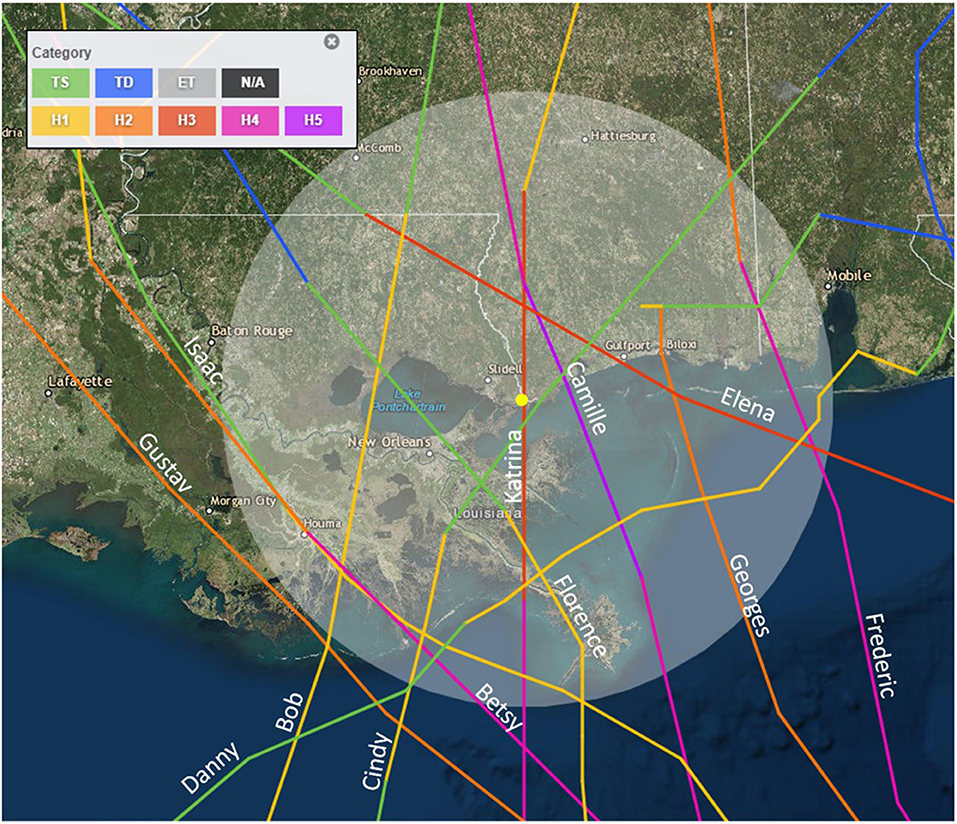
Figure 8. Tracks of all tropical cyclones passing within 150 km of the study site (yellow dot) since 1963 at hurricane strength (64 knots) or above.
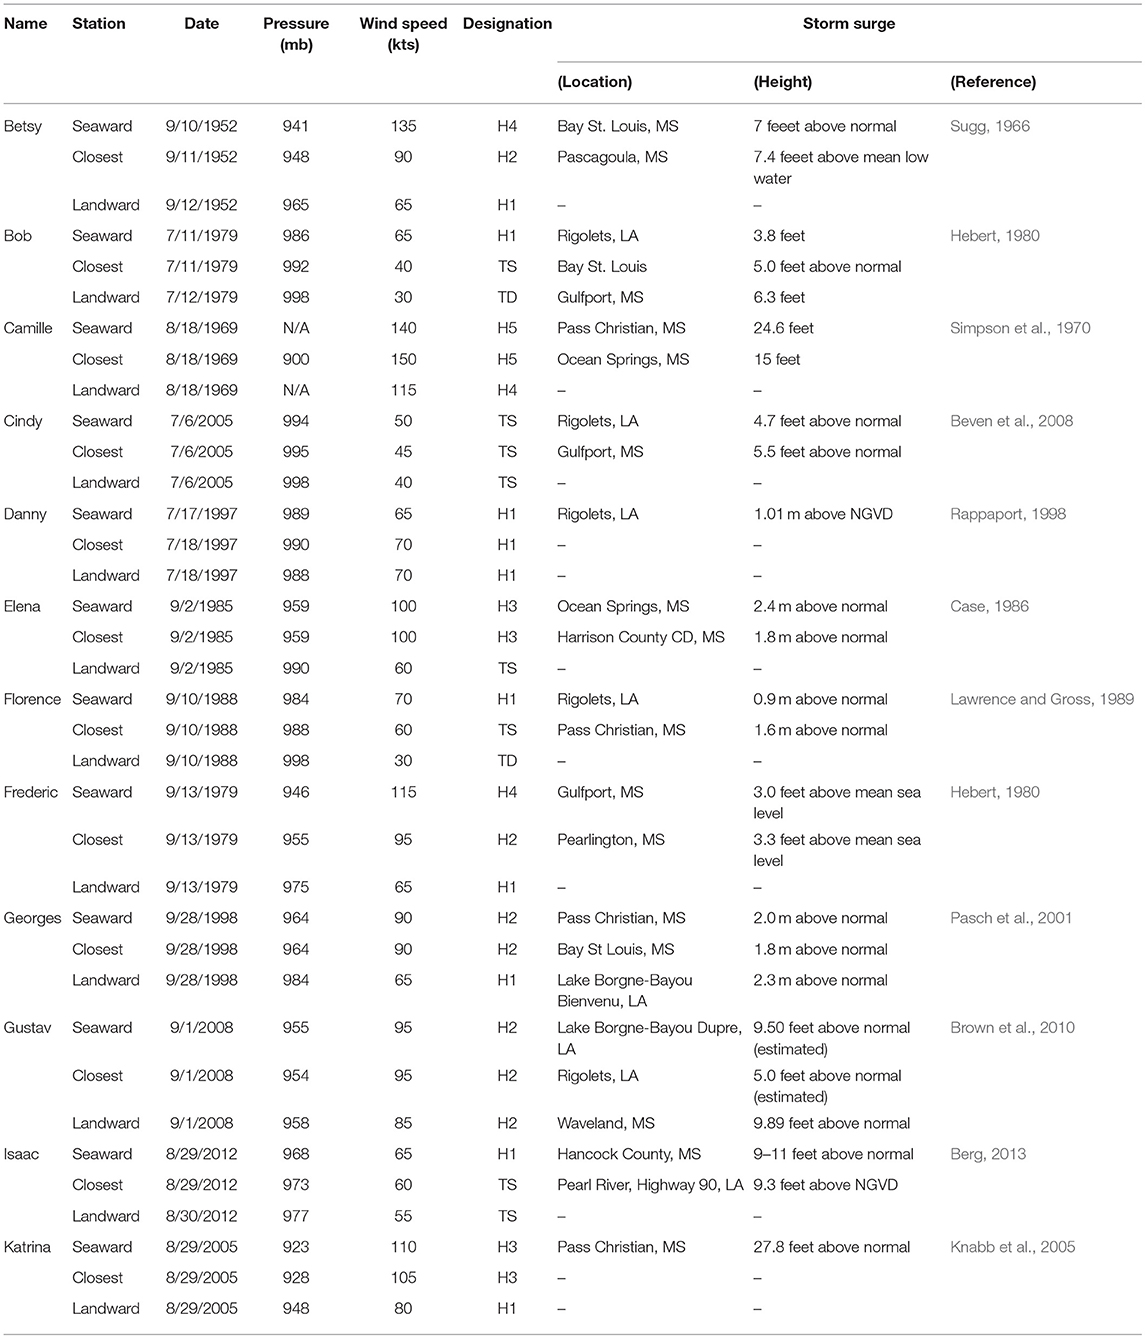
Table 3. Storm data for tropical cyclones passing within 150 km of the study site after hurricane strength or above since 1963.
Storm surges recorded along the LA-MS coast for these 12 cyclones can be divided into three groups; Low (Bob, Cindy, Danny, Florence, Frederic, and Georges, with listed maximum surge heights < 6 feet), Medium (Betsy, Elena, Gustav and Isaac, with heights of 7–12 feet), and High (Camille and Katrina, with heights >24 feet). However, large differences in surge heights can occur over short distances. Track location is a very important factor, as the cyclonic nature of hurricanes, tend to drive water in the direction of forward movement in their right front quadrant, and in the opposite direction in the left front quadrant. At Pearl River, this means that for north-moving storms, surge heights will be greater for storms passing to the west than to the east. So, although Hurricane Camille and Hurricane Katrina both recorded storm surges >24 feet at Pass Christian, MS, SLOSH indicates that storm surge heights at the mouth of the Pearl River were ~8-10 feet for Camille which passed to the east and ~ 20 feet for Katrina which passed to the west (Figure S3). As a result, at our location Hurricane Katrina's storm was by far the largest since 1963. Additionally, Katrina's large extent and duration as a category 5 storm produced large swells for an extended period of time, including the largest significant wave height (55 feet) ever measured up to that time by a National Data Buoy Center buoy (Knabb et al., 2005). It seems likely, therefore, that Hurricane Katrina should have left the largest post-1963 sedimentary signature, and is the event most likely to have generated the clastic layer at 10–15 cm in PR102D.
Radiochemical Chronology
That Hurricane Katrina is the causative agent of this clastic layer is supported by the radiochemistry data. Although the maximum 137Cs activity at 37.5 cm falls within the low end of the range of observed maximum activity documented by Milan et al. (1995), the depth-integrated (0–38 cm) inventory of PR102D (~1090 Bq/km2) is higher than the post-1963 inventory range observed by Milan et al. (1995) (inventory of 1330–1520 Bq/km2 in ~1995 or equivalently 850–960 Bq/km2 in 2015). Restricting 137Cs integration to 20–38 cm (i.e., below the clastic layer) in PR102D provides an inventory (940 Bq/km2), much closer to those observed across coastal Louisiana. These observations support our previous assumption that the peak activity at a mid-point depth of 37.5 cm is conservatively the 1963 peak, and that the inventory below the clastic unit is comparable to regional inventory pre-dating ~1995, indicating that the sediments starting at the bottom of the clastic layer were deposited by 1995 at the earliest, and that the inventory added to the top of the core (0–20 cm) was reworked sediment deposited since that time.
Using dates of 1963 for 37.5 cm and 1995 for 20 cm yields yields a vertical accretion rate of 0.54 ± 0.02 cm/year for the interval. However, this is noticeably higher than the 210Pbxs-calculated accumulated rate (log-linear fit with r2 of 0.989 for depth and 0.968 for mass-depth) for the same interval, which produces a vertical accretion rate of 0.41 cm/year, or 2.43 year/cm. Applying this accumulation rate to the material accumulated starting at 37.5 cm (2.44 year/cm × 17.5 cm) indicates 42.6 years of accumulation at cm 20, or the year 2005 (1963 + 42 year). Therefore, we can confidently say that the placement of the clastic layer at and above 20 cm in the core post-dates 1995 based on independent measurements in a nearby region, and that internally the closest match would have occurred circa 2005. This, of course, is the year in which Katrina passed over the marsh.
Sedimentary Correlations
Attributing the clastic layer to Hurricane Katrina is further supported by comparison with sedimentary parameters documented in previously published studies. Both Reese et al. (2008) and McKee and Cherry (2009) collected event layer material from the Pearl River marsh within months of the passage of Katrina, Yeager et al. (2012) extracted cores from the marsh in 2008, and Bera et al. (2018) collected cores from St Louis Bay, ~25 km to the east, in 2010–2011. Reese et al. (2008) identified the Katrina layer on the basis of clastic content and grain size, classifying the Katrina layer as a silty or medium loam, dominated by silts and fine-grained sands, generally with an organic content of ~10% or less, marking the most distinctive dip in the LOI curve within the core. All of these characteristics closely match those occurring in the PR102D clastic layer. Both McKee and Cherry (2009) and Bera et al. (2018) identified the Katrina sediments on the basis of elevated sand content, increased grain size, heavier bulk density, and reduced levels of organic carbon, again matching the characteristics of the PR102D clastic layer. Yeager et al. (2012) identified the Katrina layer based on reduced organic content. Significantly, the 210Pb profiles of a St Louis Bay core (Bera et al., 2018), and core PR102D are remarkably similar, both marked by unexpectedly low values in their respective event layers, below which the values increase to the levels occurring above the event layer, before decreasing in the expected manner (Figure S4).
Due to these previous identifications of the Katrina layer as a readily-recognizable stratigraphic unit, the sedimentary and radioisotope match with the published data and our radiochemical chronology, we feel fully justified in identifying the clastic layer in PR102D, and by stratigraphic inference, the corresponding layers in the other five PR short cores, as having been deposited by Hurricane Katrina.
Published work indicates that organic material was deposited above the event layer, beginning almost immediately post-storm, and continuing thereafter. Reese et al. (2008) found that the Katrina layer was overlaid by a 1–2 cm thick organic clay layer, which they attributed to post-event settling. McKee and Cherry (2009) studied the accumulation of overlying organic marsh material throughout the following year(s), while, Bera et al. (2018) describe a 4 cm organic layer above the Katrina layer from their marsh core.
The possibility exists that Hurricanes Gustav and Isaac, the two hurricanes that generated medium-sized storm surges, and occurring post-Katrina in 2008 and 2012, respectively, contributed material to the event layer. However, the description of a capping organic layer, already 1–2 cm thick a few months after the passage of Katrina (Reese et al., 2008), and the continued organic accretion, documented by both Bera et al. and McKee and Cherry, appears to eliminate this possibility, as no organic intervals occur within the event layer. Although erosion from either of the storms could have removed this material, this did not seem to have occurred in the St Louis Bay cores, recovered in 2010–2011, after the passage of Gustav in 2010. Additionally, the smooth bell-shaped curves exhibited by the sedimentary, geochemical and biogeochemical curves representing the event layer argue against the identification of the layer as a mixture of materials deposited by a series of storms. Excursions in the biogeochemical curves, similar to, but smaller than those occurring from 10 to 15 cm, occur at a depth of 5 cm (Figure 6), matched by dips in the LOI curves in the top ten cm in several cores (Figure 4)(core PR108D) may, in fact, represent these storms. Given the distance of PR102 inland (>6 km from the small front bay and >7.5 km from Lake Borgne), surges from those two storms were likely not capable of leaving significant sedimentary footprints at the site. The same is likely the case for Hurricane Ivan, a powerful storm that crossed the Alabama coast just beyond the 150 km radius in 2004, the year before Katrina, with a surge height measured at 3.4 feet at Waveland, MS (Stewart, 2004).
Erosion
Hurricanes, of course, often result in large-scale erosion of marshes (Reed, 1990; Van de Plassche et al., 2006; Howes et al., 2010). However, several lines of evidence suggest that erosion was minimal at our sites, especially PR102. Large unsprouted seeds and grass rhizomes were found just below the bottom of the Katrina layer (Figure S1) in several cores. As it seems likely that the smothering of such seeds and especially rhizomes only affected the near surface zone; seeds and rhizomes deeply buried in the soil should have either sprouted or rotted, suggesting that significant amounts of surface material was not removed. The relative paucity of organic material in the event sediments (8% in the center of the layer, which may include post-depositional root intrusion) (McKee and Cherry, 2009) suggests that little organic material was entrained in the storm surge, at least at this location, Additionally, as within the event layer itself, the smooth form of several of the analytic curves, especially the biogeochemical ones (Figure 6) beginning from ~20 cm to the bottom of the event layer suggest the completeness of the record (no sudden jumps in the curves). It is possible that the attenuation of wave energy due to the distance inland and the thick vegetation cover at the site (current conditions shown in Figure S5) prevented erosion of the surface sediments, with the main sedimentary effect at the site being burial.
Sediment Provenance
Elemental Concentration
Given the importance of the elevational effects of storm-deposited materials effects on the long-term viability of a marsh, it is important to determine the origin of the material. Along the northern Gulf of Mexico, storm-generation vertical accretion often results from the re-deposition of material eroded from the edges of the marsh (either ocean and/or river edges) onto the marsh surface (Goodbred, 1994; Goodbred and Hine, 1995; Barras, 2006; Törnqvist et al., 2007; Turner et al., 2007). In such cases vertical accretion results from landward translation and likely represents net loss.
We have applied PCA analysis to the elemental concentrations of core PR102D in order to elucidate the question of sediment provenance, with the biplot of the first two principle components (which together account for 81.3% of the variability) providing a means of examining the relationship between chemical composition of the sediments and core depth (Figure 8). Core PR102D can be divided into three stratigraphic units; the pre-storm organic material from 40 to 16 cm, the clastic Katrina layer from 15 to 10 cm, and the post-event organic layer from 9 cm to the surface. The drivers of the first component, which explains 59.8% of the variability, are high concentrations of Ti, K, Fe, Sr, and Ca (high scores) and Br (low scores). All samples from both the top and bottom organic units, having low component scores, cluster to the left on the biplot, while the high-score event samples lie to the right. High scores for the second component, which accounts for 21.5% of the variability, are associated with large concentrations of Cl and S, while low sores are associated with higher concentrations of Br and Ca. Because Cl and S are marine indicators, higher concentrations can be used to indicate increased marine influence (Goff et al., 2012; Liu et al., 2014; Bianchette et al., 2017; McCloskey et al., 2018a). Notably, there is a large movement in the direction of S and Cl at the interface between the underlying organics and the bottom of the event layer (from 17 to 15 cm). By the middle of the layer (11, 12 cm) the elemental concentrations (Figure 7) and PCA biplot (Figure 9) indicate large concentrations of Ti, K, Fe, Sr, and Ca and decreasing concentrations of S and Cl. The shift back to organics at the top of the event layer (from 10 to 9 cm) is marked by a movement toward Br and away from Ti, K, Fe, Sr, and Ca, nearly the reverse of the shift from organics to clastics at the bottom of the event layer. This strong near mirror-image shift in sample position on the biplot occurs across the transect (Figure S6). This not only highlights the anomalous, (allochthonous) nature of the clastic layer, but the movements along the Cl and S vectors at the initiation of deposition strongly suggests a marine source. This is further supported by the event layer's low Br/Cl ratio (Figure 7), which estimates the relative strength of fresh and marine input, (lower values corresponding to increased marine influence) (Liu et al., 2014; McCloskey et al., 2018a).
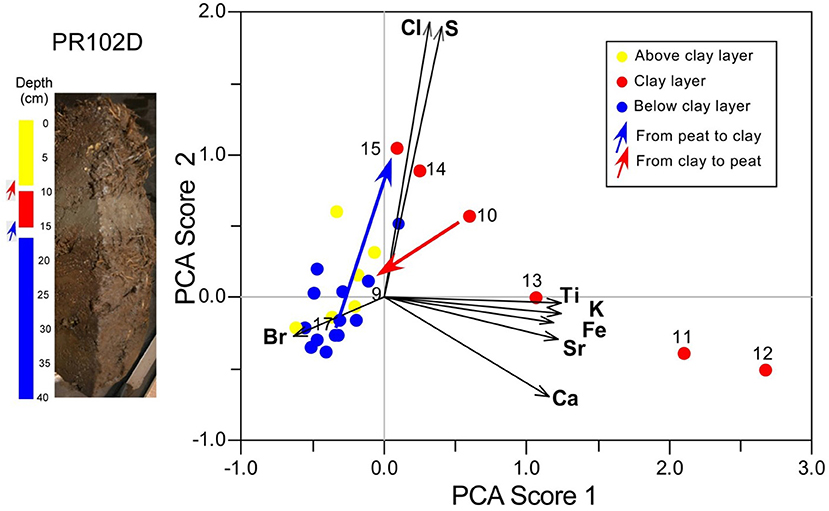
Figure 9. PCA biplot of concentrations of selected elements for core PR102D. Samples from the light brown clastic interval (red dots) plot apart from the organic material that comprises underlying (blue dots) and overlying (yellow dots) material, due primarily to increased concentrations of Ti, K, Fe, Sr, Ca, Cl, and S, and decreased concentrations of Br. Arrows mark the vector movement at the bottom (blue) and top (red) of the clastic interval. Numbers indicate the depth of the median point of each sample.
Extending the analysis to include the surface sample data and additional cores provides information in regard to sediment provenance (Figure 10). The combined biplots (surface and core data) are nearly identical in terms of both the strength and direction of the defining vectors and the amount of explained variability (76.1, 75.6, and 70.4% respectively) for PR102D, PR108D, and PR112D. In all three cores, the first component sample scores are positively related to the concentrations of Co, Zn, Fe, Cr, Pb, V, Zr, Rb, Sr, Ca, and K and negatively related to the concentration of Br. Second component sample scores are positively related to the concentration of Mn and negatively related to the concentrations of and S and Cl. Samples from the organic sections of the cores cluster with the marsh samples in the second and third quadrants of the biplots, while the event layer samples group with the estuarine samples in the first and fourth quadrants. These patterns are evident across the transect, suggesting that the material deposited by Hurricane Katrina more closely resembles material from the river bed/estuarine bottom than from the marsh surface. Subtler affinities can also be noted. The first component scores for the bottom samples collected in the open water of Lake Borgne (PR08, PR09) (Figure 10) are much higher than the event layer samples scores, which plot closer to the riverbed samples. This suggests that the event material more closely resemble sediments from the river channel than from the open water. Second component scores are generally lower for the event layer samples than for even the open water estuarine samples. Because low values on this component are correlated with high S and Cl concentrations, this possibly marks the sediments as more saline than the Lake Borgne samples. Given that the salinity in the open Gulf of Mexico (~36 ppt) (http://www.ncddc.noaa.gov/website/DataAtlas/atlas.htm?plate=Salinity%20-%20Mean), is higher than at PR09 (17. 9 ppt), our farthest offshore sample, this suggests a possible association with offshore waters.
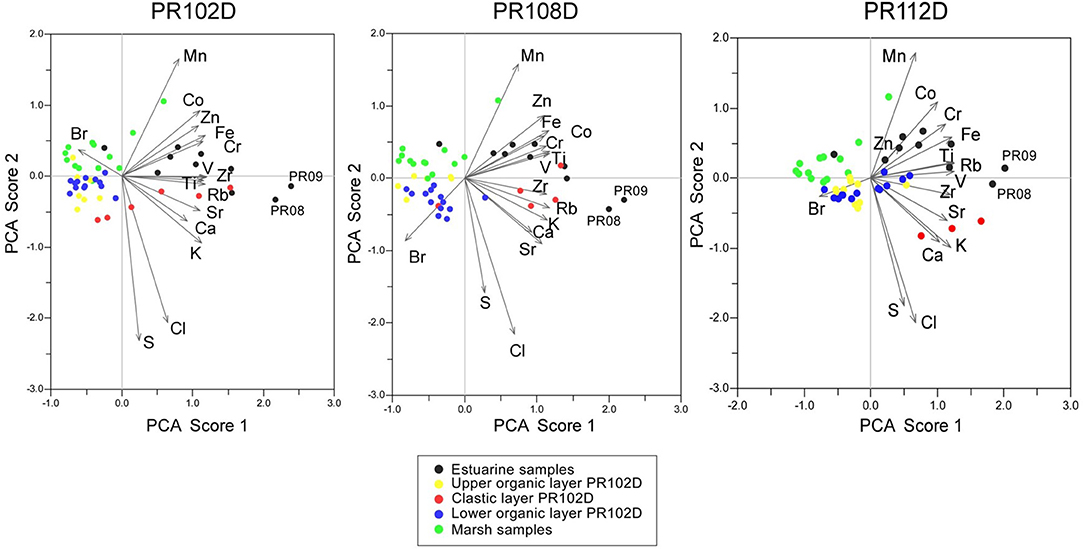
Figure 10. PCA of concentrations of selected elements. PCA biplots for surface samples and cores PR102D, PR108D and PR112D. Note the similarity in ordination space between (1) the elemental concentrations of samples from the clastic layer in cores (red dots) and the estuarine surface samples (black dots), and (2) samples from the organic layer in cores (yellow and blue dots) and the marsh surface samples (green dots). Data from the west-east marsh transect samples are included in the biplots.
The marsh and river/estuarine environments appear to have contrasting sources of sediments (Figures 2, 3). For the estuarine samples the concentrations of nearly all elements increase downstream, while TOC, TN and the TOC/TN ratio decrease, suggesting that the source of the inorganic estuarine material is offshore and the source of the organic material is terrestrial. The increase in downstream δ15N values for the estuarine samples likely results from remineralization as nitrogen moves up the food chain. For the marsh samples, elemental concentrations generally decrease downstream, suggesting a terrestrial source of inorganic sediments, likely delivered by fluvial flooding. The exception is Cl, likely derived from marine waters. The high TOC/TN observed throughout the marsh sites (12.2–24.7), especially downstream (15.9–24.7) favor a downstream transition from a C3-dominated environment to one with organic contributions from either C4 plants or phytoplankton (Cloern et al., 2002), in agreement with the general vegetation gradient observed in the field (decrease in freshwater woody plants and increase in salt-tolerant grasses). These results suggest that the estuarine and marsh sedimentation systems normally operate separately, with the marsh receiving little clastic input from marine sources under normal conditions.
The overlap between the TOC/TN, d13C, and d15N values for the marsh and estuarine samples, combined with their sometimes anti-phase spatial relationship, complicates the use of the biogeochemical data as a means of determining provenance. Although the TOC and TN values in the event samples closely resemble estuarine material (while varying markedly from the marsh samples), the δ13C, δ15N values and TOC/TN ratios are ambiguous. The PCA biplot of the surface sample and core data (Figure 11) suggests that the event layer samples, although loosely grouped with estuarine samples, likely contains marsh material as well. However, this organic material may result from the post-depositional intrusion of roots as plants recolonize the surface, with McKee and Cherry (2009) documenting 25 g/m2 of root accumulation in the storm layer.
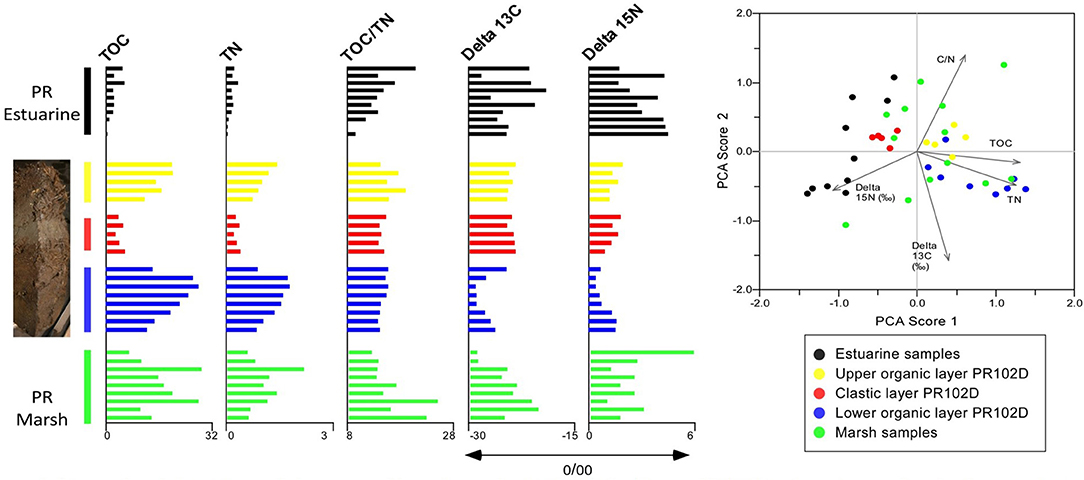
Figure 11. Biogeochemical (carbon and nitrogen) profiles and associated PCA biplots for core PR102D and surface samples. Surface sample data are arranged spatially, as in Figure 2. Similar TOC and TN values drive the grouping of the estuarine samples with the core clastic layer samples in quadrants 3 and 4, and the marsh samples with the samples from the organic intervals on the core in quadrants 1 and 2 on the PCA biplot. Data from the west-east marsh transect samples are included in the biplot.
We suggest that the sedimentary, biogeochemical and elemental evidence all indicate that the intermediate unit is allochthonous, composed of large-grained clastic sediments sourced from the river channels or the adjacent estuary.
Combining this information allows us to develop a rather detailed picture of both the deposited material itself and the associated depositional processes. The sediment itself is visually distinct. It is a gray sandy mud, with high concentrations of S, Cl, K, Ti, V, Cr, Mn, Fe, Co, Zn, Rb, Sr, and Zr, and low levels of Br heavier δ13C and δ15N isotopes, and lower TOC, TN, and TOC/TN ratios. The material, although primarily consisting of material resuspended from the nearshore estuarine bottom and/river channels includes low concentrations of marsh material, some of which may have been introduced post-depositionally. The transporting mechanism was the storm surge associated with Hurricane Katrina, possibly including an open marine water component.
Biogeochemical Effects of the Event Layer
As with the elemental and sedimentary data, core PR102D can be divided vertically into three distinct units based on the biogeochemical profiles (Figure 6). The upper and lower biogeochemical units are quite similar with respect to TOC and TN concentration. However, the δ13C signature is quite different in the top and bottom sections of the core, with the upper marsh resembling the intermediate clastic unit (Figure 6). Although microbial processing of the organic carbon during burial could explain the difference, the effect is thought to be small (Khan et al., 2015). The dissimilarity between the δ13C of the modern marsh and underlying marsh may result from mechanical and/or chemical causes. The TOC, TN, 210Pb, and 40K (probably representing clay concentration) profiles all show evidence of mixing (gradual secular change), perhaps indicating that the clastic deposit was originally thicker and that sediment has been vertically reworked, probably through bioturbation. Under this scenario, the heavier δ13C signature in the near-surface material merely reflects the vertical diffusion of the event layer material. Another possibility is that significant change in the biological assemblage occurred at this site, as occurred in Louisiana marshes following Hurricane Andrew (1992) (Guntenspergen et al., 1995). These changes could be driven either by the vagaries of vegetative recolonization, or as a result of altered edaphic conditions, as the mineral sediment likely increased soil aeration and the availability of essential nutrients. Whatever the cause of the altered isotopic signature, the marsh quickly re-established, and, as evidenced by increasing TOC and TN values, began to again accumulate organic matter, with the allochthonous material driving increased production, as occurred at the adjacent site where standing live biomass and the accretion rates both increased relative to pre-storm values (McKee and Cherry, 2009).
Accretion Rates
The depth of the Hurricane Katrina layer provides a means of directly determining the accretion that occurred in the 10 years between the passage of the storm (August 2005) and the extraction of the cores (September 2015). The top of the Katrina layer occurs at depths of 7, 9, 10, 10, 12, and 13 cm in the six cores, or an average of 10 cm, yielding an average accretion rate of ~1 cm/year, reduced to 0.8 to 0.9 cm/year if the overlying 1–2 cm thick organic clay layer, representing post-event settling (Reese et al., 2008) is attributed to the storm. If the Katrina layer itself is included, average accretion since 2005 is 1.4 cm/year, as the bottom of the layer occur at an average depth of 14 cm. The postmodern radiocarbon date (>1950 AD) at 75 cm from our long core PR102R yields a minimum accretion rate of 1.15 cm/year for the last 65 years, while the 137Cs profile for PR102D, which indicates that the oldest possible date at 37.5 cm is 1963, produces a minimum accretion rate of 0.71 cm/year. Accretion rates from a transect of cores extracted in 2008 within a few 100 m of PR102D are between 0.4 and 0.7 cm/year (Yeager et al., 2012). Together these rates narrowly bracket the accretion rates recorded from the five Coastwide Reference Monitoring System (CRMS) (Figure S7) stations situated in the Pearl River marsh (https://lacoast.gov/crms/), which range from 0.56 to 1.28 cm/year (Table S2).
Although these accumulation rates are above the rate of local relative sea level rise (0.47 cm/year at New Canal, La; and 0.41 cm/year at Bay Waveland, MS) (http://tidesandcurrents.noaa.gov/sltrends/sltrends.html), this does not insure that the Pearl River marsh will maintain its elevation above sea level. Accretion does not directly correspond to surface elevation increase, as subsidence can lower the platform upon which the marsh is accreting. As a result, even marshes with extremely high accretion rates can experience submergence under rapid subsidence (Nyman et al., 1993). Because CRMS station use a rod surface elevation table (RSET), driven to refusal in the underlying substrate (below the marsh sediments), to measure both surface elevation changes and accretion rates, shallow subsidence rates can be calculated. (See Figure S7, or Stagg et al., 2013 for detailed explanation of CRMS operational processes). These records show that all five Pearl River CRMS stations display positive surface elevation changes, with accretion rates surpassing subsidence rates (Table S2). Submerged vulnerability index (SVI) values are also calculated for each station. Index values, based on the relationship between surface elevation change, measured water level and sea level rise rates, project the vulnerability of submergence for each site. Values range from 0 to 100, representing the percentage of time each site will be above water level during the following five years. All of the Pearl River sites have high SVI values, indicating a high probability for the continued existence of the marsh.
The sustainability of the marsh at our site has been aided by the sediments deposited by Hurricane Katrina. Beyond the immediate benefit of increased surface elevation, the addition of such elements as Fe and Mn may aid plant growth over a longer period (Gambrell and Patrick, 1978; McKee and Cherry, 2009). If, as our evidence indicates, this material originated in the river/estuarine bottom, this represents a net gain at our site, as this material would otherwise never have entered the marsh platform. As a marsh as a whole, the overall net gain/loss depends on the balance between deposition and erosion, which we have not assessed, and which will, of course, vary between storms.
Recent Acceleration of Accretion Rates
This high potential for the long-term survival of the Pearl River marsh is driven by the high current accretion rates. However, we find that long-term sedimentation rates are as much as an order of magnitude lower than current accumulation rates. Sedimentation rates were calculated for both a published core (Li-1994) extracted ~600 m from PR102 by Li (1994), covering the period from ~200 to 6700 calendar year before present (BP) and the long core PR102R, with dated material extending to >5,000 BP. Plotting the PR102R data with the postmodern date of 1950 AD as the surface level, the chronologies for the two cores are nearly identical (Figure S8), indicating strong replicability/validity of the data. Sedimentation rates were calculated between each set of radiocarbon dates for both cores. These rates range from 0.06 to 0.25 cm/year, with an overall average of 0.11 cm/year for Li-1994, and from 0.9 to 0.11 cm/year, with an overall average of 0.10 cm/year for PR102R.
Several possible explanations for the large discrepancy between modern and long-term rates exist. Lithologic changes, reflecting significant changes in the depositional environment, can result in vastly different sedimentation rates. However this does not explain the high modern rates for these cores. Although the gross lithologic change from clay to peat occurs at ~ 450 cm in Li-1994, the sedimentation rate decreases immediately above that point„ with the core's lowest rate (0.06 cm/year) occurring in the organic section from ~1100 to 200 BP. The same clay to peat transition occurs ~ 215 cm depth in PR102R, with a rate of 0.10 cm/year between that point (median date 1,275 BP) and the postmodern sample.
Anthropogenic activities (deforestation, land clearing, urbanization, construction, etc.) can increase sediment delivery to downstream sites. However, the impact of these processes, although unquantified by us, are likely minor at our site as the Pearl River basin remains relatively undeveloped; 58% is forested and 12% is wetlands, with only 25% agricultural and 2% urban/suburban (Ward et al., 2005). Agricultural activity, through the release of fertilizer, can potentially increase productivity downstream, thereby leading to an uptick in organic accumulation rates. However, the δ15N profile suggests that this is not occurring here, as the δ15N value for the marsh sites, especially PR100, the most upstream site, and therefore the most likely to be affected by agricultural runoff, has δ15N values higher than those associated with commercial fertilizers, which typically fall within a narrow range around 0, with 80% measuring between −2 and 2‰ (Bateman and Kelly, 2007). However, the level and direction of fractionation by the macrophytes is unknown. In any event, the 33,000-acre Ross Barnett Reservoir upstream of the East/West River split has likely reduced both sediment and nutrient supply to the marsh since its construction in the 1960s (Cooper and Knight, 1985).
Growth faults (coast-parallel-extensional faults at continental margins), may have contributed to the increased rate by increasing accommodation space. But, not only has the growth fault adjacent to PR102D been active for at least the last 3,700 years, the recorded slip rates (0.1 cm/year over the last 1,300 years, and 0.02 cm/year over the last 3,700 years) (Yeager et al., 2012) are too low to significantly drive the acceleration of the accretion rate. Autocompaction, the reduction in sediment volume resulting from the weight of the overlying material, is another possible explanation for the low sedimentation rates in the lower sections of the cores. This also seems insufficient to explain the rate changes, as autocompaction rates are generally on the order of ~0.01–0.06 cm/year (Horton and Shennan, 2009; Brain et al., 2012), with higher rates occurring where thick clastic layers compress the underlying peat (Törnqvist et al., 2008), which is the reverse of the Pearl River stratigraphy. Applying the correction for autocompaction (following the procedures of Bird et al., 2004), to PR102R only increases the overall accretion rate from 0.10 to 0.13. Due to the lack of detailed lithologic information we were not able to perform autocompaction corrections for Li-1994.
These mitigating processes, even combined, are insufficient to explain the large modern jump in accretion rates, which has likely occurred fairly recently. Both our study and that by Yeager et al. (2012), found that accretion rates were higher when calculated from the ~50 year 137Cs chronology than when calculated from the ~100 year 210Pb chronology, perhaps indicating rate accelerating within very recent times. For PR102R, there has been a notable increase in accretion rates during the last century with rates of 0.1 to 0.13 cm/year for the period 1,275 BP to early/mid Twentieth century, 0.41 to 0.71 cm/year for mid to late Twentieth century, and > 1 cm/y since roughly the start of the Twenty-First century.
The geologic framework of the Pearl River valley offers a possible explanation for the recent increase in accretion rates. This hypothesis is based on the idea that rising sea levels, combined with high riverine discharge, have increased hydroperiods across the marsh, resulting in lusher vegetation (Nyman et al., 2006), increased biomass and rapid organic deposition. Elevated sea levels have driven increased marine flooding across the marsh, with, due to the lateral topographic constraints and the large hydrological head, no decrease in freshwater flooding from the Pearl River. This bimodal inundation increases marsh accretion in a number of ways. Inorganic deposition is increased due to delivery of mineral sediments from both the up- and down-stream sources, while flocculation spikes as a result of the increased mixing of fresh and marine waters. Plant growth is encouraged by increased hydroperiods, with the fluvial input eliminating/reducing hypersaline conditions.
This hydrological framework is especially important as it relates to the effects of large storms. Studies (Stagg and Mendelssohn, 2010, 2011; Walters and Kirwan, 2016) have shown that thick clastic deposition can negatively affect marsh vegetative growth by reducing hydroperiods. While this is an important control on accretion in marshes located along the open coast, it is irrelevant in incised river valleys such as Pearl River. Fluvial input, and therefore, sufficient soil moisture, will continue in such locations despite large increases in marsh surface elevations, due to the hydrologic head associated with continental watersheds. In such areas, unlike fringing marshes with little or no fluvial input, vertical accretion resulting from the reestablishment, growth and deposition of organic material can continue unabated even after the deposition of thick storm layers. A diagram depicting this process is displayed in Figure 12.
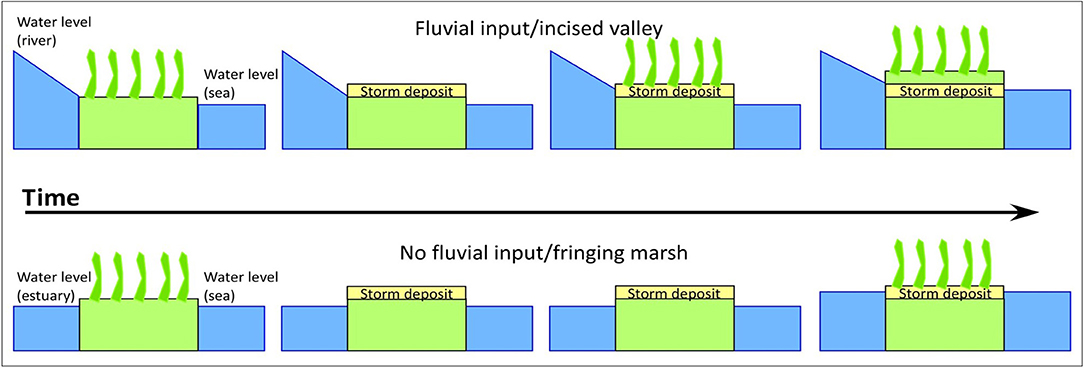
Figure 12. Cartoon of theoretical control exerted by geologic framework over marsh accretion. The bottom displays the potential effect of excessive hurricane-generated overwash deposits on marsh growth in locations lacking fluvial input (Stagg and Mendelssohn, 2010, 2011; Walters and Kirwan, 2016). In this scenario the increase in platform elevation reduces the hydroperiod enough to prohibit the recovery and regrowth of marsh vegetation. The location remains barren until sea level rises sufficiently to increase hydroperiods beyond the minimum threshold. This process is irrelevant in incised river valleys where fluvial systems with large hydraulic heads can continue to inundate the marsh platform despite thick hurricane-generated overwash deposits (top).
It is likely that similar conditions exist within the numerous incised river valleys intersecting the northern Gulf of Mexico. These sedimentological and hydrological parameters, which differ significantly from those occurring in the more commonly studied fringing coastal marshes, likely result in a unique set of responses to sea level rise. This emphasizes the need to better understand the processes controlling marsh development for such environments and further refine sea-level acceleration thresholds that can result in baywide backstepping (e.g., Rodriguez et al., 2010; Simms and Rodriguez, 2014, 2015).
Author Contributions
TM, CS, and KL designed the project. TM and PN conducted the fieldwork. TM conducted the majority of the laboratory work and wrote the first draft of the manuscript, with major input from CS. All authors contributed to the analysis and synthesis of the data and the development of the conceptual framework and conclusions.
Funding
This project was supported by the United States Geological Survey's St Petersburg Coastal and Marine Science Center and the Mendenhall Fellowship program.
Disclaimer
Any use of trade, firm, or product names is for descriptive purposes only and does not imply endorsement by the U.S. Government.
Conflict of Interest Statement
The authors declare that the research was conducted in the absence of any commercial or financial relationships that could be construed as a potential conflict of interest.
Acknowledgments
The authors would like to thank the staff at Louisiana Department of Wildlife and Fisheries and the Pearl River Wildlife Management Area for their assistance in this project. We would also like to thank Elsie McBride, Shelby Stoneburner, Ashlyann Morales, Marci Marot, Max Tuten, Catherine Wheaton, and Alysha Ellis for their work in the field and/or the lab. The comments of three reviewers greatly improved the quality of the article.
Supplementary Material
The Supplementary Material for this article can be found online at: https://www.frontiersin.org/articles/10.3389/fevo.2018.00179/full#supplementary-material
References
Allison, M. A., Demas, C. R., Ebersole, B. A., Kleiss, B. A., Little, C. D., Meselhe, E. A., et al. (2012). A water and sediment budget for the lower Mississippi–Atchafalaya River in flood years 2008–2010: implications for sediment discharge to the oceans and coastal restoration in Louisiana. J. Hydrol. 432–433, 84–97. doi: 10.1016/j.jhydrol.2012.02.020
Allison, M. A., and Meselhe, E. A. (2010). The use of large water and sediment diversions in the lower Mississippi River (Louisiana) for coastal restoration. J. Hydrol. 3–4, 346–360. doi: 10.1016/j.jhydrol.2010.04.001
Anderson, J. B., Wallace, D. J., Simms, A., and Rodriguez, A. B. (2016). Recycling sediments between source and sink during a eustatic cycle: systems of late Quaternary northwestern Gulf of Mexico Basin. Ear. Sci. Rev. 153, 111–138. doi: 10.1016/j.earscirev.2015.10.014
Appleby, P. G. (2001). “Chronostratigraphic techniques in recent sediments,” in Tracking Environmental Change Using Lake Sediments, eds W. M. Last and J. P. Smol (Dordrecht: Springer), 171–203. doi: 10.1007/0-306-47669-x_9.
Barras, J. A. (2006). Land area changes in coastal Louisiana after the 2005 Hurricanes: a series of three maps. U.S. Geologic Survey Open-File Report 06–1274. doi: 10.3133/ofr20061274
Bateman, A. S., and Kelly, S. D. (2007). Fertilizer nitrogen isotope signatures. Isot. Environ. Healt. S 43, 237–247. doi: 10.1080/10256010701550732
Bender, M. A., Knutson, T. R., Tuleya, R. E., Sirutis, J. J., Vecchi, G. A., Garner, S. T., et al. (2010). Modeled impact of anthropogenic warming on the frequency of intense Atlantic hurricanes. Science 327, 454–458. doi: 10.1126/science.1180568
Bera, G., Yeager, K. M., and Shiller, A. M. (2018). Whether hurricane Katrina impacted trace metal and dioxin depositional histories in marshes of St. Louis Bay, Mississippi. Sci. Total Environ. 624, 517–529. doi: 10.1016/j.scitotenv.2017.12.156
Berg, R. (2013). Tropical Cyclone Report Hurricane Isaac (AL092012) 21 August - 1 September 2012. Available online at: https://www.nhc.noaa.gov/data/tcr/AL092012_Isaac.pdf
Beven, J. L., Avila, L. A., Blake, E. S., Brown, D. P., Franklin, J. L., Knabb, R. D., et al. (2008). Annual summary Atlantic hurricane season of 2005. Mon. Weather Rev. 136, 1109–1173. doi: 10.1175/2007MWR2074.1
Bianchette, T. A., McCloskey, T. A., and Liu, K.-B. (2017). A 7000-year history of coastal environmental changes from Mexico's Pacific coast: a multi-proxy record from Laguna Mitla, Guerrero. Holocene 27, 1214–1226. doi: 10.1177/0959683616687379
Binford, M. W. (1990). Calculation and uncertainty analysis of 210Pb dates for PIRLA project lake sediment cores. J. Paleolimnol. 3, 253–267, doi: 10.1007/bf00219461.
Bird, M. I., Fifield, L. K., Chua, S., and Goh, B. (2004). Calculating sediment compaction for radiocarbon dating of intertidal sediments. Radiocarbon 46, 421–435. doi: 10.1017/S0033822200039734
Blott, S. J., and Pye, K. (2001). GRADISTAT: a grain size distribution and statistics package for the analysis of unconsolidated sediments. Earth Surf. Proc. Land. 26, 1237–1248. doi: 10.1002/esp.261
Blum, M. D., and Roberts, H. D. (2009). Drowning of the Mississippi Delta due to insufficient sediment supply and global sea-level rise. Nat. Geosci. 2, 488–491. doi: 10.1038/NGEO553
Brain, M. J., Long, A. J., Woodroffe, S. A., Petley, D. N., Milledge, D. G., and Parnell, A. C. (2012). Modelling the effects of sediment compaction on saltmarsh reconstructions of recent sea-level rise. Earth Planet. Sci. Lett. 345–348, 180–193. doi: 10.1016/j.epsl.2012.06.045
Brand, N. W., and Brand, C. J. (2014). Performance comparison of portable XRF instruments. Geochem. Explor. Environ. Anal. 2014, 125–138. doi: 10.1144/geochem2012-172
Brown, D. P., Beven, J. L., Franklin, J. L., and Blake, E. S. (2010). Annual summary Atlantic hurricane season of 2008. Mon. Weather Rev. 138, 1975–2001. doi: 10.1175/2009MWR3174.1
Cai, H., Lam, N. S. N., Zou, L., and Qiang, Y. (2018). Modeling the dynamics of community resilience to coastal hazards using a Bayesian network. Ann. Am. Assoc. Geogr. 108, 1260–1279. doi: 10.1080/24694452.2017.1421896
Case, R. A. (1986). Annual summary Atlantic hurricane season of 1985. Mon. Weather Rev. 114, 1390–1405.
Cloern, J. E., Canuel, E. A., and Harris, D. (2002). Stable carbon and nitrogen isotope composition of aquatic and terrestrial plants of the San Francisco Bay estuarine system. Limol. Oceanogr. 47, 713–729. doi: 10.4319/lo.2002.47.3.0713
Colten, C. E., Simms, J. R., Grismore, A. A., and Hemmerling, S. A. (2018). Social justice and mobility in coastal Louisiana, U.S.A. Reg. Environ. Change 18, 371–383. doi: 10.1007/s10113-017-1115-7
Cooper, C. M., and Knight, L. A. Jr. (1985). Macrobethos-sediment relationships in Ross Barnett reservoir, Mississippi. Hydrobiologia 126, 193–197. doi: 10.1007/BF00007496
Corbett, D. R., and Walsh, J. P. (2015). “210Lead and 137Cesium,” in Handbook of Sea-Level Research, eds I. Shennan, A. J. Long, and B. P. Horton (Hoboken, NJ: John Wiley and Sons, Ltd), 361–372. doi: 10.1002/9781118452547
Costanza, R., Mitsch, W. J., and Day, J. W. Jr. (2006). A new vision for New Orleans and the Mississippi delta: applying ecological economics and ecological engineering. Front. Ecol. Environ. 4, 465–472. doi: 10.1890/1540-9295(2006)4[465:ANVFNO]2.0.CO;2
Couvillion, B. R., Barras, J. A., Steyer, G. D., Sleavin, W., Fischer, M., Beck, H., et al. (2011). Land Area Change in Coastal Louisiana From 1932 to 2010: U.S. Geological Survey Scientific Investigations Map 3164, Scale 1:265,000. 12 p. Available online at: http://pubs.usgs.gov/sim/3164/downloads/SIM3164_Map.pdf.
CPRA (2007). Integrated Ecosystem Restoration and Hurricane Protection: Louisiana's Comprehensive Master Plan for a Sustainable Coast. Avaialable online at: http://sonriswww.dnr.state.la.us/dnrservices/redirectUrl.jsp?dID=4063376.
CPRA (2012). Louisiana's Comprehensive Master Plan for a Sustainable Coast. Aavailable online at: http://sonriswww.dnr.state.la.us/dnrservices/redirectUrl.jsp?dID=4379731.
CPRA (2013). Consistency With the 2012 Coastal Master Plan: Guidelines for Restoration Projects Receiving State Funding. Available online at: http://coastal.la.gov/wpcontent/uploads/2013/12/MPConsistencyGuidelines112013.pdf.
CPRA (2016). 2017 Coastal Master Plan Process. Available online at: http://coastal.la.gov/a-commonvision/2017-master-plan-update/.
Craft, C., Clough, J., Ehman, J., Joye, S., Park, R., Pennings, S., et al. (2009). Forecasting the effects of accelerated sea-level rise on tidal marsh ecosystem services. Front. Ecol. Environ. 7, 73–78. doi: 10.1890/070219
Cutshall, N. H., Larson, I. L., and Olson, C. R. (1983). Direct analysis of 210Pb in sediment samples: self-absorption corrections. Nucl. Inst. Methods 26, 309–312. doi: 10.1016/0167-5087(83)91273-5
Dalbom, C., Hemmerling, S., and Lewis, J. (2014). Community resettlement prospects in southeast Louisiana: a multidisciplinary exploration of legal, cultural, and demographic aspects of moving individuals and communities. White Paper Tulane Inst. Water Resour. Law Policy. 1–49. Available Online at: https://thewaterinstitute.org/assets/docs/publications/9_23_2014_Community-Resettlement-Prospects-in-Southeast-Louisiana.pdf
Das, O., Wang, Y., Donoghue, J., Xu, X., Coor, J., Elsner, J., et al. (2013). Reconstruction of paleostorms and paleoenvironment using geochemical proxies archived in the sediments of two coastal lakes in northwest Florida. Quaternary Sci. Rev. 68, 142–153. doi: 10.1016/j.quascirev.2013.02.014
Day, J. W. Jr., Boesch, D. F., Clairain, E. J., Kemp, G. P., Laska, S. B., Mitsch, W. J., et al. (2007). Restoration of the Mississippi Delta: lessons from Hurricanes Katrina and Rita. Science 315, 1679–1684. doi: 10.1126/science.1137030
Day, J. W. Jr., Kemp, G. P., Reed, D. J., Cahoon, D. R., Boumans, R. M., Suhayda, J. M., et al. (2011). Vegetation death and rapid loss of surface elevation in two contrasting Mississippi delta salt marshes: the role of sedimentation, autocompaction and sea-level rise. Ecol. Eng. 37, 229–240. doi: 10.1016/j.ecoleng.2010.11.021
Delaune, R. D., Patrick, W. H. Jr., and Buresh, R. J. (1978). Sedimentation rates determined by 137Cs dating in a rapidly accreting salt marsh. Nature 275, 532–533. doi: 10.1038/275532a0
Eleuterius, L. N., and Eleuterius, C. K. (1979). Tide levels and salt marsh zonation. Bull. Mar. Sci. 29, 394–400. doi:
Emanuel, K. A. (2013). Downscaling CMIP5 climate models shows increased tropical cyclone activity over the 21st century. Proc. Natl. Acad. Sci. U.S.A. 110, 12219–12224. doi: 10.1073/pnas.1301293110
Ferreira, P. A. de L., Figueira, R. C. L., Siegle, E., Neto, N. E. A., Martins, C. de, C., Schettini, C. A. F., et al. (2016). Using a cesium-137 (137Cs) sedimentary fallout record in the South Atlantic Ocean as a supporting tool for defining the Anthropocene. Anthropocene 14, 34–45. doi: 10.1016/j.ancene.2016.06.002
Folk, R. L. (1954). The distinction between grain size and mineral composition in sedimentary-rock nomenclature. J. Geol. 62, 344–359.
Frazier, D. E. (1974). Depositional Episodes: Their Relationship to the Quaternary Stratigraphic Framework in the Northwestern Portion of the Gulf Basin. Austin, TX: Texas Bureau of Economic Geology Circular 74–1. 28.
Gambrell, R. P., and Patrick, W. H. Jr. (1978). “Chemical and microbiological properties of anaerobic soils and sediments”, in Plant Life in Anaerobic Environments, eds D. D. Hook, and R. M. M. Crawford (Ann Arbor, MI: Ann Arbor Scientific Publishing, Inc.), 375–423.
Goff, J., Chagué-Goff, C., Nichols, S., Jaffe, B., and Dominey-Howes, D. (2012). Progress in paleotsunami research. Sediment. Geol. 243–244, 70–88. doi: 10.1016/j.sedgeo.2011.11.002
Goodbred, S. L. (1994). Geologic Controls on the Holocene Evolution of an Open-Marine Marsh System Fronting a Shallow-Water Embayment: Waccasassa Bay, West-Central Florida. Masters thesis. St. Petersburg, FL: University of South Florida.
Goodbred, S. L., and Hine, A. C. (1995). Coastal storm deposition: salt-marsh response to a severe extratropical storm, March 1993, west-central Florida. Geology 23, 679–682. doi: 10.1130/0091-7613(1995)023<0679:CSDSMR>2.3.CO;2
Green, A. C. (2000). The Distribution and Speciation of Mercury in the Pearl River Drainage Basin, Mississippi. Master's thesis. Tuscaloosa, AL: University of Alabama.
Greene, D. L. Jr. (2006). Seismic Stratigraphy and Late Quaternary Evolution of Mobile Bay and Mississippi Sound, Alabama-a Record of Large- and Small-Scale Pluvial Systems Through Multiple Sea-Level Cycles. dissertation. Tuscaloosa, AL: University of Alabama.
Guntenspergen, G. R., Cahoon, D. R., Grace, J., Steyer, G. D., Fournet, S., Townson, M. A., et al. (1995). Disturbance and recovery of the Louisiana coastal marsh landscape from the impacts of Hurricane Andrew. J. Coast. Res. SI 21, 324–339.
Hebert, P. J. (1980). Atlantic hurricane season of 1979. Mon. Weather Rev. 108, 973–990. doi: 10.1175/1520-0493(1980)108<0973:AHSO>2.0.CO;2
Holland, G., and Bruyere, C. L. (2014). Recent intense hurricane response to global climate change. Clim. Dynam. 42, 617–627. doi: 10.1007/s00382-013-1713-0
Horton, B. P., and Shennan, I. (2009). Compaction of Holocene strata and the implications for relative sea level change on the east coast of England. Geology 37, 1083–1086. doi: 10.1130/G30042A.1
Howes, N. C., FitzGerald, D. M., Hughes, Z. J., Georgiou, I. Y., Kulp, M. A., Miner, M. D., et al. (2010). Hurricane-induced failure of low salinity wetlands. Proc. Natl. Acad. Sci. U.S.A. 107, 14014–14019. doi: 10.1073/pnas.0914582107
Karimpour, A., Chen, Q., and Twilley, R. R. (2017). Wind wave behavior in fetch and depth limited estuaries. Sci. Rep. 7:40654. doi: 10.1038/srep40654
Kemp, G. P., Day, J. W., Rogers, J. D., Giosan, L., and Peyronnin, N. (2016). Enhancing mud supply from the Lower Missouri River to the Mississippi River Delta USA: dam bypassing and coastal restoration. Estuar. Coast. Shelf S. 183, 304–313. doi: 10.1016/j.ecss.2016.07.008
Khan, N. S., Vane, C. H., and Horton, B. P. (2015). “Stable carbon isotope andC/N geochemistry of coastal wetland sediments as a sea-level indicator,” in Handbook of Sea-Level Research, First Edn., eds I. Shennan, A. J. Long, and B. P. Horton (Hoboken, NJ: John Wiley and Sons), 295–311.
Kindinger, J. L., Balson, P. S., and Flocks, J. G. (1994). “Stratigraphy of the Mississippi-Alabama shelf and the Mobile river incised-Valley system,” in Incised-Valley Systems: Origin and Sedimentary Sequences, eds R. W. Dalrymple, R. Boyd, and B. A. Zaitlin (Tulsa, OK: Society for Sedimentary Geology Special Publication No. 51), 83–95.
Knabb, R. D., Rhome, J. R., and Brown, D. P. (2005). Tropical Cyclone Report Hurricane Katrina 23-30 August 2005. Available online at: www.nhc.noaa.gov/data/tcr/AL122005_Katrina.pdf
Lam, N. S., Reams, M., Li, K., Li, C., and Mata, L. (2016). Measuring community resilience to coastal hazards along the northern Gulf of Mexico. Nat. Hazards Rev. 17:04015013. doi: 10.1061/(ASCE)NH.1527-6996.0000193
Lambert, W. J., Aharon, P., and Rodriguez, A. B. (2008). Catastrophic hurricane history revealed by organic geochemical proxies in coastal lake sediments: a case study of Lake Shelby, Alabama (USA). J. Paleolimnol. 39, 117–131. doi: 10.1007/s10933-007-9101-6
Langlois, E., Bonis, A., and Bouzillé, J. B. (2001). The response of Puccinellia maritima to burial: a key to understanding its role in salt-marsh dynamics? J. Veg. Sci. 12, 289–297. doi: 10.2307/3236613
Lawrence, M. B., and Gross, J. M. (1989). Annual summaries Atlantic hurricane season of 1988. Mon. Weather Rev. 117, 2248–2259. doi: 10.1175/1520-0493(1989)117<2248:AHSO>2.0.CO;2
Leonardi, N., Ganju, N. K., and Fagherazzi, S. (2016). A linear relationship between wave power and erosion determines salt-marsh resilience to violent storms and hurricanes. Proc. Natl. Acad. Sci. U.S.A. 113, 64–68. doi: 10.1073/pnas.1510095112
Li, X. (1994). A 6200-Year Environmental History of the Pearl River Marsh, Louisiana. Dissertation. Baton Rouge, LA: Louisiana State University.
Liu, K.-B., and Fearn, M. L. (2000). Reconstruction of prehistoric landfall frequencies of catastrophic hurricanes in northwestern Florida from lake sediment records. Quaternary Res. 54, 238–245. doi: 10.1006/qres.2000.2166
Liu, K.-B., McCloskey, T. A., Maiti, K., and Ortego, S. (2014). “Sedimentary signature of Hurricane Isaac in a Taxodium swamp on the western margin of Lake Pontchartrain, Louisiana, USA,” in Sediment Dynamics From the Summit to the Sea, eds J. Xu, J., M. A. Allison, S. J. Bentley, A. L. Collins, W. D. Erskine, V. Golosov, A. J., Horowitz, and M. Stone (London: IAHS Publication 367), 421–428.
Marani, M., D'Alpaos, A., Lanzoni, S., and Santalucia, M. (2011). Understanding and predicting wave erosion of marsh edges. Geophys. Res. Lett. 38:L21401. doi: 10.1029/2011GL048995
McCloskey, T. A., Smith, C. G., Liu, K.-B., Haller, C., and Marot, M. (2018a). How could a freshwater swamp produce a XRF chemical signature characteristic of a saltmarsh? Earth Space Chem. 2, 9–20. doi: 10.1021/acsearthspacechem.7b00098
McCloskey, T. A., Smith, C. G., Liu, K.-B., Nelson, P., McBride, E., and Stoneburner, S. (2018b). Sedimentary Data from the Lower Pearl River, USGS Data Release. doi: 10.5066/P9Y2R3LV
McCurdy, D. E., Grarbarino, J. R., and Mullin, A.H. (2008). Interpreting and Reporting Radiological Water-Quality Data: U.S. Geological Survey Techniques and Methods. Reston, VA: U.S. Geological Survey. 33.
McKee, K. L., and Cherry, J. A. (2009). Hurricane Katrina sediment slowed elevation loss in subsiding brackish marshes of the Mississippi River Delta. Wetlands, 29, 2–15. doi: 10.1672/08-32.1
Milan, C. S., Swensonm, E. M., Turner, R. E., and Lee, J. M. (1995). Assessment of the 137 Cs method for estimating sediment accumulation rates: Louisiana salt marshes. J. Coastal. Res. 11, 296–307.
Morris, J. T., Barber, D. C., Callaway, J. C., Chambers, R., Hagen, S. C., Hopkinson, C. S., et al. (2016). Contributions of organic and inorganic matter to sediment volume and accretion in tidak wetlands at steady state. Earths Fut. 4, 110–121. doi: 10.1002/2015EF000334
Morris, J. T., Sundareshwar, P. V., Nietch, C. T., Kjerfve, B., and Cahoon, D. R. (2002). Responses of coastal wetlands to rising sea level. Ecology 83, 2869–2877. doi: 10.1890/0012-9658(2002)083[2869:ROCWTR]2.0.CO;2
Moser, S. C., Davidson, M. A., Kirshen, P., Mulvaney, P., Murley, J. F., Neumann, J. E., et al. (2014). “Ch. 25: coastal zone development and ecosystems. Climate change impacts in the United States: the third national climate assessment,” in U.S. Global Change Research Program, eds J. M. Melillo, T.C. Richmond, and G. W. Yohe (Washington, DC: U. S. Global Change Research Program), 79–618. doi: 10.7930/J0MS3QNW
Murakami, H., Wang, Y., Yoshimura, H., Mizuta, R., Sugi, M., Shindo, E., et al. (2012). Future changes in tropical cyclone activity projected by the new high-resolution MRI-AGCM. J. Climate 25, 3237–3260. doi: 10.1175/JCLI-D-11-00415.1
Nyman, J. A., DeLaune, R. D., Roberts, H. H., and Patrick, W. H. Jr. (1993). Relationship between vegetation and soil formation in a rapidly submerging coastal marsh. Mar. Ecol. Prog. Ser. 96, 269–279.
Nyman, J. A., Walters, R. J., DeLaune, R. D., and Patrick, W. H. Jr. (2006). Marsh vertical accretion via vegetative growth. Estuar. Coast. Shelf. S 69, 370–380. doi: 10.1016/j.ecss.2006.05.041
Osgood, D. T., Santos, M., and Zieman, J. (1995). Sediment physico-chemistry associated with natural marsh development on a storm-deposited sand flat. Mar. Ecol-Prog. Ser. 120, 271–283.
Otvos, E. G., and Giardino, M. J. (2004). Interlinked barrier chain and delta lobe development, northern Gulf of Mexico. Sediment. Geol. 169, 47–73. doi: 10.1016/j.sedgeo.2004.04.008
Pasch, R. J., Avila, L. A., and Guiney, J. L. (2001). Annual summary Atlantic hurricane season of 1998. Mon. Weather Rev. 129, 3085–3123. doi: 10.1175/1520-0493(2001)129<3085:AHSO>2.0.CO;2
Peterson, C. H., Able, K. W., DeJong, C. F., Piehler, M. F., Simenstad, C. A., and Zedler, J. B. (2008). Practical proxies for tidal marsh ecosystem services: application to injury and restoration. Adv. Mar. Biol. 54, 221–266. doi: 10.1016/S0065-2881(08)00004-7
Preston, T., Sojda, R. S., and Gleason, R. A. (2013). Sediment accretion rates and sediment composition in Prairie Pothole wetlands under varying land use practices, Montana, United States. J. Soil Water Conserv. 68, 199–211. doi: 10.2489/jswc.68.3.199
Rappaport, E. N. (1998). Atlantic season of 1997. Mon. Weather Rev. 127, 2012–2026. doi: 10.1175/1520-0493(1999)127<2012:AHSO>2.0.CO;2
Rasser, M. K., Fowler, N. L., and Dunton, K. H. (2013). Elevation and plant community distribution in a microtidal salt marsh of the Western Gulf of Mexico. Wetlands 33, 575. doi: 10.1007/s13157-013-0398-9
Reed, D. J. (1990). The impact of sea-level rise on coastal salt marshes. Prog. Phys. Geog. 14, 465–481. doi: 10.1177/030913339001400403
Reese, C. A., Strange, T. P., Lynch, W. D., and Liu, K.-B. (2008). Geologic evidence of Hurricane Katrina recovered from the Pearl River Marsh, MS/LA. J. Coast. Res. 24, 1601–1607. doi: 10.2112/07-0956.1
Reimer, P. J., Bard, E., Bayliss, A., Beck, J. W., Blackwell, P. G., Bronk Ramsey, C., et al. (2013). IntCal13 and MARINE13 radiocarbon age calibration curves 0-50000 years calBP. Radiocarbon 55, 1869–1887. doi: 10.2458/azu_js_rc.55.16947
Révész, K., Qi, H., and Coplen, T. B. (2012). “Chapter 5: determination of the δ15N and δ13C of total nitrogen and carbon in solids; RSIL lab code 1832,” in Methods of the Reston Stable Isotope Laboratory, eds K. Révész and T. B. Coplen (Reston, VA:USGS Press), Section C, Stable Isotope-ratio Methods Book 10. Available online at: https://pubs.usgs.gov/tm/2006/tm10c5
Rodgers, B. E., Kulp, M. A., and Miner, M. D. (2009). Late Holocene chronology, origin, and evolution of the St. Bernard Shoals, Northern Gulf of Mexico, USA. Geo Mar. Lett. 29, 379–394. doi: 10.1007/s00367-009-0162-6
Rodriguez, A. B., Simms, A. R., and Anderson, J. B. (2010). Bay-head deltas across the northern Gulf of Mexico back step in response to the 8.2 ka cooling event. Q. Sci. Rev. 29, 3983–3993. doi: 10.1016/j.quascirev.2010.10.004
Saucier, R. T. (1994). Geomorphology and Quaternary Geologic History of the Lower Mississippi Valley, Vol. 1. Vicksburg, MS: U.S. Army Engineer Waterways Experiment Station.
Simms, A. R., and Rodriguez, A. B. (2014). Where do coastlines stabilize following rapid retreat? Geophys. Res. Lett. 41, 1698–1703. doi: 10.1002/2013GL058984
Simms, A. R., and Rodriguez, A. B. (2015). The influence of valley morphology on the rates of bayhead delta progradation. J. Sediment. Res. 85, 38–44. doi: 10.2110/jsr.2015.02
Simms, J. (2018). “The vanishing Isle de Jean Charles: a resettlement at the community scale,” in Annual Meeting, Association of American Geographers (New Orleans, LA).
Simpson, R. H., and Sugg, A. L. Staff (1970). The Atlantic hurricane season of 1969. Mon. Weather Rev. 984, 293–306.
Smith, C. G., Osterman, L. E., and Poore, R. Z. (2013). An examination of historic inorganic sedimentation and organic matter accumulation in several marsh types within the Mobile Bay and Mobile-Tensaw River Delta region. J. Coast. Res. 63, 68–83. doi: 10.2112/SI63-007.1
Smith, J. E., Bentley, S. J., Snedden, G. A., and White, C. (2015). What role do hurricanes play in sediment delivery to subsiding river deltas? Sci. Rep. Nat. 5:17582. doi: 10.1038/srep17582
Stagg, C. L., and Mendelssohn, I. A. (2010). Restoring ecological function to a submerged salt marsh. Restor. Ecol. 18, 10–17. doi: 10.1111/j.1526-100X.2010.00718.x
Stagg, C. L., and Mendelssohn, I. A. (2011). Controls on resilience and stability in a sediment-subsidized salt marsh. Ecol. Appl. 21, 1731–1744. doi: 10.1890/09-2128.1
Stagg, C. L., Sharp, L. A., McGinnis, T. E., and Snedden, G. A. (2013). Submergence Vulnerability Index development and application to Coastwide Reference Monitoring System Sites and Coastal Wetlands Planning, Protection and Restoration Act projects. U. S. Geological Survey Open-File Report 2013–1163.
Stewart, S. R. (2004). Tropical Cyclone Report Hurricane Ivan 2-24 September 2004. Available online at: https://www.nhc.noaa.gov/data/tcr/AL092004_Ivan.pdf.
Stralberg, D., Brennan, M., Callaway, J. C., Wood, J. K., Schile, L. M., Jongsomjit, D., et al. (2011). Evaluating tidal marsh sustainability in the face of sea level rise: a hybrid modeling approach applied to San Francisco Bay. PLoS ONE 6:e27388. doi: 10.1371/journal.pone.0027388
Swarzenski, P. W. (2015). “210Pb Dating,” in Encyclopedia of Scientific Dating Methods, eds W. J. Rink, and J. W. Thompson (Dordrecht: Springer), 626–632. doi: 10.1007/978-94-007-6304-3_236.
Törnqvist, T. E., Paola, C., Parker, G., Liu, K-B, Mohrig, D., Holbrook, J. M., et al. (2007). Comment on “Wetland Sedimentation from Hurricanes Katrina and Rita”. Science 316, 201. doi: 10.1126/science.1136780
Törnqvist, T. E., Wallace, D. J., Storms, J. E. A., Wallinga, J., Van Dam, R. L., Blaauw, M., et al. (2008). Mississippi Delta subsidence primarily caused by compaction of Holocene strata. Nat. Geosci. 1, 173–176. doi: 10.1038/ngeo129
Turner, R. E., Baustian, J. J., Swenson, E. M., and Spicer, J. S. (2006). Wetland sedimentation from Hurricanes Katrina and Rita. Science 314, 449–452. doi: 10.1126/science.1129116
Turner, R. E., Baustian, J. J., Swenson, E. M., and Spicer, J. S. (2007). Response to comment on “Wetland Sedimentation from Hurricanes Katrina and Rita”. Science 316, 201. doi: 10.1126/science.1136869
Tweel, A. W., and Turner, R. E. (2012). Landscape-scale analysis of wetland sediment deposition from four tropical cyclone events. PLoS ONE 7:e50528. doi: 10.137/journal.pone.0050528
Tweel, A. W., and Turner, R. E. (2014). Contribution of tropical cyclones to the sediment budget for coastal wetlands in Louisiana, USA. Landsc. Ecol. 29, 1083–1094. doi: 10.1007/s10980-014-0047-6
Twilley, R. R., Bentley, S. J., Chen, Q., Edmonds, D. A., Hagen, S. C., Lam, N. S.-N., et al. (2016). Co-evolution of wetland landscapes, flooding, and human settlement in the Mississippi River Delta Plain. Sustain. Sci. 11, 711–731. doi: 10.1007/s11625-016-0374-4
Van de Plassche, O., Erken, G., van Vliet, F., Brandsa, J., van der Borg, K., and de Jong, A. F. M. (2006). Salt-marsh erosion associated with hurricane landfall in southern New England in the fifteenth and seventeenth centuries. Geology 34, 829–832. doi: 10.1130/G22598.1
Walling, D. E., and He, Q. (1999). Improved models for estimating soil erosion rates from Cesium-137 measurements. J. Environ. Qual. 28, 611–622. doi: 10.2134/jeq1999.00472425002800020027x
Walters, D. C., and Kirwan, M. L. (2016). Optimal hurricane overwash thickness for maximizing marsh resilience to sea level rise. Ecol. Evol. 6, 2948–2956. doi: 10.1002/ece3.2024
Ward, G. M., Harris, P. M., and Ward, A. K. (2005). “Gulf Coast rivers of the southeastern United States,” in Rivers of North America, eds A. C. Benke, and C. E. Cushing (Cambridge, MA: Academic Press), 125–178.
Yeager, K. M., Brunner, C. A., Kulp, M. A., Fischerd, D., Feagin, R. A., Schindler, K. J., et al. (2012). Significance of active growth faulting on marsh accretion processes in the lower Pearl River, Louisiana. Geomorphology 153–154, 127–143. doi: 10.1016/j.geomorph.2012.02.018
Young, I. R., and Verhagen, L. A. (1996). The growth of fetch limited waves in water of finite depth. Part 1. Total energy and peak frequency. Coast. Eng. 29, 47–78. doi: 10.1016/S0378-3839(96)00006-3
Young, K. E., Evans, C. A., Hodges, K. V., Bleacher, J. E., and Graff, T. G. (2016). A review of the handheld X-ray fluorescence spectrometer as a tool for field geologic investigations on earth and in planetary surface exploration. Appl. Geochem. 72, 77–87. doi: 10.1016/j.apgeochem.2016.07.003
Keywords: pearl river, hurricanes, bayhead delta, vertical accretion, isotopes, marsh sustainability, X-ray flourescene, incised river valleys
Citation: McCloskey TA, Smith CG, Liu K-B and Nelson PR (2018) The Effects of Tropical Cyclone-Generated Deposition on the Sustainability of the Pearl River Marsh, Louisiana: The Importance of the Geologic Framework. Front. Ecol. Evol. 6:179. doi: 10.3389/fevo.2018.00179
Received: 07 May 2018; Accepted: 19 October 2018;
Published: 20 November 2018.
Edited by:
Steven Bouillon, KU Leuven, BelgiumReviewed by:
Kelin Hu, The Water Institute of the Gulf, United StatesKevin Yeager, University of Kentucky, United States
Joe Baustian, The Nature Conservancy, Australia
Copyright © 2018 McCloskey, Smith, Liu and Nelson. This is an open-access article distributed under the terms of the Creative Commons Attribution License (CC BY). The use, distribution or reproduction in other forums is permitted, provided the original author(s) and the copyright owner(s) are credited and that the original publication in this journal is cited, in accordance with accepted academic practice. No use, distribution or reproduction is permitted which does not comply with these terms.
*Correspondence: Terrence A. McCloskey, dG1jY2xvc2tleUBVU0dTLmdvdg==