 Sergio Noce
 Luca Caporaso
 Monia Santini
- 1Impacts on Agriculture, Forests and Ecosystem Services, Centro Euro-Mediterraneo sui Cambiamenti Climatici, Lecce, Italy
- 2Department of Soil Science, Far East Federal University, Vladivostok, Russia
Forest ecosystems of the Russian Federation are expected to face high risks under environmental dynamics related to climate change. Analyzing the likely impacts of climate change on forest ecosystems is crucial in order to understand the potential adaptation of forests, to guide management strategies, as well as to preserve ecosystem services. With the aim to provide information on the possible modifications of geographic ranges, in the medium to long-term, for some Russian dominant forest species under climate change, we applied a Cascade Ensemble System (CES) approach. This consists of combining Ensemble Platform for Species Distribution Models (SDMs) to six bias-corrected Earth System Model (ESM) projections, driven in turn by two Representative Concentration Pathways (RCPs) proxies of greenhouse gas emission scenarios, in order to obtain area maps of the future suitability for forest species. The suitability information is then flagged with information about its “likelihood,” adopting the IPCC terminology based on a consensus among projections. Maps of aggregated changes were created in order to identify areas potentially more vulnerable to climate change. Results showed that possible impacts of climate change (either gain or loss) were diversified across species with a pronounced Northward shift of the ranges. Further analyses were performed at sub-regional levels revealing the potential for the Arctic Circle to become a refuge area for some conifer species. Species-aggregated change analyses spotted two distinct areas as more vulnerable to habitat change, in the central and south-east portions of the Russian territory. Our findings represent useful and immediate biogeographical information available to Russian policy makers to delineate conservation strategies and forest management plans.
1. Introduction
The concept of biogeography, which studies the distribution of species and ecosystems in a geographic space, plays a fundamental role when analyzing feedback between climate change and forests (Dale et al., 2001; Bonan, 2008; Allen et al., 2010). First, forest ecosystems have different carbon sequestration/stock performances in function of the species and/or the climate zone considered; consequently, forests influence the terrestrial carbon budget and the climate mitigation potential in multiple ways (Piovesan and Adams, 2000; Valentini et al., 2000; Houghton, 2005; Schaphoff et al., 2006; Jones et al., 2014). Besides these biogeochemical impacts of forests on the climate, biophysical effects also differ according to the ecological zone (boreal, temperate, tropical) considered, due to the dominance of albedo, evapotranspiration or the roughness processes (Perugini et al., 2017). Thus, understanding and projecting the impacts of climate change on forest ecosystems, in terms of either spatial range or productivity, become crucial in order to guide adaptation strategies and plans, e.g., to increase resilience and to maintain ecosystem services of forests (Millar et al., 2007). As Yalcin and Leroux (2017) clearly states, successful approaches to conserve biodiversity should consider where species were in the past, where they are at present, and mainly where they will be in the future.
Even if forest ecosystems are able to evolve their resilience and adaptation capacity under both long-term changes and short-term disturbances (Thompson et al., 2009; Trumbore et al., 2015), the feedback between climate change and forests is increasingly complex and accelerating in almost all regions of the world, so that the impact of climate change is occurring much faster than the natural adaptation of forests (Loarie et al., 2009; Gauthier et al., 2015). The impact of climate change on forest ecosystems is expected to be important, especially at the Northernmost latitudes (IPCC, 2013; Knutti and Sedláček, 2013; Xu et al., 2013), where a considerable forest loss was recently registered, mainly due to climate-related hazards such as fires, pests and windstorms (Hansen et al., 2013; Gauthier et al., 2015).
In this context, the forest ecosystems of the Russian Federation (or simply Russia hereafter) raise particular interest. The estimated forested surface in Russia ranges from 556 to 910 million hectares Schepaschenko et al., 2015 (815 Mha in 2015 according to the latest Forest Resource Assessment by FAO (2016)). Similar to Canada and Brazil, Russia contains areas of about 64% of the world's occupied and intact forests (Potapov et al., 2008). In 2015, the surface of primary forests was 273 million ha (33.5% of total) with an annual increase of 0.5% along the 1990/2015 period (FAO, 2016). Some authors (Dolman et al., 2012; Schaphoff et al., 2016) state that about half of the estimated terrestrial global carbon sink is located in Russian forests for a total of 20–25% of the world's stock of growing timber (FAO, 2012; Komkov, 2014; Pogosov, 2015; Ivanter, 2016). Moreover, together with Canada and Fennoscandia, Russia hosts 90% of the world's carbon sink in boreal forests (FAO, 2012). Nevertheless, the opportunities provided by the forestry sector are currently underestimated by national economic and environmental policy, and the colossal forest potential of the country is essentially under-utilized (FAO, 2012). For example, although a round-wood production of around 175 million cubic meters was reached in 2010 (ranking second after United States) (FAO, 2016), the share in the world's forest product trade is below 4% and even less in terms of Gross Domestic Product (GDP), industrial production and employment (FAO, 2012).
According to Huston (1994) and Tikhonova et al. (2017), Russian forests have generally been shaped by a combination of abiotic, biotic and anthropic factors, and the present-day latitudinal gradient of tree species composition is determined primarily by climate (Sykes et al., 1996; Körner et al., 2016). Therefore, any decision aiming at appropriate forest management must consider those trends in climate change and variability is expected to modify the region's vegetation mosaic (Kicklighter et al., 2014). Analyses of future climate simulations in Feng et al. (2014) and Santini and di Paola (2015) show that changes in major climate types would be particularly evident over high-latitudes (North of the 50°N), e.g., with transitions from polar to sub-polar climate, or from sub-polar to temperate climate.
Climate modifications are expected to alter ecosystem metabolism and lead to a redistribution of vegetation across Northern Eurasia throughout the twenty-first century, with further changes in the occurrence of fires and other disturbances such as pests (Gauthier et al., 2015). In particular, the boreal forests of the Russian Federation are projected to face the highest risk of severe ecosystem changes (Warszawski et al., 2013), with Siberian vegetation habitat markedly perturbed by 2080 (Tchebakova et al., 2010a).
In this evolving context, Species Distribution Models (SDMs) are valuable tools to explore relationships and the hypothetical equilibrium between the climate and the geographical (spatial range of) species distribution, considering a set of environmental and territorial predictors (either strictly bioclimatic factors or other topographic, soil, and accessibility attributes) (Guisan and Zimmermann, 2000; Naimi and Araújo, 2016). Despite their known limitations, due to unavoidable assumptions and uncertainties (Lexer and Hönninger, 2004; Guisan and Thuiller, 2005; Hijmans and Graham, 2006; Gavin et al., 2014; Watling et al., 2015; Hannemann et al., 2016; Anderson, 2017; Noce et al., 2017; Faurby and Araújo, 2018), if interpreted with caution SDMs remain a powerful tool to project possible modifications (expansion, reduction, shift) in species spatial ranges at global, regional, and local levels (Franklin, 2013; Tchebakova et al., 2016). SDMs should, in fact, “…be viewed as first approximations that indicate the potential magnitude and broad pattern of future impacts, rather than as accurate simulations of future species distributions" (Pearson and Dawson, 2003).
Recently, such biogeographical modeling was applied under the ensemble forecasting approach, i.e., addressing the variability not only across multiple SDMs (Araújo and Luoto, 2007) but also across future climate projections, to study likely climate-driven modifications of vegetation spatial ranges in Europe (Innangi et al., 2015; Marchi et al., 2016; Dyderski et al., 2017; Noce et al., 2017), North America (Clark et al., 2014; Scherrer et al., 2017), and Siberia (Tchebakova et al., 2009, 2011; Tchebakova and Parfenova, 2012; Shuman et al., 2015). However, to our knowledge, neither the assessments nor projections were conducted for the whole of Russia, covering most of its forest heritage. In this work, a set of SDMs was applied, forced by the latest generation of climate projections, to simulate how the combination of bioclimatic and territorial predictors in the future would influence the composition, in terms of both regional arrangement and local diversity, of the dominant tree species representing 98% of the Russian forest resources (FAO, 2012). The Cascade Ensemble System (CES) approach, previously formulated in Noce et al. (2017) for Southern Europe, was adapted and applied over Russia to take into account the variability in the species distribution projections, related both to the spread of future climate outlooks generated by global models (Goberville et al., 2015) and to the varying complexity of the SDMs used to reproduce the relationships between predictors and forest occurrence.
Projections are produced for two-time horizons (on the medium- and long-term future) and under two greenhouse gas emission scenarios (intermediate and highly pessimistic). From this ensemble, the adoption of the “likelihood” terminology formulated by the Intergovernmental Panel on Climate Change (IPCC) (Mastrandrea et al., 2011) allows to easily treat the compound variability across projections (i.e., due to both SDMs and climate simulations) and to efficiently communicate it to the main actors of the forest sector, such as stakeholders and policy makers at various spatial levels.
First, the likelihood of the expected distribution for each dominant forest was mapped across the whole Russian Federation. Second, different sub-regions defined by latitude and longitude boundaries were considered. Third, since several studies suggest that future warming could promote forest expansion along the Arctic Circle (Devi et al., 2008; MacDonald et al., 2008; Berner et al., 2013), the potential of this region to act as refuge area for some forest species under future climate change pressures was also investigated. Finally, results were elaborated to examine the statistical significance of changes in terms of regional and local composition of dominant forest species.
2. Materials and Methods
2.1. Study Area
The study area (Figure 1) covers the whole Russian territory for a total surface of 17.1 Mkm2, extending for 41° latitude (from 40 to 81°N) and 171° longitude (from 19°E to −169°W). According to the Köppen-Geiger climate classification (Kottek et al., 2006; Peel et al., 2007; Santini and di Paola, 2015), most of the national surface is characterized by a cold (snow) climate, with humidity all year-round (74%) or just in one season (2%). The snow climate, with dry winters and the polar tundra zone, each occupy around 11–12% of the territory, while the temperate and arid climates reach just 1%. According to the FAOSTAT database (FAO, 2018), the forests in Russia extend over almost 50% of the national territory, against a coverage of agricultural lands of around 13%. Still, according to FAOSTAT, a very small amount of forests are planted (2.5%) while the majority are primary and naturally regenerated forests covering around one third and two thirds, respectively.
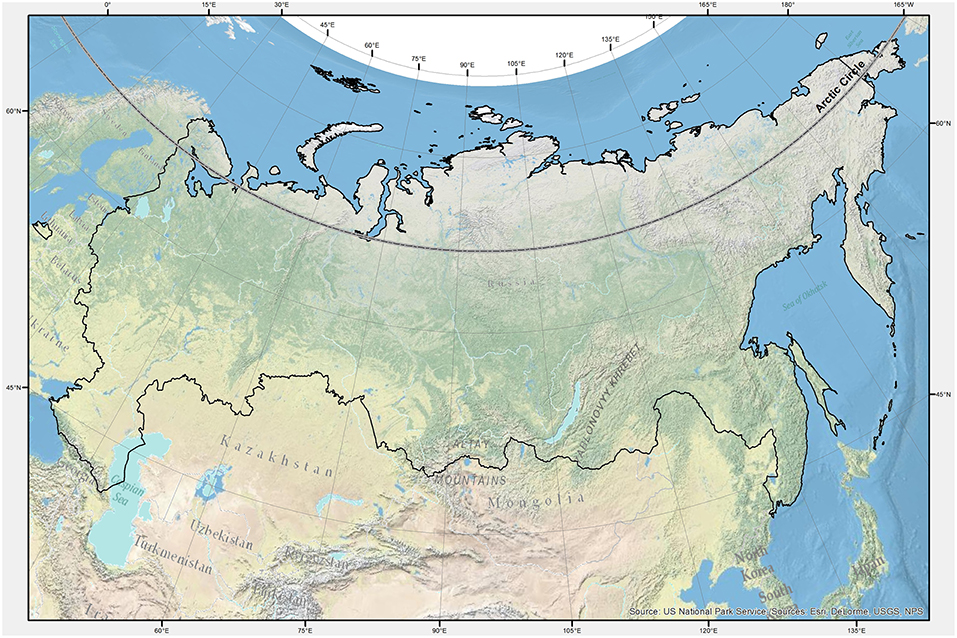
Figure 1. Study area domain represented by black borders limiting the Russian Federation territory. The parallel limiting the Arctic Circle is shown in gray-black/dashed line.
Most ecosystems are characterized by boreal forests, that consist of hardy genera of larch (Larix) and pine (Pinus), referred to as light-needled conifers, and of spruce (Picea), fir (Abies), and cedar (Cedrus) as dark-needled species, interspersed with deciduous hardwoods of birch (Betula), aspen (Populus), willow (Salix), and alder (Alnus) (Shumilova, 1962; Soja et al., 2007). The remaining part (exclusively in the Southernmost latitudes) is composed by temperate forests (in particular over the Southern Far East and Caucasus Mountains) and a forest steppe (Houghton et al., 2007).
2.2. Species Distribution Modeling
The Species Distribution Model (SDM) simulations were executed through the BIOMOD2 package v3.3- 7 (https://cran.r-project.org/web/packages/biomod2/index.html; Thuiller et al., 2016) implemented in R (R Core Team, 2015). The BIOMOD2 platform uses individual species representation and a community-based approach, enabling ensembles of models to be evaluated (calibration phase, see later) under the historical conditions (represented by predictors) and then re-applied to project, along future time horizons, the potential spatial distribution of species (Naimi and Araújo, 2016), to be intended as “habitat suitability” driven by climate. Ten models are embedded in BIOMOD2, ranging from simple regressions to classification, artificial neural network and surface envelope methods. The combined use of both simple and complex methods is recommended as there is no clear better performance of one or the other method, and it depends on the region and/or the quality of the data (Ochoa-Ochoa et al., 2016). The BIOMOD2 package, also, makes specific metrics available and run configurations to assist the models' evaluation, whose settings are explained later directly referring to the present application.
2.2.1. Forest Occurrence Database
To consider the spatial distribution of Russian forests, the “Russian Forests & Forestry” dataset was accessed, distributed by the International Institute for Applied Systems Analysis (IIASA, Laxenmburg, Austria; https://webarchive.iiasa.ac.at/Research/FOR/forest_cdrom/home_en.html) and based on Russian State Forest Account data (Fomchenkov et al., 2003). This dataset, available in shapefile format, consists of a map showing the historical/current distribution of dominant forest species across the Russian Federation (besides shrubs and minor deciduous): Aspen, Birch, Cedar, Fir, Larch, Pine, and Spruce. When available data are presence-only, as in this case, other locations can be considered by BIOMOD2 as “pseudo-absences” (Thuiller et al., 2009), also referred to as “not presence” hereafter. To derive a geodatabase of the presence-not presence for every species, a chain of spatial algorithms was applied in the GIS environment (Suite ESRI ArcGis Desktop 10.1) (Figure 2). First, the forest map was overlaid to a regular grid with 0.5 × 0.5° spacing, covering the whole of Russia, whose extent was taken from the ESRI ArcGIS Online database (http://www.esri.com/software/arcgis/arcgisonline) (Figure 2A).
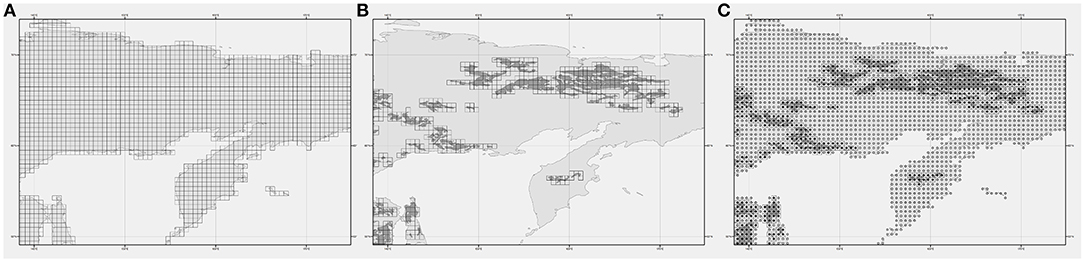
Figure 2. Example of the processing chain for the creation of the Occurrence Database (ODb). (A) The initial 0.5 × 0.5° grid; (B) The selection of grid element overlapped by species polygon; (C) The final binary map of not presence (0; empty circles)—presence (1; full black circles).
Second, for each species, the grid cells overlapping the related polygons were flagged with “1” (presence). Conversely, cells intersecting no polygon for the considered species were flagged with “0” (not presence) (Figure 2B). Then, the binary “1-0” grid layers for each of the seven species have been converted in separated point layers (Figure 2C) and finally merged in the overall Occurrence Database (ODb) containing, for each point, the longitude and latitude coordinates and the “presence” or “not presence” information.
2.2.2. Environmental and Territorial Predictors
Different categories of predictors were considered for the SDMs' calibration and subsequent projections: bioclimatic predictors (BPs), indicators of environmental characteristics; topographic predictors (TPs); and two accessibility predictors (APs) related to other territorial settings (distance from major cities and rivers). BPs were elaborated from the time series of temperature and precipitation data available, for the historical period, from the Water and Global Change (WATCH) forcing dataset (WFD) (http://www.eu-watch.org/data_availability). The WFD is a twentieth century meteorological dataset based on the European Centre for Medium-range Weather Forecasts (ECMWF) Re-Analysis (ERA-40) (Uppala et al., 2005) interpolated to a 0.5 × 0.5° latitude/longitude grid, with successive elevation correction of surface meteorological variables plus monthly bias correction from the Climatic Research Unit (CRU) gridded observational dataset (Piani et al., 2010; Weedon et al., 2011). From this dataset, the years from 1960 to 1999 were considered as representative of the historical period.
BPs are listed in Table 1. The first 19 BPs match with the ones promoted by the WorldClim dataset (Fick and Hijmans, 2017), the remaining were selected from the analyzed literature on the topic (Kira, 1945; Gorbunov, 1978; Ellenberg, 1988; Rivas-martínez, 2004). While the longitude and latitude information are directly available in the ODb (TPs 1 and 2), other TPs (from 3 to 8) have been elaborated from the ViewFinder Panorama Digital Elevation Model (DEM) (De Ferranti, 2014), downloaded at http://viewfinderpanoramas.org/dem3.html. The 90 × 90 m resolution of the available dataset was resampled in GIS to 0.5 × 0.5° resolution and the main statistics (mean, maximum, minimum) for elevation and slope were calculated within the new cells. The APs came from spatial analyses in the GIS environment, made starting from “World Major Rivers” network and “World Cities,” available in the ArcGIS Online platform through the Euclidean Distance tool in ESRI ArcGIS Spatial Analyst extension. TPs and APs are listed in Table 2.
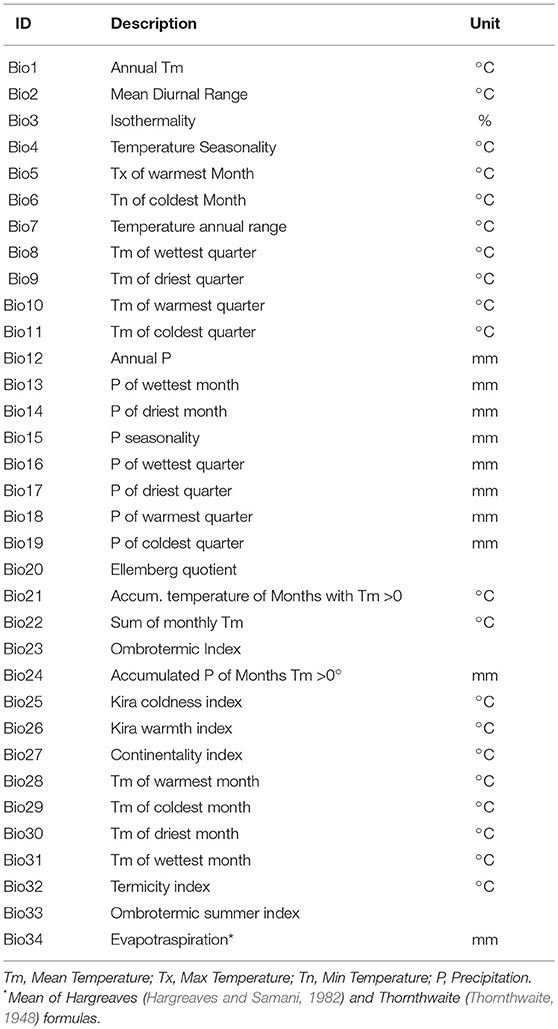
Table 1. Bioclimatic environmental predictors.
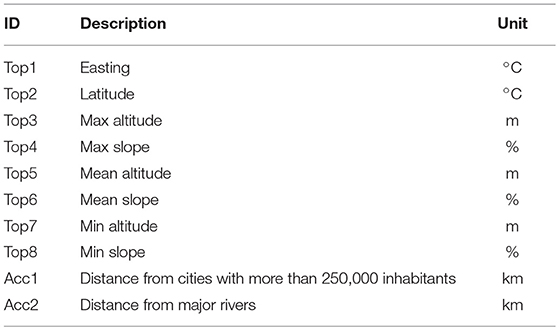
Table 2. Topographic and accessibility predictors.
2.2.3. SDM Calibration and Evaluation
The BIOMOD2 platform was trained and calibrated re-adapting the choices in VanDerWal et al. (2009) and Lobo et al. (2010) to the characteristics of the study area, i.e., using pseudo-absences to address the risk of false absence information (Barbet-Massin and Jetz, 2014). Pseudo-absences were randomly selected within a maximum distance of 4° from detected presences. The number of pseudo-absences for each species was set five times larger than the number of presences, except for Fir where a factor of 10 was used. We increased the factor for Fir's analyses, due to an overestimation of the predicted presences and very low modeling performance detected in training simulations, according to Kanagaraj et al. (2013). Then, a subset of 70% of points was used to calibrate each SDM for each single species, while the remaining 30% was used for the validation (see, e.g., Duque-Lazo et al., 2016; Noce et al., 2017). Still, for validation purposes, the BIOMOD2 platform also allows n data splitting runs within each model simulation: ten runs where used in this case. Runs and thus models concurring to the ensemble were selected by applying a Receiver Operating Characteristic (ROC) test with a score of ≥0.85. The ROC plot has been selected because it is threshold-independent and could overcome the limits of threshold-dependent Cohen's K and True Skills Statistics (TSS) (Noce et al., 2017). In the end, nine among the ten SDMs in BIOMOD2 provided valuable results for the ensemble forecasting: FDA, GLM, GBM, CTA, ANN, SRE, MARS, RF, and MAXENT, all with the default settings (Phillips et al., 2006; Thuiller et al., 2009). For each species, the nine SDMs' predictions provided the probability of presence; an overall probability was then derived by a weighted average based on the predictions' performance and converted into a binary map (projected presence/projected not-presence) using a threshold that maximized the ROC statistic. This binary map, for each species, was then compared to the ODb to evaluate the accuracy of the modeling chain (calibration phase) through metrics based on the confusion matrix proposed by Miller (2010): Sensitivity (Sens), Specificity (Spec), Predicted Present correctly Predicted (PPP), Predicted Not-Present correctly Predicted (NPP), True Skill Statistic (TSS), Percent Correctly Classified or Overall Accuracy (PCC), and Cohen's Kappa (see Table 3 for more information).
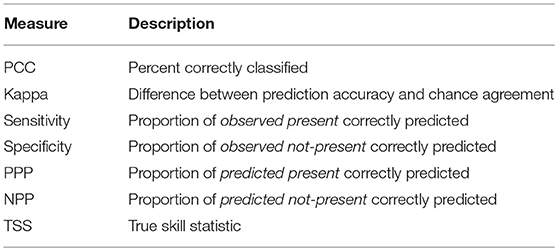
Table 3. Evaluation metrics of accuracy based on the confusion matrix from Miller (2010).
2.3. The Cascade Ensemble System
To investigate the expected impact of climate change on the distribution of the considered forest species, the cascade ensemble system (CES) as in Noce et al. (2017) was applied, forcing calibrated SDMs under several climate projections. This approach takes into consideration both SDMs and climatic projections' uncertainty related to climate models and emission scenario variability. Future outlooks of species occurrence from the CES, therefore, are flagged according to IPCC terminology on the likelihood based on the consensus across the projections (Mastrandrea et al., 2011), providing more robust information about potential future changes.
2.3.1. Future Projections
To evaluate the potential modifications (expansion, reduction, shift) of forest species across the study area (whole of Russia), two future time horizons of 40 years were selected: 2060, representing the 2040–2079 medium-term period; and 2080, representing the 2060–2099 long-term period. To re-run the SDMs under the future expected combination of environmental and territorial conditions, a dataset of predictors for the future was prepared. The TPs and APs were considered unchanging along the period of projections, while BPs were recalculated under future climatic circumstances. Daily time series of precipitation and temperature are available thanks to coordinated climate model simulation experiments from phase 5 of the Coupled Model Intercomparison Project (CMIP5) (van Vuuren et al., 2011; Taylor et al., 2012). These simulations are forced by multiple Representative Concentration Pathways (RCPs) formulated by the Intergovernmental Panel on Climate Change (IPCC, 2013). The RCPs are defined by their total radiative forcing (cumulative measure of human emissions of GHGs from all sources) until 2100 and beyond, which could result from different combinations of economic, technological, demographic, policy, and institutional futures. In this study, the RCP4.5 (Thomson et al., 2011) and RCP8.5 (Riahi et al., 2011) were selected. The RCP4.5 is a stabilization scenario where total radiative forcing is stabilized, shortly after 2100, to 4.5 Wm-2 (approximately 650 ppm CO2-equivalent) by employing technologies and strategies to reduce GHG emissions, while the RCP8.5 is a business as usual scenario and it is characterized by increasing GHG emissions and high GHG concentration levels. It represents a rising radiative forcing pathway leading to 8.5 Wm-2 in 2100 (approximately 1,370 ppm CO2-equivalent). To serve impact studies, however, raw climate model simulations need to be bias-corrected (Hempel et al., 2013). In this context, the Inter-Sectoral Impact Model Intercomparison Project (ISI-MIP Fast-Track) provides globally downscaled (at 0.5 × 0.5° grid resolution) and bias-corrected daily time series of temperature and precipitation for five Earth System Models (ESMs) participating in CMIP5 (https://esg.pik-potsdam.de/search/isimip-ft/): GFDL-ESM2M, HadGEM2-ES, IPSL-CM5A-LR, MIROC-ESM-CHEM, NorESM1-M. Bias-correction is based on a trend-preserving method (Hempel et al., 2013; https://github.com/ISI-MIP/BC) and, for the purpose of this work, it was applied also to the ESM developed and used by the Foundation Euro-Mediterranean Center on Climate Change (CMCC-CESM), and whose raw data are available at the CMIP5 data archive (https://esgf-node.llnl.gov/search/cmip5/). For the five different ESMs already bias-corrected on the ISI-MIP platform, the RCP4.5 and the RCP8.5 were selected, while projections under the RCP8.5 scenario are available from the CMCC-CESM. The previously calibrated SDM package of BIOMOD2 was thus re-applied to produce eleven CES members for each time horizon and each forest species, i.e., forced by two RCPs for five ESMs plus one RCP for the CMCC-CESM. Each member is, in turn, obtained by weighting simulations from the nine SDMs.
2.3.2. Likelihood Quantification and Species Distribution Analysis
Two kinds of analysis were performed over Russia from the outputs of the CES chain: spatial and non-spatial. The former examines the spatial occurrence of presence/not-presence cases for each single species and under each time horizon. After producing maps of the potential distribution (namely “habitat suitability”) for each forest species under the different CES members, the spread in results, due to ESMs and RCPs, was quantified by adopting the approach and terminology to treat the variability and communicate the “likelihood” of outcomes, in compliance with IPCC-AR5 (Mastrandrea et al., 2011). We slightly reformulated the likelihood scale as reported in Table 4. Further, the level of expected modifications for each map unit was calculated by producing an additional binary map, for each species and time horizon, with 1 indicating conversion from presence (or not-presence) to not-presence (or presence), and 0 indicating persisting presence or persisting not-presence. Then, the binary maps of changes for the different species were summed up and a final map with discrete values from 0 (no changes) to 7 (all species changed their state) was produced, indicating the level of likely change across the study domain. Finally, this information was aggregated by hexagonal binning in a Hex-Bin map averaging the discrete values (Change Index) in hexagons with a surface of 25,000 sq. Km.
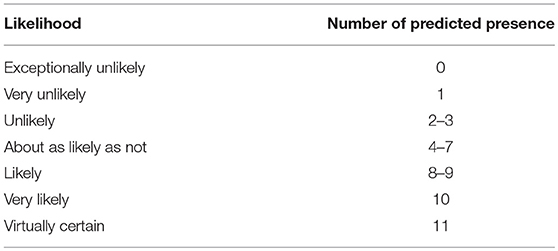
Table 4. Adopted likelihood scale (based on IPCC AR5 guidance note Mastrandrea et al., 2011).
The non-spatial analysis looks at aggregated modifications in the species' composition, both at regional and local level. First, the re-arrangement of occurrence values for the different species (as average among CES members for each species) was assumed as a proxy of the regional modifications in the forest composition for the future, within the (persisting or new) suitable areas. Second, the number of co-existing forest species at the map unit (pixel) level (still as average among CES members) was considered as representative of local forest diversity, and the updated frequency of pixels with different species richness was analyzed. In both cases, the chi-square test was applied to verify the statistical significance of the differences across time horizons, assuming a 99.9% significance level (i.e., frequency distributions are significantly different for a p < 0.001).
Besides considering the Russian territory as a whole, a sub-regional analysis was then conducted. The domain has been divided into nine quadrants (Figure 3): NW (North-West), N (North), NE (North-East), E (East), C (Center), W (West), SE (South-East), S (South), SW (South-West). Each quadrant has an extension of 13.5° latitude and 57° longitude. Furthermore, the Arctic Polar Circle sub-region (North of the latitude 66.50°N) was also considered. Within both quadrants and the Arctic Circle, the average of projected presence across the ensemble members in the historical period and for the two future time horizons (2060 and 2080) under the two RCPs (4.5 and 8.5) was calculated. Due to the different coverage of the species across these quadrants and in the Arctic circle, the sub-regional analysis was limited to the four species whose SDMs present an overall prediction accuracy (as average across all the metrics) >0.95: Birch, Larch, Pine, and Spruce.
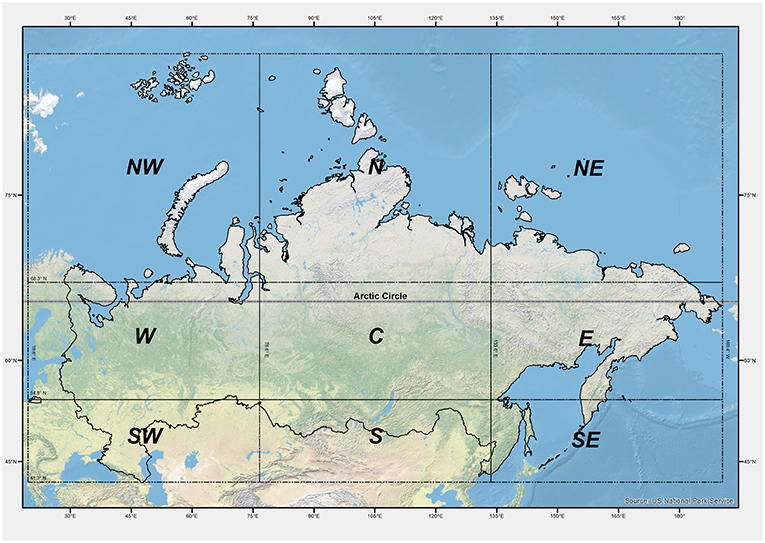
Figure 3. Sub-regional analysis quadrants, each 13.5° latitude high × 57° longitude wide. The parallel limiting the Arctic Circle is shown in gray-black/dashed line.
3. Results
Concerning the calibration/validation phases, Table 5 shows the accuracy of SDMs under the evaluation metrics adopted. Results for Kappa and TSS statistics can be considered as good to excellent according to Zhang et al. (2015) classification. The overall accuracy, in terms of averages among the metrics, ranges from 0.882 (Fir) to 0.977 (Larch) and it is >0.95 for four species: Birch, Larch, Pine, and Spruce. Additionally, BIOMOD2 provides an estimate of the relative importance for each environmental predictor, whose highlights are reported in Table 6. It is clear how predictors Bio25, Bio32, and Bio34 are crucial for more than half of the considered species, while 19 predictors in total are not among the top five in terms of importance, to explain the species occurrence, and in six cases they are excluded (mostly Bio14). After running BIOMOD2 embedding future projections of bioclimatic predictors, the maps derived from the single CES members were aggregated into two final maps for each dominant forest species, for 2060 and 2080, respectively. Therefore, each map represents the likelihood of habitat suitability following the IPCC terminology. Colors from light yellow to dark red in Figure 4 indicate the increasing likelihood, which can be also visually compared to the respective binary map of historical species occurrence (presence vs. not-presence) derived from the IIASA database. The Figure 5 shows the Hex-Bin map of the Change Index for the long-term (2080) scenarios, with major changes concentrated in mid and lower latitudes, and particularly in the Irkutsk and Khabarovsk regions. The forest composition was thus analyzed in terms of species' regional arrangement (Figure 6) and local diversity (Figure 7). In the first case, the species occurrence both in the medium-term and the long-term future is significantly different from that along the historical period, as well as between the two future periods. This is mainly due to the reduction of Birch, Pine, Larch, and the strong increase of Aspen and Fir. Cedar and Spruce remain more or less constant. Furthermore, locally there are significant differences among time horizons. Locations with moderate forest diversity (two or three species) diminish while those with very low and high forest diversity (one and more than four species, respectively) increase, including some previously bare areas that gain forests.
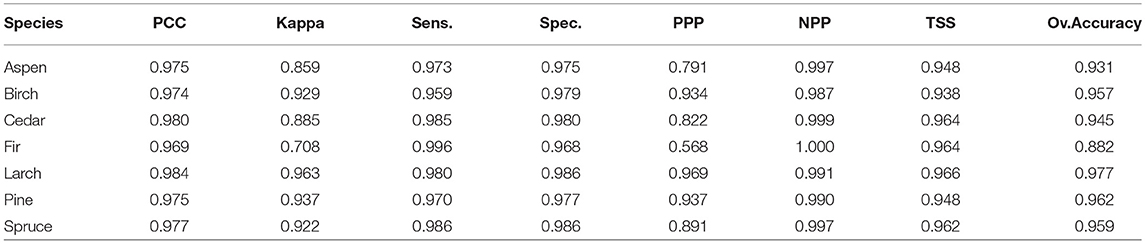
Table 5. SDM Performance based on selected metrics.
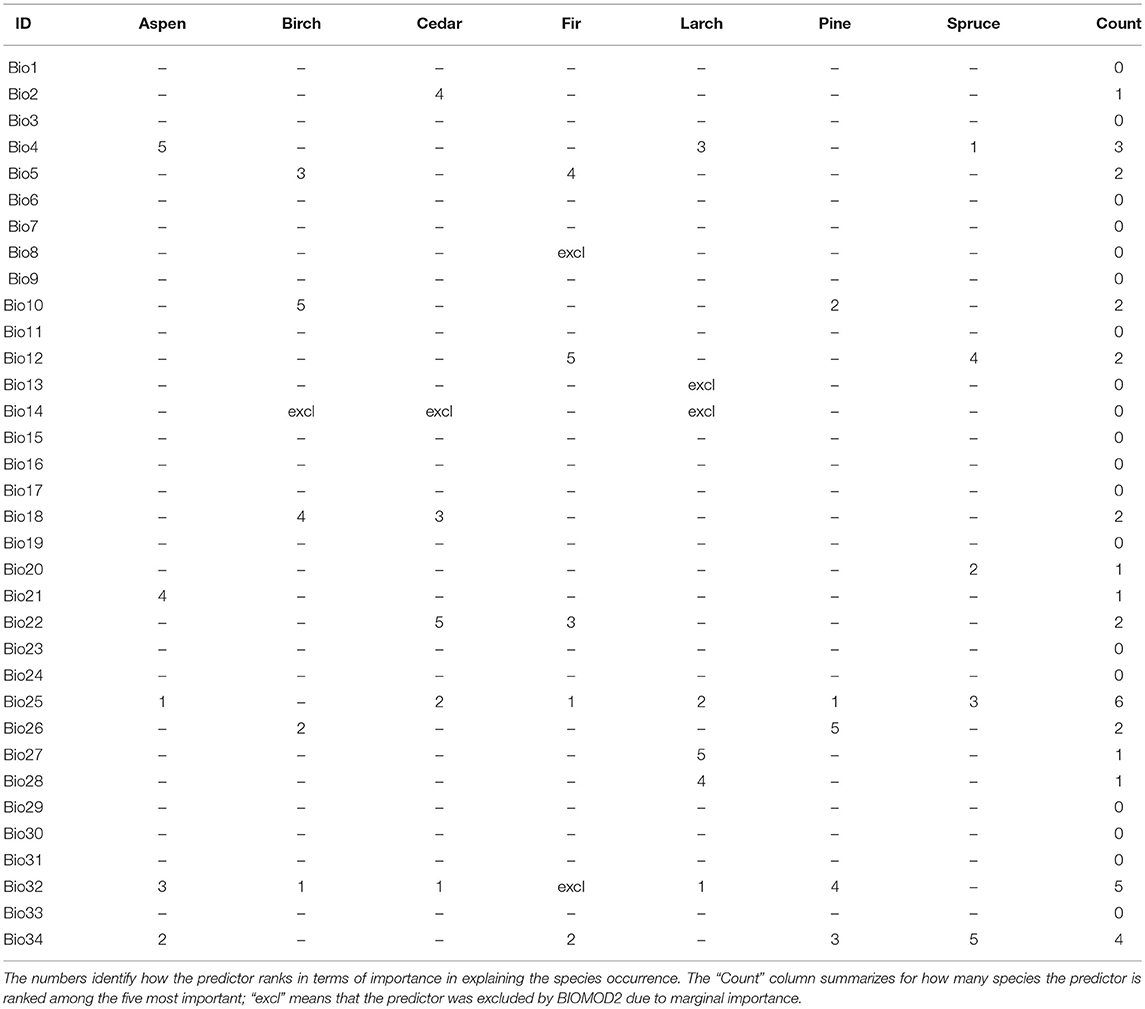
Table 6. The five most important and excluded environmental (bioclimatic) predictors according to BIOMOD2 calibration for each species.
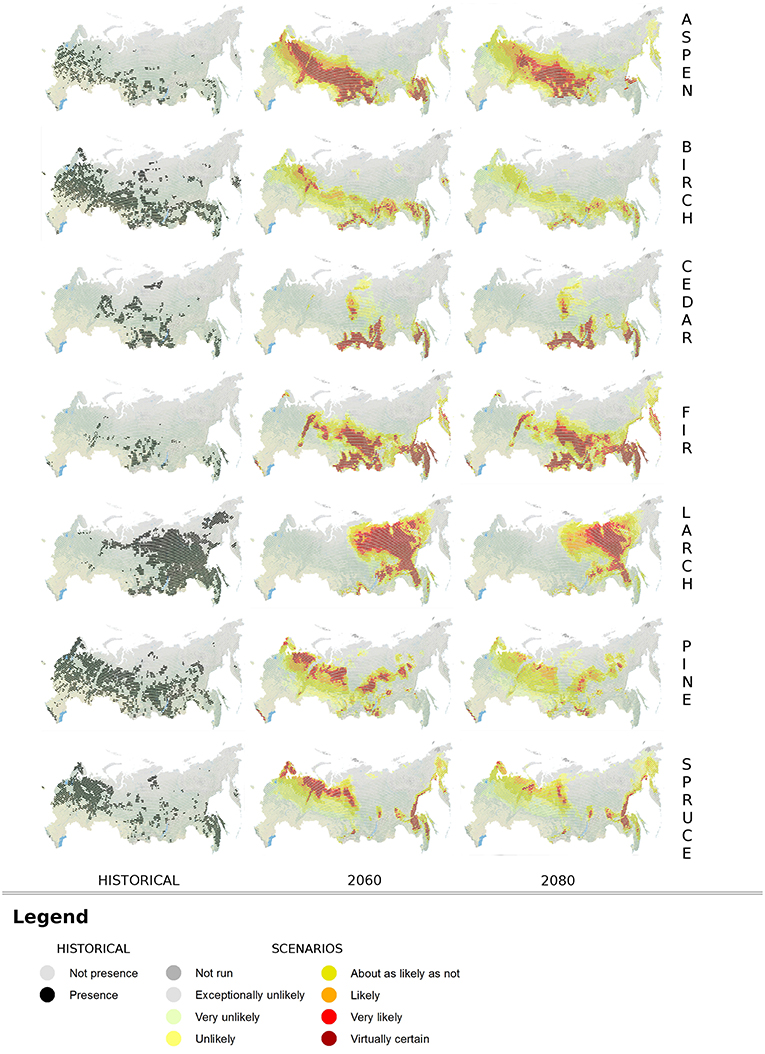
Figure 4. Output maps from the Cascade Ensemble System (CES). Forest species distribution according to historical period (presence-not presence; left side) and future scenarios for 2060 (central column) and 2080 (right side), with likelihood flag.
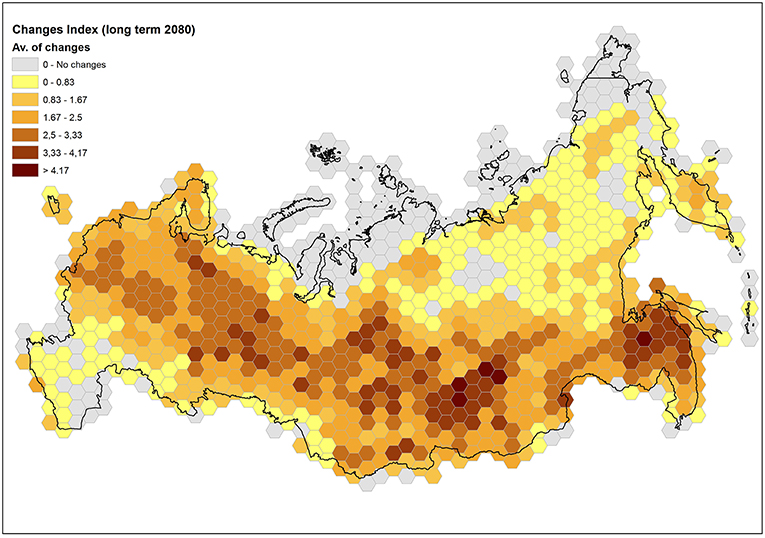
Figure 5. Hex-bin map of the formulated Change Index for the long-term scenario. Each hexagon reports the average value of the number of projected conversions from presence (or not-presence) to not-presence (or presence).
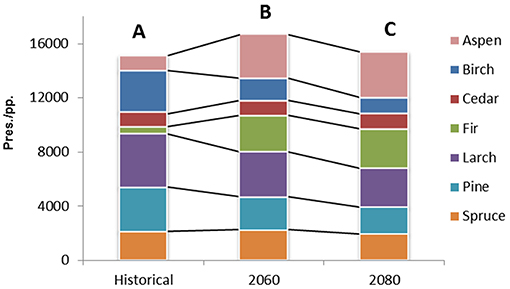
Figure 6. Cumulated forest species distribution in terms of count of map units (pixels) with presence (pres.; for the historical period) and projected presence (pp.; for the future periods). Different capital letters mean that the distributions are significantly different at the 99.9% level (p < 0.001).
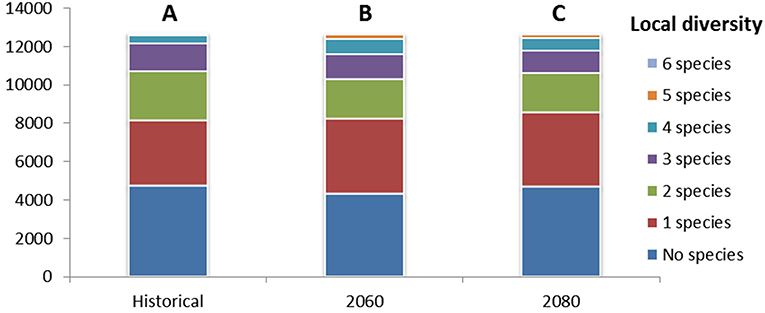
Figure 7. Cumulated forest species diversity in terms of count of map units (pixels) hosting a given number of species. Different capital letters mean that the distributions are significantly different at the 99.9% level (p < 0.001).
Looking at sub-regional levels for those species with overall SDM performance >0.95 (Birch, Larch, Pine, and Spruce), the Supplementary Information report and summarize the averages of projected presence among the CES members for each quadrant. Colored graph bars are distinguished for the two-time horizons and the two RCPs, and the historical presence is indicated by the black outline of the bars. For Birch (Figure SI1), a strong reduction is expected from 59 to 69% on average across RCPs for the medium-term (2060) and long-term (2080) periods, respectively, regardless of the level of initial occurrence, and from 36 to 63% in the West where Birch is originally more diffused. For Larch (Figure SI2), a reduction up to 76% is projected on average for 2080 across the Central longitude quadrants and in the whole Southern zone, and up to 41% considering only the Central portion which is currently the richest in Larch. Contrarily, a very strong increase is projected in the North and North-East, with future presences at least doubling in all scenarios. For Pine (Figure SI3), the projected spatial distribution for 2080 suggests an average decrease of 42% encompassing the quadrants of Central and Western longitudes, while an average increase of around 57% is expected to the East.
Spruce (Figure SI4) is projected to drop up to 51 and 37% in the South-Eastern and Western sector, respectively, in the long-term. In the same time-frame, the Central part, largely populated by Spruce at present, is expected to experience a 39% increase.
In Figure 8 the average projected presence among the CES members, and considering separately time horizons and RCPs, are reported for the Arctic Polar Circle. Even if starting from different historical presences, results for Larch, Pine and Spruce increase. Pine and Spruce are expected to double; Larch to increase by nearly 30%. Contrarily, Birch species strongly decrease, almost disappearing by 2080 under RCP8.5.
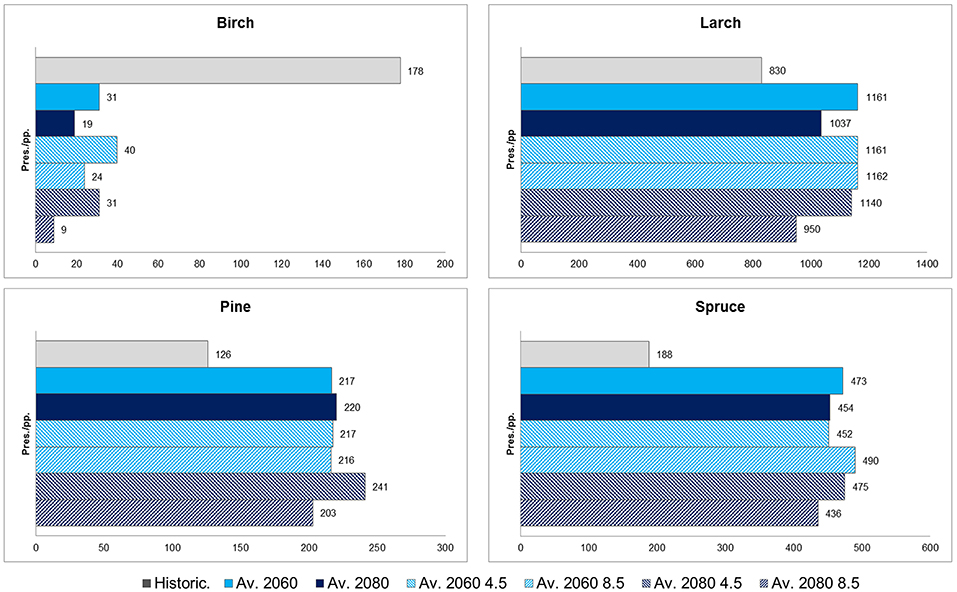
Figure 8. Historical presence (pres.) compared to the average of projected presences (pp.) (averaged and not between RCPs for 2060 and 2080) for the Arctic Circle region.
4. Discussion
According to the latest climate projections conducted within the Coupled Model Intercomparison Project 5 (CMIP5), temperature will significantly increase by the end of the twenty-first century over Russia. This increase will be more evident in the cold season (by up to +8°C across high latitudes) and less in the warm season (by up to +5°C in Southern Siberia). At the same time, precipitation is projected to substantially increase, especially in the cold season. Thus, during the vegetation growing season, the combined effect of rising temperatures and limited variation in precipitation will probably lead to changes in the hydrological cycle and consequently to a significant shifts in ecosystems (Groisman et al., 2013; Knutti and Sedláček, 2013; Feng et al., 2014).
To deepen the knowledge on the above climatic impacts, the climate-driven “habitat suitability” (or simply “suitability”) of a representative portion (ca. 98%) of some dominant species of Russian forests was investigated in the present work. A Cascade Ensemble System (CES) was applied to combine the variability of outcomes due to both climate models and Species Distribution Models (SDMs). First, the SDM calibration and validation phase was conducted, revealing a good performance of the BIOMOD2 platform due to considerable matching between observed and modeled forest species' spatial ranges along the historical-current period. However, sub-regional analyses were conducted only for species showing excellent agreement between the observed and modeled ranges. In general, temperature appeared the key limiting factor in reshaping species ranges. In fact, while the precipitation-related bioclimatic predictors show a lower relative importance in explaining the forests species occurrence, this occurrence seems more sensitive to bioclimatic predictors related both to temperature alone (i.e., Kira coldness and Termicity indices) and to the combination of temperature and precipitation (i.e., Evapotranspiration).
Successively, possible future ranges of the same dominant forest species in Russia were provided through spatial maps, flagged with information about the likelihood of the projected occurrence, based on the consensus among CES simulations. In general, considering long-term projections (2080) and the worst scenario (RCP8.5), some species (Fir and Aspen) could likely find more suitable conditions in the future, while other (mainly Birch and secondarily Pine) could be negatively affected by climate change with a noteworthy reduction of the historical ranges. In Figure 4, a general shift of species suitability toward the North-East is detectable for the majority of species (Aspen, Fir, Larch, Spruce) if compared to the historical period, although there is a likelihood that strength diminishes in the long-term with respect to the medium-term. For the future, the likelihood quantification is provided rather than the binary presence-not presence information available for the historical period, thus it is not possible to state univocally if the visual shift is an expansion or contraction, as this could vary across CES simulation members. If extracting from the maps the locations where presence has higher value of likelihood (“likely,” “very likely,” and “virtual certain”), only Aspen and Fir seem to effectively expand their habitats, while for the other species a contraction is projected, even if rather moderate for Cedar. Summarizing, our results suggests a possible increasing trend of forest suitability over higher latitudes, opposed to a reduction over lower latitudes. Major changes in dominant forests are expected across the Southern portion of the Central Siberian Plateau (Irkutsk region) and the Southern Far East (Khabarovsk region), while the slowest changing rates are projected both in the Southern-Western domain, probably because the analysis does not include the dominant species of this area (temperate broadleaf), and in the Northern-Eastern Siberia, where only the Larch is expected to gain suitability.
Moving to the sub-regional analyses, the impact of climate change on Betula species should be negative and largely widespread, as also described in other studies over Europe (Dyderski et al., 2017; Noce et al., 2017) under different climatic conditions. These results can be partly offset by the excellent dispersal and migration capacities toward new areas of this species (Giesecke et al., 2017). However, neither dispersal nor migration dynamics are considered in the SDM approach, thus, in the end, the Birch habitat suitability seems strongly limited both in the medium- and long-term.
For Larch, the Northward, and minimally Eastward, shift of the range appears to be the most likely scenario with a continuous trend from the mid- to the long-term. Although facilitated by a good dispersion capacity of these species (Ellenberg, 1988), these variations associated with a general reduction of suitability should be more evident under the RCP8.5 scenario. Despite our results for these, species did not show a gain in suitable areal distribution under a changing climate as in Tchebakova et al. (2006, 2010b), the less suitable area in the Central and Southern portion of the ranges will be partly compensated by a gain of more appropriate habitats in the Northern and North-Eastern ones.
Future climate conditions, in particular in the long-term, could negatively affect the Pine's geographical distribution. This contraction in future ranges could likely be related to increasing drought stress, due to a positive temperature change according to Suckow et al. (2016) findings. It is also reasonable to predict different responses for the most represented species of this genera: Scots pine (Pinus sylvestris), which is more tolerant to warmer temperature, could be less affected than Siberian pine (P. sibirica).
The scenarios for Spruce are interesting: our findings suggest clear modifications in terms of a potential Eastward shift of the spatial range and an overall neutral balance in terms of suitability gain/loss. In particular, in the Central portion of the study area, our projections suggest a potential change in the forest composition from Larch dominated toward Spruce dominated forests, in accordance with (Shuman et al., 2011; He et al., 2017) and actual trends demonstrated by field observations (Kharuk et al., 2005).
Finally, the analysis on the Arctic Circle reveals a possible strong increase of forests dominated by Larch, Pine, and Spruce in this area that is currently dominated by ecosystems with no or scarcely forested areas (e.g., tundra). According to the projections of Tchebakova et al. (2016), foreseeing a strong reduction of tundra by 2090, and of Shuman et al. (2015), the tree line should move Northward and the Arctic Circle will potentially become a refuge area for the migration of these species. However, it is fundamental to consider the expected retreat of the permafrost zone under global warming: many studies (Tchebakova et al., 2009, 2010b; Shuman et al., 2015) emphasize the importance of this factor in reshaping forest ranges, but as also described in Tchebakova et al. (2016), the permafrost would not retreat sufficiently fast enough to create favorable habitats for Pine and Spruce. Indeed, as demonstrated in McKenney et al. (2007), Shvidenko et al. (2013), and Gauthier et al. (2015), there is evidence that climate zones are shifting Northward, but this is happening one order of magnitude faster than the trees' ability to migrate. Furthermore, although warmer temperature (especially in summer) can accelerate tree growth and indirectly the suitability for some species, at the same time they can increase the hazard of forest fires (Furyaev et al., 2001). In synthesis, the Arctic region, despite showing potentially suitable climatic conditions for some forest species, is likely to become a bottleneck for the pronounced Northward reshaping of forest ranges due to other constraints.
Several caveats of the presented approach have to be considered. First, the lacking consideration of the disturbance factors in the analysis. In fact, the combined effects of multiple (natural and human-made) disturbances can influence the distribution of Russian forests, affecting both succession dynamics and landscape connectivity, as well as the productivity and vitality of forest ecosystems, as described in the review work of Schaphoff et al. (2016). Examples of disturbances playing a crucial role in the future reshaping of forest species are fires, which has already burned 1.6 million of ha per year over the 2003–2012 decade (FAO, 2016), and forest insects, whose impacts are expected to increase (Mollicone et al., 2006; Ivanova et al., 2010; Baranchikov et al., 2011). Second, the SDM approach is not able to capture the total species' environmental range limit, also known as “truncated niche” (Zurell et al., 2012), and consequently the combinations of environmental conditions for which the models are calibrated are under-represented, affecting future projections (Thuiller et al., 2004). Furthermore, despite covering a representative portion (ca. 98%) of forests' dominant species, the sample does not capture the overall possible spatial transitions, therefore neglecting some possible re-arrangements of species and the gain of new suitable habitats in Southern Siberia for temperate broadleaf forests as described in Tchebakova and Parfenova (2012). Finally, the source occurrence database is not strictly based on georeferenced samples as typically used for more limited-area SDM applications, but is derived from distribution maps, thus preventing any further reasonable refinement of the analysis spatial detail and to draw conclusions at a local level.
Despite the above limitations, the presented work provides noteworthy information on possible scenarios of forest suitability for the entire territory of Russia. The analysis strongly relies on the most updated and bias-corrected data from latest generation of Earth System Models (ESMs), from which a cascading ensemble framework (based on climate and species distribution models) was applied to obtain robust projections of habitat suitability for forests across Russia. This ensemble approach allowed for compliance with the terminology suggested by the IPCC, in order to quantify the likelihood based on a consensus among projections. Our findings, flagged with the related likelihood information, represent preliminary but useful and communicative information, available to policy makers at national and sub-regional level in Russia, to support their formulation of future forest conservation and management plans (e.g., reforestation and afforestation programs).
Author Contributions
SN and MS conceived the study idea. SN conducted the analyses with the GIS and BIOMOD2 package and led the writing. LC handled the preparation and bias-correction of ESM data. MS performed the spatially aggregated diversity and distribution analyses. All authors significantly contributed to editing and revising the manuscript.
Conflict of Interest Statement
The authors declare that the research was conducted in the absence of any commercial or financial relationships that could be construed as a potential conflict of interest.
Acknowledgments
The authors gratefully acknowledge SCHEPASCHENKO Dmitry (IIASA) for his valuable and constructive initial suggestions. We thank the two reviewers and the Associate Editor Dr. Anouschka Hof for their careful reading and commenting of the manuscript.
Supplementary Material
The Supplementary Material for this article can be found online at: https://www.frontiersin.org/articles/10.3389/fevo.2019.00057/full#supplementary-material
Supplementary Information S1. Supplementary Information (Text and Figures SI1–4) showing the average of projected presence among the CES members for each quadrant.
Abbreviations
pp., projected presence; FDA, Flexible Discriminant Analysis; GLM, Generalized Linear Model; GBM, Generalized Boosted Model; ANN, Artificial Neural Networks; SRE, Surface Range Envelope; RF, Random Forest.
References
Allen, C. D., Macalady, A. K., Chenchouni, H., Bachelet, D., McDowell, N., Vennetier, M., et al. (2010). A global overview of drought and heat-induced tree mortality reveals emerging climate change risks for forests. For. Ecol. Manage. 259, 660–684. doi: 10.1016/j.foreco.2009.09.001
Anderson, R. P. (2017). When and how should biotic interactions be considered in models of species niches and distributions? J. Biogeogr. 44, 8–17. doi: 10.1111/jbi.12825
Araújo, M. B., and Luoto, M. (2007). The importance of biotic interactions for modelling species distributions under climate change. Glob. Ecol. Biogeogr. 16, 743–753. doi: 10.1111/j.1466-8238.2007.00359.x
Baranchikov, Y., Kodankov, V., and Petrenko, E. (2011). “Siberian Moth-A relentless modifier of Taiga forest ecosystems in Northern Asia,” in Boreal Forests and Needs for Actions - IBFRA, (Krasnoyarsk), 105–107.
Barbet-Massin, M., and Jetz, W. (2014). A 40-year, continent-wide, multispecies assessment of relevant climate predictors for species distribution modelling. Divers. Distrib. 20, 1285–1295. doi: 10.1111/ddi.12229
Berner, L. T., Beck, P. S., Bunn, A. G., and Goetz, S. J. (2013). Plant response to climate change along the forest-tundra ecotone in northeastern Siberia. Glob. Change Biol. 19, 3449–3462. doi: 10.1111/gcb.12304
Bonan, G. B. (2008). Forests and climate change: forcings, feedbacks, and the climate benefits of forests. Science 320, 1444–1449. doi: 10.1126/science.1155121
Clark, J. S., Gelfand, A. E., Woodall, C. W., and Zhu, K. (2014). More than the sum of the parts: forest climate response from joint species distribution models. Ecol. Appl. 24, 990–999. doi: 10.1890/13-1015.1
Dale, V. H., Joyce, L. A., McNulty, S., Neilson, R. P., Ayres, M. P., Flannigan, M. D., et al. (2001). Climate change and forest disturbances. BioScience 51:723. doi: 10.1641/0006-3568(2001)051[0723:CCAFD]2.0.CO;2
Devi, N., Hagerdon, F., Moiseev, P., Bugmann, H., Shiyatov, S., Mazepa, V., et al. (2008). Expanding forests and changing growth forms of Siberian larch at the Polar Urals treeline during the 20th century. Glob. Change Biol. 14, 1581–1591. doi: 10.1111/j.1365-2486.2008.01583.x
Dolman, A. J., Shvidenko, A., Schepaschenko, D., Ciais, P., Tchebakova, N., Chen, T., et al. (2012). An estimate of the terrestrial carbon budget of Russia using inventory-based, eddy covariance and inversion methods. Biogeosciences 9, 5323–5340. doi: 10.5194/bg-9-5323-2012
Duque-Lazo, J., van Gils, H., Groen, T. A., and Navarro-Cerrillo, R. M. (2016). Transferability of species distribution models: the case of Phytophthora cinnamomi in Southwest Spain and Southwest Australia. Ecol. Model. 320, 62–70. doi: 10.1016/j.ecolmodel.2015.09.019
Dyderski, M. K., Paź, S., Frelich, L. E., and Jagodziński, A. M. (2017). How much does climate change threaten European forest tree species distributions? Glob. Change Biol. 24, 1150–1163. doi: 10.1111/gcb.13925
Ellenberg, H. (1988). Vegetation Ecology of Central Europe Fourth Edition. Cambridge, UK: Cambridge University Press.
FAO (2018). The State of the World's Forests 2018 - Forest Pathways to Sustainable Development. Technical report, Food and Agriculture Organization of the United Nations, Rome.
Faurby, S., and Araújo, M. B. (2018). Anthropogenic range contractions bias species climate change forecasts. Nat. Clim. Change 8, 252–256. doi: 10.1038/s41558-018-0089-
Feng, S., Hu, Q., Huang, W., Ho, C. H., Li, R., and Tang, Z. (2014). Projected climate regime shift under future global warming from multi-model, multi-scenario CMIP5 simulations. Glob. Planet. Change 112, 41–52. doi: 10.1016/j.gloplacha.2013.11.002
Fick, S. E., and Hijmans, R. J. (2017). WorldClim 2: new 1-km spatial resolution climate surfaces for global land areas. Int. J. Climatol. 37, 4302–4315. doi: 10.1002/joc.5086
Fomchenkov, V., Sdobnova, N., Danilov, S., Danilova, S., Kurdina, G., and Beljakova, T. (2003). Forest Fund of Russia (data of State Forest Account, state by January 1, 2003)- Reference book. Technical report, Roslesinforg, Moscow.
Franklin, J. (2013). Species distribution models in conservation biogeography: developments and challenges. Divers. Distrib. 19, 1217–1223. doi: 10.1111/ddi.12125
Furyaev, V. V., Vaganov, E. A., Tchebakova, N. M., and Valendik, E. N. (2001). Effects of fire and climate on successions and structural changes in the Siberian boreal forest. Eur. J. For. Res. 2, 1–15.
Gauthier, S., Bernier, P., Kuuluvainen, T., Shvidenko, A. Z., and Schepaschenko, D. G. (2015). Boreal forest health and global change. Science 349, 819–822. doi: 10.1126/science.aaa9092
Gavin, D. G., Fitzpatrick, M. C., Gugger, P. F., Heath, K. D., Rodríguez-Sánchez, F., Dobrowski, S. Z., et al. (2014). Climate refugia: joint inference from fossil records, species distribution models and phylogeography. New Phytol. 204, 37–54. doi: 10.1111/nph.12929
Giesecke, T., Brewer, S., Finsinger, W., Leydet, M., and Bradshaw, R. H. (2017). Patterns and dynamics of European vegetation change over the last 15,000 years. J. Biogeogr. 44, 1441–1456. doi: 10.1111/jbi.12974
Goberville, E., Beaugrand, G., Hautekèete, N. C., Piquot, Y., and Luczak, C. (2015). Uncertainties in the projection of species distributions related to general circulation models. Ecol. Evol. 5, 1100–1116. doi: 10.1002/ece3.1411
Gorbunov, A. P. (1978). Permafrost investigations in high-mountain regions. Arct. Alpine Res. 10, 283–294. doi: 10.2307/1550761
Groisman, P. Y., Blyakharchuk, T. A., Chernokulsky, A. V., Arzhanov, M. M., Marchesini, L. B., Bogdanova, G., et al. (2013). Regional Environmental Changes in Siberia and Their Global Consequences. Dordrecht: Springer Environmental Science and Engineering; Springer Netherlands.
Guisan, A., and Thuiller, W. (2005). Predicting species distribution: offering more than simple habitat models. Ecol. Lett. 8, 993–1009. doi: 10.1111/j.1461-0248.2005.00792.x
Guisan, A., and Zimmermann, N. E. (2000). Predictive habitat distribution models in ecology. Ecol. Model. 135, 147–186. doi: 10.1016/S0304-3800(00)00354-9
Hannemann, H., Willis, K. J., and Macias-Fauria, M. (2016). The devil is in the detail: unstable response functions in species distribution models challenge bulk ensemble modelling. Glob. Ecol. Biogeogr. 25, 26–35. doi: 10.1111/geb.12381
Hansen, M. C., Potapov, P. V., Moore, R., Hancher, M., Turubanova, S. A., Tyukavina, A., et al. (2013). High-resolution global maps of 21st-century forest cover change. Science 342, 850–853. doi: 10.1126/science.1244693
Hargreaves, G. H., and Samani, Z. A. (1982). Estimating potential evapotranspiration. J. Irrig. Drain. Div. 108, 225–230.
He, Y., Huang, J., Shugart, H. H., Guan, X., Wang, B., and Yu, K. (2017). Unexpected evergreen expansion in the Siberian forest under warming hiatus. J. Clim. 30, 5021–5039. doi: 10.1175/JCLI-D-16-0196.1
Hempel, S., Frieler, K., Warszawski, L., Schewe, J., and Piontek, F. (2013). A trend-preserving bias correction - the ISI-MIP approach. Earth Syst. Dyn. 4, 219–236. doi: 10.5194/esd-4-219-2013
Hijmans, R. J., and Graham, C. H. (2006). The ability of climate envelope models to predict the effect of climate change on species distributions. Glob. Change Biol. 12, 2272–2281. doi: 10.1111/j.1365-2486.2006.01256.x
Houghton, R. A. (2005). Aboveground forest biomass and the global carbon balance. Glob. Change Biol. 11, 945–958. doi: 10.1111/j.1365-2486.2005.00955.x
Houghton, R. A., Butman, D., Bunn, A. G., Krankina, O. N., Schlesinger, P., and Stone, T. A. (2007). Mapping Russian forest biomass with data from satellites and forest inventories. Environ. Res. Lett. 2:045032. doi: 10.1088/1748-9326/2/4/045032
Huston, M. (1994). Biological Diversity: The Coexistence of Species on Changing Landscapes. Cambridge: Cambridge University Press.
Innangi, M., d'Alessandro, F., Fioretto, A., and Di Febbraro, M. (2015). Modeling distribution of Mediterranean beech forests and soil carbon stock under climate change scenarios. Clim. Res. 66, 25–36. doi: 10.3354/cr01323
IPCC (2013). Working Group I Contribution to the IPCC Fifth Assessment Report, Climate Change 2013: The Physical Science Basis. Ipcc, AR5(March 2013).
Ivanova, G. A., Ivanov, V. A., Kukavskaya, E. A., and Soja, A. J. (2010). The frequency of forest fires in Scots pine stands of Tuva, Russia. Environ. Res. Lett. 5:015002. doi: 10.1088/1748-9326/5/1/015002
Ivanter, V. V. (2016). Strategy of transition to economic growth. Stud. Russ. Econ. Dev. 27, 1–4. doi: 10.1134/S1075700716010056
Jones, T., Ratsimba, H., Ravaoarinorotsihoarana, L., Cripps, G., and Bey, A. (2014). Ecological variability and carbon stock estimates of mangrove ecosystems in northwestern Madagascar. Forests 5, 177–205. doi: 10.3390/f5010177
Kanagaraj, R., Wiegand, T., Mohamed, A., and Kramer-Schadt, S. (2013). Modelling species distributions to map the road towards carnivore conservation in the tropics. Raffles Bull. Zool. 28(Suppl.), 85–107.
Kharuk, V. I., Dvinskaya, M. L., Ranson, K. J., and Im, S. T. (2005). Expansion of evergreen conifers to the larch-dominated zone and climatic trends. Russ. J. Ecol. 36, 164–170. doi: 10.1007/s11184-005-0055-5
Kicklighter, D. W., Cai, Y., Zhuang, Q., Parfenova, E. I., Paltsev, S., Sokolov, A. P., et al. (2014). Potential influence of climate-induced vegetation shifts on future land use and associated land carbon fluxes in Northern Eurasia. Environ. Res. Lett. 9:035004. doi: 10.1088/1748-9326/9/3/035004
Kira, T. (1945). A New Classification of Climate in Eastern Asia as the Basis for Agricultural Geography. Kyoto: Horticultural Institute; Kyoto University.
Knutti, R., and Sedláček, J. (2013). Robustness and uncertainties in the new CMIP5 climate model projections. Nat. Clim. Change 3, 369–373. doi: 10.1038/nclimate1716
Komkov, N. I. (2014). Complex forecast of scientific and technological development: experience and lessons learned. Stud. Russ. Econ. Dev. 25, 111–121. doi: 10.1134/S1075700714020051
Körner, C., Basler, D., Hoch, G., Kollas, C., Lenz, A., Randin, C. F., et al. (2016). Where, why and how? Explaining the low-temperature range limits of temperate tree species. J. Ecol. 104, 1076–1088. doi: 10.1111/1365-2745.12574
Kottek, M., Grieser, J., Beck, C., Rudolf, B., and Rubel, F. (2006). World map of the Köppen-Geiger climate classification updated. Meteorol. Zeitsch. 15, 259–263. doi: 10.1127/0941-2948/2006/0130
Lexer, M. J., and Hönninger, K. (2004). Effects of error in model input: experiments with a forest patch model. Ecol. Model. 173, 159–176. doi: 10.1016/j.ecolmodel.2003.08.018
Loarie, S. R., Duffy, P. B., Hamilton, H., Asner, G. P., Field, C. B., and Ackerly, D. D. (2009). The velocity of climate change. Nature 462, 1052–1055. doi: 10.1038/nature08649
Lobo, J. M., Jiménez-Valverde, A., and Hortal, J. (2010). The uncertain nature of absences and their importance in species distribution modelling. Ecography 33, 103–114. doi: 10.1111/j.1600-0587.2009.06039.x
MacDonald, G. M., Kremenetski, K. V., and Beilman, D. W. (2008). Climate change and the northern Russian treeline zone. Philos. Trans. R. Soc. B Biol. Sci. 363, 2283–2299. doi: 10.1098/rstb.2007.2200
Marchi, M., Nocentini, S., and Ducci, F. (2016). Future scenarios and conservation strategies for a rear-edge marginal population of Pinus nigra Arnold in Italian central Apennines. For. Syst. 25:e072. doi: 10.5424/fs/2016253-09476
Mastrandrea, M. D., Mach, K. J., Plattner, G.-K., Edenhofer, O., Stocker, T. F., Field, C. B., et al. (2011). The IPCC AR5 guidance note on consistent treatment of uncertainties: a common approach across the working groups. Clim. Change 108, 675–691. doi: 10.1007/s10584-011-0178-6
McKenney, D. W., Pedlar, J. H., Lawrence, K., Campbell, K., and Hutchinson, M. F. (2007). Potential impacts of climate change on the distribution of North American trees. Bioscience 57, 939–948. doi: 10.1641/B571106
Millar, C. I., Stephenson, N. L., and Stephens, S. L. (2007). Climate change and forest of the future: managing in the face of uncertanity. Ecol. Appl. 17, 2145–2151. doi: 10.1890/06-1715.1
Miller, J. (2010). Species distribution modeling. Geogr. Compass 4, 490–509. doi: 10.1111/j.1749-8198.2010.00351.x
Mollicone, D., Eva, H. D., and Achard, F. (2006). Ecology: human role in Russian wild fires. Nature 440, 436–437. doi: 10.1038/440436a
Naimi, B., and Araújo, M. B. (2016). sdm: a reproducible and extensible R platform for species distribution modelling. Ecography 39, 368–375. doi: 10.1111/ecog.01881
Noce, S., Collalti, A., and Santini, M. (2017). Likelihood of changes in forest species suitability, distribution, and diversity under future climate: the case of Southern Europe. Ecol. Evol. 7, 9358–9375. doi: 10.1002/ece3.3427
Ochoa-Ochoa, L. M., Flores-Villela, O. A., and Bezaury-Creel, J. E. (2016). Using one vs. many, sensitivity and uncertainty analyses of species distribution models with focus on conservation area networks. Ecol. Model. 320, 372–382. doi: 10.1016/j.ecolmodel.2015.10.031
Pearson, R. G., and Dawson, T. P. (2003). Predicting the impacts of climate change on the distribution of species: are bioclimate envelope models useful? Glob. Ecol. Biogeogr. 12, 361–371. doi: 10.1046/j.1466-822X.2003.00042.x
Peel, M. C., Finlayson, B. L., and McMahon, T. A. (2007). Updated world map of the Köppen-Geiger climate classification. Hydrol. Earth Syst. Sci. 11, 1633–1644. doi: 10.5194/hess-11-1633-2007
Perugini, L., Caporaso, L., Marconi, S., Cescatti, A., Quesada, B., de Noblet-Ducoudré, N., et al. (2017). Biophysical effects on temperature and precipitation due to land cover change. Environ. Res. Lett. 12:053002. doi: 10.1088/1748-9326/aa6b3f
Phillips, S. J., Anderson, R. P., and Schapire, R. E. (2006). Maximum entropy modeling of species geographic distributions. Ecol. Model. 190, 231–259. doi: 10.1016/j.ecolmodel.2005.03.026
Piani, C., Weedon, G., Best, M., Gomes, S., Viterbo, P., Hagemann, S., et al. (2010). Statistical bias correction of global simulated daily precipitation and temperature for the application of hydrological models. J. Hydrol. 395, 199–215. doi: 10.1016/j.jhydrol.2010.10.024
Piovesan, G., and Adams, J. M. (2000). Carbon balance gradient in European forests: interpreting EUROFLUX. J. Veget. Sci. 11, 923–926. doi: 10.2307/3236563
Pogosov, I. A. (2015). Factors of long-term economic growth: scientific and technical progress and capital intensity of production. Stud. Russ. Econ. Dev. 26, 423–433. doi: 10.1134/S1075700715050111
Potapov, P., Yaroshenko, A., Turubanova, S., Dubinin, M., Laestadius, L., Thies, C., et al. (2008). Mapping the World's intact forest landscapes by remote sensing. Ecol. Soc. 13:art51. doi: 10.5751/ES-02670-130251
Riahi, K., Rao, S., Krey, V., Cho, C., Chirkov, V., Fischer, G., et al. (2011). RCP 8.5-A scenario of comparatively high greenhouse gas emissions. Clim. Change 109:33. doi: 10.1007/s10584-011-0149-y
Rivas-martínez, S. (2004). Bioclimatic Map of Europe: Bioclimates, Scale 1:16 Mill. Cartographic Service, University of León.
Santini, M., and di Paola, A. (2015). Changes in the world rivers' discharge projected from an updated high resolution dataset of current and future climate zones. J. Hydrol. 531, 768–780. doi: 10.1016/j.jhydrol.2015.10.050
Schaphoff, S., Lucht, W., Gerten, D., Sitch, S., Cramer, W., and Prentice, I. C. (2006). Terrestrial biosphere carbon storage under alternative climate projections. Clim. Change 74, 97–122. doi: 10.1007/s10584-005-9002-5
Schaphoff, S., Reyer, C. P., Schepaschenko, D., Gerten, D., and Shvidenko, A. (2016). Tamm Review: observed and projected climate change impacts on Russia's forests and its carbon balance. For. Ecol. Manage. 361, 432–444. doi: 10.1016/j.foreco.2015.11.043
Schepaschenko, D. G., Shvidenko, A. Z., Lesiv, M. Y., Ontikov, P. V., Shchepashchenko, M. V., and Kraxner, F. (2015). Estimation of forest area and its dynamics in Russia based on synthesis of remote sensing products. Contemp. Probl. Ecol. 8, 811–817. doi: 10.1134/S1995425515070136
Scherrer, D., Massy, S., Meier, S., Vittoz, P., and Guisan, A. (2017). Assessing and predicting shifts in mountain forest composition across 25 years of climate change. Divers. Distrib. 23, 517–528. doi: 10.1111/ddi.12548
Shuman, J. K., Shugart, H. H., and O'Halloran, T. L. (2011). Sensitivity of Siberian larch forests to climate change. Glob. Change Biol. 17, 2370–2384. doi: 10.1111/j.1365-2486.2011.02417.x
Shuman, J. K., Tchebakova, N. M., Parfenova, E. I., Soja, A. J., Shugart, H. H., Ershov, D., et al. (2015). Forest forecasting with vegetation models across Russia 1. Can. J. For. Res. 45, 175–184. doi: 10.1139/cjfr-2014-0138
Shvidenko, A. Z., Gustafson, E., McGuire, A. D., Kharuk, V. I., Schepaschenko, D. G., Shugart, H. H., et al. (2013). “Terrestrial ecosystems and their change,” in Regional Environmental Changes in Siberia and Their Global Consequences, eds P. Y. Groisman and G. Gutman (Dordrecht: Springer Environmental Science and Engineering), 111–154.
Soja, A. J., Tchebakova, N. M., French, N. H., Flannigan, M. D., Shugart, H. H., Stocks, B. J., et al. (2007). Climate-induced boreal forest change: predictions versus current observations. Glob. Planet. Change 56, 274–296. doi: 10.1016/j.gloplacha.2006.07.028
Suckow, F., Lasch-Born, P., Gerstengarbe, F.-W., Werner, P. C., and Reyer, C. P. O. (2016). Climate change impacts on a pine stand in Central Siberia. Region. Environ. Change 16, 1671–1683. doi: 10.1007/s10113-015-0915-x
Sykes, M. T., Prentice, I. C., and Cramer, W. (1996). A bioclimatic model for the potential distributions of north European tree species under present and future climates. J. Biogeogr. 23, 203–233.
Taylor, K. E., Stouffer, R. J., and Meehl, G. A. (2012). An overview of CMIP5 and the experiment design. Bull. Am. Meteorol. Soc. 93, 485–498. doi: 10.1175/BAMS-D-11-00094.1
Tchebakova, N. M., Parfenova, E., and Soja, a. J. (2009). The effects of climate, permafrost and fire on vegetation change in Siberia in a changing climate. Environ. Res. Lett. 4:045013. doi: 10.1088/1748-9326/4/4/045013
Tchebakova, N. M., Parfenova, E., Soja, A. J., and Baltzer, H. (2010a). “Chapter 5: Potential climate-induced vegetation change in Siberia in the twenty-first century,” in Environmental Change in Siberia: Earth Observation, Field Studies and Modelling, Vol. 40, ed H. Baltzer (Dordrecht: Springer), 67–82.
Tchebakova, N. M., and Parfenova, E. I. (2012). The 21st century climate change effects on the forests and primary conifers in central Siberia. Bosque (Valdivia) 33, 7–8. doi: 10.4067/S0717-92002012000300004
Tchebakova, N. M., Parfenova, E. I., Korets, M. A., and Conard, S. G. (2016). Potential change in forest types and stand heights in central Siberia in a warming climate. Environ. Res. Lett. 11:035016. doi: 10.1088/1748-9326/11/3/035016
Tchebakova, N. M., Parfenova, E. I., and Soja, A. J. (2011). Climate change and climate-induced hot spots in forest shifts in central Siberia from observed data. Region. Environ. Change 11, 817–827. doi: 10.1007/s10113-011-0210-4
Tchebakova, N. M., Rehfeldt, G., and Parfenova, E. (2010b). From vegetation zones to climatypes: effects of climate warming on Siberian ecosysyems. Permafrost Ecosyst. 209, 3–15. doi: 10.1007/978-1-4020-9693-8_22
Tchebakova, N. M., Rehfeldt, G., and Parfenova, E. I. (2006). Impacts of climate change on the distribution of Larix Spp. and pinus sylvestris and their climatypes in Siberia. Mitig. Adapt. Strat. Glob. Change 11, 861–882. doi: 10.1007/s11027-005-9019-0
Thompson, I., Mackey, B., McNulty, S., and Mosseler, A. (2009). Forest Resilience, Biodiversity, and Climate Change. Montreal, QC: Secretariat of the Convention on Biological Diversity.
Thomson, A. M., Calvin, K. V., Smith, S. J., Kyle, G. P., Volke, A., Patel, P., et al. (2011). RCP4.5: A pathway for stabilization of radiative forcing by 2100. Clim. Change 109, 77–94. doi: 10.1007/s10584-011-0151-4
Thornthwaite, C. W. (1948). An approach toward a rational classification of climate. Geogr. Rev. 38:55. doi: 10.2307/210739
Thuiller, W., Brotons, L., Araújo, M. B., and Lavorel, S. (2004). Effects of restricting environmental range of data to project current and future species distributions. Ecography 27, 165–172. doi: 10.1111/j.0906-7590.2004.03673.x
Thuiller, W., Lafourcade, B., Engler, R., and Araújo, M. B. (2009). BIOMOD - A platform for ensemble forecasting of species distributions. Ecography 32, 369–373. doi: 10.1111/j.1600-0587.2008.05742.x
Tikhonova, E., Tikhonov, G., Shevchenko, N., Knyazeva, S., Plotnikova, A., Lukina, N., et al. (2017). Tree diversity patterns along the latitudinal gradient in the northwestern Russia. For. Ecosyst. 4:27. doi: 10.1186/s40663-017-0114-y
Trumbore, S., Brando, P., and Hartmann, H. (2015). Forest health and global change. Science 349, 814–818. doi: 10.1126/science.aac6759
Uppala, S. M., Kallberg, P. W., Simmons, A. J., Andrae, U., Bechtold, V. D. C., Fiorino, M., et al. (2005). The ERA-40 re-analysis. Q. J. R. Meteorol. Soc. 131, 2961–3012. doi: 10.1256/qj.04.176
Valentini, R., Matteucci, G., Dolman, A. J., Schulze, E.-D., Rebmann, C., Moors, E. J., et al. (2000). Respiration as the main determinant of carbon balance in European forests. Nature 404, 861–865. doi: 10.1038/35009084
van Vuuren, D. P., Edmonds, J., Kainuma, M., Riahi, K., Thomson, A., Hibbard, K., et al. (2011). The representative concentration pathways: an overview. Clim. Change 109, 5–31. doi: 10.1007/s10584-011-0148-z
VanDerWal, J., Shoo, L. P., Graham, C., and Williams, S. E. (2009). Selecting pseudo-absence data for presence-only distribution modeling: how far should you stray from what you know? Ecol. Model. 220, 589–594. doi: 10.1016/j.ecolmodel.2008.11.010
Warszawski, L., Friend, A., Ostberg, S., Frieler, K., Lucht, W., Schaphoff, S., et al. (2013). A multi-model analysis of risk of ecosystem shifts under climate change. Environ. Res. Lett. 8:044018. doi: 10.1088/1748-9326/8/4/044018
Watling, J. I., Brandt, L. A., Bucklin, D. N., Fujisaki, I., Mazzotti, F. J., Romañach, S. S., et al. (2015). Performance metrics and variance partitioning reveal sources of uncertainty in species distribution models. Ecol. Model. 309–310, 48–59. doi: 10.1016/j.ecolmodel.2015.03.017
Weedon, G. P., Gomes, S., Viterbo, P., Shuttleworth, W. J., Blyth, E., Österle, H., et al. (2011). Creation of the WATCH forcing data and its use to assess global and regional reference crop evaporation over land during the twentieth century. J. Hydrometeorol. 12, 823–848. doi: 10.1175/2011JHM1369.1
Xu, L., Myneni, R. B., Chapin, F. S., Callaghan, T. V., Pinzon, J. E., Tucker, C. J., et al. (2013). Temperature and vegetation seasonality diminishment over northern lands. Nat. Clim. Change 3, 581–586. doi: 10.1038/nclimate1836
Yalcin, S., and Leroux, S. J. (2017). Diversity and suitability of existing methods and metrics for quantifying species range shifts. Glob. Ecol. Biogeogr. 26, 609–624. doi: 10.1111/geb.12579
Zhang, L., Liu, S., Sun, P., Wang, T., Wang, G., Zhang, X., et al. (2015). Consensus forecasting of species distributions: the effects of niche model performance and niche properties. PLoS ONE 10:e0120056. doi: 10.1371/journal.pone.0120056
Keywords: The Russian Federation, forests, climate change, SDM, BIOMOD, impacts, geographic ranges, biogeography
Citation: Noce S, Caporaso L and Santini M (2019) Climate Change and Geographic Ranges: The Implications for Russian Forests. Front. Ecol. Evol. 7:57. doi: 10.3389/fevo.2019.00057
Received: 29 July 2018; Accepted: 15 February 2019;
Published: 19 March 2019.
Edited by:
Anouschka R. Hof, Wageningen University & Research, NetherlandsReviewed by:
Cristian Torres, University of the Bío Bío, ChileGenoveva Rodriguez-Castaneda, Saint Francis University, United States
Copyright © 2019 Noce, Caporaso and Santini. This is an open-access article distributed under the terms of the Creative Commons Attribution License (CC BY). The use, distribution or reproduction in other forums is permitted, provided the original author(s) and the copyright owner(s) are credited and that the original publication in this journal is cited, in accordance with accepted academic practice. No use, distribution or reproduction is permitted which does not comply with these terms.
*Correspondence: Sergio Noce, c2VyZ2lvLm5vY2VAY21jYy5pdA==