Abstract
The possibility that N fertilizer increases soil organic matter (SOM) mineralization and, as a result, reduces SOM stocks has led to a great debate about the long-term sustainability of maize-based agroecosystems as well as the best method to estimate fertilizer N use efficiency (FNUE). Much of this debate is because synthetic N fertilizer can positively or negatively affect SOM mineralization via several direct and indirect pathways. Here, we test a series of hypotheses to determine the direction, magnitude, and mechanism of N fertilizer effect on SOM mineralization and discuss the implications for methods to estimate FNUE. We measured the effect of synthetic N fertilizer on SOM mineralization via gross ammonification at two long-term experiments in central and southern Iowa, USA with replicated plots of continuous maize that received one of three “historical” N fertilizer rates (zero, moderate or high) from 1999 to 2014. In 2015, prior to our measurements, we split the historical N fertilizer rate plots into two subplots that received either the site-specific agronomic optimum N rate or zero N fertilizer. At the onset of rapid maize N uptake, N fertilizer reduced gross ammonification by 13–21% (2–5 kg NH4-N ha−1 d−1). A companion laboratory experiment rejected the hypothesis that differences in net primary productivity between fertilized and unfertilized treatments explained the negative effect of N fertilizer on SOM mineralization. Moreover, the pool size was negatively correlated with the gross ammonification rate (r2 = 0.85, p < 0.001). Thus, we conclude that -N fertilizer had a direct suppressive effect on SOM mineralization. These results demonstrate that the direct effect of N fertilizer on microbial activity can exceed the indirect effects of N fertilizer via large changes in NPP that alter organic matter inputs, soil temperature and moisture content. The magnitude of this effect and specificity to -N has significant implications for fertilizer management as well as the measurement and modeling of agroecosystem N dynamics including FNUE.
Introduction
Efficient use of nitrogen (N) fertilizer is important for economic crop production, environmental quality, and human health (Cassman, 1999). In some regions of the world, excessive and inefficient synthetic N fertilization harms the environment. In other regions of the world, more synthetic N fertilization would boost crop production and human health (Vitousek et al., 2009). However, there is a great debate about the long-term sustainability of synthetic N fertilization (Robertson et al., 2013). Some reports indicate that synthetic N fertilizer reduces SOM stocks because it enhances soil organic matter (SOM) mineralization (Mulvaney et al., 2009; Russell et al., 2009); other reports indicate that it increases SOM stocks, particularly at the agronomically optimum N fertilizer rate (AONR) because it increases net primary productivity (NPP; Poffenbarger et al., 2017).
Much of this debate occurs because synthetic N fertilizer can positively or negatively affect SOM mineralization via several direct and indirect pathways (Table 1). Synthetic N fertilizer can have a direct positive effect on SOM mineralization by altering microbial activity and biomass. Stoichiometric decomposition theory predicts that if N is a limiting resource, inorganic N inputs will increase microbial biomass and activity thereby increasing SOM mineralization (Sterner and Elser, 2002; Chen et al., 2014). Inorganic N can also have an indirect positive effect on SOM mineralization by increasing net primary productivity (NPP), and this effect could be particularly important in maize-based agroecosystems where inorganic N inputs can increase NPP by more than 200% (Poffenbarger et al., 2017). An increase in NPP, including rhizodeposition, can increase SOM mineralization by increasing microbial biomass or enzyme activity and this effect is often referred to as “positive priming” (Cheng, 2009; Chen et al., 2014).
Table 1
| Direction | Mechanism | Mode of action | Effect on measurement of FNUE |
|---|---|---|---|
| 1) No effect | i) N/A* | N/A | None |
| 2) Positive | ii) Positive priming due to rhizodeposition iii) Stoichiometry theory (positive priming) | Indirect Direct | Overestimation Overestimation |
| 3) Negative | iv) Lower soil water content and temperature v) N mining theory (negative priming) | Indirect Direct | Underestimation Underestimation |
Potential directions and mechanisms of effects of synthetic nitrogen (N) fertilizer addition on SOM mineralization and the respective impacts on the measurement of fertilizer nitrogen use efficiency (FNUE) by the “N difference method.”
Not applicable.
Contrary to these positive effects, synthetic N fertilizer can also have negative effects on SOM mineralization. Inorganic N can have a direct negative effect on microbial activity. Microbial N mining theory predicts that, if N is a limiting resource, inorganic N inputs will decrease SOM mineralization by decreasing the decomposition of energy-poor SOM substrates that are mineralized solely to access N-containing compounds (Moorhead and Sinsabaugh, 2006; Craine et al., 2007). Inorganic N can also have an indirect effect on SOM mineralization via changes in broader ecosystem function: the large increase in NPP with fertilizer addition reduces soil moisture (transpiration) and temperature (shading), which decreases SOM mineralization (Parton et al., 1987; Wang et al., 2006; Li et al., 2014).
These potential effects of N fertilizer on SOM mineralization have led to confusion about the accuracy of methods to estimate fertilizer N use efficiency (FNUE)—methods that are critical to improve the sustainability of cereal-based cropping systems. Typically defined as the percentage of fertilizer N recovered in aboveground plant biomass, FNUE is an important parameter to estimate N use efficiency (NUE) of cropping systems. Currently, there are two methods used to determine FNUE, however, they consistently produce different results (Cassman et al., 2002). The “N difference” method is an indirect measure that estimates FNUE based on the difference in N uptake between a fertilized and an unfertilized crop:
where, NF = total plant N uptake from fertilized plots, NC = total N uptake from unfertilized plots and R = rate of N fertilizer applied (Varvel and Peterson, 1990). In contrast, the “15N tracer” method is a direct measure that calculates FNUE based on plant uptake of an isotopically labeled fertilizer (Hauck and Bremner, 1976):
The “N difference” method (Equation 1) typically estimates greater FNUE than the direct “tracer” method (Equation 2; Jansson and Persson, 1982; Cassman et al., 2002).
This result is consistent with the suggestion that N fertilizer enhances SOM mineralization (Khan et al., 2007; Robertson et al., 2013), which has been hypothesized to be a consequence of a positive “priming effect” (Fontaine et al., 2003; Cheng, 2009; Kuzyakov, 2010). In this case, the N-fertilized (NF, Equation 1) plot has greater non-fertilizer inorganic N availability than the zero-N control plot (NC, Equation 1) because the N fertilizer increased SOM mineralization. This difference in N availability violates the assumption of equal crop N uptake from non-fertilizer sources in the fertilized and unfertilized treatments (i.e., mineralized SOM N is equal in the fertilized and unfertilized plots). Such a violation of methodological assumptions would artificially inflate FNUE as measured by the “N difference” method.
Alternatively, the “15N tracer” method may provide an artificially low FNUE due to “pool substitution” (Cassman et al., 2002). In this case, 15N fertilizer substitutes with native SOM-N during N immobilization-mineralization processes without a net change in the inorganic N pool. This dilutes the 15N enrichment of fertilizer, resulting in artificially low FNUE (Hauck and Bremner, 1976; Jansson and Persson, 1982; Harmsen and Moraghan, 1988). Pool substitution of 15N is particularly pronounced where rates of N immobilization are high, such as in soils with large amounts of high C/N ratio plant residue (Jenkinson et al., 1985).
Coupled field and laboratory experiments (in the presence and absence of plants and their effects on environmental conditions) can separate the potential direct and indirect effects of N fertilizer on SOM mineralization and identify any systematic bias in measurements of FNUE with the “N difference” method (Table 1). Field experiments can test for the direction and agronomic relevance of an effect. If N fertilizer does not affect SOM mineralization, we can reject a “priming effect” and resultant overestimation of FNUE by the “N difference method.” In this case, there is no need for coupled laboratory experiments. In contrast, if N fertilizer increases or decreases SOM mineralization the “N difference method” will, respectively, overestimate or underestimate FNUE. In this case, controlled laboratory experiments can isolate the mechanism of effect by separating the direct effect of N fertilizer on microbial activity (Table 1; iii and v) from the indirect effects of N fertilizer on microbial activity via changes in crop growth and rhizodeposition (Table 1; ii and iv). Laboratory experiments would not detect indirect positive or negative effects of NPP on SOM mineralization and thus can be used to test for direct effects of N fertilizer on SOM mineralization. If the effect of N fertilizer on SOM mineralization observed in the laboratory (in the absence of plants to exclude indirect effect) is similar to that observed in the field, the increase or decrease in SOM mineralization can be attributed to a direct effects of N fertilizer addition on microbial activity.
This study had two main objectives: (1) At two key times of maize growth, we determined the magnitude and mechanism of the N fertilizer effect on SOM mineralization; (2) Using our results from Objective 1, we evaluated the “N difference” method for measurement of FNUE. To execute these objectives, we measured SOM mineralization via gross ammonification assays in two Midwest USA continuous maize (Zea mays L.) cropping systems with different soil types, yield potentials, and long-term mean AONRs.
Materials and Methods
Site History: 1999–2014
This study was conducted at two sites: central Iowa (42°01′N; 93°47′W) and southern Iowa (40°58′N; 93°25′W). The sites differ in soil properties and glacial history but have been managed as annual cropland for more than 25 years. Mean annual temperature from 1994 to 2014 was 9.1°C at the central site and 9.5°C at the southern site; mean annual precipitation was 970 mm at the central site and 980 mm at the southern site1. The central site is underlain by artificial subsurface drainage whereas the southern site is not. Largely due to the different soil properties and drainage management, there is a large difference in water-limited maize yield potential at the two sites (Table 2).
Table 2
| Site | USDA soil taxonomy | USDA texture | Sand-Silt-Clay (%) (15” depth) | Bulk density (g cm−3) | Artificial sub-surface drainage | 2015 mean temperature (°C) | 2015 cumulative precipitation (mm) | Long term AONR (kg N ha−1)* | Maize yield at AONR (Mg ha−1)* |
|---|---|---|---|---|---|---|---|---|---|
| Central | Hapludolls | Loam | 45-34-21 | 1.34 | Yes | 9.3 | 1300 | 202 | 11.35 |
| Southern | Argiaquolls | Silt loam | 5-74-21 | 1.29 | No | 9.8 | 1226 | 269 | 9.38 |
Selected soil and agronomic properties and climatic conditions at two experimental sites in Iowa.
Bulk density was measured on 0–15 cm soil samples. 2015 cumulative precipitation and mean temperature over the study year for each location (2015). Precipitation and temperature data were from Iowa Environment Mesonet1.
Long-term Agronomic optimum N rate (AONR) and maize yield at the AONR from 2000-2014.
In 1999, experiments were established to determine maize grain yield response to inorganic N fertilizer and the N fertilizer rate at which yield no longer positively responds to additional N fertilization (i.e., the agronomic optimum N rate, AONR) in continuous maize cropping systems at each site. Individual plots received one of five (central) or seven (southern) N fertilizer rates ranging from 0 to 269 kg N ha−1y−1. The experimental design was a randomized complete block with four replicates of each N fertilizer rate. Each plot received the same N fertilizer application rate from 1999 to 2014. All experimental plots were conventionally managed with fall chisel plowing and spring secondary tillage before planting. Herbicides, pesticides, all nutrients other than N, and pH were maintained for optimum production. The southern site had a greater long-term AONR despite lower maize yields (Table 2). Data about historical crop yield response to N fertilizer and long-term change in soil organic carbon from 1999 to 2014 are reported in Poffenbarger et al. (2017).
Experimental Design: 2015
The study reported herein was conducted in 2015. For this study, we selected three of the historical N rates at each site: zero (0 kg N ha−1), moderate (202 and 224 kg N ha−1 at central and southern sites, respectively), and high (269 kg N ha−1). Based on the 1999–2014 data, at the central site, the moderate rate was the AONR and the high rate was 33% [(269-202)*100/202] greater than AONR while at the southern site, the moderate rate was 17% [(269-224)*100/269] lower than the AONR and the high rate was the long-term AONR. From here forward, we refer to the historical rates as zero, moderate and high.
Ideally, at both sites, we would have selected the historical zero rate, the AONR, and a rate greater than the AONR. Unfortunately, the southern site did not include a rate greater than the AONR. However, two of the three selected rates are directly comparable across the two sites with reference to the effect on maize yield: the zero and AONR.
In 2015, we split the main long-term plots receiving the three selected historical N rates (zero, moderate, and high) into two subplots (Figure 1). Regardless of the historical N rate, one subplot received the long-term average site-specific AONR and one subplot received no N fertilizer. A 107-day maturity maize hybrid (FS 57QX1) was planted at ~89,000 seeds ha−1 on May 13 at the central site and on April 28 at the southern site. Within 7 d of maize planting, the 1999–2014 AONR at the central (202 kg N ha−1) and southern sites (269 kg N ha−1) was surface applied as a solution of NH4NO3 to one subplot whereas no N (0 kg N ha−1) was applied to the other subplot. Thus, the 2015 experiment included: 3 historical N rates, 4 replicates plots per historical N rate, 2 subplots per historical N rate, and therefore 24 total subplots per site. Each individual sub-plot measured 3.05m x 4.57 m.
Figure 1
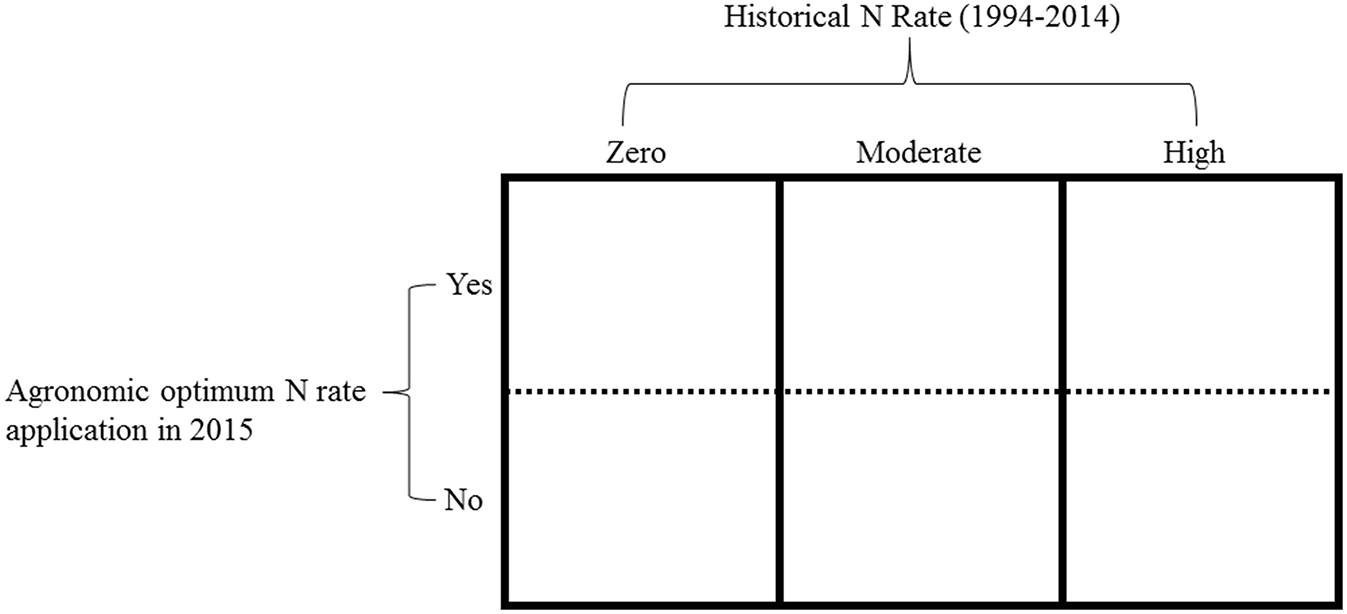
An example of one replicate experimental block. Main plot (columns): the historical N rates, which included, zero (0 kg N ha−1), moderate (202 and 224 kg N ha−1at central and southern sites, respectively) and high (269 kg N ha−1). The split plot (rows): the agronomic optimum N rate (AONR) and zero N applied in 2015.
Soil Organic Carbon and Total Nitrogen
In 2014, soils were sampled from 0 to 15 cm depth in each main plot using 2.5 cm diameter cores after harvest and before tillage. Bulk density was determined for each experimental block. Total soil organic C and N were determined for the main plots using dry combustion elemental analysis.
Soil Moisture, Inorganic N Pools Size, and Gross Ammonification Rate in Field-Fresh Soils
In 2015, on two sampling dates per site, soil samples were collected at a depth of 5–15 cm from all subplots. The two sample dates at each site corresponded to the V5 maize growth stage (5 collared leaves): 16 June, 2015 at central and 2 June, 2015 at southern site, and to the V12 maize growth stage (12 collared leaves): 21 July, 2015 at central site and 8 July, 2015 at southern site. These growth stages are coincident with the onset and midpoint of maximum rate of maize N uptake (Abendroth et al., 2011).
At each of the four sampling events (2 sites × 2 sample times), 10 soil cores of 2.5 cm diameter (5–15 cm soil depth) were taken from random locations capturing different parts of the maize row and inter-row areas within each subplot and bulked to represent one sample for each subplot. The sample depth was selected to collect a soil sample that was representative of the depth of high N uptake and that avoided the effects of daily weather variations. Soil samples were transported to the lab in an insulated cooler. Each bulked sample from each subplot was passed through an 8 mm sieve and gravimetric water content was measured from a 10 g subsample. Nitrate () and ammonium () pool size was also determined by extracting and from a 10 g subsample with 50 ml 2 M potassium chloride (KCl) and subsequent measurement with colorimetry (Hood-Nowotny et al., 2010).
Gross ammonification rate (i.e., the conversion of SOM-N to ) was used to determine the direction of effect of N fertilizer addition on SOM mineralization. Within 24 h of sampling, gross ammonification rate was measured on the field-fresh soils during a 24 h incubation using conventional 15N isotope pool dilution method (Hart et al., 1994) with blank correction (Stark and Hart, 1996) that was adapted to intensively managed Iowa agricultural soils (Osterholz et al., 2017). As a result, these assays were made at the sampled moisture content (which differed across treatments) and room temperature (21°C) which was very similar to field temperature.
Isolating the Effect of Inorganic N Fertilizer on Gross Ammonification
To test the mechanism of fertilizer effect on gross ammonification, we conducted additional gross ammonification rate assays that controlled for the effects of NPP by selecting soils from one treatment (i.e., the same NPP) and standardizing soil moisture contents (which differed across treatments in the assays made on field-fresh soils). For these assays, we used soils collected for measurement of gross ammonification at the V5 growth stage (see section Soil Moisture, Inorganic N Pools Size, and Gross Ammonification Rate in Field-Fresh Soils) from only subplots that historically received zero N fertilizer (1999–2014) and zero N fertilizer in 2015 (Figure 1). Prior to analysis, the samples were refrigerated at 4°C. Soils were then brought to room temperature and each sample was split into two subsamples. One subsample received NH4NO3-N fertilizer at an amount that brought the inorganic N concentration to a level similar to that of soils from zero N plots that received the AONR in the field (~23 mg N kg−1 soil at central site, and ~50 mg N kg−1 soil at southern site); the other subsample received zero N fertilizer. Identical soil moisture and temperature were maintained the same across subsamples. Thus, inorganic N concentration was the only difference between these subsamples. After fertilizer addition, gross ammonification was determined during a 24 h incubation.
Across all gross ammonification assays, the addition of 15NH4Cl solution increased the final ammonium pool size by 5–32%, which is well within the natural variability of the soil pool size, and the final atom % 15N enrichment ranged between 0.8 and 4.4%.
Maize Yield and Agronomic Fertilizer N Use Efficiency in 2015
Maize ears were collected by hand from the center two rows of each subplot (yield area = 3.48 m2) at physiological maturity. The entire sample was weighed fresh, and then a six-ear subsample was dried at 60°C. After drying the subsample, the grain was removed from the cobs and each component (grain and cobs) was weighed separately. The grain dry matter yield (in kg ha−1) was calculated by adjusting the fresh ear weight of the entire area to a grain dry weight using the moisture content and grain:cob ratio of the six-ear subsample. Grain yield was adjusted to 15.5% moisture content. Grain N concentration was set at 1.2% to calculate the N harvested with grain (Ciampitti and Vyn, 2012).
Agronomic efficiency (AE) was calculated by using the equation:
where, AE = agronomic efficiency of applied N (kg Δ yield kg−1 N fertilizer applied), Y = grain yield with fertilizer application (kg ha−1), Y0 = grain yield without fertilizer addition (kg ha−1), N = rate of N fertilizer applied (kg ha−1) (Dobermann, 2007).
Data and Statistical Analysis
The difference in gross N mineralization rates within each location and historical N fertilizer rate was calculated by subtracting gross N mineralization rate in the zero-N subplot treatment from that in the AONR subplot treatment. Data were analyzed separately for each site, due to differences in historical N rates, soil properties, and artificial drainage at each site (Table 1). Gross ammonification data were analyzed using a linear mixed model where historical N rates (main plot), AONR application in 2015 (split plot) and maize growth stage (repeated measure) were treated as fixed factors and blocks as a random factor. Maize grain yield data (reported at 15.5% moisture) were analyzed using a linear mixed model with historical N rates (main plot) and AONR in 2015 (split plot) as fixed factors and block as random factor. The SOC, and soil total N data were analyzed using linear mixed model with historical N rate as a fixed factor and block as a random factor. All data analyses were done using PROC MIXED in SAS/STAT software, version 9.3 (SAS Institute, 2013).
Results
Site History: Historical N Fertilizer Rate Effect on Total Soil Organic C and N
There was a significant effect of the historical 15-year N fertilizer application rates on total SOC (p = 0.001 at central, and 0.057 at southern site) and total soil N (p = 0.001 at central, and 0.072 at southern site) contents. At the central site, the moderate and high historical N rate treatments had 20 and 15% higher total SOC concentrations and 17 and 14% higher total N concentrations than the historical zero N treatment (Table 3). At the southern site, the high historical N rate treatments had 6% higher total SOC concentrations and 7% higher total N concentrations than the historical zero N treatment, whereas low and moderate rates had statistically similar total SOC and N concentrations.
Table 3
| Site | Historical N rate | SOC (g kg−1) | Total N (g kg−1) |
|---|---|---|---|
| Central | Zero | 18.23(14.17, 22.28)b | 1.63 (1.37, 1.88)b |
| Central | Moderate | 21.73 (17.67, 25.78)a | 1.93 (1.67, 2.18)a |
| Central | High | 20.9 (16.85, 24.95)a | 1.85 (1.59, 2.11)a |
| Southern | Zero | 21.95 (20.96, 22.94)b | 1.83 (1.71, 1.94)b |
| Southern | Moderate | 23.05 (22.06, 24.04)ab | 1.93(1.81, 2.04)ab |
| Southern | High | 23.35 (22.36, 24.34)a | 1.98 (1.86, 2.09)a |
Mean soil organic C and total N (g kg−1) (95% confidence interval) for historical N rates at central and southern Iowa sites.
Soil organic C and total N were measured on 0–15 cm soil samples in 2014. Different letters represent significant statistical differences among historical N rates within each site (P ≤ 0.05).
Maize Yield and Agronomic Efficiency of N Fertilizer Applied in 2015
At both the sites and across all historical N rates, maize yield was greater in treatments receiving the AONR vs. zero-N (p < 0.001 at both sites) (Figure 2). At the central site, maize yield in the AONR was 114% greater than the zero-N treatment regardless of historical N rate. However, there was a significant interaction between historical N rates (1999–2014) and 2015 AONR application at southern site (p = 0.050). The AONR increased maize yield by 119, 78, and 71% for historical fertilizer rates of zero, moderate and high N rates, respectively (Figure 2).
Figure 2
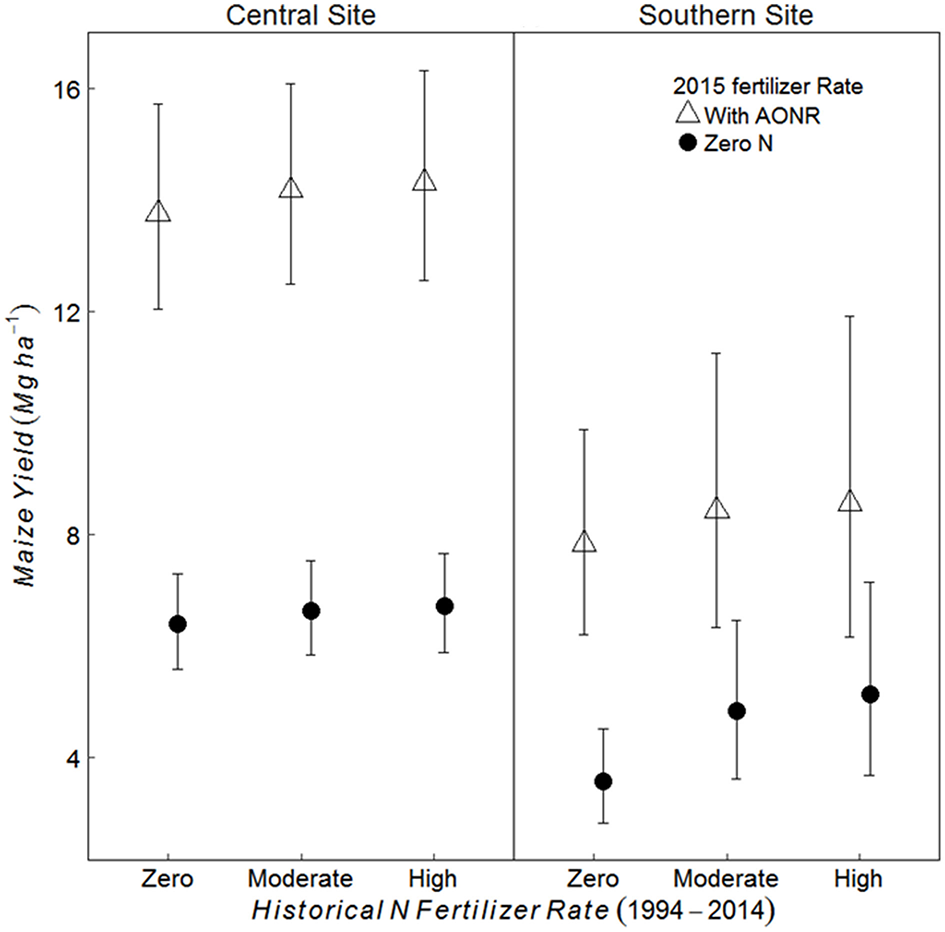
Mean maize yield (Mg grain ha−1) in continuous maize system for three historical N rates of zero, moderate (202 and 224 kg N ha−1 yr−1 for central and southern sites, respectively) and highest rate (269 kg N ha−1 yr−1), applied with agronomic optimum N Rate (AONR) and zero N fertilizer in 2015 at central and southern Iowa sites. Vertical bars represent 95% confidence intervals.
Historical N rate had no effect on AE at either site (Figure 3) (p = 0.789 at central, and 0.634 at southern site). However, the southern site had almost 60% lower AE as compared to that at the central site. Average AE at central and southern sites was 37 and 15 kg grain kg−1 N, respectively. On average over the three historical N rates, 79 kg N/ha was harvested with Zero-N fertilizer at the central site and 54 kg N/ha at the southern site, whereas grain N harvested with fertilizer applied at AONR was 169 and 99 kg N/ha, respectively (data not shown).
Figure 3
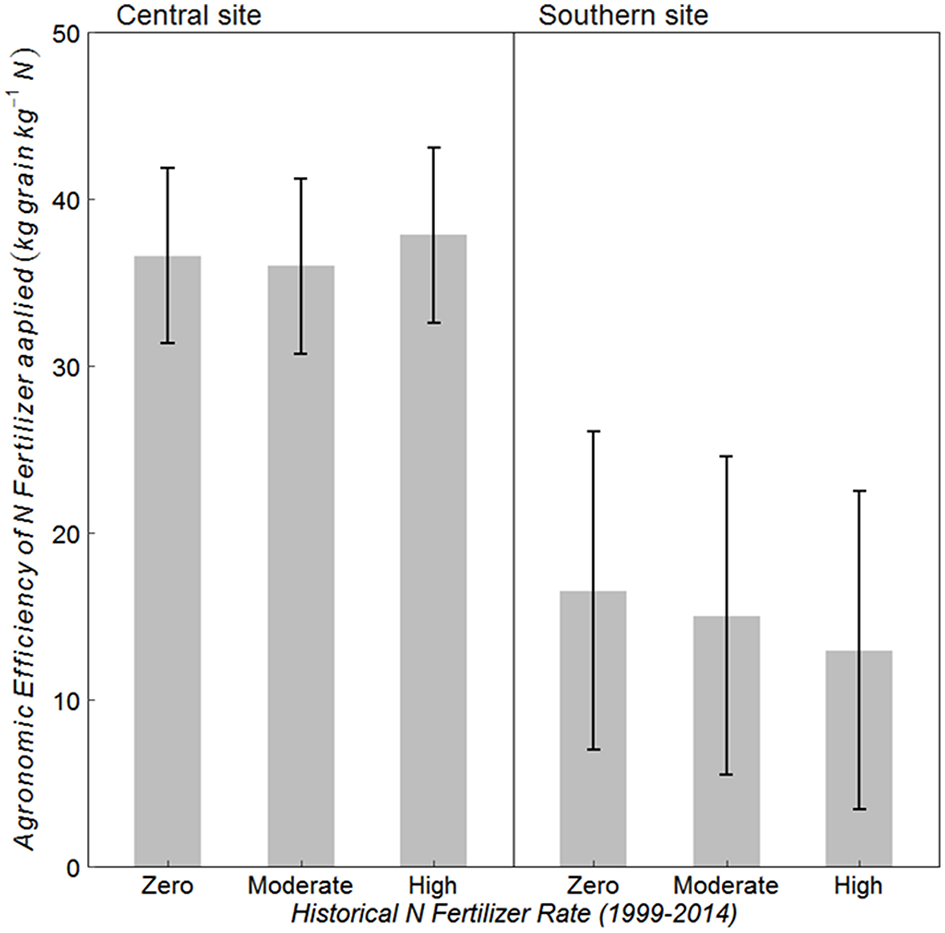
Mean agronomic efficiency (AE) of applied N fertilizer for continuous maize system with three historical N rates (1999–2014) of zero, moderate (202 and 224 kg N ha−1 yr −1 at central and southern sites, respectively) and the highest rate (269 kg N ha−1 yr −1) at the central, and southern Iowa sites. Vertical bars represent 95% confidence intervals.
Soil Moisture Content and Inorganic N Pools Size in Fresh Soils
Historical N rate had significant effect on soil moisture content; soil moisture content in historically moderate and high N fertilizer rates was 6% higher than the historical zero N rate at the central site and 3–4% higher than the historical zero-N rate at the southern site (Figure 4; p = 0.006 at central, < 0.001 at southern site). Soil moisture content was also significantly affected by the AONR application in 2015; it was 3–4% greater in the subplots receiving zero-N vs. the AONR (p < 0.001 at both sites). Soil moisture at the V12 maize growth stage was 13 and 9% lower than at the V5 stage at the central and southern sites, respectively (p < 0.001 at both sites).
Figure 4
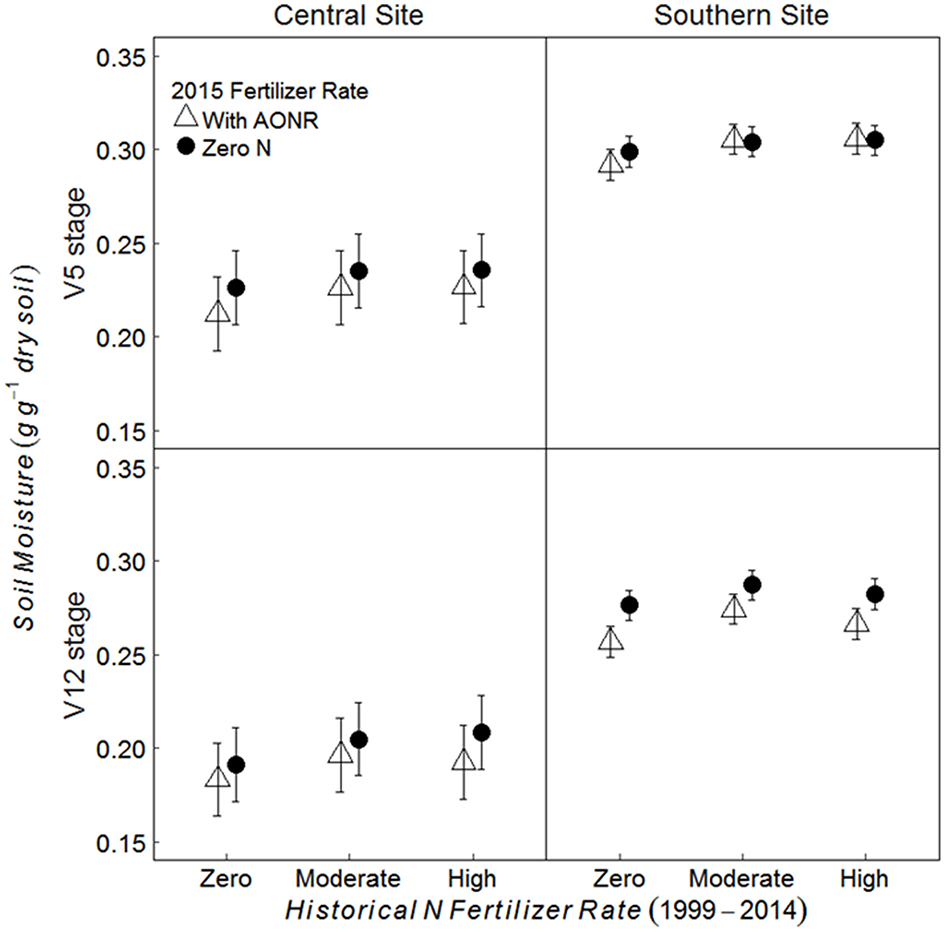
Mean gravimetric soil moisture from 5 to 15 cm at the V5 and V12 maize growth stages in continuous maize systems in central and southern Iowa in 2015. Experimental plots received one of three historical N fertilizer rates from 1999 to 2014 (zero, moderate, or high). Individual plots received the same N rate every year 1999–2014. In 2015, the historical N rate plots were split and received either zero N or the empirically determined long-term agronomic optimum N rate (AONR). Vertical bars represent 95% confidence intervals.
On average, across all historical N fertilizer rates and growth stages, the soil -N pool was 11 and 48% greater in the AONR vs. zero-N subplots at the central and southern Iowa sites, respectively (Figure 5; p = 0.009 at central, and 0.046 at southern site). However, at the southern site, there was a significant interaction between 2015 AONR application and maize growth stage (p = 0.019) such that the soil -N pool was only significantly higher in the AONR vs. zero-N subplots at the V5 growth stage (119% higher in AONR vs. zero-N subplot). The soil -N pool was higher in the AONR compared to the zero-N treatment (277 and 217% greater at central and southern sites, respectively; Figure 5; p < 0.001 at both sites). However, there was a significant interaction between the 2015 AONR application and maize growth stage (p < 0.001 at both sites). At the V5 growth stage, the -N pool was 623 and 708% higher in the AONR than in the zero-N treatments at the central and southern sites, while at the V12 growth stage, the -N pool was similar in the AONR and zero-N treatments.
Figure 5
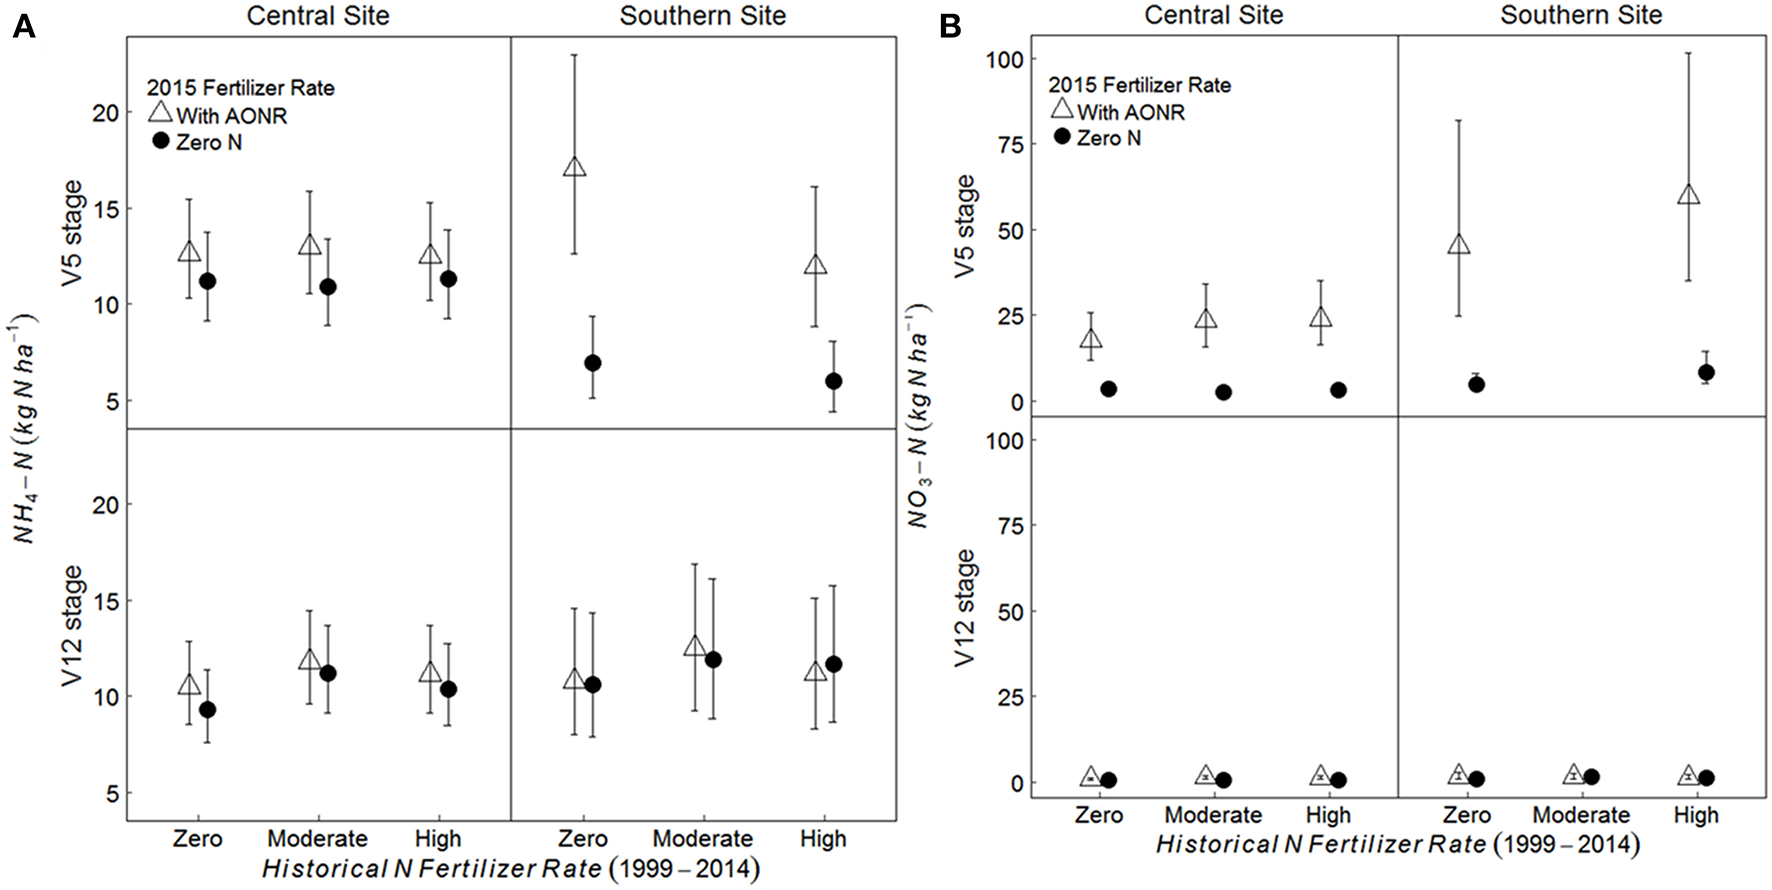
Mean (A) NH4-N and (B) NO3-N pool sizes (kg N ha−1) from 5 to 15 cm soil depth at the V5 and V12 maize growth stages in continuous maize systems in central and southern Iowa in 2015. Experimental plots received one of three historical N fertilizer rates from 1999 to 2014 (zero, moderate, or high). Individual plots received the same N rate every year 1999–2014. In 2015, the historical N rate plots were split and received either zero N or the empirically determined long-term agronomic optimum N rate (AONR). Vertical bars represent 95% confidence intervals. At the southern site, soil samples at the V5 stage were collected only from zero and high historical N rate treatments.
Gross Ammonification Rates in Fresh Soils
At the V5 growth stage at both sites, the 2015 N fertilizer application at the AONR reduced gross ammonification (Figure 6; 2015 AONR × growth stage p = 0.0082 at central, and 0.054 at southern site). However, also at both sites, the effect of the 2015 N fertilizer addition decreased with increasing historical N rate such that the 2015 N fertilizer input had the greatest effect on gross ammonification in the historically zero-N plots and no effect in the historically high N plots. In contrast to the V5 growth stage, N fertilizer had no effect on gross ammonification at the V12 growth stage (Figures S1, S2). Across all historical N rates at the V5 growth stage, the AONR application in 2015 reduced gross ammonification by 15 and 12% at the central and southern sites, respectively.
Figure 6
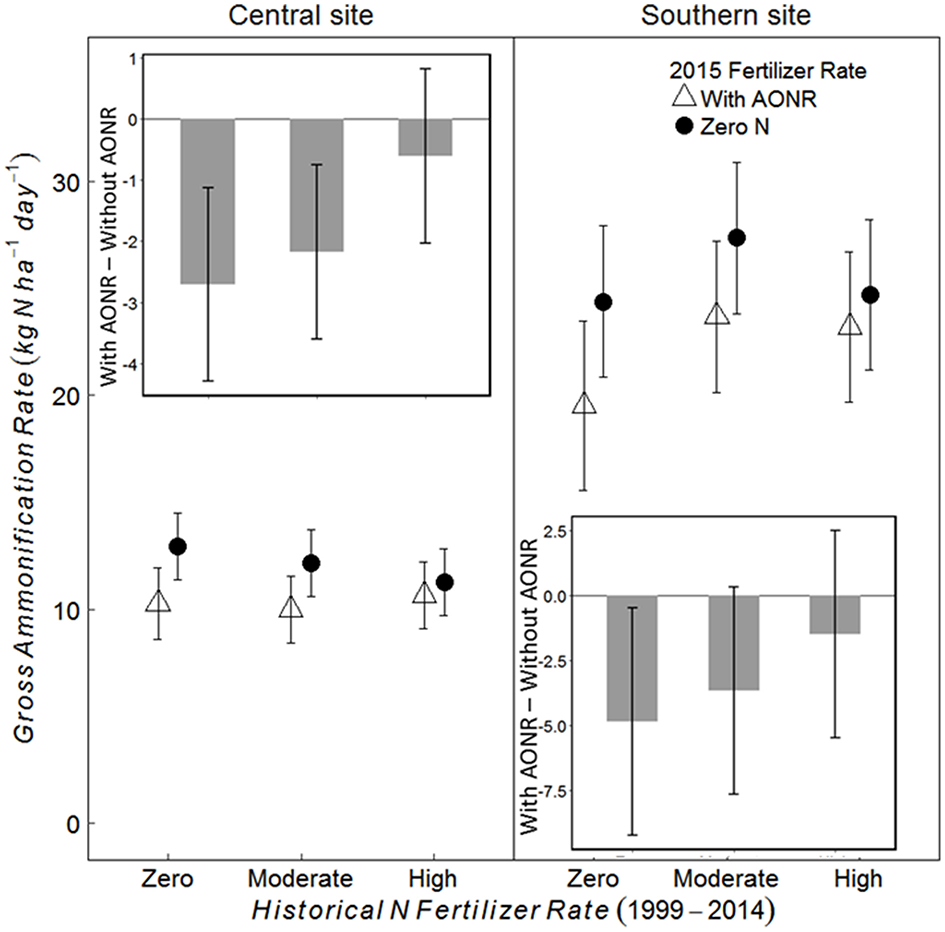
Gross ammonification rate (kg N ha−1 day−1) and the difference (inset) between the gross ammonification rate (kg N ha−1 day−1) with and without agronomic optimum N rate (AONR) application in 2015 in three historical N rate treatments (zero, moderate, and high) at the V5 maize growth stage at central and southern Iowa sites. Individual plots received the same N rate every year 1999–2014. In 2015, the historical N rate plots were split and received either zero N or the empirically determined long-term agronomic optimum N rate (AONR). Vertical bars represent 95% confidence intervals.
Isolated Effect of Synthetic N Fertilizer on Gross Ammonification
The laboratory-controlled addition of N fertilizer to soils that received no N fertilizer input (neither historically nor in 2015) consistently reduced gross ammonification (Figure 7; p < 0.001 at both sites). In soils from the central site, gross ammonification rates were 68% lower with addition of NH4NO3. In soils from the southern site, gross ammonification rate was numerically negative, which is biologically impossible, but this result was not statistically different from zero (large ammonium pool sizes and low isotopic enrichment likely elevated the minimum detection limit for gross ammonification above the actual rate; Hart et al., 1994). There was a strong negative correlation between ammonium pool size and gross ammonification rate (Figure 8). However, there was no correlation between nitrate pool size and gross ammonification.
Figure 7
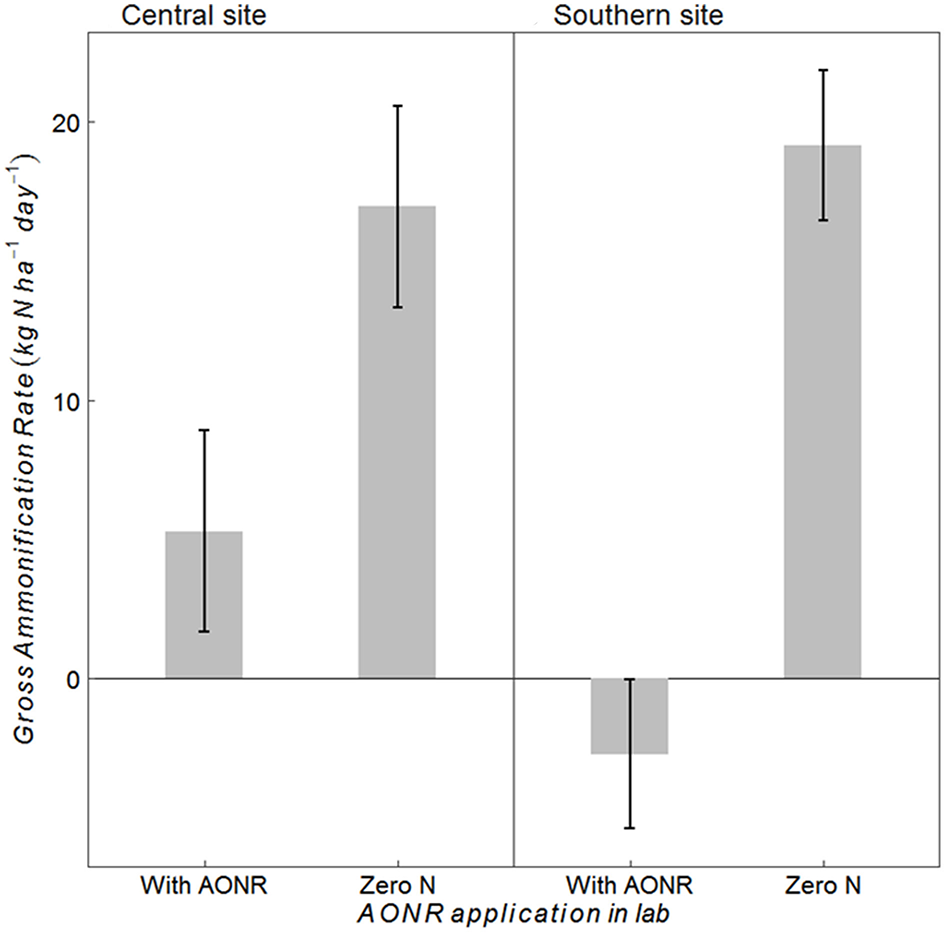
Gross ammonification rates (kg N ha−1 day−1) in soils collected at the central and southern Iowa sites from the zero-N historical rate (1999–2014) and 2015 zero N treatment after laboratory application of N fertilizer at the agronomic optimum N rate (AONR) to test hypothesis iv vs. v (Table 1) under similar soil moisture and temperature conditions to avoid indirect ecological effects. Vertical bars represent 95% confidence interval.
Figure 8
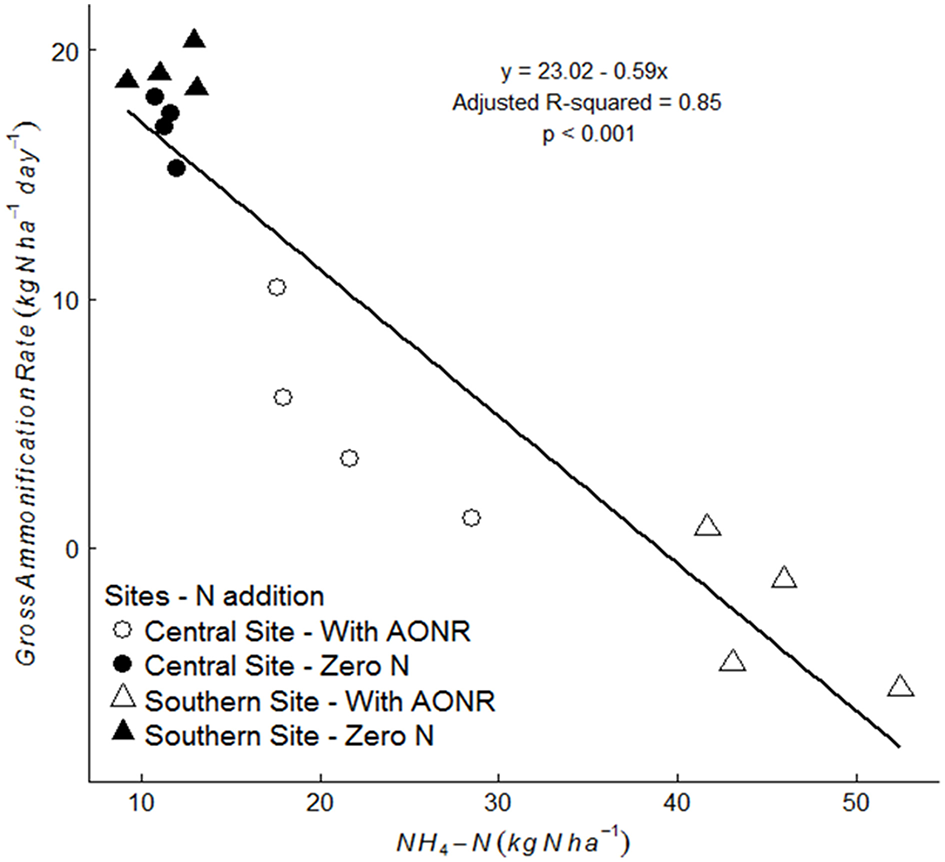
Correlation between gross ammonification rate (kg N ha−1 day−1) and NH4-N (kg N ha−1) pool size in soils collected from the 1999–2015 zero-N rate subplots, without laboratory fertilizer addition (closed symbol) and with laboratory N fertilizer addition at agronomic optimum rate (AONR) (open symbol) at central (circle symbol) and southern (triangle symbol) Iowa sites.
Discussion
Implications for Estimation of FNUE
Our results indicate that FNUE, when measured by the “N difference” method may be underestimated. Fertilizer N use efficiency (FNUE) can be estimated with two methods: “N difference” and “15N tracer” (see section Introduction). The “N difference” method (Equation 1) has been suggested to overestimate FNUE compared to the “15N tracer method” (Equation 2) due to a positive or “priming” effect of N fertilizer on soil N mineralization (Jansson and Persson, 1982; Cassman et al., 2002; Gardner and Drinkwater, 2009). Our results reject this hypothesis. The methodological assumption of equal N pool sizes and mineralization rates in the fertilized and unfertilized treatments was violated; lower N mineralization in fertilized vs. unfertilized treatments at our sites would reduce FNUE as measured by the “N difference” method.
Therefore, rather than previous concerns about the potential for the N difference method to overestimate FNUE, our results suggest the “N difference” method may underestimate FNUE. The fertilizer N use efficiency as measured with the N difference method is generally 20–30% greater than the 15N tracer method (Cassman et al., 2002; Stevens et al., 2005). At our sites, positive priming of SOM mineralization due to synthetic N fertilizer application cannot explain the methodological difference. Future work should investigate suggestions that the 15N tracer method underestimates FNUE due to 1:1 substitution of added inorganic 15N isotope and the existing inorganic 14N pool (Cassman et al., 2002).
Despite reduced gross ammonification with N fertilizer application at the V5 growth stage and similar inorganic N pools between fertilized and non-fertilized treatments at the V12 growth stage, maize yield was much greater in N-fertilized treatments (Figure 2). Although we did not measure roots, previous reports have demonstrated that N fertilizer concomitantly increases below and aboveground maize production, which suggests well-developed root system in fertilized plots enhances N uptake (Russell et al., 2009) and may explain greater yield despite similar inorganic N pools. Thus, any suppressive effect of N fertilizer on gross ammonification does not appear to negatively impact N uptake.
Synthetic N Fertilizer Effects on SOM Mineralization: Mechanism
Across two maize production systems with different long-term climate, yield potential, and physiography (Table 1), inorganic N fertilizer caused a consistent and agronomically relevant reduction in SOM mineralization rate as assayed by gross ammonification. The strong negative correlation between pool size and gross ammonification indicate that is directly responsible for the suppression. Microbial N mining theory can help to explain the direct effect of fertilizer on gross ammonification rate. This theory suggests that N fertilization will reduce microbial mineralization of SOM because, under conditions of low soil inorganic N, microbes accelerate SOM decomposition in search of N to meet demand for growth metabolism (Moorhead and Sinsabaugh, 2006). This energy investment in N acquisition may lower microbial carbon use efficiency because much of the SOM decomposed as a result N mining is low- or zero-energy biomolecules such as lignin (Spohn et al., 2016; Zang et al., 2016; Li et al., 2017). Indeed, the addition of N fertilizer can reduce oxidative enzyme activity (Spohn et al., 2016), which is consistent with the concept that N mining targets nutrient-poor substrates. Therefore, our coupled field and laboratory N-addition experiments demonstrated that the suppressive effect of N fertilizer on gross ammonification can be attributed to the direct effect of N fertilizer application on microbial activity rather than the indirect effects of N fertilizer on microbial activity that are controlled by crop growth (i.e., soil moisture, soil temperature, and enhanced belowground OM inputs, e.g., rhizodeposition). These results stand in complete contrast to suggestions that synthetic N fertilizer increases SOM-N mineralization and reduces SOM stocks (Mulvaney et al., 2009).
The agronomic relevance of our results may, however, vary with the type and placement of N fertilizer. Anhydrous ammonia and urea do not contain , but are quickly transformed to . Although these transformations affect soil pH, we found no correlation between gross ammonification and soil pH (data not shown), which is similar to previous work (Booth et al., 2005). Other fertilizers contain large fractions of (e.g., urea-ammonium-nitrate). Because we found no association between pool size and gross ammonification in field-fresh or laboratory-controlled soils, N fertilizer with large fractions of may have a lesser effect on gross ammonification. The placement of N fertilizer may also impact our results. We uniformly applied NH4NO3 to the soil, however, N fertilizer can be placed in concentrated bands resulting in much higher concentrations (e.g., Mitchell et al., 2013; Maharjan et al., 2014). The correlation between pool size and gross ammonification suggests the suppressive effect of may be higher when -based fertilizers are applied in concentrated bands. Moreover, the study year was wetter as compared to the historical precipitation (34 and 25% higher at central and southern site, respectively); the effects of N fertilizer could vary depending on the climatic conditions affecting microbial activity.
Long- and Short-Term Effects of N Fertilizer Application on SOM Mineralization
The suppressive effect of N fertilizer on gross ammonification was greater in historically under-fertilized soils (Figure 4), which is consistent with microbial N-mining of SOM. The historical zero-N rates at both sites had lower nutrient availability as indicated by lower total N concentrations compared to moderate and high historical N rates (Table 3). In addition, previous work at the central site demonstrated that N fertilizer inputs have reduced the C/N ratio of maize litter while altering microbial community composition from a fungal-dominated community in zero-N treatments to bacterially-dominated community in N-fertilized treatments (Brown et al., 2014). These changes may have decreased microbial N mining in N-fertilized treatments by decreasing microbial N demand. Alternatively, historical N fertilizer could have provided a “home-field advantage” to the microbial community (i.e., the microbes were accustomed to high concentrations) such that response to 2015 N fertilizer was muted (Ayres et al., 2009).
Despite the large effect of N fertilizer on gross ammonification, it was short-term and disappeared after a period of rapid plant N uptake that equalized inorganic N pools in fertilized and non-fertilized treatments (Figure 5). By the V12 growth stage, cumulative maize N uptake exceeds 33% of the total N uptake (Abendroth et al., 2011) and, as a result, soil inorganic N pools are typically small. During this time, maize growth reduced soil moisture. Although the effect of N fertilizer on gross ammonification rate (Figures S1, S2), and soil inorganic N concentration disappeared by the V12 growth stage (Figure 5), the effect of N fertilizer on soil moisture persisted (Figure 4). These patterns in the soil environment suggest that the indirect effect of NPP on soil moisture was not a factor reducing gross ammonification. This pattern is consistent with our laboratory results that demonstrated a direct, suppressive effect of -N pool on gross ammonification (Figures 7, 8).
Implications for Crop Modeling
In our study, the direct effect of inorganic N on microbial activity and SOM dynamics was agronomically relevant—even in the context of large differences in NPP and soil moisture that were imparted by the fertilizer addition (Figures 1, 5). The reduction in gross ammonification (0.6 - 4.9 kg N ha−1 day−1) due to synthetic N fertilizer addition was large compared to the typical rate of maize N uptake at the V5 growth stage (~ 1.5 kg N ha−1 day−1; Osterholz et al., 2017). In contrast to this result, most ecosystem process models (e.g., Roth-C; Coleman and Jenkinson, 1996) do not capture the effect of inorganic N on SOM dynamics because ammonification rates are mostly driven by initial SOM levels, soil moisture, and soil temperature dynamics. In more complex models that concurrently account for soil and crop dynamics as well as their interactions (e.g., APSIM), the effect of inorganic N on SOM dynamics becomes an emergent property of the simulation process with apparent differences in soil N mineralization due to N-fertilizer input (Puntel et al., 2016). Nevertheless, the direct effect of inorganic N on microbial activity is not included. This highlights the importance of recent ecosystem process models that incorporate microbial physiology (e.g., Wieder et al., 2014).
The Net Effect of N Fertilizer on Ecosystem NUE
In highly fertile soils, N mineralized from SOM is typically the major source of crop N uptake (Stevens et al., 2005; Gardner and Drinkwater, 2009; Poffenbarger et al., 2018). If N fertilizer reduces SOM-N mineralization and, as a result, increases reliance on fertilizer N, it could increase environmental N losses because mineralized SOM-N is a more efficient source of crop N uptake (Drinkwater and Snapp, 2007). In contrast, if the reduction in early-season SOM-N mineralization (Figure 7) represents a delay in the release of potentially mineralizable SOM-N rather than an absolute reduction in total SOM-N mineralization, it could reduce environmental N losses and increase total crop N uptake (i.e., similar to a delayed-release fertilizer). Coincidently, comparisons of N fertilizer sources often find NH4NO3 to be among the most efficient sources of synthetic N fertilizer (Andraski and Bundy, 2008). New metrics of ecosystem NUE, such as “systems NUE” [sNUE = Nyield/(Nyield + Nloss)] where, Nyield is grain N harvest and Nloss is the sum of all environmental N losses (e.g., gaseous and dissolve) in kg ha−1 y−1 could identify potential trade-offs between crop N uptake, SOM mineralization, and environmental N loss (Martinez-Feria et al., 2018).
Regardless of the net effect of N fertilizer on SOM mineralization, our results highlight one dilemma of soil C management: “shall we hoard it or use it” (Janzen, 2006)? Rational fertilizer application (i.e., the “historical N rate”) led to greater soil C and N concentrations (Table 3) and soil moisture (Figure 4). However, SOC can be increased by N fertilizer via two pathways: an increase in inputs or a decrease in mineralization. If increases in SOM stocks are achieved via reductions in SOM N mineralization (Figure 6), more N fertilizer may be required to achieve the same NPP and environmental N losses may be increased. Thus, strategies to increase SOM should aim to increase SOM inputs rather decrease SOM mineralization. A shift from synthetic N fertilizer to manure and legume sources of N are one option to achieve this goal.
Conclusion
Synthetic N fertilizer addition consistently reduced gross ammonification at an early growth stage of maize when soil inorganic N concentrations were higher in N-fertilized treatments due to a direct inhibitory effect of on microbial activity (Figure 8). In later stages of maize growth when soil inorganic N concentrations were similar among N-fertilized and non-fertilized treatments, there was no effect of N fertilizer on gross ammonification.
The suppressive effect of N fertilizer application on gross ammonification is likely linked to microbial N demand. The effect was greatest in treatments that had not received historical N fertilizer applications and had lower SOC and total N, suggesting microbes may be mineralizing SOM to meet N demand. In contrast, at the high historical N fertilizer rates, which had greater total soil N concentrations, fertilizer N did not significantly reduce ammonification. In these treatments, historically high N fertilizer inputs and accompanying increases in total soil N may have increased N availability to a point that it no longer limited microbial activity.
Given the suppression of gross ammonification by N fertilizer, the “N difference” method to measure FNUE may underestimate FNUE, especially in systems with low SOM. This result contrasts with previous reports, which suggest that the indirect “N difference” method overestimate FNUE. Although future research will be required to determine why the N difference method consistently estimates higher FNUE than the 15N isotope method, the relatively inexpensive “N difference” method should not overestimate FNUE and thus may provide an accurate estimate of FNUE. This result could have widespread application for research aiming to increase NUE of maize agroecosystems thus lowering N losses and associated economic and environmental impacts.
Statements
Author contributions
NM, MC, HP, and JS designed the experiment. NM, MC, and WO collected soil samples and set up the gross ammonification assays. HP collected crop yield and soil C:N, bulk density data. NM, FM, and MC synthesized results and constructed tables and figures for the paper. NM and MC created the first draft. WO, FM, HP, JS, DO, and SA contributed to the final version of the manuscript.
Acknowledgments
This study was funded by the United States Department of Agriculture National Institute of Food and Agriculture grant number 2014-67019-21629 and the Iowa State University Plant Sciences Institute Faculty Scholars Program. We are grateful to the Iowa State University Research Farm personnel for maintaining the N rate experiments.
Conflict of interest
The authors declare that the research was conducted in the absence of any commercial or financial relationships that could be construed as a potential conflict of interest.
Supplementary material
The Supplementary Material for this article can be found online at: https://www.frontiersin.org/articles/10.3389/fevo.2019.00059/full#supplementary-material
Footnotes
1.^Iowa State University. Iowa Environmental Mesonet [Internet] (2017). Available online at: http://mesonet.agron.iastate.edu/request/coop/fe.phtml
References
1
AbendrothL. J.ElmoreR. W.BoyerM. J.MarlayS. K. (2011). Corn Growth and Development. Ames, IA: Iowa State University.
2
AndraskiT. W.BundyL. G. (2008). Corn residue and nitrogen source effects on nitrogen availability in no-till corn. Agron. J.100, 1274–1279. 10.2134/agronj2008.0039
3
AyresE.SteltzerH.SimmonsB. L.SimpsonR. T.SteinwegJ. M.WallensteinM. D.et al. (2009). Home-field advantage accelerates leaf litter decomposition in forests. Soil Biol. Biochem.41, 606–610. 10.1016/j.soilbio.2008.12.022
4
BoothM. S.StarkJ. M.RastetterE. (2005). Controls on nitrogen cycling in terrestrial ecosystems: a synthetic analysis of literature data. Ecol. Monogr.75, 139–157. 10.1890/04-0988
5
BrownK. H.BachE. M.DrijberR. A.HofmockelK. S.JeskeE. S.SawyerJ. E.et al. (2014). A long-term nitrogen fertilizer gradient has little effect on soil organic matter in a high-intensity maize production system. Glob. Chang. Biol.20, 1339–1350. 10.1111/gcb.12519
6
CassmanK. G. (1999). Ecological intensification of cereal production systems: yield potential, soil quality, and precision agriculture. Proc. Natl. Acad. Sci. U.S.A.96, 5952–5959.
7
CassmanK. G.DobermannA.WaltersD. T. (2002). Agroecosystems, nitrogen-use efficiency, and nitrogen management. Ambio31, 132–140. 10.1579/0044-7447-31.2.132
8
ChenR.SenbayramM.BlagodatskyS.MyachinaO.DittertK.LinX.et al. (2014). Soil C and N availability determine the priming effect: microbial N mining and stoichiometric decomposition theories. Glob. Chang. Biol.20, 2356–2367. 10.1111/gcb.12475
9
ChengW. (2009). Rhizosphere priming effect: its functional relationships with microbial turnover, evapotranspiration, and C–N budgets. Soil Biol. Biochem.41, 1795–1801. 10.1016/j.soilbio.2008.04.018
10
CiampittiI. A.VynT. J. (2012). Physiological perspectives of changes over time in maize yield dependency on nitrogen uptake and associated nitrogen efficiencies: a review. Field Crops Res.133, 48–67. 10.1016/j.fcr.2012.03.008
11
ColemanK.JenkinsonD. S. (1996). RothC-26.3: a model for the turnover of carbon in soil in Evaluation of Soil Organic Matter Models Using Existing Long-Term Datasets, NATO ASI Series I, Vol. 38, eds PowlsonD. S.SmithP.SmithP. J. U. (Heidelberg: Springer-Verlag), 237–246. 10.1007/978-3-642-61094-3_17
12
CraineJ. M.MorrowC.FiererN. (2007). Microbial nitrogen limitation increases decomposition. Ecology88, 2105–2113. 10.1890/06-1847.1
13
DobermannA. (2007). Nutrient use efficiency - measurement and management in IFA International Workshop on Fertilizer Best Management Practices (Brussels), 1–28.
14
DrinkwaterL. E.SnappS. S. (2007). Nutrients in agroecosystems: rethinking the management paradigm. Adv. Agron.92, 163–186. 10.1016/S0065-2113(04)92003-2
15
FontaineS.MariottiA.AbbadieL. (2003). The priming effect of organic matter: a question of microbial competition?Soil Biol. Biochem.35, 837–843. 10.1016/S0038-0717(03)00123-8
16
GardnerJ. B.DrinkwaterL. E. (2009). The fate of nitrogen in grain cropping systems: a meta-analysis of 15N field experiments. Ecol. Appl.19, 2167–2184. 10.1890/08-1122.1
17
HarmsenK.MoraghanJ. T. (1988). A comparison of the isotope recovery and difference methods for determining nitrogen fertilizer efficiency. Plant Soil105, 55–67. 10.1007/BF02371143
18
HartS.StarkJ.DavidsonE.FirestoneM. K. (1994). Nitrogen mineralization, immobilization, and nitrification in Methods of Soil Analysis. Part 2. Microbiological and Biochemical Properties, eds WeaverR.AngleS.BottomleyP.BezdicekD.SmithS.TabatabaiA.WollumA. (Madison, WI: Soil Science Society of America), 985–1018.
19
HauckR. D.BremnerJ. M. (1976). Use of tracers for soil and fertilizer nitrogen research. Adv. Agron.28, 219–266. 10.1016/S0065-2113(08)60556-8
20
Hood-NowotnyR.UmanaN. H. N.InselbacherE.Oswald-LachouaniP.WanekW. (2010). Alternative methods for measuring inorganic, organic, and total dissolved nitrogen in soil. Soil Sci. Soc. Am. J.74, 1018–1027. 10.2136/sssaj2009.0389
21
JanssonS. L.PerssonJ. (1982). Mineralization and immobilization of soil nitrogen in Nitrogen in Agricultural Soils, ed StevensonF. J. (Madison, WI: American Society of Agronomy), 229–252.
22
JanzenH. H. (2006). The soil carbon dilemma: shall we hoard it or use it?Soil Biol. Biochem.38, 419–424. 10.1016/j.soilbio.2005.10.008
23
JenkinsonD. S.FoxR. H.RaynerJ. H. (1985). Interactions between fertilizer nitrogen and soil nitrogen—the so-called ‘priming’effect. Eur. J. Soil Sci.36, 425–444.
24
KhanS. A.MulvaneyR. L.EllsworthT. R.BoastC. W. (2007). The myth of nitrogen fertilization for soil carbon sequestration. J. Environ. Qual.36, 1821–1832. 10.2134/jeq2007.0099
25
KuzyakovY. (2010). Priming effects: interactions between living and dead organic matter. Soil Biol. Biochem.42, 1363–1371. 10.1016/j.soilbio.2010.04.003
26
LiX. G.JiaB.LvJ.MaQ.KuzyakovY.LiF. M. (2017). Nitrogen fertilization decreases the decomposition of soil organic matter and plant residues in planted soils. Soil Biol. Biochem.112, 47–55. 10.1016/j.soilbio.2017.04.018
27
LiY.LiuY.WangY.NiuL.XuX.TianY. (2014). Interactive effects of soil temperature and moisture on soil N mineralization in a Stipa krylovii grassland in Inner Mongolia, China. J. Arid Land6, 571–580. 10.1007/s40333-014-0025-5
28
MaharjanB.VentereaR. T.RosenC. (2014). Fertilizer and irrigation management effects on nitrous oxide emissions and nitrate leaching. Agron. J.106, 703–714. 10.2134/agronj2013.0179
29
Martinez-FeriaR. A.CastellanoM. J.DietzelR. N.HelmersM. J.LiebmanM.HuberI.et al. (2018). Linking crop-and soil-based approaches to evaluate system nitrogen-use efficiency and tradeoffs. Agric. Ecosyst. Environ.256, 131–143. 10.1016/j.agee.2018.01.002
30
MitchellD. C.CastellanoM. J.SawyerJ. E.PantojaJ. (2013). Cover crop effects on nitrous oxide emissions: role of mineralizable carbon. Soil Sci. Soc. Am. J. 77, 1765–1773. 10.2136/sssaj2013.02.0074
31
MoorheadD. L.SinsabaughR. L. (2006). A theoretical model of litter decay and microbial interaction. Ecol. Monogr.76, 151–174. 10.1890/0012-9615(2006)076[0151:ATMOLD]2.0.CO;2
32
MulvaneyR. L.KhanS. A.EllsworthT. R. (2009). Synthetic nitrogen fertilizers deplete soil nitrogen: a global dilemma for sustainable cereal production. J. Environ. Qual.38, 2295–2314. 10.2134/jeq2008.0527
33
OsterholzW. R.RinotO.LiebmanM.CastellanoM. J. (2017). Can mineralization of soil organic nitrogen meet maize nitrogen demand?Plant Soil415, 73–84. 10.1007/s11104-016-3137-1
34
PartonW. J.SchimelD. S.ColeC. V.OjimaD. S. (1987). Analysis of factors controlling soil organic matter levels in great plains grasslands1. Soil Sci. Soc. Am. J.51, 1173–1179. 10.2136/sssaj1987.03615995005100050015x
35
PoffenbargerH. J.BarkerD. W.HelmersM. J.MiguezF. E.OlkD. C.SawyerJ. E.et al. (2017). Maximum soil organic carbon storage in Midwest US cropping systems when crops are optimally nitrogen-fertilized. PLoS ONE12:e0172293. 10.1371/journal.pone.0172293
36
PoffenbargerH. J.SawyerJ. E.BarkerD. W.OlkD. C.SixJ.CastellanoM. J. (2018). Legacy effects of long-term nitrogen fertilizer application on the fate of nitrogen fertilizer inputs in continuous maize. Agricult. Ecosyst. Environ.265, 544–555.
37
PuntelL. A.SawyerJ. E.BarkerD. W.DietzelR.PoffenbargerH.CastellanoM. J.et al. (2016). Modeling long-term corn yield response to nitrogen rate and crop rotation. Front. Plant Sci.7:1630. 10.3389/fpls.2016.01630
38
RobertsonG. P.BruulsemaT. W.GehlR. J.KanterD.MauzerallD. L.RotzC. A.et al. (2013). Nitrogen–climate interactions in US agriculture. Biogeochemistry114, 41–70. 10.1007/s10533-012-9802-4
39
RussellA. E.CambardellaC. A.LairdD. A.JaynesD. B.MeekD. W. (2009). Nitrogen fertilizer effects on soil carbon balances in Midwestern US agricultural systems. Ecol. Appl.19, 1102–1113. 10.1890/07-1919.1
40
SAS Institute (2013). PC Windows Version 9.4. Cary, NC: SAS Institute Inc.
41
SpohnM.PötschE. M.EichorstS. A.WoebkenD.WanekW.RichterA. (2016). Soil microbial carbon use efficiency and biomass turnover in a long-term fertilization experiment in a temperate grassland. Soil Biol. Biochem.97, 168–175. 10.1016/j.soilbio.2016.03.008
42
StarkJ. M.HartS. C. (1996). Diffusion technique for preparing salt solutions, Kjeldahl digests, and persulfate digests for nitrogen-15 analysis. Soil Sci. Soc. Am. J.60, 1846–1855. 10.2136/sssaj1996.03615995006000060033x
43
SternerR. W.ElserJ. J. (2002). Ecological Stoichiometry: The Biology of Elements From Molecules to the Biosphere. Princeton, NJ: Princeton University Press.
44
StevensW. B.HoeftR. G.MulvaneyR. L. (2005). Fate of nitrogen-15 in a long-term nitrogen rate study. Agron. J.97, 1046–1053. 10.2134/agronj2003.0313
45
VarvelG. E.PetersonT. A. (1990). Nitrogen fertilizer recovery by corn in monoculture and rotation systems. Agron. J.82, 935–938. 10.2134/agronj1990.00021962008200050019x
46
VitousekP. M.NaylorR.CrewsT.DavidM. B.DrinkwaterL. E.HollandE.et al. (2009). Nutrient imbalances in agricultural development. Science324, 1519–1520. 10.1126/science.1170261
47
WangC.WanS.XingX.ZhangL.HanX. (2006). Temperature and soil moisture interactively affected soil net N mineralization in temperate grassland in Northern China. Soil Biol. Biochem.38, 1101–1110. 10.1016/j.soilbio.2005.09.009
48
WiederW. R.GrandyA. S.KallenbachC. M.BonanG. B. (2014). Integrating microbial physiology and physio-chemical principles in soils with the MIcrobial-MIneral Carbon Stabilization (MIMICS) model. Biogeosciences11, 3899–3917. 10.5194/bg-11-3899-2014
49
ZangH.WangJ.KuzyakovY. (2016). N fertilization decreases soil organic matter decomposition in the rhizosphere. Appl. Soil Ecol.108, 47–53. 10.1016/j.apsoil.2016.07.021.
Summary
Keywords
fertilizer nitrogen use efficiency, N mineralization, priming effect, agronomic optimum N rate, synthetic N fertilizer, continuous maize system
Citation
Mahal NK, Osterholz WR, Miguez FE, Poffenbarger HJ, Sawyer JE, Olk DC, Archontoulis SV and Castellano MJ (2019) Nitrogen Fertilizer Suppresses Mineralization of Soil Organic Matter in Maize Agroecosystems. Front. Ecol. Evol. 7:59. doi: 10.3389/fevo.2019.00059
Received
23 August 2018
Accepted
18 February 2019
Published
13 March 2019
Volume
7 - 2019
Edited by
Urs Feller, University of Bern, Switzerland
Reviewed by
Alberto Sanz Cobeña, Polytechnic University of Madrid, Spain; Geoffrey R. Squire, James Hutton Institute, United Kingdom; Juan Fernando Hirzel, Instituto de Investigaciones Agropecuarias (INIA), Chile
Updates
Copyright
© 2019 Mahal, Osterholz, Miguez, Poffenbarger, Sawyer, Olk, Archontoulis and Castellano.
This is an open-access article distributed under the terms of the Creative Commons Attribution License (CC BY). The use, distribution or reproduction in other forums is permitted, provided the original author(s) and the copyright owner(s) are credited and that the original publication in this journal is cited, in accordance with accepted academic practice. No use, distribution or reproduction is permitted which does not comply with these terms.
*Correspondence: Navreet K. Mahal navreetmahal1@gmail.com
†Present Address: Navreet K. Mahal, Department of Agronomy, Horticulture and Plant Science, South Dakota State University, Brookings, SD, United States
This article was submitted to Agroecology and Ecosystem Services, a section of the journal Frontiers in Ecology and Evolution
Disclaimer
All claims expressed in this article are solely those of the authors and do not necessarily represent those of their affiliated organizations, or those of the publisher, the editors and the reviewers. Any product that may be evaluated in this article or claim that may be made by its manufacturer is not guaranteed or endorsed by the publisher.