 Warwick Wainwright
 Bouda Vosough Ahmadi
 Alistair Mcvittie
 Geoff Simm3
 Dominic Moran
- 1School of Geosciences, Grant Institute, University of Edinburgh, Edinburgh, United Kingdom
- 2Land Economy, Environment and Society Research Group, SRUC, Edinburgh, United Kingdom
- 3The Royal (Dick) School of Veterinary Studies and The Roslin Institute, University of Edinburgh, Global Academy of Agriculture and Food Security, Midlothian, United Kingdom
Farm Animal Genetic Resources (FAnGR) are threatened by breed homogenisation. Rare breeds may carry important genes that allow breeders to respond to global production challenges including climate change and emerging disease risk. Yet, exploration of approaches to improve cost-effectiveness of investments in farm animal genetic diversity has been limited. We employ multi-criteria decision analysis (MCDA) to investigate how rare breed incentive schemes can be rationalised. A performance matrix was used to assess 19 UK cattle native breeds at risk, in terms of diversity, marketability, and endangerment criteria, and an expert workshop was used to assign weights for prioritisation. The workshop participants suggested that criteria pertaining to diversity, marketability and endangerment should be weighted 30, 20, and 50%, respectively. A principal component analysis (PCA) on the criteria suggested that fewer criteria could be used to characterise breed status but that each criteria node contributed effectively in explaining variation in breed scores. Breed scores from the MCDA model were used in a hypothetical exercise to rationalise monetary investments across the case study breeds. The allocation of the hypothetical breed improvement fund (BIF) revealed that the greatest variation in the allocation of incentives occurred when marketability was weighted highest, while least variation occurred when endangerment received the highest weight. We suggest MCDA can support more targeted investments in diversity by considering the multiple factors that may be driving extinction risk in addition to the cultural and diversity attributes that compliment conservation.
Introduction
Farm Animal Genetic Resources (FAnGR) make an important contribution to food security by ensuring greater adaptive capacity to global production challenges including climate change, emerging disease risk and changing consumption patterns (Eisler et al., 2014; FAO, 2017). Rare breeds supply option value via the possibility of incorporating new traits into future breeding programmes, in addition to supplying cultural and heritage attributes (Drucker et al., 2001; Dulloo et al., 2017). The failure of markets to reward some of these values has meant breed diversity is often undervalued and is now globally threatened (FAO, 2015). Policy interventions are needed to correct for market failure, and incentive instruments to reward producers supplying diversity are common in some European countries (Bojkovski et al., 2015).
While incentive schemes are an improvement on the status quo (i.e., do nothing), they are prone to cost inefficiencies (Pascual and Perrings, 2007). Numerous approaches may be employed to improve scheme effectiveness including better targeting (Naidoo et al., 2006); collective bonuses (Kuhfuss et al., 2015); results-based approaches (Herzon et al., 2018) and improved monitoring (Lindenmayer et al., 2012). This paper focuses on developing more targeted conservation approaches, a key policy goal of the Global Plan of Action (GPA) for FAnGR that stresses the need to construct indicators to better monitor breed attributes and develop more systematic conservation responses (FAO, 2007).
Few advances in indicators have arisen since the GPA with the exception of works using diversity and endangerment metrics (Defra, 2015a; Verrier et al., 2015), and a novel geographical information system (GIS) platform for monitoring FAnGR (Duruz et al., 2017). Earlier work has focused on methodological applications of Weitzman (1993)—a methodological framework employing phylogenetics to rationalise investments in diversity (Reist-Marti et al., 2003; Simianer et al., 2003; Zander et al., 2009). While such approaches are useful, there has been limited policy uptake, reflecting the tensions between scientific rigour and practicality. It is therefore important to develop more pragmatic approaches to guide investments.
Here, we develop an indicator detailing breed status by employing multi-criteria decision analysis (MCDA) to construct a performance matrix detailing rare breed attributes that are weighted to derive preference scores concerning multiple endangerment and benefit criteria. Breed scores are subsequently used to allocate a hypothetical breed improvement fund (BIF) across breed societies.
As a methodological approach, MCDA improves decision making power since it can combine technical information and stakeholder preferences to score alternative options, in this instance breeds (Huang et al., 2011). For a review of MCDA applications for conservation decision making, please refer to Adem Esmail and Geneletti (2018). Existing applications of MCDA in the conservation literature have focused on site selection decisions (e.g., Phua and Minowa, 2005; Strager and Rosenberger, 2006; Regan et al., 2007) and there have been few applications to agrobiodiversity conservation problems, with the exception of work by Duruz et al. (2017). This study therefore fills two literature gaps. First, the construction of a composite indicator to monitor breed status and second, the application of MCDA to prioritise incentive support for rare breeds through the allocation of the BIF, using the UK as a case study. The former is analysed using different weighting schema to reflect alternate policy priorities for conservation.
The UK is currently exploring a range of policy options for future agricultural and environmental support following withdrawal from the EU (Defra, 2018). The state of UK FAnGR is particularly concerning, where 80% of native breeds are now classified as at risk (Defra, 2017a). Exploring cost effective breed conservation policies is therefore important and consistent with the UK Government strategy of providing “public funds for public goods” from agriculture (Defra, 2018).
The paper seeks to outline a new methodological approach to monitor and support rare breeds, through the application of multi-criteria analysis. The paper is structured as follows. Section two details the MCDA approach and methods. Section three presents results of the MCDA application and the implications for resource allocation. Section four discusses criteria to monitor breeds, breed indicators, approaches to differentiate breed support and how this framework may be applied in other countries and regions. Section five presents conclusions.
Methods
The Case Study
The UK harbours over 700 breeds spanning sheep, goats, pigs, horses, ponies, cattle and poultry (Defra, 2013); equating to ~9% of global livestock breeds. Some 133 of these are native to the UK, of which 80% are classified as native breeds at risk (NBAR) (Defra, 2016). A breed may be classified as NBAR if it satisfies both genealogical and heritage attributes1 pertaining to origin and numerical population thresholds (Defra, 2013). We used a case study of 19 NBAR cattle across the UK; their geographical origins are noted in Supplementary Information S1. The breeds were selected based on data availability relating to the criteria that would be used in the MCDA model.
Multi Criteria Decision Analysis
MCDA relies on the integration of attribute measures for criteria relevant to decision makers' objectives and preferences (Strager and Rosenberger, 2006). MCDA is a knowledge synthesis method to support decision-making, by systematically exploring the pros and cons of different alternatives and has been applied widely in the fields of forest management and restoration; conservation prioritization and planning and natural resource management (Adem Esmail and Geneletti, 2018). At its most basic level, an alternatives performance relative to certain criteria can be reported in a table, known as a “performance matrix.” Usually, MCDA follows a formal modelling approach, and there are three main methods; outranking, goal-based techniques, and weighted linear combinations (see Belton and Stewart, 2002 for a review). The choice of method can play an important role in the evaluation of alternatives across different criteria due to differences in weighting and scoring comparisons (Mendoza and Martins, 2006).
This study uses a weighted linear combinations approach, which usually combines preference weights (wi) and criterion scores for alternatives (xi) in a suitability index S. For such an approach, the criteria should exhibit mutual independence of preference (Adem Esmail and Geneletti, 2018). This means the judged strength of preference for an alternative on one criterion will be independent of its judged strength of preference on other criteria—i.e., preferences are mutually independent (Dodgson et al., 2009). The suitability of the method reflects the large number of alternatives that can be assessed using a weighted linear combinations approach combined with the flexibility inherent in assigning preference weights (Dodgson et al., 2009). The criteria themselves must also be orthogonal (i.e., no double counting). The MCDA decision-making problem can be formulated through multiple, ordinal tasks with different research inputs (Figure 1).
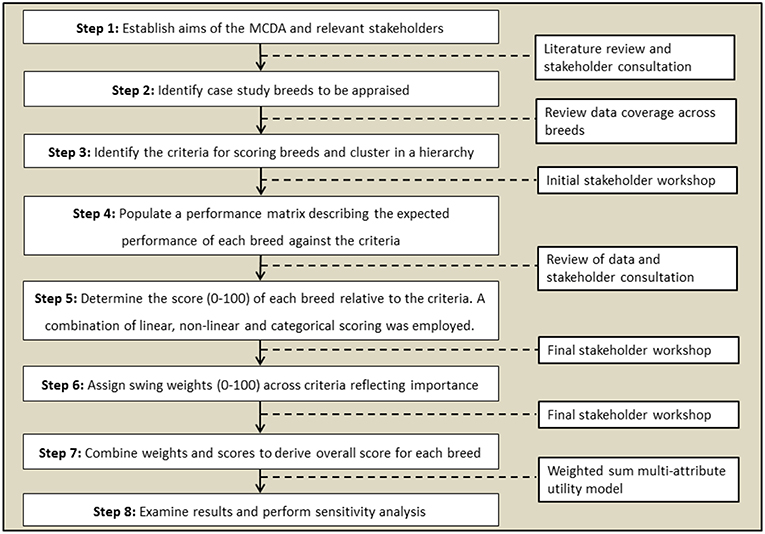
Figure 1. Formulation of the MCDA problem through ordinal steps (left) and research inputs (right) used in this work.
Identifying the Criteria
Initially, a set of criteria was formulated based on literature reviews and stakeholder consultations. A requirement of all criteria is that the data were readily available and they were relatively simple to calculate, to ensure the method may be applied to other livestock species in future applications with relative ease. A workshop held with 10 expert stakeholders spanning academia, industry and non-governmental organisations (NGOs) then refined this initial criteria list (see Supplementary Information S2 for delegate information). Discussions concerned the “practicality,” “suitability,” and “data availability” associated with each criterion, which was scored (1–10) relative to these factors. It was therefore possible to determine both the highest scoring criteria and the level of agreement amongst stakeholders. A final set of criteria were then structured into a hierarchical value tree (Figure 2).
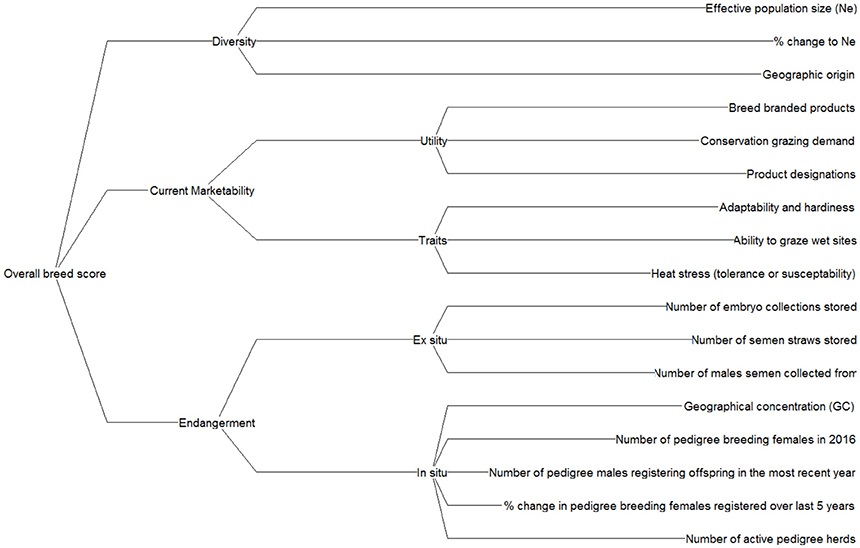
Figure 2. A hierarchical value tree of criteria and sub-criteria.
The criteria were grouped by diversity, marketability and endangerment nodes and a performance matrix was populated containing breed performance data for each criterion. A detailed description of the criteria is provided in Supplementary Information S3. The criteria nodes were developed to show what actions breed societies could implement to improve breed scores. For instance, if a breed scored low in diversity, then a society might respond by implementing a new breeding programme to increase diversity (Pattison et al., 2007).
Diversity criteria were selected to represent both within and between breed diversity. Rege and Okeyo (2006) suggest around 50% of farm species diversity arises from within breeds and a further 50% between breeds. Effective population size (Ne) was used to measure within breed diversity. Ne is a metric that accounts for the total number of animals in a population, but also their breeding structure. A low Ne signifies a greater risk of declining genetic diversity within populations (Falconer and Mackay, 1996). Ne was calculated from a formula proposed by Wright (1931) using numerical population data. In addition, geographic origin of breeds was used as a proxy for between breed diversity (Lenstra et al., 2017; Parker et al., 2017). Note, a detailed discussion of these criteria is provided in section Criteria to Monitor Rare Breeds.
Marketability approximates the use and non-use values of breeds and is clustered under two nodes: “utility” and “traits.” Utility suggests how well a breed fits current market requirements, and traits refer to the characteristics that a breed may possess for it to become valued by markets. Note, the traits identified in this study are not definitive, but data constraints restricted the number of traits it was possible to evaluate.
Endangerment criteria were split between two nodes, in situ and ex situ. The sub-criteria we consider relate to ex situ storage of genetic material in the UK Heritage Genebank, and multiple in situ population metrics (e.g., number of pedigree breeding females). Appreciating the severity of threats posed to breeds through in situ and ex situ endangerment criteria means conservation responses can be focussed accordingly.
Scoring the Alternatives
A final workshop, held with FAnGR experts in April 2018, scored the alternative breeds (see Supplementary Information S2 for delegate information). Their experience with breed conservation spanned both technical and policy aspects of conservation, representing multiple institutions. The group reviewed the performance matrix and discussed the suitability of each criterion and their definitions. The criteria were deemed preferentially independent of each other, thus permitting the use of a weighted linear model (Dodgson et al., 2009).
The breeds were scored (Table 1) relative to the criteria based on three approaches, direct linear scoring, categorical scoring, and a preference value function (Mendoza and Martins, 2006). The scoring approach adopted differed depending on the criteria being assessed (see Supplementary Information S3). Across all approaches, breeds were allotted a value score out of 100 points, with 100 assigned to the breed with the best level of performance on a specific criterion and 0 to breeds with the lowest performance.
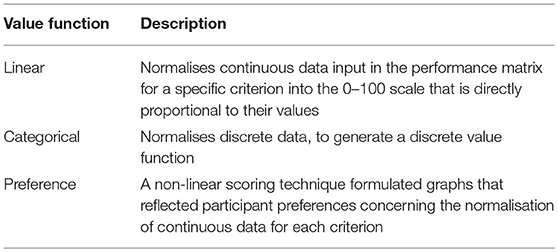
Table 1. Value functions used in the MCDA study.
All scoring methods employed a relative scale, meaning the differences in scores have consistency within each criterion. Since it is a relative scale, it is important to acknowledge only relative differences in value can be compared (Greco et al., 2016). Thus, if a breed is scored 25, then its performance preference should be half that to a breed scoring 50. Scoring was checked for consistency to ensure values were plausible. This took the form of a question to participants, asking “based on these scores, you should be equally happy with the difference between breed x and y (scoring 30 and 50, respectively) as the difference between breed y and z (scoring 50 and 70, respectively)”. If there was disagreement, further discussion was facilitated. This helped reduce any bias and ensured realism in scoring (Nutt et al., 2010).
An evaluation matrix P was then constructed consisting of standardised alternative scoring p for i criteria, from all criteria I, across j alternatives from all alternatives J:
The matrix was populated such that breeds with the highest diversity received the highest score in each criterion (assuming more diversity is a public benefit). For marketability, breeds that were most marketable received the highest score (assuming such breeds possess a higher utility value). For endangerment, breeds most endangered received the highest score to ensure scoring reflected extinction risk.
Weighting the Criteria
Normalisation ensures the units of criteria on the different value scales are equivalent, thus enabling scores for breeds to be compared and combined across criteria (Nutt et al., 2010). Criteria were weighted using swing weights, a method recommended by the UK Government (Dodgson et al., 2009). The swing method is an algebraic, decomposed direct procedure where participants evaluate the “swing” in breed performance in each criterion based on the range of values, and assign a weight to indicate the relative strength of preference (Wang et al., 2009). The weight on a criterion therefore reflects both the range of difference of the breeds, and how much that difference matters (Vollmer et al., 2016). Participant weighting also considered their perceived confidence in the input data used to generate scores for the different alternatives.
Workshop participants assigned weights to criteria within each node of the value tree. The criterion within a node that had the biggest swing and was considered most important was assigned an arbitrary value of 100. Thereafter, additional criteria were judged against the top scoring criterion, and were correspondingly scored to reflect the perceived difference in importance. The weights were then normalised to sum to 100.
A vector of weights W consisting of preference weights w for each criteria i (Jankowski and Richard, 1994) was then constructed:
Consistency checks on the weights were undertaken to help improve their validity. These involved comparing similar scoring criterion weights, relative to the swing in performance of the breeds. Scores and weights were input to the Hiview 3 software, which calculated the final weighted scores of each breed (Catalyze, 2018). The total breed weighted sum S was calculated by the followed linear additive model:
where xi refers to the breed score for the i-th criterion and wiy refers to the swing weight associated with the i-th criterion and the y-th node. A final grouped decision matrix for m breeds across n criteria was expressed as:
where xmn is the performance of the m-th alternative breed for the n-th criteria and wn is the n-th weight applied to the criteria (Wang et al., 2009). Sensitivity analysis was employed to test the stability of the results with regard to variations in the preference scores and criteria weights (Ferretti and Comino, 2015). This allowed uncertainty in the performance matrix and criteria weights to be contextualised.
In addition to using expert derived weights, we considered three additional weighting scenarios to contrast different conservation priorities. Firstly, the weights for the criteria nodes were held equal. In a second scenario, the diversity node was weighted 50 while endangerment and marketability were each weighted 25. The third scenario ensured marketability was favoured (50) while diversity and endangerment were equally weighted 25.
Differentiating Breed Support
One option for future breed support is to establish a central fund to support the initiatives of breed societies to improve the status of rare breeds. A hypothetical £10 million (5-year duration) BIF was allocated across the 19 case study breeds based on the breed indicator scores. The budget represents 33% of NBAR conservation grazing subsidies allocated to farmers by Natural England between 2006 and 2015 (Natural England, 2016). Breed societies were nominated as the beneficiary given their important institutional role for breed management and priority setting (Lauvie et al., 2014). Funding allocations were calculated by:
Where V refers to the allocation of a hypothetical BIF across each breed v, Zi is the total of all breed scores from index I of all breeds and q is the overall improvement fund budget.
In (6) this is subject to a constraint where vi refers to the funding allocation for breed k and mi and fi refer to the estimated number of pedigree breeding males and females, respectively. The constraint ensures the pro-rata BIF doesn't exceed £200 per animal and is therefore similar to mean subsidy allocations for rare breed conservation schemes across Europe (Kompan et al., 2014). The BIF was allocated according to the four weighting scenarios, to reveal how a change in conservation priorities could impact funding distribution.
Principal Component Analysis
Principal component analysis (PCA) was employed to analyse the variance of the criteria and criteria nodes used in the MCDA model. PCA is a multivariate technique that analyses a data table representing observations described by several dependant variables that are generally inter-correlated (Abdi and Williams, 2010). The goal is to express information in the data table as a new set of orthogonal variables, called principal components (PC).
The objective was to determine which criteria and criteria nodes explained most of the variation in breed scores, as indicated by a value of > 1 for the eigenvalues that accord to the different PCs. The unweighted variables were scaled to have standardized unit variance and were mean centred prior to analysis. The calculation was done by using a correlation matrix (as opposed to a covariance matrix). The first two PCs were plotted using a bi-plot for all the criteria (plotted as vectors) and breed scores (plotted as points). The analysis was conducted using base R v.3.5 (R Core Team, 2018). For further background on PCA see (Jolliffe, 2011)
Results
Criteria and Weights
This study used MCDA to score a selection of case study breeds relative to multiple criteria clustered under three nodes (diversity, marketability, and endangerment). The weights assigned to the criteria are presented in Supplementary Information S4 for both local and global weight scaling (local referring to the weight under each node, global being the overall weight). As expected, endangerment received the highest weight (50), followed by diversity (30) and marketability (20). Note that diversity encompasses the least sub-criteria of all nodes while endangerment includes the most.
In the marketability node, equal weight was assigned to the “utility” and “trait” nodes as experts suggested both contributed equally to the value of breeds. For endangerment, the ex situ node received much less weight (15) than in situ (85) because experts suggested genebank storage was effectively insurance to in situ conservation and therefore is less important than ensuring viability of actual breeding populations. The sub-criteria receiving the highest global weight overall were Ne (12) and percentage change to Ne over last 5 years (12) while all criteria relating to ex situ storage (no. of embryos, semen straws stored and males collected from) scored least (2.5 each).
Breed Scores
Figure 3 shows the total weighted breed scores for the 17 criteria based on the three criteria nodes. As formerly, noted, high scores in diversity and marketability nodes are desirable while for endangerment low scores indicate a lower extinction risk. The highest scoring breeds for diversity were the Luing (18), Red Ruby Devon (17), and Dexter (14). For marketability, the Highland (18), British White (14), and Red Poll (14) scored highest. The most endangered breeds were the Vaynol (46), Whitebred Shorthorn (44), and Gloucester (42). Across all nodes the Whitebred Shorthorn (67), Red Poll (61), and Vaynol (61) scored highest. The difference between the highest and lowest scoring breed was 31, while the standard deviation across the total scores was 8. This deviation was least in the marketability node (3.6) and highest for endangerment (8.2). A sensitivity analysis demonstrated the model is structurally stable (see Supplementary Information S6 for results).
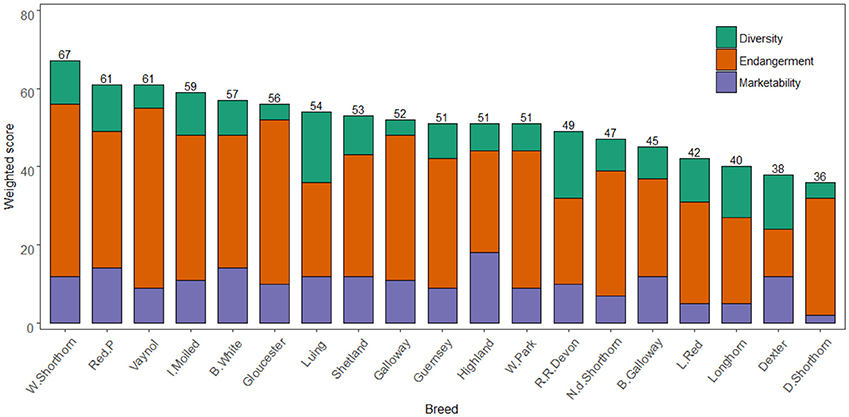
Figure 3. Breeds ordered by globally weighted scores for diversity, endangerment, and marketability criteria. Note the Y axis scale is 0–80.
The contributions of weighted part scores associated with each criterion suggests number of active herds (7.8) and percentage change to number of pedigree breeding females over the last 5 years (6.4) were the highest contributors to breed scores (Figure 4). Criteria with the lowest mean part score were product designations (0.1) and number of males with semen collected (1.3). The difference between the mean highest and lowest contributing criteria was 7.7.
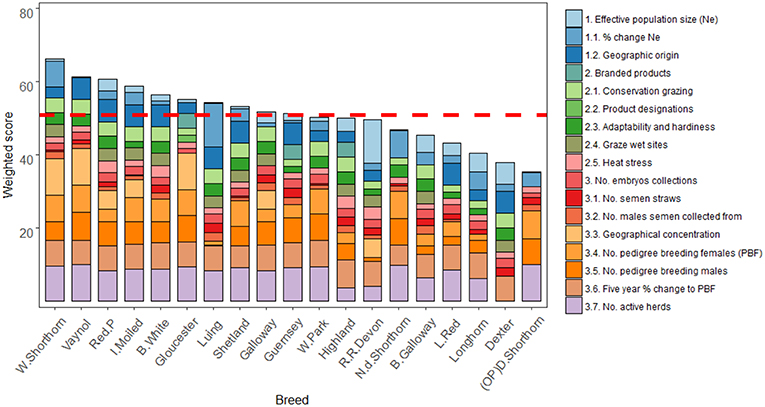
Figure 4. Ordered bar chart showing part scores for the 19 case study breeds across the 17 sub-criteria used to monitor breed status. The dotted red line shows the mean total score across all the case study breeds. Note (OP) refers to original breeding population.
Of those scores that were most noteworthy, the highest scoring breed for Ne was the Red Ruby Devon while the Luing scored most for percentage change to Ne over the last 5 years. Multiple breeds scored the same for several criteria (e.g., geographic origin, product branding, etc.). Breeds scoring highly for adaptability and hardiness tended to score highly for conservation grazing demand. For endangerment criteria, the Northern Dairy Shorthorn, Dairy Shorthorn, and Vaynol all tended to score highest.
The relationship between endangerment and marketability is outlined in Supplementary Information S5 and suggests there was no relationship between endangerment and marketability scores (r2 = 0.0); meaning other factors may be driving endangerment status. Conversely, breed diversity was (weakly) negatively correlated with endangerment (r2 = 0.3), suggesting as endangerment increases so diversity decreases, or vice versa.
Principle Component Analysis
The relationship between the different criteria used for scoring breeds is explored using PCA and is plotted using a bi-plot in Figure 5. Plot A depicts the variable loadings and principal components for all the criteria while Plot B depicts the variable loadings and principal components for the criteria nodes. The variables are plotted as vectors and the observations (i.e., breeds) are plotted as points (scores) that correspond to the different PCs. The closer the points are to one another the more similar they are in terms of variable scores. The relative importance of the variables in explaining variation in breed scores is shown based on their distance to the origin, the point where the two axes intersect at zero. The cosine of the arrows is directly proportional to the correlation between the variables and their length corresponds to the strength of that effect.
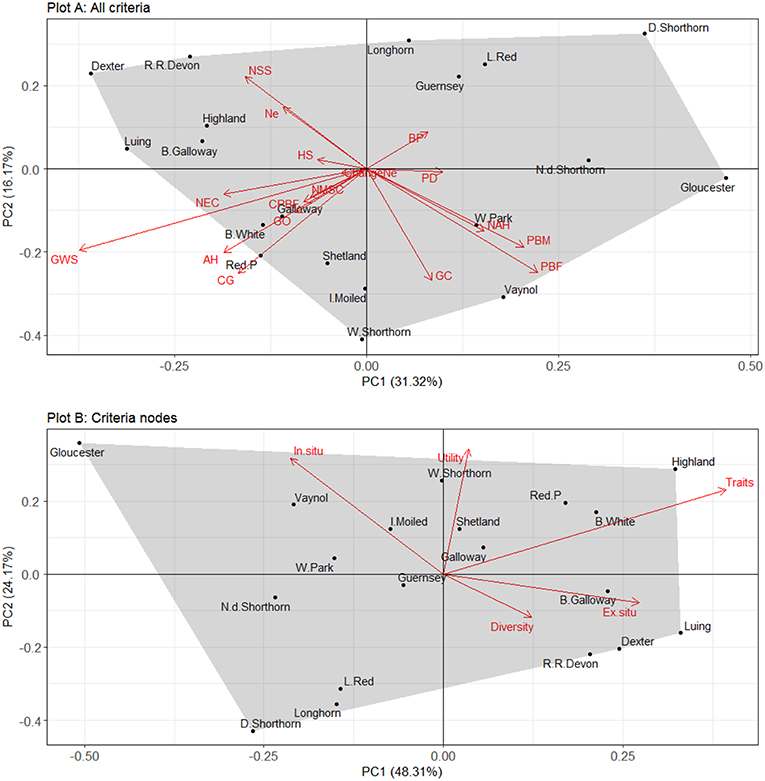
Figure 5. A bi-plot showing principle components one and two for unweighted breed scores based on the 17 different criteria (Plot A) and the 6 different criteria nodes (Plot B). Ne, effective population size; ChangeNe, percentage change to Ne; GO, geographic origin; BP, breed branded products; CG, conservation grazing demand; PD, product designations; AH, adaptability and hardiness; GWS, ability to graze wet sites; HS, heat stress tolerance or susceptibility; NEC, number of embryo collections stored; NSS, number of semen straws stored; NMSC, number of males semen collected from; GC, geographical concentration; PBF, number of pedigree breeding females in 2016; PBM, number of pedigree breeding males registering offspring in most recent year; CPBF, percentage change to number of pedigree breeding females during last 5 years; NAH, number of active herds contributing offspring in any of the last 3 years.
For Plot A (all criteria), the first and second principle components (PC1 and PC2) accounted for 31% and 16% of the variation in breed scores, respectively. Out of the 17 PCs, five had eigenvalues >1 suggesting these five PCs explain most of the variation in the variables (see Supplementary Information S7 for summary statistics). The loadings (see Supplementary Information S8 for reporting) for PC1 show three variables positively correlated with PC1; pedigree breeding females (PBF); number of active herds (NAH) and pedigree breeding males (PBM). This suggests breeds scores situated in the positive spectrum of PC1 tend to be those most endangered in situ. For PC2, Ne; breed branded products (BP) and product designations (PD) are all positively correlated with PC2.
The variable vectors show PBM, PBF, and NAH are strongly negatively correlated with number semen straws stored (NSS) and Ne, suggesting diversity and ex situ storage decrease as factors pertaining to in situ endangerment increase. Additionally, a number of variables are strongly positively correlated (e.g., PBM and PBF; NAH and PBM), suggesting the number of criteria employed in the indicator to explain breed status could be reduced in future iterations. Additionally, some variables trend together including adaptability and hardiness (AH) and conservation grazing demand (CG), suggesting more hardy/adaptable breeds are indeed preferred for conservation grazing.
For Plot B (the criteria nodes), PC1 accounts for 48% of the variance while PC2 explains 24% of variance in breed scores. Of the five PCs, two had eigenvalues >1 (see Supplementary Information S7). The loadings for PC1 (see Supplementary Information S8) show three variables are positively correlated with PC1; diversity, ex situ and traits. Breed scores in the positive spectrum of PC1 therefore scored higher for these factors and were generally less endangered. For PC2, utility and traits had the highest loadings, suggesting they were positively correlated with PC2.
The variable vectors show in situ and diversity are fairly strongly negatively correlated. This suggests breeds with a high diversity score were generally less threatened in situ—a logical finding given that a reduction in population size can cause genetic erosion. Additionally, in situ and ex situ are also negatively correlated, suggesting breeds most at risk ex situ (i.e., least genetic material stored) were also at lower risk of extinction in situ, demonstrating collection of genetic material is indeed rationalised by in situ extinction risk. None of the criteria nodes were positively correlated, suggesting these five factors are important determinants of breed status.
Allocation of a “Breed Improvement Fund”
Hypothetical funds to support the initiatives of breed societies were allocated based on a basic formula that considers the breed indicator scores and constraints relating to breed population size. The hypothetical BIF was allocated according the four weighting scenarios outlined in section Weighting the Criteria. In Figure 6, we present results from two of these scenarios (“equal weight” and “expert weight”). A summary of results from all scenarios are presented in Supplementary Information S8. The pro rata budget constraint (per animal equivalent) meant the full budget could not be allocated and total spend was therefore £8.4 million, £8.5 million, £8.5 million, and £8.2 million across the four scenarios.
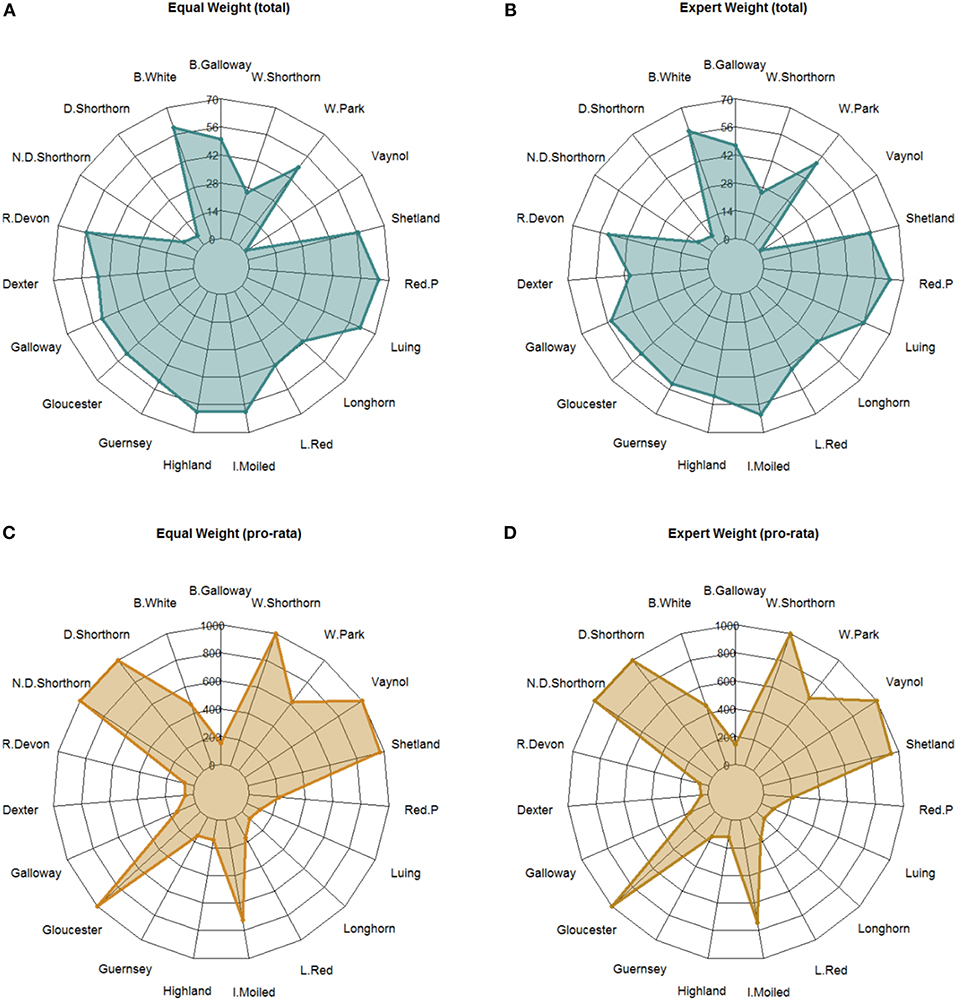
Figure 6. Radar chart showing the allocation of a hypothetical £10 million “breed improvement fund” to breed societies based on breed scores under two alternative weighting scenarios. (A,B) show the total budget allocation while plots (C,D) show the pro rata budget allocation based on a per animal constraint. For plots A and B the axes are in “£ 0000 k”.
For the total budget allocation under equal weight (Plot A), the Red Poll (£651 k) and Luing (£619 k) received the most funding while the Vaynol (£10 k), and Dairy Shorthorn (£54 k) received the least. The standard deviation of payments around the mean is £101 k. For expert weight (Plot B), the Red Poll (£631 k) and Irish Moiled (£611 k) received the highest budget allocation. Likewise, the Vaynol (£10 k), and Dairy Shorthorn (£54 k) received the least. The standard deviation of payment allocations was lowest in the expert scenario (£185 k). Across both scenarios, the breeds with the highest budget allocation range were the Dexter (£ 84 k) and the Highland (£ 80 k)—i.e., these breeds were most sensitive to a change in the criteria weights vis a vis conservation priorities. A summary of results from all scenarios are presented in Supplementary Information S9.
For the pro rata allocation, under equal weight (Plot C) the Dairy Shorthorn, Northern Dairy Shorthorn, Gloucester, Vaynol and Whitebred Shorthorn all received the maximum budget allocation (£1 k animalyear−5 equivalent) while the Dexter (£58 animalyear−5 equivalent) and Red Ruby Devon (£70 animalyear−5 equivalent) received the least. For expert weight (Plot D), the same breeds received the maximum budget allocation and likewise the Dexter (£48 animalyear−5 equivalent) and Red Ruby Devon (£66 animalyear−5 equivalent) received the least. The results demonstrate the different weighting scenarios have subtle differences on budget allocation, suggesting structural stability in the model. Moreover, the BIF allocation demonstrates the importance of applying a pro rata budget constraint; highlighting the sensitivity of the model to breed population estimates.
Discussion
Criteria to Monitor Rare Breeds
Criteria to monitor breed status can be extensive (Eaton et al., 2006). Yet, data underpinning such criteria tends to be highly limited for rare breeds reflecting a lack of characterisation and documentation. This study selected case study breeds based partly on the availability of information that could inform the MCDA model and while this may be seen as a limitation of the approach, is an example of the trade-offs apparent between scientific rigour and practicality. Indeed, during expert workshops a clear trade-off emerged between the desired robustness of approaches to monitor breed status and the need for more realistic, often proximate measures. Perhaps most complex to measure is diversity. The variation that exists within and between breeds can be captured through different metrics including measures of inbreeding (usually to monitor genetic drift), introgression (to monitor genetic purity), and genetic difference (through phylogeny or genomics).
Simplistic measures of diversity assessment have been employed by Defra (2015a, 2017b) to calculate Ne based on Wright's (1931) formula using numerical population data. However, the Wright equation assumes random selection and Poisson distributed progeny sizes, which are unlikely assumptions for most livestock populations (Gandini et al., 2004). This means it can produce an estimate of Ne that is higher than would be produced by a calculation using pedigree data (Hall, 2016). However, such data are not readily available for many native breeds and Verrier et al. (2015) found only 56% of native breeds in France had enough pedigree information to allow Ne to be calculated based on co-ancestry records. Thus, Defra data using Wright's formula (2015a, 2017b) were employed for this application but this is a limitation of the analysis.
Moving to genetic difference, work by Blott et al. (1998) and Lenstra et al. (2017) among European cattle and goat breeds shows genetic relationships between breeds does reflect their geographic origin and common ancestry. No studies have yet employed genetic techniques (e.g., phylogenetic analysis) to measure difference across all UK native cattle breeds, with the exception of smaller case studies (e.g., Wiener et al., 2004). Consequently, we used origin as a proxy to estimate the genetic difference across breeds but we acknowledge the limitations inherent in such an approach.
The two nodes of marketability (utility and traits) received lowest weight by experts, partly reflecting limitations of the input data. Additional criteria contributing to utility could include a variable denoting the presence of a rare breed in farm parks to capture cultural value as proximate to public demand for seeing a rare breed. Such cultural and heritage attributes may be at odds with maximising diversity (Lenstra et al., 2017) suggesting a need to consider these criteria in conservation and monitoring strategies seeking to supply the range of different value attributes that rare breeds encode, situated on the total economic value (TEV) spectrum. Aside non-use values, criteria to measure direct use-value associated with marketability and consumption can be approximated through product branding and designations, including geographical indicators—e.g., product designation of origin (PDO). The latter may act in perverse ways to concentrate breeding stock if a geographical production constraint is imposed (e.g., Single Gloucester PDO) thus undermining conservation effort. There is therefore an explicit need to consider such criteria in a broader framework, as demonstrated here.
While option value is promoted for conservation (Drucker, 2010; Hoffmann, 2011) the characterisation of productive and adaptive traits in native breeds is often poorly documented (Bowles, 2015). The limited number of breed traits reported in this work reflects this knowledge gap, suggesting more work is needed to characterise rare breeds through the application of genotyping technologies, including whole genome sequencing (Tixier-Boichard et al., 2015).
Turning to endangerment, although ex situ conservation was considered least important by stakeholders, it nonetheless serves as an important risk reduction strategy (Hiemstra, 2015). Yet, our understanding of the legitimacy of current accessions is poor and the criteria we employ merely quantify the material stored, rather than providing broader analytics concerning quality attributes. Developing proxies pertaining to the efficacy of material stored in genebanks would provide more accurate assessment of germplasm safeguards. For in situ populations, this assessment was limited to breed data reported to Defra and stored in their breed inventory2. But a range of additional parameters may also reveal risk, including global breed population estimates and demographic trends concerning breeders—e.g., number of young entrants to a breed (Alderson, 2010). Further exploration of these factors is needed in future prioritisation models.
Breed Indicators
Multiple indicators have been constructed for diversity (European Environment Agency, 2007; Villanueva et al., 2010; Defra, 2015b) and endangerment (Gandini et al., 2004; Eaton et al., 2006; Alderson, 2009, 2010; Verrier et al., 2015) but few have combined factors spanning diversity, marketability and endangerment to more holistically measure status. This is perhaps related to the incommensurability of many biological criteria which makes them difficult to compare on common scales without the use of analytical frameworks like MCDA.
Although endangerment received the highest overall weight in this indicator, our results demonstrate the inclusion of other criteria nodes is equally important for decision making. This is highlighted where the Vaynol received the highest endangerment score but was ranked 3rd overall because the total benefit of conservation was considered less. Alternative weighting scenarios reveal how these conservation priorities may change through a focus on different value attributes. This raises broader questions concerning who should assign criteria weights and how periodically they should be reviewed for composite indicators to be robust.
To develop this indicator, multiple expert discussions were needed to systematically construct a list of criteria that could be used to measure and report breed status. However, the PCA suggests some criteria could be omitted in future iterations due to correlation (e.g., number of pedigree breeding females and males and number of active herds) that would simplify future assessment. Yet, data concerning these criteria are readily available in the UK suggesting little benefit in dropping them from the indicator. Of more value, would be the identification of correlation in “hard to measure” criteria to reduce the monitoring burden providing reporting accuracy is retained.
The PCA also shows that each criteria node contributes differently to explaining the variance in overall breed scores, suggesting these criteria nodes are actively important for determining breed status. Construction of composite indicators can also reveal relationships between criteria that can be used to test the validity of the results. For instance, the PCA shows conservation grazing demand for cattle is indeed linked to the traits of grazing animals (i.e., breeds with greater adaptability are used more by grazers). This demonstrates the value of a rare breed is indeed partially linked to their adaptability and hardiness characteristics, a finding often promoted in the literature (e.g., Leroy et al., 2018) but with little empirical basis. Additionally, we show the collection and storage of germplasm in genebanks is rationalised by in situ endangerment risk (both via population metrics and geographical concentration) suggesting recommendations outlined by the FAO (2012) concerning rationalisation of ex situ collections are indeed being implemented by conservationists.
Differentiating Breed Support
The preservation of biodiversity, including breed diversity, is hindered by the absence of a workable, cost effective model for determining preservation priorities (Metrick and Weitzman, 1998). The defining limitation is the lack of an overarching objective to guide investments that has led to untargeted policy interventions seeking to preserve diversity indiscriminately. While empirical work has explored prioritisation, both for FAnGR (Reist-Marti et al., 2003; Simianer et al., 2003; Zander et al., 2009) and plant genetic resources (PGR) conservation (Maxted et al., 2012; Vincent et al., 2013) the policy landscape is still dominated by uniform payment mechanisms that incentivise conservation actions.
Conceptually, this MCDA model suggests differentiated breed support could improve the cost effectiveness of conservation strategies through the distribution of a BIF prioritised by breed indicator scores. Approaches in the UK currently preserve rare breeds through conservation grazing subsidies (Natural England, 2017) but breeds or species that are not employed for conservation grazing are ultimately under-supplied through such initiatives. Indeed, this is different from typical approaches in Europe, which typically employ “payment per head” type schemes seeking to subsidise the income forgone for keeping a rare breed (Kompan et al., 2014). More direct support measures, such as those employed in Europe, are therefore necessary to supply more diversity.
Differentiated support can also facilitate more targeted interventions, which our results suggest are necessary given that the contribution of each breed to the criteria nodes is heterogeneous. For instance, the Red Ruby Devon scored high in diversity but relatively low in marketability, suggesting investments in breed promotion may be more effective at improving breed status (rather than collecting germplasm, for instance). While unconventional, some countries in Europe (e.g., Austria) are indeed pursuing differentiated policy approaches to breed support but with mixed effects concerning effectiveness. Piloting such an approach in the UK context may provide valuable insights for constructing a new policy framework.
Although the important role of breed societies has been acknowledged in previous work (e.g., Ramsay et al., 2003; Felius et al., 2015) we are the first (to our knowledge) to promote the allocation of conservation funds across societies. Importantly, the BIF ensures all breeds receive some proportion of funding. While the proposed BIF can discriminate well between breeds with similar population sizes, it is less effective for breeds with particularly small populations because the pro rata allocation constraint means final funding allocations are very low Alternative approaches to the prioritisation of breeds for conservation (e.g., Simianer et al., 2003) suggest only breeds where the conservation potential is greatest (i.e., where the product of extinction probability and marginal diversity is maximum) should receive support. We argue such approaches are perhaps defeatist and is an ethically pernicious approach to decision making (Noss, 1996; Vucetich et al., 2017). Moreover, while prioritisation focusing solely on phenotype or genotype “uniqueness” is too limited in scope, this study addresses such limitations through the inclusion of a marketability node that attempts to capture option and cultural value in addition to diversity and endangerment attributes. Beyond these factors, this MCDA model does not imply abolishing support for redundant or overlapping diversity; it simply suggests a step change on the supply-side that prioritises preferences exhibited on the demand side.
Scaling up the Approach: National and Regional Context
The GPA for FAnGR has stressed the need to construct indicators to better monitor breed attributes and, crucially, develop more systematic conservation responses. The conservation community currently lacks a harmonised approach to document changes in the status of breed diversity that can be used to inform conservation policies. We present a framework that at the core considers diversity, marketability and endangerment attributes as a function of conservation need and utilitarian benefit. While the specific sub-criteria to document breed status may require adapting to country-specific circumstances and data provision (Porter et al., 2016), the overarching framework provides a necessary approach to contrast national FAnGR stocks and improve regional monitoring.
Much of the information documented in this work was readily available (albeit in a UK context) and has been reviewed by experts to “sense check” the findings. We argue a committee of national or regional experts could play a pivotal role in adopting such a framework and, if necessary, commissioning surveys to acquire relevant information if not readily available, while noting that many developing countries may only have limited data capture resources. This highlights the importance of developing proxies where applicable. Although data capture priorities may vary across different regions/countries, we note the most important high-level criteria node identified here was endangerment, suggesting this should be prioritised if only limited resources are available for documenting breed characteristics (Ruane, 2000).
The FAO already promotes the use of a National Coordinator for FAnGR management as part of the Interlaken Deceleration (FAO, 2007) and a National Committee would go one step further. Indeed, a National Committee could determine the weights of the different criteria as a function of country-specific conditions (i.e., drivers of genetic erosion and livestock sector FAnGR needs). The panel of experts must be diverse enough to represent different backgrounds, breeding associations and professional activities related to the livestock sector (Duruz et al., 2017), as employed in this study. The high-level criteria used to score breeds should remain consistent across countries and we suggest similar to those documented here and in other, earlier works (e.g., Ruane, 2000). The FAOs Domestic Animal Diversity Information System (DAD-IS) is a global information sharing platform for FAnGR and represents a potential web-based platform for hosting a regionally harmonised multi-criteria indicator. Such a web-based platform could follow a similar approach to that documented by Duruz et al. (2017) and may be deployed to rationalise national investments in breed genetic diversity.
Conclusions
This study aimed to outline a new methodological framework for monitoring and allocating conservation investments across rare breeds, through a multi criteria approach. This is important because financial resources for species and livestock conservation remain significantly below that required to meet the Aichi biodiversity targets (McCarthy et al., 2012). The opportunity cost of conservation (i.e., what else could be achieved with the same funding resources) is rarely reported or evaluated, yet potential reductions in UK conservation funding as a result of Brexit (the UK's departure from the European Union) means such trade-offs are likely to become more explicit. However, Brexit also creates an opportunity to adjust how the UK Government supports the public good properties of rare breeds that span the TEV framework. This, of course, depends how the UK Government prioritise future FAnGR conservation within broader conservation agendas.
Better informed decision-making should consider information on the values of breeds held by stakeholders, the expected benefit to diversity from investments, and the cost of action. Considering these factors through the prioritised allocation of a BIF could better guide investments in FAnGR that promote the longer-term sustainability of breeds. The former relies on empowering breed societies to selectively fund initiatives aimed at improving breed status relative to the multiple values that rare breeds encode. Prioritising conservation activities is important because extinction risk may take a number of different forms, including introgression, inbreeding depression and genetic drift (Berthouly-Salazar et al., 2012).
A key feature of MCDA is its emphasis on the judgement of the decision-making team and the subjectivity that pervades this can be a matter of concern. While we have attempted to account for such limitations through multiple stakeholder workshops and sensitivity analysis, it should be appreciated that different stakeholder views may produce conflicting results. Indeed we acknowledge this limitation but stress that participants contributing to this analytical exercise represented a broad spectrum of interests across the FAnGR community. This range of interests, coupled with the expertise of stakeholders, is a key strength of MCDA approaches (Dodgson et al., 2009).
The way in which questions are posed to elicit criteria weights may also affect outcomes (Choo et al., 1999) and we have mitigated such concerns by following the recommended methodological approach for MCDA by the UK Government (Dodgson et al., 2009). A logical extension to this study would be to validate the approach across different species, while also noting that species specific adjustments to some criteria may be needed. Moreover, the criteria used here reflect circumstances in the UK and alternative criteria may be needed for application in other regions and especially developing countries, where the available information and primary causes of genetic erosion vary (Verrier et al., 2015). For instance, indiscriminate cross breeding tends to be a major issue in Sub-Saharan Africa but is less of an issue in Europe and particularly the UK (FAO, 2015).
Lastly, this work shows large gaps in information persist for rare and native breeds which impedes characterisation of FAnGR. These gaps are most prevalent in developing countries where the characterisation of genetic resources is severely limited due to financial and technological constraints. There is a need to define key phenotypic traits and characteristics so FAnGR can be evaluated through comparable data sets, which is important for climate change adaptation (Hoffmann, 2010; Bruford et al., 2015). A growing arsenal of increasingly sophisticated genetic technologies are now falling in price (e.g., DNA sequencing) and there is a clear need to apply such approaches to better appreciate locally adapted breed traits for FAnGR conservation and sustainable use.
Author Contributions
WW formulated the MCDA model and wrote ~80% of the manuscript. BV and AM helped formulate the MCDA model and administer the relevant stakeholder workshops. BV, AM, DM, and GS helped write and edit the manuscript and provided technical support throughout.
Funding
The research for this paper was funded as part of The Scottish Government Strategic Research Programme 2016–2021, work package 2.3 Agricultural Systems and Land Management and the IMAGE (Innovative Management of Animal Genetic Resources) project funded under the European Union's Horizon 2020 research and innovation program under grant agreement No 677353.
Conflict of Interest Statement
The authors declare that the research was conducted in the absence of any commercial or financial relationships that could be construed as a potential conflict of interest.
Acknowledgments
We acknowledge NERC E3 DTP studentship (NE/L002558/1) and the Scottish Government for their funding. Thanks to Ruth Dalton, Libby Henson and Julian Hosking for additional support during the project and RBST for assisting in organisation of workshops and supplying a venue for them to be held. Finally, we thank workshop participants for their assistance during initial scoping, scoring, and weighting exercises.
Supplementary Material
The Supplementary Material for this article can be found online at: https://www.frontiersin.org/articles/10.3389/fevo.2019.00110/full#supplementary-material
Footnotes
1. ^A breed may be classified as NBAR if it satisfies both genealogical and heritage attributes pertaining to origin and numerical population size associated with at-risk thresholds (Defra, 2013).
2. ^For the breed inventory see https://www.gov.uk/government/statistics/uk-farm-animal-genetic-resources-fangr-breed-inventory-results
References
Abdi, H., and Williams, L. J. (2010). Principal component analysis. Wiley Interdiscip. Rev. Comput. Stat. 2, 433–459. doi: 10.1002/wics.101
Adem Esmail, B., and Geneletti, D. (2018). Multi-criteria decision analysis for nature conservation: a review of 20 years of applications. Methods Ecol. Evol. 9, 42–53. doi: 10.1111/2041-210X.12899
Alderson, L. (2009). Breeds at risk: definition and measurement of the factors which determine endangerment. Livest. Sci. 123, 23–27. doi: 10.1016/j.livsci.2008.10.001
Alderson, L. (2010). Breeds at Risk: Criteria and Classification. Joint ERFP/RBI/RBST Workshop Summary Report, London.
Belton, V., and Stewart, T. (2002). Multiple Criteria Decision Analysis: An Integrated Approach. Springer Science and Business Media.
Berthouly-Salazar, C., Thévenon, S., Van, T. N., Nguyen, B. T., Pham, L. D., Chi, C. V., et al. (2012). Uncontrolled admixture and loss of genetic diversity in a local Vietnamese pig breed. Ecol. Evol. 2, 962–975. doi: 10.1002/ece3.229
Blott, S. C., Williams, J. L., and Haley, C. S. (1998). Genetic relationships among European cattle breeds. Anim. Genet. 29, 273–282. doi: 10.1046/j.1365-2052.1998.00327.x
Bojkovski, D., Simčič, M., and Kompan, D. (2015). Supports for local breeds in the European region–an overview. PoljoPrivreda 21, 7–10. doi: 10.18047/poljo.21.1.sup.1
Bowles, D. (2015). Recent advances in understanding the genetic resources of sheep breeds locally-adapted to the UK uplands: opportunities they offer for sustainable productivity. Front. Genet. 6:24. doi: 10.3389/fgene.2015.00024
Bruford, M. W., Ginja, C., Hoffmann, I., Joost, S., Orozco-terWengel, P., Alberto, F. J., et al. (2015). Prospects and challenges for the conservation of farm animal genomic resources, 2015-2025. Front. Genet. 6:314. doi: 10.3389/fgene.2015.00314
Choo, E. U., Schoner, B., and Wedley, W. C. (1999). Interpretation of criteria weights in multicriteria decision making. Comput. Ind. Eng. 37, 527–541. doi: 10.1016/S0360-8352(00)00019-X
Defra (2013). UK Country Report on Farm Animal Genetic Resources 2012. Department for Environment, Food and Rural Affairs.
Defra (2015a). UK Biodiversity Indicators 2015: C9a. Animal Genetic Resources: Effective Population Size of Native Breeds at Risk. London.
Defra (2015b). UK Biodiversity Indicators 2015. Effective Population Size of Native Breeds at Risk. Technical background document. London.
Defra (2018). Health and Harmony: The Future for Food, Farming and the Environment in a Green Brexit. London.
Dodgson, J. S., Spackman, M., Pearman, A., and Phillips, L. D. (2009). Multi-Criteria Analysis: A Manual. London: Department for Communities and Local Government.
Drucker, A. G. (2010). Where's the beef? The economics of AnGR conservation and its influence on policy design and implementation. Anim. Genet. Resour. 47, 85–90. doi: 10.1017/S2078633610000913
Drucker, A. G., Gomez, V., and Anderson, S. (2001). The economic valuation of farm animal genetic resources: a survey of available methods. Ecol. Econ. 36, 1–18. doi: 10.1016/S0921-8009(00)00242-1
Dulloo, M. E., Rege, J. E. O., Ramirez, M., Drucker, A. G., Padulosi, S., Maxted, N., et al. (2017). “Conserving agricultural biodiversity for use in sustainable food systems,” in Bioversity International (2017) Mainstreaming Agrobiodiversity in Sustainable Food Systems: Scientific Foundations for an Agrobiodiversity Index (Rome), 103–140.
Duruz, S., Flury, C., Matasci, G., Joerin, F., Widmer, I., and Joost, S. (2017). A WebGIS platform for the monitoring of Farm Animal Genetic Resources (GENMON). PLoS ONE 12:e0176362. doi: 10.1371/journal.pone.0176362
Eaton, D. J. F., Windig, J. J., Hiemstra, S. J., van Veller, M. G. P., Trach, N. X., Hao, P. X., et al. (2006). Indicators for Livestock and Crop Biodiversity. Wageningen: Centre for Genetic Resources; WUR.
Eisler, M. C., Lee, M. R., Tarlton, J. F., Martin, G. B., Beddington, J., Dungait, J. A., et al. (2014). Steps to sustainable livestock. Nature 507:32. doi: 10.1038/507032a
European Environment Agency (2007). Halting the Loss of Biodiversity by 2010: Proposal for a First Set of Indicators to Monitor Progress in Europe. EEA Technical Report No 11/2007.
Falconer, D. S., and Mackay, T. F. C. (1996). Introduction to Quantitative Genetics, 4th Edn. Edinburgh: Wesley Longman Limited.
FAO (2007). Global Plan of Action for Farm Animal Genetic Resources and the Interlaken Declaration. Rome.
FAO (2012). Cryoconservation of Animal Genetic Resources. FAO Animal Production and Health Guidelines No. 12. Rome.
Felius, M., Theunissen, B., and Lenstra, J. A. (2015). Conservation of cattle genetic resources: the role of breeds. J. Agric. Sci. 153, 152–162. doi: 10.1017/S0021859614000124
Ferretti, V., and Comino, E. (2015). An integrated framework to assess complex cultural and natural heritage systems with multi-attribute value theory. J. Cult. Herit. 16, 688–697. doi: 10.1016/j.culher.2015.01.007
Gandini, G. C., Ollivier, L., Danell, B., Distl, O., Georgoudis, A., Groeneveld, E., et al. (2004). Criteria to assess the degree of endangerment of livestock breeds in Europe. Livest. Prod. Sci. 91, 173–182. doi: 10.1016/j.livprodsci.2004.08.001
Greco, S., Figueira, J., and Ehrgott, M. (2016). Multiple Criteria Decision Analysis: State of the Art Surveys, 2nd Edn. Springer's International series. New York, NY: Springer.
Hall, S. J. (2016). Effective population sizes in cattle, sheep, horses, pigs and goats estimated from census and herdbook data. Animal 10, 1–8. doi: 10.1017/S1751731116000914
Herzon, I., Birge, T., Allen, B., Povellato, A., Vanni, F., Hart, K., et al. (2018). Time to look for evidence: results-based approach to biodiversity conservation on farmland in Europe. Land Policy 71, 347–354. doi: 10.1016/j.landusepol.2017.12.011
Hiemstra, S. J. (2015). “Ex situ conservation of farm animal genetic resources in Europe,” in Workshop on AnGR ex-situ Conservation in Spain (Madrid: Regional Focal Point for AnGR).
Hoffmann, I. (2010). Climate change and the characterization, breeding and conservation of animal genetic resources. Anim. Genet. 41, 32–46. doi: 10.1111/j.1365-2052.2010.02043.x
Hoffmann, I. (2011). Livestock biodiversity and sustainability. Livest. Sci. 139, 69–79. doi: 10.1016/j.livsci.2011.03.016
Huang, I. B., Keisler, J., and Linkov, I. (2011). Multi-criteria decision analysis in environmental sciences: ten years of applications and trends. Sci. Total Environ. 409, 3578–3594. doi: 10.1016/j.scitotenv.2011.06.022
Jankowski, P., and Richard, L. (1994). Integration of GIS-based suitability analysis and multicriteria evaluation in a spatial decision support system for route selection. Environ. Plan. B Plan. Des. 21, 323–340. doi: 10.1068/b210323
Jolliffe, I. (2011). “Principal component analysis,” in International Encyclopedia of Statistical Science (New York, NY: Springer Series in Statistics), 1094–1096.
Kompan, D., Klopcic, M., Martyniuk, E., Hiemstra, S. J., and Hoving, A. H. (2014). Overview and Assessment of Support Measures for Endangered Livestock Breeds: Subsibreed: Final Project Report. European Regional Focal Point for Animal Genetic Resources.
Kuhfuss, L., Préget, R., Thoyer, S., and Hanley, N. (2015). Nudging Farmers to Sign Agri-Environmental Contracts: The Effects of a Collective Bonus. St. Andrews: University of St. Andrews Discussion Paper.
Lauvie, A., Couix, N., and Verrier, E. (2014). No development, no conservation: elements from the conservation of farm animal genetic resources. Soc. Nat. Resour. 27, 1331–1338. doi: 10.1080/08941920.2014.933922
Lenstra, J. A., Tigchelaar, J., Biebach, I., Hallsson, J. H., Kantanen, J., et al. (2017). Microsatellite diversity of the Nordic type of goats in relation to breed conservation: how relevant is pure ancestry? J. Anim. Breed. Genet. 134, 78–84. doi: 10.1111/jbg.12226
Leroy, G., Baumung, R., Boettcher, P., Besbes, B., From, T., and Hoffmann, I. (2018). Animal genetic resources diversity and ecosystem services. Glob. Food Sec. 17, 84–91. doi: 10.1016/j.gfs.2018.04.003
Lindenmayer, D. B., Zammit, C., Attwood, S. J., Burns, E., Shepherd, C. L., Kay, G., et al. (2012). A novel and cost-effective monitoring approach for outcomes in an Australian biodiversity conservation incentive program. PLoS ONE 7:e50872. doi: 10.1371/journal.pone.0050872
Maxted, N., Kell, S., Ford-Lloyd, B., Dulloo, E., and Toledo, Á. (2012). Toward the systematic conservation of global crop wild relative diversity. Crop Sci. 52, 774–785. doi: 10.2135/cropsci2011.08.0415
McCarthy, D. P., Donald, P. F., Scharlemann, J. P., Buchanan, G. M., Balmford, A., Green, J. M., et al. (2012). Financial costs of meeting global biodiversity conservation targets: current spending and unmet needs. Science. 338:1229803. doi: 10.1126/science.1229803
Mendoza, G. A., and Martins, H. (2006). Multi-criteria decision analysis in natural resource management: a critical review of methods and new modelling paradigms. For. Ecol. Manage. 230, 1–22. doi: 10.1016/j.foreco.2006.03.023
Metrick, A., and Weitzman, M. L. (1998). Conflicts and choices in biodiversity preservation. J. Econ. Perspect. 12, 21–34. doi: 10.1257/jep.12.3.21
Naidoo, R., Balmford, A., Ferraro, P. J., Polasky, S., Ricketts, T. H., and Rouget, M. (2006). Integrating economic costs into conservation planning. Trends Ecol. Evol. 21, 681–687. doi: 10.1016/j.tree.2006.10.003
Natural England (2017). SP8: Native Breeds at Risk Supplement [WWW Document]. (accessed February 6, 2018).
Noss, R. F. (1996). Conservation or convenience? Conserv. Biol. 10, 921–922. doi: 10.1046/j.1523-1739.1996.10040921.x
Nutt, D. J., King, L. A., and Phillips, L. D. (2010). Drug harms in the UK: a multicriteria decision analysis. Lancet 376, 1558–1565. doi: 10.1016/S0140-6736(10)61462-6
Parker, H. G., Dreger, D. L., Rimbault, M., Davis, B. W., Mullen, A. B., Carpintero-Ramirez, G., et al. (2017). Genomic analyses reveal the influence of geographic origin, migration, and hybridization on modern dog breed development. Cell Rep. 19, 697–708. doi: 10.1016/j.celrep.2017.03.079
Pascual, U., and Perrings, C. (2007). Developing incentives and economic mechanisms for in situ biodiversity conservation in agricultural landscapes. Agric. Ecosyst. Environ. 121, 256–268. doi: 10.1016/j.agee.2006.12.025
Pattison, J., Drucker, A. G., and Anderson, S. (2007). The cost of conserving livestock diversity? Incentive measures and conservation options for maintaining indigenous Pelón pigs in Yucatan, Mexico. Trop. Anim. Health Prod. 39, 339–353. doi: 10.1007/s11250-007-9022-4
Phua, M.-H., and Minowa, M. (2005). A GIS-based multi-criteria decision making approach to forest conservation planning at a landscape scale: a case study in the Kinabalu Area, Sabah, Malaysia. Landsc. Urban Plan. 71, 207–222. doi: 10.1016/j.landurbplan.2004.03.004
Porter, V., Alderson, L., Hall, S. J. G., and Sponenberg, D. P. (2016). Mason's World Encyclopedia of Livestock Breeds and Breeding, 2 Volume Pack. Wallingford, UK: Cabi.
R Core Team (2018). R: A Language and Environment for Statistical Computing. Vienna: R Foundation for Statistical Computing. Available online at: https://www.R-project.org/ (accessed May 18, 2018).
Ramsay, K., Hunlun, C., and Kotze, A. (2003). The role of breed societies and breed conservation non-governmental organizations in community-based management of farm animal genetic resources. Community Based Manag. Anim. Genet. Resour. 131.
Regan, H. M., Davis, F. W., Andelman, S. J., Widyanata, A., and Freese, M. (2007). Comprehensive criteria for biodiversity evaluation in conservation planning. Biodivers. Conserv. 16, 2715–2728. doi: 10.1007/s10531-006-9100-3
Rege, J. E. O., and Okeyo, A. M. (2006). Improving Our Knowledge of Tropical Indigenous Animal Genetic Resources. Nairobi: International Livestock Research Institute (ILRI).
Reist-Marti, S. B., Simianer, H., Gibson, J., Hanotte, O., and Rege, J. E. O. (2003). Weitzman's approach and conservation of breed diversity: an application to African cattle breeds. Conserv. Biol. 17, 1299–1311. doi: 10.1046/j.1523-1739.2003.01587.x
Ruane, J. (2000). A framework for prioritizing domestic animal breeds for conservation purposes at the national level: a Norwegian case study. Conserv. Biol. 14, 1385–1393. doi: 10.1046/j.1523-1739.2000.99276.x
Simianer, H., Marti, S. B., Gibson, J., Hanotte, O., and Rege, J. E. O. (2003). An approach to the optimal allocation of conservation funds to minimize loss of genetic diversity between livestock breeds. Ecol. Econ. 45, 377–392. doi: 10.1016/S0921-8009(03)00092-2
Strager, M. P., and Rosenberger, R. S. (2006). Incorporating stakeholder preferences for land conservation: weights and measures in spatial MCA. Ecol. Econ. 58, 79–92. doi: 10.1016/j.ecolecon.2005.05.024
Tixier-Boichard, M., Verrier, E., Rognon, X., and Zerjal, T. (2015). Farm animal genetic and genomic resources from an agroecological perspective. Front. Genet. 6:153. doi: 10.3389/fgene.2015.00153
Verrier, E., Audiot, A., Bertrand, C., Chapuis, H., Charvolin, E., Danchin-Burge, C., et al. (2015). Assessing the risk status of livestock breeds: a multi-indicator method applied to 178 French local breeds belonging to ten species. Anim. Genet. Resour. 57, 105–118. doi: 10.1017/S2078633615000260
Villanueva, B., Sawalha, R. M., Roughsedge, T., Rius-Vilarrasa, E., and Woolliams, J. A. (2010). Development of a genetic indicator of biodiversity for farm animals. Livest. Sci. 129, 200–207. doi: 10.1016/j.livsci.2010.01.025
Vincent, H., Wiersema, J., Kell, S., Fielder, H., Dobbie, S., Castañeda-Álvarez, N. P., et al. (2013). A prioritized crop wild relative inventory to help underpin global food security. Biol. Conserv. 167, 265–275. doi: 10.1016/j.biocon.2013.08.011
Vollmer, D., Pribadi, D. O., Remondi, F., Rustiadi, E., and Grêt-Regamey, A. (2016). Prioritizing ecosystem services in rapidly urbanizing river basins: a spatial multi-criteria analytic approach. Sustain. Cities Soc. 20, 237–252. doi: 10.1016/j.scs.2015.10.004
Vucetich, J. A., Nelson, M. P., and Bruskotter, J. T. (2017). Conservation triage falls short because conservation is not like emergency medicine. Front. Ecol. Evol. 5:45. doi: 10.3389/fevo.2017.00045
Wang, J.-J., Jing, Y.-Y., Zhang, C.-F., and Zhao, J.-H. (2009). Review on multi-criteria decision analysis aid in sustainable energy decision-making. Renew. Sustain. Energy Rev. 13, 2263–2278. doi: 10.1016/j.rser.2009.06.021
Weitzman, M. L. (1993). What to preserve? An application of diversity theory to crane conservation. Q. J. Econ. 108, 157–183. doi: 10.2307/2118499
Wiener, P., Burton, D., and Williams, J. L. (2004). Breed relationships and definition in British cattle: a genetic analysis. Heredity 93, 597–602. doi: 10.1038/sj.hdy.6800566
Keywords: rare breeds, farm animal genetic resources, multi criteria decision analysis, incentive payments, prioritization
Citation: Wainwright W, Vosough Ahmadi B, Mcvittie A, Simm G and Moran D (2019) Prioritising Support for Cost Effective Rare Breed Conservation Using Multi-Criteria Decision Analysis. Front. Ecol. Evol. 7:110. doi: 10.3389/fevo.2019.00110
Received: 25 August 2018; Accepted: 19 March 2019;
Published: 11 April 2019.
Edited by:
Stéphane Joost, École Polytechnique Fédérale de Lausanne, SwitzerlandReviewed by:
Solange Duruz, École Polytechnique Fédérale de Lausanne, SwitzerlandBlal Adem Esmail, University of Trento, Italy
Copyright © 2019 Wainwright, Vosough Ahmadi, Mcvittie, Simm and Moran. This is an open-access article distributed under the terms of the Creative Commons Attribution License (CC BY). The use, distribution or reproduction in other forums is permitted, provided the original author(s) and the copyright owner(s) are credited and that the original publication in this journal is cited, in accordance with accepted academic practice. No use, distribution or reproduction is permitted which does not comply with these terms.
*Correspondence: Warwick Wainwright, d2Fyd2ljay53YWlud3JpZ2h0QHNydWMuYWMudWs=