 Brody Sandel
- Department of Biology, Santa Clara University, Santa Clara, CA, United States
Climate change is expected to drive changes in the structure of ecological assemblages, but these responses might show considerable time lags. If these lags are large, then the observed composition of assemblages will fall out of equilibrium with current climatic conditions. This disequilibrium has several expected signatures, including trends in the magnitude of climate relationships through time and stronger climate relationships across space than through time. Here, I describe spatial and temporal patterns of functional assemblage composition of birds and trees and ask whether there is evidence of disequilibrium between climate and functional assemblage structure. I used bird assemblage data from the Breeding Bird Survey (BBS) and tree data from the Forest Inventory and Analysis program (FIA), in both cases spanning the continental United States and covering the time period 1970–2016. To describe functional assemblage composition, I used the community weighted means of five functional traits for trees and six traits for birds, and fit linear models to explain the variation in composition through time and across space. For most traits, spatial relationships were much stronger than temporal relationships, consistent with lagged responses of assemblages to climate change. Several of the traits showed trends over the study period, in some cases associated with trends in mean annual temperature. Others showed dynamics in the spatial relationships between climate and trait values. For example, the mean clutch size of birds depended only weakly on temperature in the early study period, but the relationship became strongly negative by 2016. While precipitation was often an important predictor of spatial patterns of functional composition, it was typically weakly correlated with the temporal patterns. This likely reflects the fact that temperature experienced more consistent long-term trends over the study period, whereas large year-to-year fluctuations in precipitation prevent composition from ever coming into equilibrium with precipitation in a particular year. Overall, there was substantial evidence of disequilibrium between functional assemblage composition and climate.
Introduction
Environmental conditions strongly influence the composition of ecological assemblages, and changes in these conditions are therefore expected to drive dynamics in composition. These include shifts in relative abundance of resident species, local extirpation, and colonization by new species. However, these dynamics may be slow relative to the pace of changing conditions, in which case past conditions will leave a legacy on current composition (Svenning and Sandel, 2013; Blonder et al., 2018). For example, after a particular change in conditions, species that are no longer well adapted may maintain a sink population at a site for years or even centuries. At the same time, dispersal lags may prevent the establishment of new species at that site, sometimes for millennia (Svenning and Sandel, 2013). The unexpected presence of unsuitable species or absence of suitable species in a particular set of conditions are ecological legacies of the previous conditions.
When these legacies occur, the ecological response to a change in an environmental condition will be more sensitive across space than through time. This is because changes through time at one location are constrained by legacy effects at that location. For example, across grassland sites in the central United States, there is a strong positive correlation between annual precipitation and aboveground NPP. At one such site, there is also a positive relationship between rainfall in 1 year and production in that year, but the relationship has a substantially lower slope (Lauenroth and Sala, 1992). This lower slope likely reflects the fact that assemblage dynamics are typically slower than the dynamics in precipitation, such that the productivity observed at any one time is a function of the integral of precipitation over multiple preceding years. Thus, those preceding years exert a legacy that prevents complete equilibrium between productivity in 1 year and precipitation in that year.
Slow assemblage dynamics relative to the environmental factors that drive change can also leave legacies in the functional composition of assemblages. In Europe, plant assemblages have higher functional diversity and functional dispersion in areas that have experienced relatively stable temperatures during the Late Quaternary, suggesting that more rapidly changing climate lead to lags in the build-up of functional diversity (Ordonez and Svenning, 2015, 2016). Similarly, in the New World, paleoclimatic conditions influence the functional composition and functional diversity of plant assemblages (Blonder et al., 2018). Globally, historically unstable climates are associated with shorter tree canopies (Zhang et al., 2016), while New World palms have larger fruits in less stable climates (Göldel et al., 2015). On shorter time scales, shifts in the functional composition of grassland plant assemblages following experimental watering do not reflect changes in composition along natural precipitation gradients (Sandel et al., 2010). This is probably because community dynamics are relatively slow. Dry-adapted species that have historical been common are likely to continue to be common at a site for some time even after conditions at that site have become less suitable for them. On the other hand, wet-adapted species might be rare or absent from a site and take years or decades to reach their new equilibrial abundance. Consistent with this idea, plants have shifted their distributions under recent climate change, but more slowly than climate conditions themselves have shifted (Bertrand et al., 2011; Ash et al., 2017).
Despite being more mobile than plants, similar lags have been observed for birds. Bird range shifts in North America and Europe have lagged behind the shifts in climate conditions (Devictor et al., 2008; La Sorte and Jetz, 2012; Lehikoinen and Virkkala, 2016; but see Currie and Venne, 2017). This may have resulted in community composition falling out of equilibrium with climate. Indeed, spatial relationships suggest that warmer temperatures should be associated with smaller bird body masses, but warming trends over 27 years have instead been accompanied by increases in community-averaged body mass (La Sorte et al., 2009). This could reflect an influence of body mass on lag times: greater dispersal ability of large-bodied species could lead to greater representation of these species following some climate change. Bird community composition also responds differently to spatial and temporal changes in landscape heterogeneity (Bonthoux et al., 2013). Still, while birds have shown important lags in many cases, we might generally expect them to respond faster than trees, which are longer-lived and not mobile.
These patterns have important implications for the dynamics and function of ecosystems under climate change, as well as for our ability to predict species responses to climate change. NPP, for example, is influenced by an array of factors ranging from microbial respiration rates to changes in soil nutrient pools, which can change with very different lags. Thus, it is likely that the response of NPP to warming will be complex, exhibiting changing magnitudes and perhaps directions over time (Shaver et al., 2000; Rustad, 2006). Indeed, experimental warming studies have found that early responses of NPP and carbon fluxes can differ dramatically from those observed after several years of treatment (e.g., Melillo et al., 2002; Xu et al., 2012). Despite this, large-scale models of ecosystem dynamics often predict smooth trajectories of change in parameters such as NPP and soil C under warming (e.g., Cramer et al., 2001; Gang et al., 2017). The dynamics of responses to changing NPP might also be complex. Across space, bird richness increases with NPP, but negative and positive relationships are roughly equally common through time (Dobson et al., 2015).
Unfortunately, the complexity introduced by lagged responses at multiple time scales also complicate predictions from experimental studies. In forests, for example, dynamics in species abundances can be extremely slow, showing legacies for a thousand years or more (Pacala et al., 1996; Svenning and Sandel, 2013). Dynamics in assemblages of highly mobile organisms or those with shorter generation times might generally be faster, but are probably often longer than most experimental manipulations are maintained. Thus, long-term dynamics may not be predicted by short-term responses (Sandel et al., 2010). On the other hand, space-for-time substitutions may also provide a poor prediction for short-term dynamics because the climate differences that exist across space have typically existed for a long time, whereas the change in assemblages caused by a change in conditions at one location will be constrained by the legacy of the previous assemblage composition (Adler and Levine, 2007; Blois et al., 2013). Thus, it is of fundamental importance to understand the dynamics of assemblage composition across both spatial and temporal climate gradients.
Here, I compare temporal and spatial relationships between climate and functional assemblage composition. Lags induced by slow community dynamics should cause assemblage composition to fall out of equilibrium with climatic conditions, causing weaker relationships between climate and functional composition across time than across space. I ask whether these temporal relationships are indeed weaker, using tree and bird assemblage data from the US.
Materials and Methods
Data
Assemblage Composition
Tree assemblage data were obtained from the Forest Inventory and Analysis (FIA) project (Bechtold and Patterson, 2005). The FIA monitors a massive network of forest plots across the United States, with a return interval of 5–7 years in the eastern US and 10 years in the western US. Though the sampling protocol in the early years varied among regions, beginning in 1995 the FIA established a national standard plot layout (Bechtold and Patterson, 2005). Here, I use data from 4 “microplots” at each sampling location, each 2.07 m in radius. All trees above 1 inch (2.54 cm) dbh were recorded. For each sampling location in each year, I computed the relative abundance of each species by dividing the number of trees of that species by the total number of trees.
I used FIA data from 1970 to 2016. Sampling intensity has increased through time, from about 5,000 plots per year in the 1970s to about 20,000 plots per year in the 2000s. In total, the FIA dataset here contains relative abundances for 401 tree species across 626,841 site-year combinations.
I used the Breeding Bird Survey (BBS) to describe bird assemblage composition through space and time (Pardieck et al., 2018). BBS surveys occur during the height of the breeding season, mainly in June. Surveyors follow a route (about 24.5 miles long), stopping every 0.5 mile to conduct a 3 min point count of birds seen or heard within 0.25 miles. Again, sampling effort has increased through time, from about 1500 routes per year in the 1970 s to 2500 routes per year in the 2000 s. For each route, I calculated the relative abundance of each bird species, removing the occasional nocturnal species (33 total) as these are not typically detected during the surveys. I used survey data from 1970 through 2016. In total, the BBS dataset here contains relative abundances for 601 bird species across 102,854 route-year combinations.
Functional Traits
For trees and birds, I selected a small suite of functional traits that are expected to relate to their ecological and life history strategies. For trees, I used five traits: specific leaf area (SLA), leaf nitrogen concentration per mass (Nmass), maximum height (Height), seed mass (Seed) and wood density (WD). Seed mass data were taken from the Kew Gardens Seed Information Database (Royal Botanic Gardens Kew., 2018), while the other trait data came from TRY—The Plant Trait Database (Kattge et al., 2011, full references for all data sources are in Data Sheet 2). Of 401 unique taxon names in the FIA data, 43 were identified only to genus or family. Of the remaining 358, I have SLA data for 52.5%, height for 88.9%, Nmass for 48.3%, Seed mass for 79.0%, and WD for 58.9% of species. However, more common species are more likely to have measured trait values, so the mean coverage of traits at the assemblage level was above 86% in all cases (SLA: 88.2%, Height: 94.7%, Nmass: 87.2%, Seed: 86.1%, WD: 91.9%).
For birds, I used three variables related to size and reproductive strategy: adult body mass (Mass), mean clutch size (Clutch) and egg mass (Egg); and three related to diet: proportions of the diet constituted by plants and seeds (PlantSeed), invertebrates (Invert) or vertebrates/scavenging (VertFishScav). Clutch size and egg mass data came from the bird trait database by Lislevand et al. (2007), and body mass and diet from EltonTraits 1.0 (Wilman et al., 2014). In total, I was able to obtain body mass and diet data for 79.8%, clutch size for 79.0% and egg mass for 73.7% of species. However, more common species were more likely to have had measured trait values, so the route-level mean trait coverages were higher (98.4% for mass and diet, 90.6% for clutch size and 90.9% for egg mass).
For each FIA plot or BBS route, and for each trait, I computed the community-weighted mean (CWM). This is the mean value of the trait for all species in the assemblage, weighted by their relative abundances.
Climate
I used two simple measures of climate—mean annual temperature and annual precipitation (MAT, AP). In both cases, my annual period spanned from July of the previous year to June of the focal year, reflecting the fact that most sampling of bird and tree communities occurred in the summer of the focal year. These two variables are not expected to explain all of the variation in functional composition, but are often among the important correlates of assemblage structure. I extracted annual temperature and precipitation from the PRISM climate data (PRISM climate group, 2018) for each assemblage location and for the years 1970 through 2016. For FIA data, I simply used the coordinates of the plot location. For BBS data I computed the mean climate data along the sampling route in most cases. However, in 13% of cases I was unable to obtain the full route path, and instead used the coordinate of the starting point of the route to extract climate information. Among the 87% of routes where I had both climate summaries, they were highly correlated (r = 0.97 for AP and r = 0.99 for MAT).
Analysis
All of the main analyses focus on the relationship between the two climate variables (MAT and AP) and the CWMs of traits. In each case, I fit an ordinary least squares linear model to predict CWMs from MAT and AP, but varied the subsets of data used. One class of models (spatial models) attempt to explain the variation in trait CWMs across space in one year as a function of the climate in that year. The other class of models (temporal models) attempt to explain variation in trait CWMs across time in one location as a function of climate through time in that location.
Spatial Models
I created a 0.5 × 0.5 degree grid spanning the study region. For each grid cell and each year from 1970 until 2016, I identified the bird or tree assemblages in that year and grid cell, and computed the mean of the MAT and AP values extracted for these assemblages. In the same way, I computed the mean of each trait value for assemblages measured each year within each grid cell. For BBS data, I considered a route to be within a cell if its starting coordinate was in that cell. For each year, I then fit a linear model for each of the 11 traits, each predicting the spatial pattern of mean trait values in that year from the spatial patterns of temperature and precipitation that year. Thus, the core output here were coefficients describing the relationship between MAT and AP for each of 11 functional traits in each of 47 years.
Temporal Models
Within each 0.5 × 0.5 degree grid cell, I fit a linear model to predict trait means in assemblages in that cell in each year from MAT and AP in those years. Many cells did not have complete temporal coverage over the time period, and I used only cells with more than 5 years of complete data. This produced, for each of the 11 traits, coefficients describing the influence of changing MAT and AP at each of 3,238 cell locations for trees and 2396 locations for birds. For birds, the sampling in most cells spanned 45 years, and 78% of cells spanned at least 25 years. For trees, most cells spanned 28 years or more, with 65% spanning at least 25 years.
In addition, I assessed the trend in MAT, AP and trait values in each grid cell by regressing each of those variables against year. I then computed the correlation coefficients between the spatial patterns of trends in climate variables and the spatial patterns of trends in trait means (e.g., asking whether areas that have warmed more have also experienced larger trends in trait means).
Time-Averaged Models
I then repeated all of the above models but replaced the annual precipitation or temperature measurements with their 5-year or 10-year mean prior to the focal year. This provides insight into the magnitude of lags. If temporal coefficients are generally weak when using just climate data from the year when the assemblage was observed, it is possible that they will be stronger considering the recent climate history at that location. Integrating climate over a longer time period may provide a better reflection of assemblage responses, by more closely matching the time scale of assemblage-level responses.
All analyses were conducted in R 3.4.1 (R Core Team, 2017), making heavy use of the raster (Hijmans, 2017) package.
Results
Spatial Patterns
All eleven traits showed marked spatial patterns across the United States (Supplemental Figure 1). Tree SLA, Nmass and WD tends to be low in the western US and high the east. Seed mass shows a latitudinal pattern, with larger seeds in the south. The tallest tree assemblages are found along the west coast. Among birds, there is a latitudinal gradient in clutch size, with smaller clutches at lower latitudes. In contrast, variation in mass and egg mass is mainly longitudinal, with the largest masses found in mid-longitudes. Similarly, invertebrates made up the largest fractions of bird diets at mid-longitudes, while plants and seeds made up the largest portions of the diet in the east, west and upper Midwest.
Tree Trait-Climate Relationships
On average, temperature and precipitation explained 30% of the variance in tree SLA among grid cells in a year and 20% of the variance among years in a grid cell (Table 1). Spatially, SLA showed inconsistent relationships with temperature from year to year, with significant negative relationships in 21 years and significant positive relationships in 10 years (mean temperature slope = −0.021, Figure 1; Supplemental Figure 2). Precipitation was more consistent, with significant positive relationships in 30 years and negative in 5 years (mean slope = 0.400, Figures 1, 2). Temporal variation in temperature was inconsistently related to variation in SLA within a grid cell, with some grid cells showing positive relationships and others negative, and no overall deviation of these coefficients from a mean of 0 (one sample t-test, P > 0.05). However, there was a tendency toward increased SLA in wet years (mean slope = 0.037, P = 0.012). There was a significant trend toward decreasing SLA over the study period, and the magnitude of this trend was weakly positively correlated with the trend in precipitation (r = 0.10, P < 0.001, Figure 3).
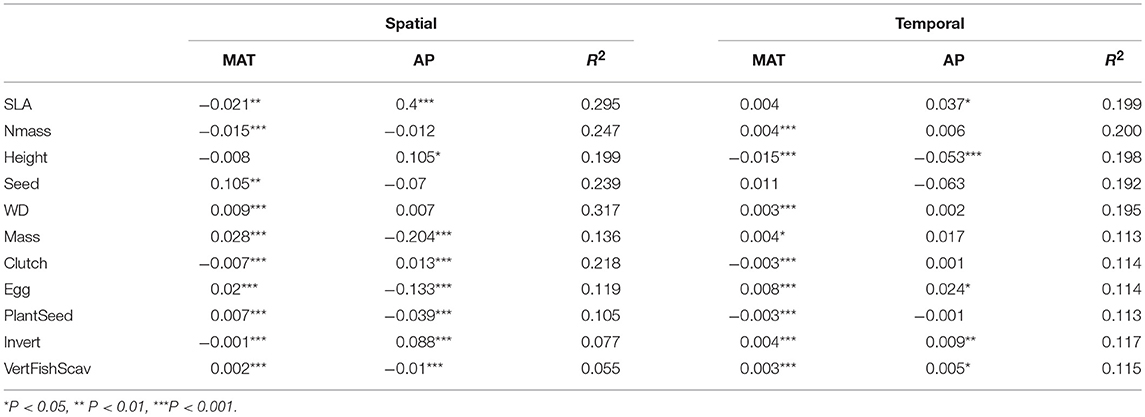
Table 1. Summaries of models (mean coefficients and mean R2 values) relating spatial or temporal patterns of functional composition with mean annual temperature (MAT) and annual precipitation (AP).
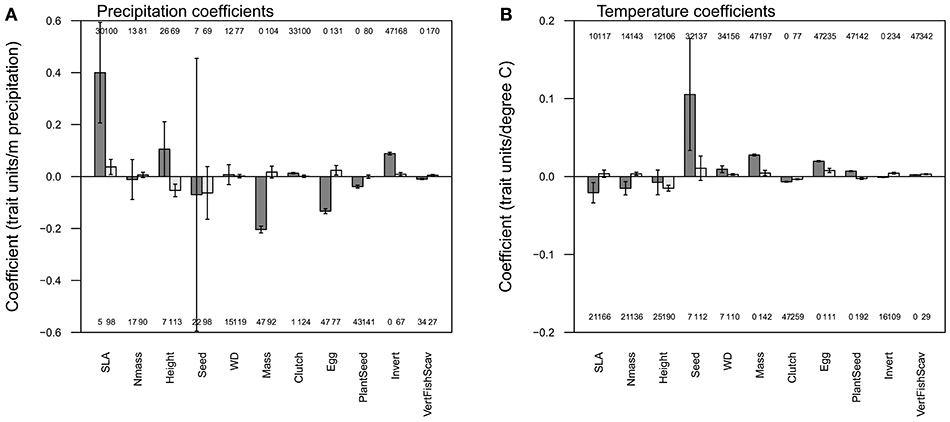
Figure 1. Mean regression coefficients relating precipitation (A) and temperature (B) to each of eleven functional traits. For each pair of bars, the left (dark) bar indicates the mean spatial coefficient and the right (light) bar the mean temporal coefficient. The error bars indicate the 95% confidence interval. Each bar aggregates the coefficients across years (for the spatial models) or grid cells (for the temporal models). The number of individually significant years or grid cells is shown above (for positive) or below (for negative) the bars.
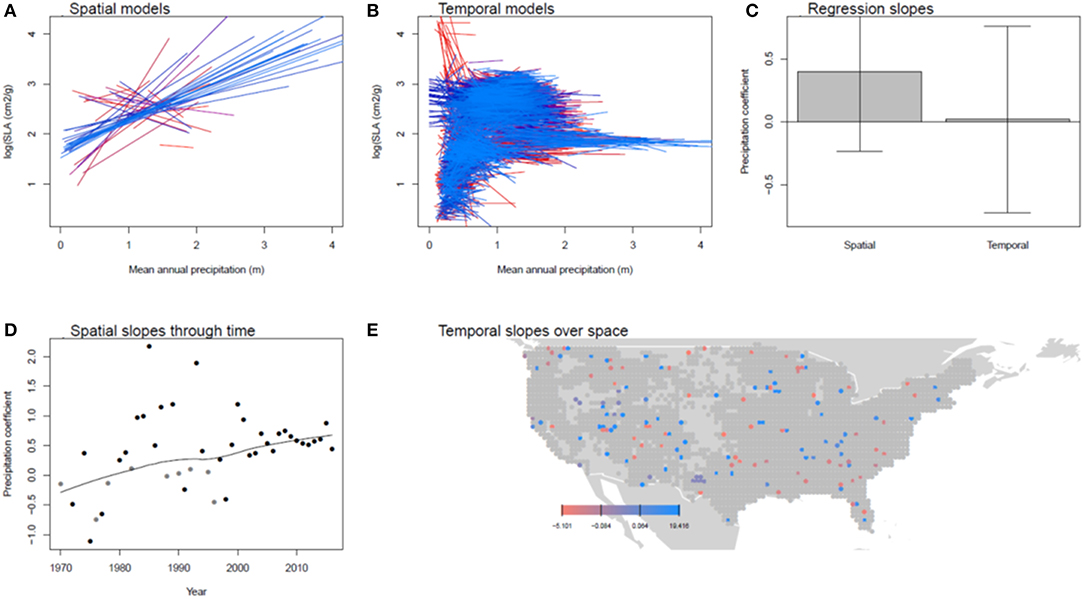
Figure 2. Spatial and temporal relationships between SLA and precipitation. (A) Shows the spatial models for each year between 1970 and 2016 (earlier years are in red, later in blue). (B) Shows the temporal models for each 0.5 x 0.5 degree grid cell. (C) compares the distributions of these coefficients, showing their mean and standard deviation. (D,E) show the pattern of spatial coefficients over time and temporal coefficients over space, respectively. In (D,E), points are gray if the regression coefficients was not significant in that year or cell.
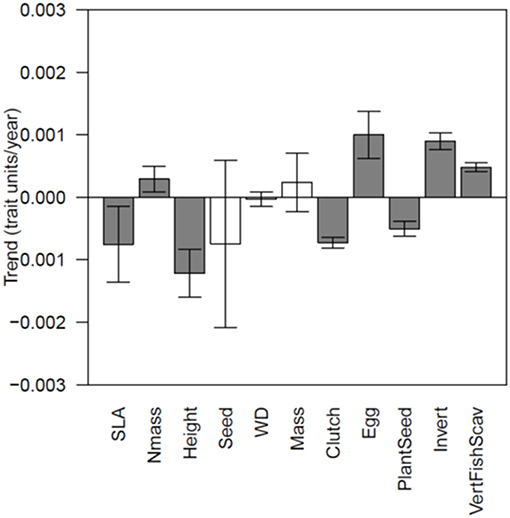
Figure 3. The mean magnitude of trends through time in each functional trait. Error bars show in the 95% confidence interval, and bars whose intervals overlap 0 are shown in white.
For Nmass, spatial models explained an average of 25% of the variance, while temporal models explained 20%. In total, spatial patterns of Nmass were negatively related to temperature, though this relationship was variable among years (mean slope = −0.015, P < 0.001, Supplemental Figure 2). In contrast, there was a weak tendency for warmer years to have higher Nmass values (mean slope = 0.004, P < 0.001). Precipitation was not associated with Nmass across either time or space (Supplemental Figure 3). Nmass increased slightly over the study period, but the magnitude of this trend was not related to the magnitude of the trend in temperature or precipitation (|r| < 0.04).
Spatial and temporal models each explained 20% of the variation in height. In the early years of the study, the coefficients relating spatial patterns of precipitation and temperature with mean height showed substantial variation, but beginning around 2,000 stabilized with a positive influence of precipitation and a weak negative influence of temperature. In contrast, through time, precipitation and temperature both had a negative influence on Height (Supplemental Figure 4). Overall, there was a trend toward lower height values through time, and this pattern was weakly associated with the trend in temperature (r = −0.11, P < 0.001).
For seed mass, spatial models explained 24% of the variation and temporal models explained 19%. Spatially, warmer grid cells tended to have larger seed masses. In 22 years, drier conditions were associated with larger seed masses, while the reverse was true in 7 years. Temporal relationships between seed mass and temperature or precipitation were weak and inconsistent among grid cells (Supplemental Figure 5). Seed mass showed no significant trend over the study period.
Spatial models explained 32% of the variation in WD, while temporal models explained 19%. The highest WD values are found in warm climates, and this relationship appears to be stabilizing through time. On the other hand, precipitation was weakly associated with WD. In aggregate, the temporal relationships between temperature and WD were positive, though there was substantial variation among grid cells in the sign of this relationship (Supplemental Figure 6). WD did not show any trend over the study period.
Bird Trait-Climate Relationships
Spatial models explained, on average, 14% of the variance in bird body mass, while temporal models explained 11% (Table 1). Across space, bird body masses were consistently and positively related to temperature (Figure 4) but were hardly related to temperature within a grid cell through time. Similarly, precipitation and body mass were consistently negatively correlated across space but were in fact slightly positively related to precipitation within cells across years (Supplemental Figure 7). The negative correlation between precipitation and body mass strengthened somewhat over the study period. There was no overall trend in mean body mass.
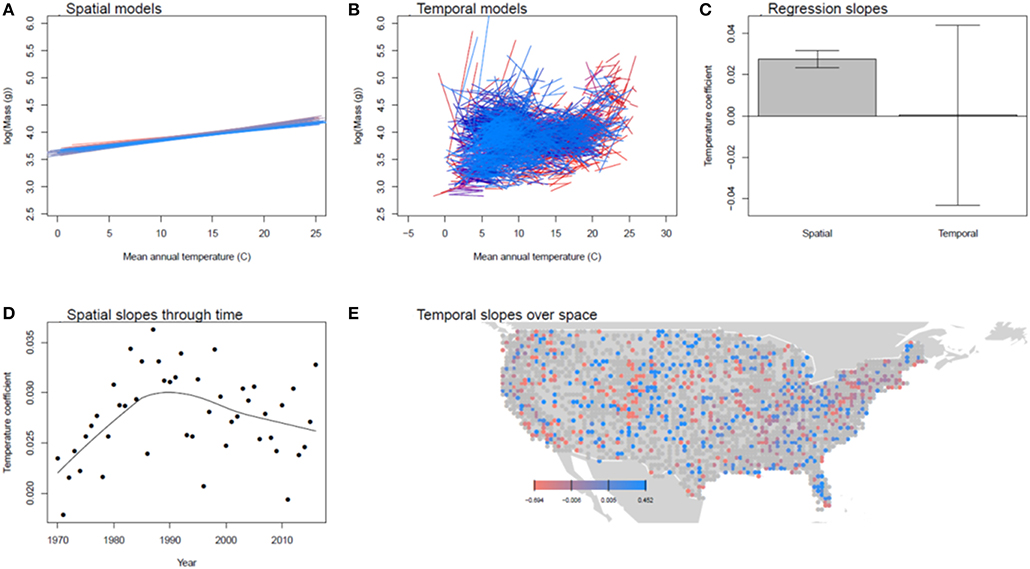
Figure 4. Spatial and temporal relationships between bird body mass and temperature. (A) shows the spatial models for each year between 1970 and 2016 (earlier years are in red, later in blue). (B) shows the temporal models for each 0.5 x 0.5 degree grid cell. (C) compares the distributions of these coefficients, showing their mean and standard deviation. (D,E) show the pattern of spatial coefficients over time and temporal coefficients over space, respectively. In (D,E), points are gray if the regression coefficients was not significant in that year or cell.
For clutch size, spatial models explained 22% of the variance, while temporal models explained 11%. Clutch size was strongly negatively related to temperature across space, and became increasingly so over the study period. At the same time, the spatial relationship between clutch size and precipitation deteriorated from positive in 1970 to nearly absent in 2016. Across time within grid cells, temperature had no consistent relationships with clutch size, but wetter years were associated with smaller clutch sizes (Supplemental Figure 8). Clutch sizes declined overall in the study period, with the strongest declines in areas that have warmed the least (r = 0.11, P < 0.001).
For egg mass, spatial models explained 12% of the variation, while temporal models explained 11%. Egg masses were larger in warmer and drier grid cells. These relationships were consistent among years, and showed little trend through time. Through time within a grid cell, greater egg masses were associated with warmer and wetter years (Supplemental Figure 9). There was an overall trend toward larger egg masses, somewhat more so in areas that have experienced less increase in temperature (r = −0.046, P = 0.03).
Temporal models explained somewhat more of the variation in diet than did spatial models (spatial R2 for PlantSeed = 0.10, Invert = 0.08 and VertFishScav = 0.06, compared to temporal R2 of 0.11, 0.12 and 0.11, respectively). Spatially, wetter climates tended to have lower PlantSeed and VertFishScav fractions, and more Invert. Wetter years at one site tend to be associated with more Invert and more VertFishScav. Warmer sites had higher PlantSeed and VertFishScav and lower Invert fractions, while warmer years had lower PlantSeed and higher Invert and VertFishScav fraction (Supplemental Figures 10–12). There has been a trend toward lower PlantSeed (particularly in areas that have gotten warmer or wetter, r = −0.07, P < 0.001 in both cases) and higher Invert (particularly in areas that have gotten warmer and wetter, r = 0.08 and r = 0.14, respectively, P < 0.001) and VertFishScav (particularly in areas that have gotten wetter, r = 0.09, P < 0.001) through time.
Time-Averaged Models
The results above are based on MAT and AP measured in the 1 year prior to community sampling. Replacing these variables with averages over 5 or 10 produced regression coefficients that were broadly similar (Figure 5). However, some model coefficients did shift consistently when increasing the time period over which MAT or AP were averaged. This was particularly pronounced in temporal models for birds. For example, precipitation had a weak relationship with body mass and egg mass in birds, but this influence became increasingly positive as the time-span increased. Interestingly, as the time span increased, the equivalent spatial relationships actually become somewhat more negative. R2 values for spatial models were not strongly affected by the time span (R2 values were always within 0.04), but temporal models had higher R2 values, particularly for birds (average R2 increased by 0.016 and 0.031 in the 5- and 10-year models for trees, and by 0.08 and 0.124 for birds).
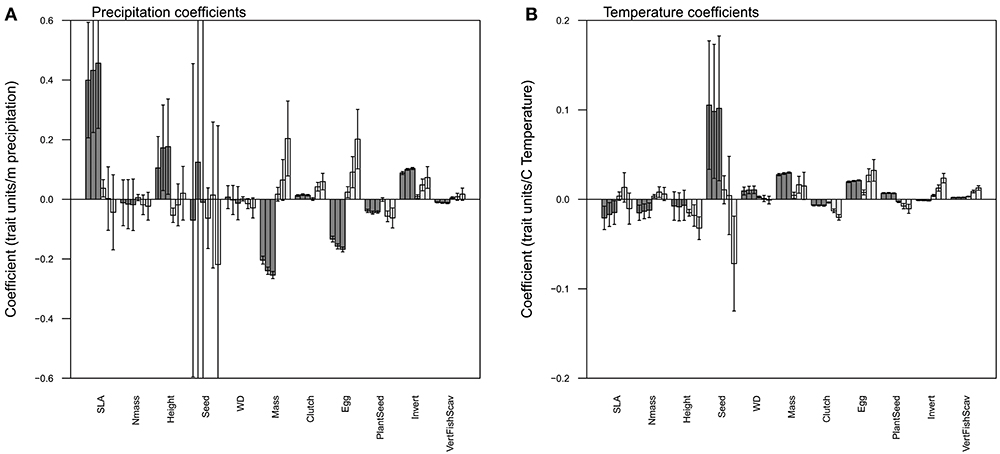
Figure 5. Mean regression coefficients relating the 1, 5 or 10-year averages of precipitation (A) and temperature (B) to each of eleven functional traits. For each set of six bars, the first three (dark) bars indicate the mean spatial coefficient from 1, 5 or 10-year models (respectively) and the three right (light) bars the mean temporal coefficient in 1, 5 or 10-year models. The error bars indicate the 95% confidence interval.
Discussion
This study examined patterns of variation in functional assemblage composition across space and time in two large groups—birds and trees. Across these two groups, several generalities emerged. First, both temperature and precipitation influence the spatial patterns of assemblage functional composition, but temperature appears to more strongly influence temporal dynamics of composition over this time period. Second, temporal relationships were typically weaker and more inconsistent than spatial relationships, and sometimes differed in sign. Similarly, for nearly every trait (bird diet categories are the exception), the spatial models explained more variation than the temporal models. Finally, for birds, using 5- or 10- year averages of climate sometimes substantially increased temporal coefficient estimates compared to 1-year averages and improved model R2. Together, these results suggest that there are substantial lags in the response of functional community composition to variation in climate.
In some cases, the temporal relationships and spatial relationships differed not only in magnitude, but in sign. For example, wetter periods are associated with larger bird body masses and egg masses, trait states that are spatially associated with drier areas. This is similar to the pattern observed in winter bird assemblages, in which body masses have tended to increase with warming through time, but larger-mass assemblages are spatially associated with cooler temperatures (La Sorte et al., 2009). However, in this study of summer bird assemblages, spatial models suggested a positive relationship between temperature and body mass, while temporal models revealed very little relationship. In plants, experimental watering often leads to opposite trait responses compared to the spatial relationship (Sandel et al., 2010). What could explain these discrepancies? One possibility is that, following a climate perturbation (either natural or experimentally applied), the assemblage initially responds through changing relative abundances of species, with relatively little influence of colonization and extirpation. Over time, these changes in species abundance could create feedbacks that favor trait states opposite to those originally favored by the change, while at the same time, larger influences of colonization and extirpation can drive more dramatic changes in the functional composition. Related patterns are well-known from succession. Following a disturbance, a particular species or functional group might originally increase in abundance but eventually, perhaps through a negative feedback loop, be replaced by another set of species (e.g., Bergeron, 2000; Capitanio and Carcaillet, 2008).
Why are temporal responses to temperature more pronounced than were temporal responses to precipitation? The answer is evidently not that precipitation is unimportant for structuring assemblage composition, as the spatial pattern of traits were sometimes strongly associated with precipitation patterns. Instead, a likely answer is that the two climate variables exhibit distinct inter-annual dynamics. Within a particular grid cell, it is typical for there to be marked year-to-year variation in precipitation, but few grid cells (11%) showed a significant trend in precipitation over the study period. On the other hand, 41% of cells showed a significant warming trend (and 1% a significant cooling trend). Thus, the temperature in many regions has tended to steadily increase, providing opportunities for weak initial responses in composition to progressively strengthen over time. However, because the variation in precipitation has a shorter time scale (great year-to-year variation but weak trend), initial changes in one direction in a wet year are likely to be reversed by a following dry year. Put another way, the time scales over which assemblage dynamics occur are much longer than the time scales of precipitation change, but not as much longer than the time scales of temperature change. However, precipitation coefficients were often increasingly important in models considering longer climate averages averages. In general, dynamics in bird assemblages are likely to be faster than those of trees, both because they have shorter generation times and because they are more mobile.
In most cases, R2 values were smaller for birds than for trees. There are several possible explanations. First, it may be that tree distributions are more proximately controlled by climate, whereas bird distributions are often strongly influenced by habitat structure (e.g., Seoane et al., 2004; Meynard and Quinn, 2008). As a result, in addition to direct influences of climate on bird distributions, they experience an additional lag due to potentially slow dynamics in the vegetation. In addition, birds are better able to enjoy particularly suitable microhabitats within an area by modifying their behavior, such that the climate estimate for a bird route might not represent the conditions experienced by all of the species observed along that route. Finally, many of the bird species in this region are migratory (Somveille et al., 2013). Population trends in the breeding range of migratory birds is not only a function of conditions in that area but also in the winter range of the species. This could add considerable variation to bird population counts for migratory species that cannot be explained by local conditions in the breeding range (Faaborg et al., 2010; Morrison et al., 2012). On the other hand, the spatial regression coefficients for birds were less variable from year to year than those for trees, especially in the early years of the study. This most likely reflects the fact that the sampling of FIA plots is not repeated annually, so that different years contain data for different regions. As a result, the coefficients for these spatial relationships are more variable.
While this study found evidence for lags in responses to changing climate, there were nevertheless important changes in the composition of bird and tree assemblages. Bird assemblages shifted toward smaller mean clutch sizes and larger egg masses, and herbivorous birds became less common relative to invertebrate and vertebrate predators. This shift in diet is in contrast to previous results finding declines in insectivorous birds (Nebel et al., 2010; Hallmann et al., 2014), though these declines have been limited to smaller spatial extents. Together with results showing increases in taxonomic and functional diversity at similar grain sizes (La Sorte et al., 2009; Jarzyna and Jetz, 2018), shifts in the timing of bird migrations (Cotton, 2003; Charmantier and Gienapp, 2014) and increases of generalist species at the expense of habitat specialists (Le Viol et al., 2012), these results emphasize the widespread changes in bird assemblages in response to anthropogenic changes.
It is important to note that this study used species-level means as markers of functional strategies, and described variation in assemblage composition using the abundance-weighted means of these traits in each assemblage. Thus, a shift toward larger bird egg masses indicates that smaller-egged species are becoming relatively less common and larger-egged species are becoming relatively more common. This is one, but not the only, important driver of community function. On top of these assemblage-level changes, individual species may express different functional traits as climate changes, due to phenotypic plasticity and evolutionary responses (Ackerly, 2003; Davis et al., 2005; Nicotra et al., 2010; Van Buskirk et al., 2010; Charmantier and Gienapp, 2014). Plastic responses to environmental gradients are likely common in plants (e.g., Ackerly and Cornwell, 2007; Cornwell and Ackerly, 2009; Kichenin et al., 2013) and birds (Charmantier et al., 2008; Studds and Marra, 2011), but adaptive responses can also be observed. For example, flowering phenology of an annual plant can evolve rapidly in response to drought (Franks et al., 2007), and changes in snow cover have lead to evolutionary responses in owl plumage color (Karell et al., 2011).
Conclusion
Several patterns reported here converge to indicate that temporal dynamics of functional assemblage composition are typically out of equilibrium with the current climate. This has important implications. First, space-for-time substitutions are likely to provide poor predictions for dynamics under climate change, at least for the initial responses of the assemblage (La Sorte et al., 2009), but perhaps not for long-term responses (Blois et al., 2013). Second, initial changes in the assemblage composition following some change may not reflect the long-term equilibrial response, either in magnitude or sign. A crucial challenge for future research is to quantify the duration of assemblage response lags (La Sorte and Jetz, 2012). Here, moving from a one-year to a five- or ten-year average reduced the perceived disequilibrium for birds in some cases, but a more comprehensive analysis will require a longer time series, perhaps using paleoecological records.
Author Contributions
The author confirms being the sole contributor of this work and has approved it for publication.
Conflict of Interest Statement
The author declares that the research was conducted in the absence of any commercial or financial relationships that could be construed as a potential conflict of interest.
Acknowledgments
I am immensely grateful to the thousands of volunteers and researchers who have made the distributional data (Breeding Bird Survey and Forest Inventory and Analysis) and trait data (TRY, EltonTraits and Lislevand et al.'s bird data) publicly available, and to the coordinators of these databases who ensure that these data are usable.
Supplementary Material
The Supplementary Material for this article can be found online at: https://www.frontiersin.org/articles/10.3389/fevo.2019.00138/full#supplementary-material
References
Ackerly, D. D. (2003). Community assembly, niche conservatism, and adaptive evolution in changing environments. Int. J. Plant Sci. 164, S165–S184. doi: 10.1086/368401
Ackerly, D. D., and Cornwell, W. K. (2007). A trait-based approach to community assembly: partitioning of species trait values into within-and among-community components. Ecology Lett. 10, 135–145. doi: 10.1111/j.1461-0248.2006.01006.x
Adler, P. B., and Levine, J. M. (2007). Contrasting relationships between precipitation and species richness in space and time. Oikos 116, 221–232. doi: 10.1111/j.0030-1299.2007.15327.x
Ash, J. D., Givnish, T. J., and Waller, D. M. (2017). Tracking lags in historical plant species' shifts in relation to regional climate change. Glob. Chang. Biolo.23, 1305–1315. doi: 10.1111/gcb.13429
Bechtold, W. A., and Patterson, P. L. (2005). The Enhanced Forest Inventory and Analysis Program - National Sampling Design and Estimation Procedures. Gen. Tech. Rep. SRS-80. Asheville, NC: U.S. Department of Agriculture, Forest Service, Southern Research Station. 85p.
Bergeron, Y. (2000). Species and stand dynamics in the mixed woods of Quebec's southern boreal forest. Ecology. 81 1500–1516. doi: 10.1890/0012-9658(2000)081[1500:SASDIT]2.0.CO;2
Bertrand, R., Lenoir, J., Piedallu, C., Riofrío-Dillon, G., De Ruffray, P., Vidal, C., et al. (2011). Changes in plant community composition lag behind climate warming in lowland forests. Nature 479:517. doi: 10.1038/nature10548
Blois, J. L., Williams, J. W., Fitzpatrick, M. C., Jackson, S. T., and Ferrier, S. (2013). Space can substitute for time in predicting climate-change effects on biodiversity. Proc. Nat. Acad. Sci. 110, 9374–9379. doi: 10.1073/pnas.1220228110
Blonder, B., Enquist, B. J., Graae, B. J., Kattge, J., Maitner, B. S., Morueta-Holme, N., et al. (2018). Late quaternary climate legacies in contemporary plant functional composition. Global Chang. Biol. 24, 4827–4840. doi: 10.1111/gcb.14375
Bonthoux, S., Barnagaud, J. Y., Goulard, M., and Balent, G. (2013). Contrasting spatial and temporal responses of bird communities to landscape changes. Oecologia 172, 563–574. doi: 10.1007/s00442-012-2498-2
Capitanio, R., and Carcaillet, C. (2008). Post-fire Mediterranean vegetation dynamics and diversity: a discussion of succession models. Forest Ecol. Manag. 255, 431–439. doi: 10.1016/j.foreco.2007.09.010
Charmantier, A., and Gienapp, P. (2014). Climate change and timing of avian breeding and migration: evolutionary versus plastic changes. Evol. Appl. 7, 15–28. doi: 10.1111/eva.12126
Charmantier, A., McCleery, R. H., Cole, L. R., Perrins, C., Kruuk, L. E., and Sheldon, B. C. (2008). Adaptive phenotypic plasticity in response to climate change in a wild bird population. Science 320, 800–803. doi: 10.1126/science.1157174
Cornwell, W. K., and Ackerly, D. D. (2009). Community assembly and shifts in plant trait distributions across an environmental gradient in coastal California. Ecol. Monogr. 79, 109–126. doi: 10.1890/07-1134.1
Cotton, P. A. (2003). Avian migration phenology and global climate change. Proc. Nat. Acad. Sci. 100, 12219–12222. doi: 10.1073/pnas.1930548100
Cramer, W., Bondeau, A., Woodward, F. I., Prentice, I. C., Betts, R. A., Brovkin, V., et al. (2001). Global response of terrestrial ecosystem structure and function to CO2 and climate change: results from six dynamic global vegetation models. Glob. Chang. Biol. 7, 357–373. doi: 10.1046/j.1365-2486.2001.00383.x
Currie, D. J., and Venne, S. (2017). Climate change is not a major driver of shifts in the geographical distributions of North American birds. Glob. Ecol. Biogeogr. 26, 333–346. doi: 10.1111/geb.12538
Davis, M. B., Shaw, R. G., and Etterson, J. R. (2005). Evolutionary responses to changing climate. Ecology 86, 1704–1714. doi: 10.1890/03-0788
Devictor, V., Julliard, R., Couvet, D., and Jiguet, F. (2008). Birds are tracking climate warming, but not fast enough. Proc. R. Soc. B Biol. Sci. 275, 2743–2748. doi: 10.1098/rspb.2008.0878
Dobson, L. L., Sorte, F. A. L., Manne, L. L., and Hawkins, B. A. (2015). The diversity and abundance of North American bird assemblages fail to track changing productivity. Ecology 96, 1105–1114. doi: 10.1890/14-0057.1
Faaborg, J., Holmes, R. T., Anders, A. D., Bildstein, K. L., Dugger, K. M., Gauthreaux, S. A., et al. (2010). Conserving migratory land birds in the new world: do we know enough? Ecol. Appl. 20, 398–418. doi: 10.1890/09-0397.1
Franks, S. J., Sim, S., and Weis, A. E. (2007). Rapid evolution of flowering time by an annual plant in response to a climate fluctuation. Proc. Nat. Acad. Sci. 104, 1278–1282. doi: 10.1073/pnas.0608379104
Gang, C., Zhang, Y., Wang, Z., Chen, Y., Yang, Y., Li, J., et al. (2017). Modeling the dynamics of distribution, extent, and NPP of global terrestrial ecosystems in response to future climate change. Glob. Planet. Change. 148, 153–165. doi: 10.1016/j.gloplacha.2016.12.007
Göldel, B., Kissling, W. D., and Svenning, J. C. (2015). Geographical variation and environmental correlates of functional trait distributions in palms (Arecaceae) across the New World. Bot. J. Linn. Soc. 179, 602–617. doi: 10.1111/boj.12349
Hallmann, C. A., Foppen, R. P., van Turnhout, C. A., de Kroon, H., and Jongejans, E. (2014). Declines in insectivorous birds are associated with high neonicotinoid concentrations. Nature 511:341. doi: 10.1038/nature13531
Hijmans, R. J. (2017). Raster: Geographic Data Analysis and Modeling. R package version 2.6-7. Available online at: https://CRAN.R-project.org/package=raster (accessed January 10, 2018).
Jarzyna, M. A., and Jetz, W. (2018). Taxonomic and functional diversity change is scale dependent. Nat. Commun. 9:2565. doi: 10.1038/s41467-018-04889-z
Karell, P., Ahola, K., Karstinen, T., Valkama, J., and Brommer, J. E. (2011). Climate change drives microevolution in a wild bird. Nat. Commun. 2:208. doi: 10.1038/ncomms1213
Kattge, J., Diaz, S., Lavorel, S., Prentice, I. C., Leadley, P., Bönisch, G., et al. (2011). TRY–a global database of plant traits. Glob. Chang. Biol. 17, 2905–2935. doi: 10.1111/j.1365-2486.2011.02451.x
Kichenin, E., Wardle, D. A., Peltzer, D. A., Morse, C. W., and Freschet, G. T. (2013). Contrasting effects of plant inter-and intraspecific variation on community-level trait measures along an environmental gradient. Funct. Ecol. 27, 1254–1261. doi: 10.1111/1365-2435.12116
La Sorte, F. A., and Jetz, W. (2012). Tracking of climatic niche boundaries under recent climate change. J. Anim. Ecol. 81, 914–925. doi: 10.1111/j.1365-2656.2012.01958.x
La Sorte, F. A., Lee, T. M., Wilman, H., and Jetz, W. (2009). Disparities between observed and predicted impacts of climate change on winter bird assemblages. Proc. R. Soc. London B: Biol. Sci. 276, 3167–3174. doi: 10.1098/rspb.2009.0162
Lauenroth, W. K., and Sala, O. E. (1992). Long-term forage production of North American shortgrass steppe. Ecol. Appl. 2, 397–403.
Le Viol, I., Jiguet, F., Brotons, L., Herrando, S., Lindström, Å., Pearce-Higgins, J. W., et al. (2012). More and more generalists: two decades of changes in the European avifauna. Biol. Lett. 8, 780–782. doi: 10.1098/rsbl.2012.0496
Lehikoinen, A., and Virkkala, R. (2016). North by north-west: climate change and directions of density shifts in birds. Glob. Chang Biol. 22, 1121–1129. doi: 10.1111/gcb.13150
Lislevand, T., Figuerola, J., and Székely, T. (2007). Avian body sizes in relation to fecundity, mating system, display behavior, and resource sharing. Ecology 88, 1605–1605. doi: 10.1890/06-2054
Melillo, J. M., Steudler, P. A., Aber, J. D., Newkirk, K., Lux, H., Bowles, F. P., et al. (2002). Soil warming and carbon-cycle feedbacks to the climate system. Science 298, 2173–2176. doi: 10.1126/science.1074153
Meynard, C. N., and Quinn, J. F. (2008). Bird metacommunities in temperate South American forest: vegetation structure, area, and climate effects. Ecology 89, 981–990. doi: 10.1890/07-0350.1
Morrison, R. G., Mizrahi, D. S., Ross, R. K., Ottema, O. H., de Pracontal, N., and Narine, A. (2012). Dramatic declines of Semipalmated Sandpipers on their major wintering areas in the Guianas, northern South America. Waterbirds 35, 120–134. doi: 10.1675/063.035.0112
Nebel, S., Mills, A., McCracken, J., and Taylor, P. (2010). Declines of aerial insectivores in North America follow a geographic gradient. Avian Conserv. Ecol. 5. doi: 10.5751/ACE-00391-050201
Nicotra, A. B., Atkin, O. K., Bonser, S. P., Davidson, A. M., Finnegan, E. J., Mathesius, U., et al. (2010). Plant phenotypic plasticity in a changing climate. Trends Plant Sci. 15, 684–692. doi: 10.1016/j.tplants.2010.09.008
Ordonez, A., and Svenning, J. C. (2015). Geographic patterns in functional diversity deficits are linked to glacial-interglacial climate stability and accessibility. Glob Ecol. Biogeogr. 24, 826–837. doi: 10.1111/geb.12324
Ordonez, A., and Svenning, J. C. (2016). Strong paleoclimatic legacies in current plant functional diversity patterns across Europe. Ecol. Evol. 6, 3405–3416. doi: 10.1002/ece3.2131
Pacala, S. W., Canham, C. D., Saponara, J., Silander, J., Kobe, R. K., Ribbens, E., et al. (1996). Forest models defined by field measurements: Estimation, error analysis and dynamics. Ecol. Monogr. 66, 1–43. doi: 10.2307/2963479
Pardieck, K. L., Ziolkowski, D. J. Jr., Lutmerding, M., and, Hudson, M. A. R. (2018). North American Breeding Bird Survey Dataset 1966 – 2017. Version 2017.0. U.S. Geological Survey, Patuxent Wildlife Research Center.
R Core Team, (2017). R: A Language and Environment for Statistical Computing. R Foundation for Statistical Computing, Vienna. Available online at: https://www.R-project.org/ (accessed October 1, 2018).
Royal Botanic Gardens Kew. (2018). Seed Information Database (SID). Version 7.1. Available online at: http://data.kew.org/sid/ (accessed October 5, 2018).
Rustad, L. E. (2006). “From transient to steady-state response of ecosystems to atmospheric CO 2-enrichment and global climate change: conceptual challenges and need for an integrated approach,” in Plants and Climate Change, eds J. Rozema, R. Aerts, and H. Cornelissen (Dordrecht: Springer), 43–64.
Sandel, B., Goldstein, L. J., Kraft, N. J., Okie, J. G., Shuldman, M. I., Ackerly, D. D., et al. (2010). Contrasting trait responses in plant communities to experimental and geographic variation in precipitation. New Phytol. 188, 565–575. doi: 10.1111/j.1469-8137.2010.03382.x
Seoane, J., Bustamante, J., and Diaz-Delgado, R. (2004). Competing roles for landscape, vegetation, topography and climate in predictive models of bird distribution. Ecol. Model. 171, 209–222. doi: 10.1016/j.ecolmodel.2003.08.006
Shaver, G. R., Canadell, J., Chapin, F. S., Gurevitch, J., Harte, J., Henry, G., et al. (2000). Global warming and terrestrial ecosystems: a conceptual framework for analysis: ecosystem responses to global warming will be complex and varied. Ecosystem warming experiments hold great potential for providing insights on ways terrestrial ecosystems will respond to upcoming decades of climate change. Documentation of initial conditions provides the context for understanding and predicting ecosystem responses. AIBS Bull. 50, 871–882. doi: 10.1641/0006-3568(2000)050[0871:GWATEA]2.0.CO;2
Somveille, M., Manica, A., Butchart, S. H., and Rodrigues, A. S. (2013). Mapping global diversity patterns for migratory birds. PLoS ONE 8:e70907. doi: 10.1371/journal.pone.0070907
Studds, C. E., and Marra, P. P. (2011). Rainfall-induced changes in food availability modify the spring departure programme of a migratory bird. Proc. R. Soc. B. Biol. Sci. 278, 3437–3443. doi: 10.1098/rspb.2011.0332
Svenning, J.-C., and Sandel, B. (2013). Disequilibrium vegetation dynamics under future climate change. Am. J. Botany 100, 1266–1286. doi: 10.3732/ajb.1200469
Van Buskirk, J., Mulvihill, R. S., and Leberman, R. C. (2010). Declining body sizes in North American birds associated with climate change. Oikos 119, 1047–1055. doi: 10.1111/j.1600-0706.2009.18349.x
Wilman, H., Belmaker, J., Simpson, J., de la Rosa, C., Rivadeneira, M. M., and Jetz, W. (2014). EltonTraits 1.0: Species-level foraging attributes of the world's birds and mammals: Ecological Archives E095-178. Ecology 95, 2027–2027. doi: 10.1890/13-1917.1
Xu, X., Niu, S., Sherry, R. A., Zhou, X., Zhou, J., and Luo, Y. (2012). Interannual variability in responses of belowground net primary productivity (NPP) and NPP partitioning to long-term warming and clipping in a tallgrass prairie. Glob. Chang. Biol. 18, 1648–1656. doi: 10.1111/j.1365-2486.2012.02651.x
Keywords: functional traits, legacies, space-for-time substitution, birds, trees, climate, assemblage dynamics
Citation: Sandel B (2019) Disequilibrium in Trait-Climate Relationships of Trees and Birds. Front. Ecol. Evol. 7:138. doi: 10.3389/fevo.2019.00138
Received: 01 November 2018; Accepted: 07 April 2019;
Published: 30 April 2019.
Edited by:
Jessica Blois, University of California, Merced, United StatesReviewed by:
Frank A. La Sorte, Cornell Lab of Ornithology, United StatesMarta A. Jarzyna, The Ohio State University, United States
Copyright © 2019 Sandel. This is an open-access article distributed under the terms of the Creative Commons Attribution License (CC BY). The use, distribution or reproduction in other forums is permitted, provided the original author(s) and the copyright owner(s) are credited and that the original publication in this journal is cited, in accordance with accepted academic practice. No use, distribution or reproduction is permitted which does not comply with these terms.
*Correspondence: Brody Sandel, YnNhbmRlbEBzY3UuZWR1