Abstract
Macroalgae are the main primary producers in polar coastal regions and of major importance for the associated heterotrophic communities. On King George Island/Isla 25 de Mayo, West Antarctic Peninsula (WAP) several fjords undergo rapid glacial retreat in response to increasing atmospheric temperatures. Hence, extended meltwater plumes laden with suspended particulate matter (SPM) are generated that hamper primary production during the austral summer season. We used ensemble modeling to approximate changes in the benthic productivity of an Antarctic fjord as a function of SPM discharge. A set of environmental variables was statistically selected and an ensemble of correlative species-distribution models was devised to project scattered georeferenced observation data to a spatial distribution of macroalgae for a “time of measurement” (“tom”) scenario (2008–2015). The model achieved statistically reliable validation results (true scale statistics 0.833, relative operating characteristics 0.975) and explained more than 60% of the modeled macroalgae distribution with the variables “hard substrate” and “SPM.” This “tom” scenario depicts a macroalgae cover of ~8% (63 ha) for the total study area (8 km2) and a summer production of ~350 t dry weight. Assuming a linear increase of meltwater SPM load over time, two past (1991 and 1998), and two future (2019 and 2026) simulations with varying SPM intensities were applied. The simulation using only 50% of the “tom” scenario SPM amount (simulating 1991) resulted in increased macroalgal distribution (143 ha) and a higher summer production (792 t) compared to the “tom” status and could be validated using historical data. Forecasting the year 2019 from the “tom” status, an increase of 25% SPM results in a predicted reduction of macroalgae summer production to ~60% (141 t). We present a first quantitative model for changing fjordic macroalgal production under continued melt conditions at WAP. As meltwater influenced habitats are extending under climate change conditions, our approach can serve to approximate future productivity shifts for WAP fjord systems. The reduction of macroalgal productivity as predicted for Potter Cove may have significant consequences for polar coastal ecosystems under continuing climate change.
Introduction
The Western Antarctic Peninsula (WAP) is one of the regions responding most dramatically to climate change (Kim et al., 2018). In spite of the current phase of relative cooling over the past two decades (Turner et al., 2016), the long-term warming trend observed since the middle of the past century has caused loss of massive ice shelves and retreat of over 80% of all coastal glaciers along the Northern WAP (Cook et al., 2016). The changes in the cryosphere have led to pronounced ecosystem changes in the coastal systems (Barnes and Peck, 2008; Hoegh-Guldberg and Bruno, 2010; Sorte et al., 2010; Constable et al., 2014; Sahade et al., 2015). A major aspect of glacier retreat is the progressive subglacial and surface erosion during the melting seasons which generates extended sediment plumes mainly in inshore and glaciated areas (Monien et al., 2017). Surface transport of eroded sediments produces shading effects on, inter alia, benthic primary producers (Zacher et al., 2009; Deregibus et al., 2017). On the other hand, the glacier retreat is opening previously ice covered coastal seabed for new colonization by benthic organisms, e.g., macroalgae (Quartino et al., 2013; Barnes, 2017). Macroalgal communities not only serve as secondary habitats for a huge number of epiphytes and associated fauna but furthermore enhance local carbon burial by reducing flow velocity above ground and trapping particles, enhancing both inorganic, and organic deposition rates (Duarte et al., 2013). Macroalgae and their epiphytes are the main benthic primary producers of the coastal food web of Potter Cove (Iken et al., 1998; Quartino and Boraso de Zaixso, 2008) and contribute substantially to the dissolved and particulate carbon pool (Reichardt and Dieckmann, 1985; Fischer and Wiencke, 1992).
Macroalgal colonization of the seafloor is mainly affected by the availability of light, substrate type, grain size, steepness of the bottom slope (topology), wave action, and ice scour (Klöser et al., 1996; Zacher et al., 2009; Quartino et al., 2013; Wiencke et al., 2014; Clark et al., 2017; Campana et al., 2018). Especially in shallow water coastal systems, changes of sea ice duration and timing, and coastal fast ice dynamics are important drivers of benthic community composition and sustainability. Clark et al. (2013) predicted that earlier ice break-up can shift shallow water ecosystems from invertebrate dominated to macroalgae dominated communities, in areas with hard substrate. Macroalgal growth, productivity and vertical depth range are constrained by light availability under sea ice and sediment discharge plumes (DeLaca and Lipps, 1976; Wiencke, 1990a; Brouwer et al., 1995; Zacher et al., 2009; Clark et al., 2015, 2017; Deregibus et al., 2016), and by increasing physical disturbance from ice scour following sea ice break-up (Clark et al., 2015). Hence, while glacial retreat eventually supports increased macroalgal productivity on newly available hard substrates, shading due to turbid surface waters may curtail the net effect of macroalgal productivity to a currently unspecified extent. For any calculation of production or carbon budgets, an accurate quantification of coastal habitats suitable for macroalgal growth is an important prerequisite.
Species distribution models (SDM) statistically analyze the relationships between species distribution and the spatial patterns of environmental variables (Guisan and Thuiller, 2005; Elith and Leathwick, 2009; Dormann et al., 2012). They are applied in natural resource management and conservation planning (Miller, 2014), and form useful tools in ecosystem change modeling under future climate scenarios (Pineda and Lobo, 2009; Vorsino et al., 2014). Contrary to mechanistic models, they are independent from detailed species knowledge and require comparatively simple, widely available presence data. Therefore, SDMs provide a feasible and practical framework for an overarching environmental impact assessment (Elith and Leathwick, 2009), including a range of species over large spatial scales, especially in regions where difficult sampling conditions complicate in situ surveys.
We apply an ensemble modeling (EM) approach that combines a defined number of SDMs of best fit to an optimized ensemble model, in order to assess the antithetic effects of a retreating glacier on macroalgae distribution in the studied fjord (Potter Cove, King George Island, South Shetland Islands, Figure 1A). Based on a long-term data series at Carlini station that covers the past 25 years, it is known that Potter Cove has experienced an increase of summer sea surface temperatures equaling 0.36°C per decade between 1991 and 2010 (Schloss et al., 2012). The same paper reports regional sea ice duration to vary considerably between years, albeit with no significant trend over time. Earliest formation of a solid sea ice cover was at the end of April and latest ice breakout in the end of November (Schloss et al., 2012), so that essentially no sea ice was and is present during the algal summer growth period. Mean summer meltwater stream discharge measured in the southeast of Potter Cove over three summer seasons (2010–2012) amounted to a suspended particulate matter (SPM) concentration of 283 mg l−1, while southwesterly areas are low in SPM (0–0.5 mg l−1) (Monien et al., 2017). A suite of environmental variables (raster data) either causative or indicative for macroalgal distribution patterns was included: bathymetry, slope, SPM, hard substrate occurrence probability, distance to glacier front, total organic carbon (TOC). Most of these raster data result from geostatistical models. Furthermore, we developed a set of model deviations, designed to evaluate variations of SPM entry into the cove simulating quantitative changes of sediment discharge as a function of glacial retreat.
Figure 1
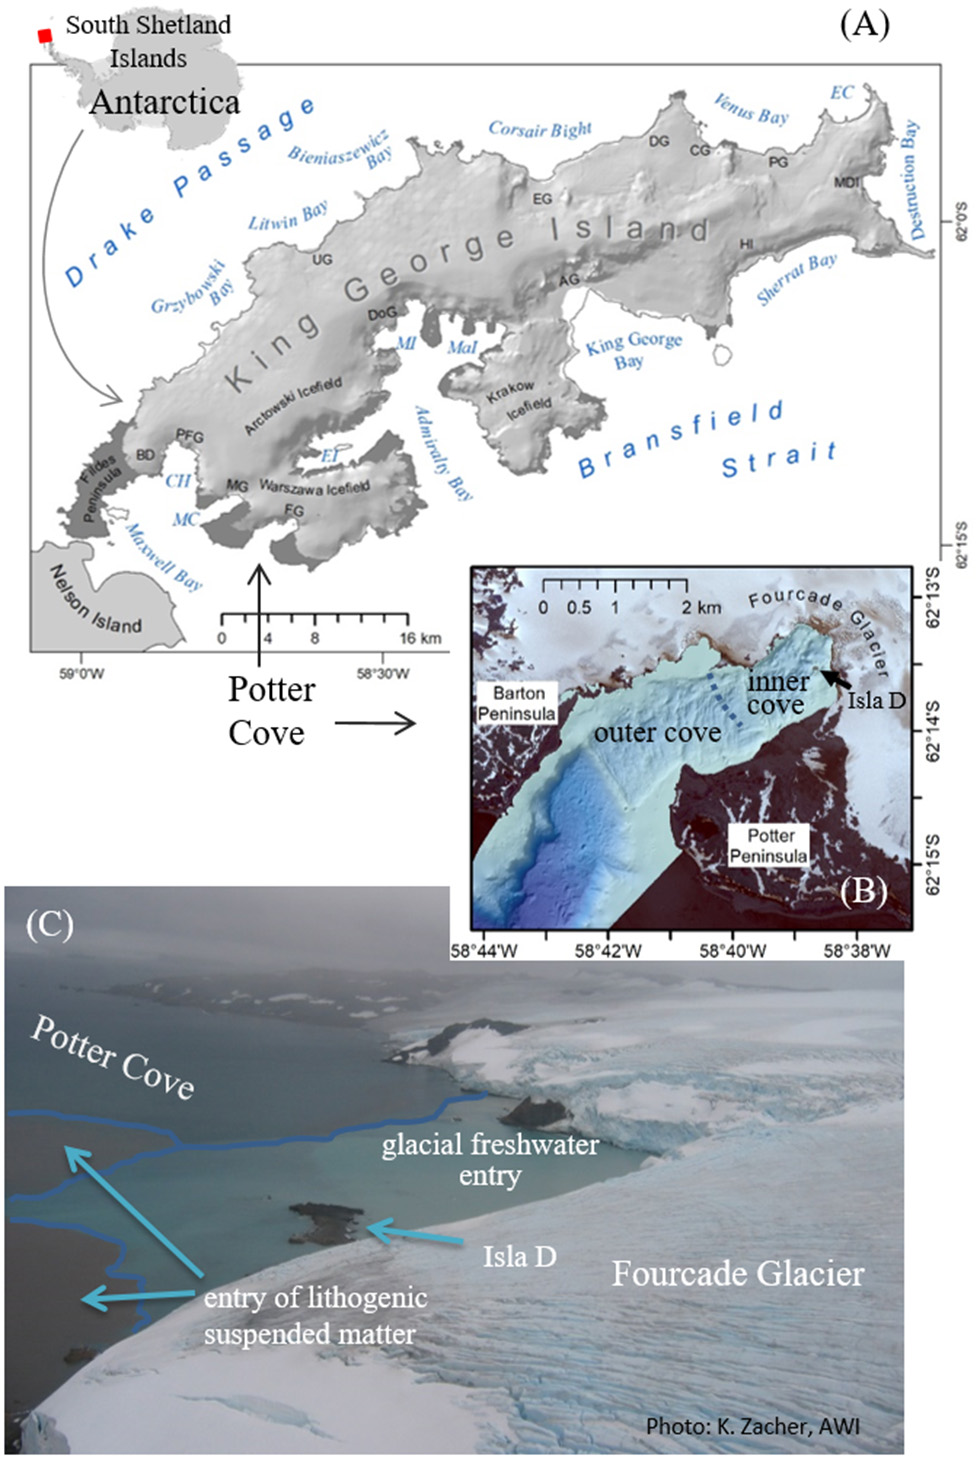
Overview map Antarctica and King George Island/Isla 25 de Mayo: CH, Collins Harbor; EC, Esmerald Cove; MC, Marian Cove; EI, Ezcurra Inlet; MaI, Mackellar Inlet; MI, Martel Inlet; AG, Anna Glacier; BD, Bellinghausen Dome; CG, Crystal Glacier; DG, Drake Glacier; DoG, Domeyko Glacier; EG, Eldred Glacier; FG, Fourcade Glacier; HI, Hektors Icefall; MDI, Moby Dick Icefall; MG, Moczydlowski Glacier; PFG, Polar Friendship Glacier; PG, Poetry Glacier; UG, Sher Glacier (A), seabed morphology of Potter Cove (B), and photo of entering fresh and SPM-accumulated meltwater from Fourcade Glacier into the inner cove (C).
Here, we analyze macroalgal presence/absence “data” from repeated surveys (2008–2015) in Potter Cove taking into account new knowledge on effects of shading on macroalgal productivity (Zacher et al., 2009; Deregibus et al., 2016). The data sets we used come from long-term, interdisciplinary ecosystem monitoring activities, unique for Antarctic shallow water systems. Our aim was to run a distribution model, which predicts and defines the potential ecological niche of macroalgae and allows for temporal and spatial simulations of their response to environmental changes in Potter Cove. The effects of climate-induced alterations of sediment discharge on macroalgae distribution and inferred productivity is shown for the “time of measurement (tom)” scenario (2008–2015) as well as two past (1991 and 1998) with less SPM in the water column and two future simulations (2019 and 2026) with increased SPM.
Materials and Methods
Study Area
Potter Cove is a 4 km long and 2.5 km wide tributary fjord to Maxwell Bay on the Southwestern coast of King George Island (KGI) (Figure 1A). The fjord covers ~10 km2 surface area and is almost free of glacial ice cover since 2016, surrounded by ice cliffs to the northeast. At the southern coast, meltwater streams intersect gravelly beaches occasionally occupied with grounded ice blocks (Figure 1B). The inner cove (6.5 km2) is divided into different basins by transversal ridges, remnants of underwater moraines, which were formed during late Holocene glacial advances or still stands (Wölfl et al., 2016). Ice melting and erosive processes (tides and waves) have given rise to newly exposed inshore hard bottom substrates, including a small rocky island (Isla D) of 70 m above-sea level diameter (Figures 1B,C), which is currently colonized by mixed communities of macroalgal and invertebrate fauna (Campana et al., 2009; Quartino et al., 2013; Lagger et al., 2017).
In the north and west, the cove is surrounded by the rapidly retreating Fourcade glacier as part of the Warszawa Icefield, which has maximum elevations of ~470 m (Figure 1A). From 1999 to 2008, the annual average frontline retreat rate up to about 40 m y−1 on the Potter Peninsula (Rückamp et al., 2011). In recent years, as the glacier moved on land, slowing retreat rates were documented (Falk et al., 2018). The newly ice-free subglacial rock bed and surface area are subject to erosion (Monien et al., 2011, 2017; Rückamp et al., 2011) resulting in higher sediment discharge loads during warmer summer melt seasons (Figure 1C). This affects coastal marine areas up to 2 km distance from land (Jerosch et al., 2018). Monien et al. (2017) estimated an approximate sediment load of 4 × 10⁵ tons y−1 entrained locally into the surface water layer.
The Argentinian research base Carlini (former Jubany) with the German-Argentinian collaborative laboratory “Dallmann” is located at Potter Cove. The Potter Cove ecosystem and its responses to rapid glacial retreat have been extensively studied and monitored over the past decades. Within the recent period (2008–2017), the collaborative research was stimulated by two EU supported actions, IMCOAST (www.imcoast.org) and IMCONet (www.imconet.eu). Project data, collected and processed within these research programs, were compiled into a georeferenced database. The data sets are available at www.pangaea.de.
Modeling Approach
Geostatistical algorithms were applied in ArcGIS® to generate raster data from sampling sites of environmental data, which were quality-assessed by statistical mean values such as Standard Error and Root-Mean-Square (Supplementary Figure 1, data sets and processing). Secondly, the response variable, a spatial snapshot of the macroalgal communities in Potter Cove was compiled, to statistically analyze the spatial response of macroalgae to environmental drivers, and to simulate their spatial distribution by changing environmental conditions.
The biodiversity modeling package Biomod2 Version 3.1-64 described in detail in Thuiller et al. (2014) was used in the R statistics environment (R-3.1.2, RCoreTeam, 2014). The modeling technique includes a set of commonly used algorithms for SDMs, namely five machine learning methods: Random Forest (RF), Maximum Entropy modeling (MaxEnt), Artificial Neural Networks (ANN), Generalized Boosted Models (GBM), Classification Tree Analysis (CTA); two regression models: Generalized Additive Models (GAM), and Generalized Linear Models (GLM), furthermore, the climate-envelope-model Species Range Envelope (SRE), the non-parametric regression Multiple Adaptive Regression Splines (MARS), and Flexible Discriminant Analysis (FDA). For explanation of the SDM algorithms refer to Elith and Graham (2009). Uncertainty is expressed by the difference between alternative realizations represented as deviations in response curves. For validation, two evaluation metrics, True skill statistic (TSS) and Relative Operating Characteristic (ROC) were applied within the Biomod2 package.
The number of input variables may constrain the complexity of models (Dormann et al., 2013). Accordingly, the variable selection decreases the resulting variance of regression parameters, improves processing time, reduces errors during processing, prevents possible misinterpretation of results, and eventually permits the evaluation of main abiotic drivers through an index of variable importance for shaping species distribution (Guisan and Thuiller, 2005; Elith and Leathwick, 2009; Merow et al., 2014). Testing the method by Dormann et al. (2013) shows that regression-type approaches (e.g., generalized linear models) and machine-learning techniques (e.g., MaxEnt) work reliably (i.e., condition number <10) if used under moderate collinearity. Here, the explanatory variables used for the SDMs were chosen through an iterative process (Supplementary Material). Environmental variables that are highly correlated with macroalgae presence/absence data (Pearson correlation coefficient | r | ≥ 0.7) as well as redundant variables were omitted. Further, variables with a low mean variable importance value (≤0.1) were excluded during an iterative implementation of the ensemble modeling. The six remaining environmental variables are ranked below by mean variable importance value (Table 1).
Table 1
| Year | Original data | Data processing | Data source | |
|---|---|---|---|---|
| Macroalgae [1/0] | 2008–2015 | various methodologies | georeferencing pres./abs. data | various (Supplementary Table 1) |
| Hard substrate [prop.%] | 2010–2013 | various methodologies | Indicator Kriging | various (Supplementary Table 1) |
| SPM (inferred)[none] | 2013 | satellite image | band 4 of multiband image | DigitalGlobe. (2014) |
| Distance to glacier [m] | 2013 | raster | Euclidean distance to coastline | DigitalGlobe. (2014) |
| Bathymetry [m] | 2012 | multi- and single beam | Interpolation to coastline 0 m | Jerosch and Scharf (2015) |
| TOC [mass%] | 2012 | push core samples | Empirical Bayesian Kriging | Monien et al. (2014); unpubl. |
| Slope [°] | 2012 | multi- and single beam | bathymetry derivative | Jerosch and Scharf (2015) |
Variables included, data sources and processing (more detailed information in Supplementary Material and Supplementary Table 1).
Macroalgae and Hard Substrate Data
For a “time of measurement” (“tom”) status of macroalgae distribution, presence and absence data sampled during 2008–2015 were compiled from three main sources: video, imagery, and hydroacoustic data (Supplementary Table 1). The macroalgae presence/absence data set covers the total environmental data ranges obtained in the study area and are densely distributed, which, according to van Proosdij et al. (2016), supports the accurate operability of ensemble SDMs (Figure 2A). Additionally, three previously unpublished video transects recorded in 2011–2012 were converted to frames, georeferenced, and analyzed for macroalgal distribution data following the methodology described in Quartino et al. (2013). A chessboard patterned hydroacoustic scan (RoxAnn GDX) of the seabed was accomplished in 2012 (Figures 2A,B). An unsupervised visual classification method was used to annotate macroalgae and substrate from the hydroacoustic data set, which was validated by imagery of a drop-down camera (Hass et al., 2016). We considered these data less reliable (high precision in position but low entropy) than data obtained from video footage and photographs [lower precision in position but high entropy (section Species Distribution Modeling )]. Areas deeper than 45 m marked as “macroalgae present” on hydroacoustic scans were excluded, since macroalgal vertical distribution was only verified to this depth (video footage in Peñón de Pesca). As macroalgae occur only on hard substrates, the following assumptions were made for the data sets in Table 1: (1) substrate coarser than “gravelly sand” is assigned as hard substrate. (2) at locations with soft sediment the absence of macroalgae is assumed, (3)“macroalgae present” sites were classified as hard substrate if macroalgae coverage was 100% and the sea floor was not visible.
Figure 2
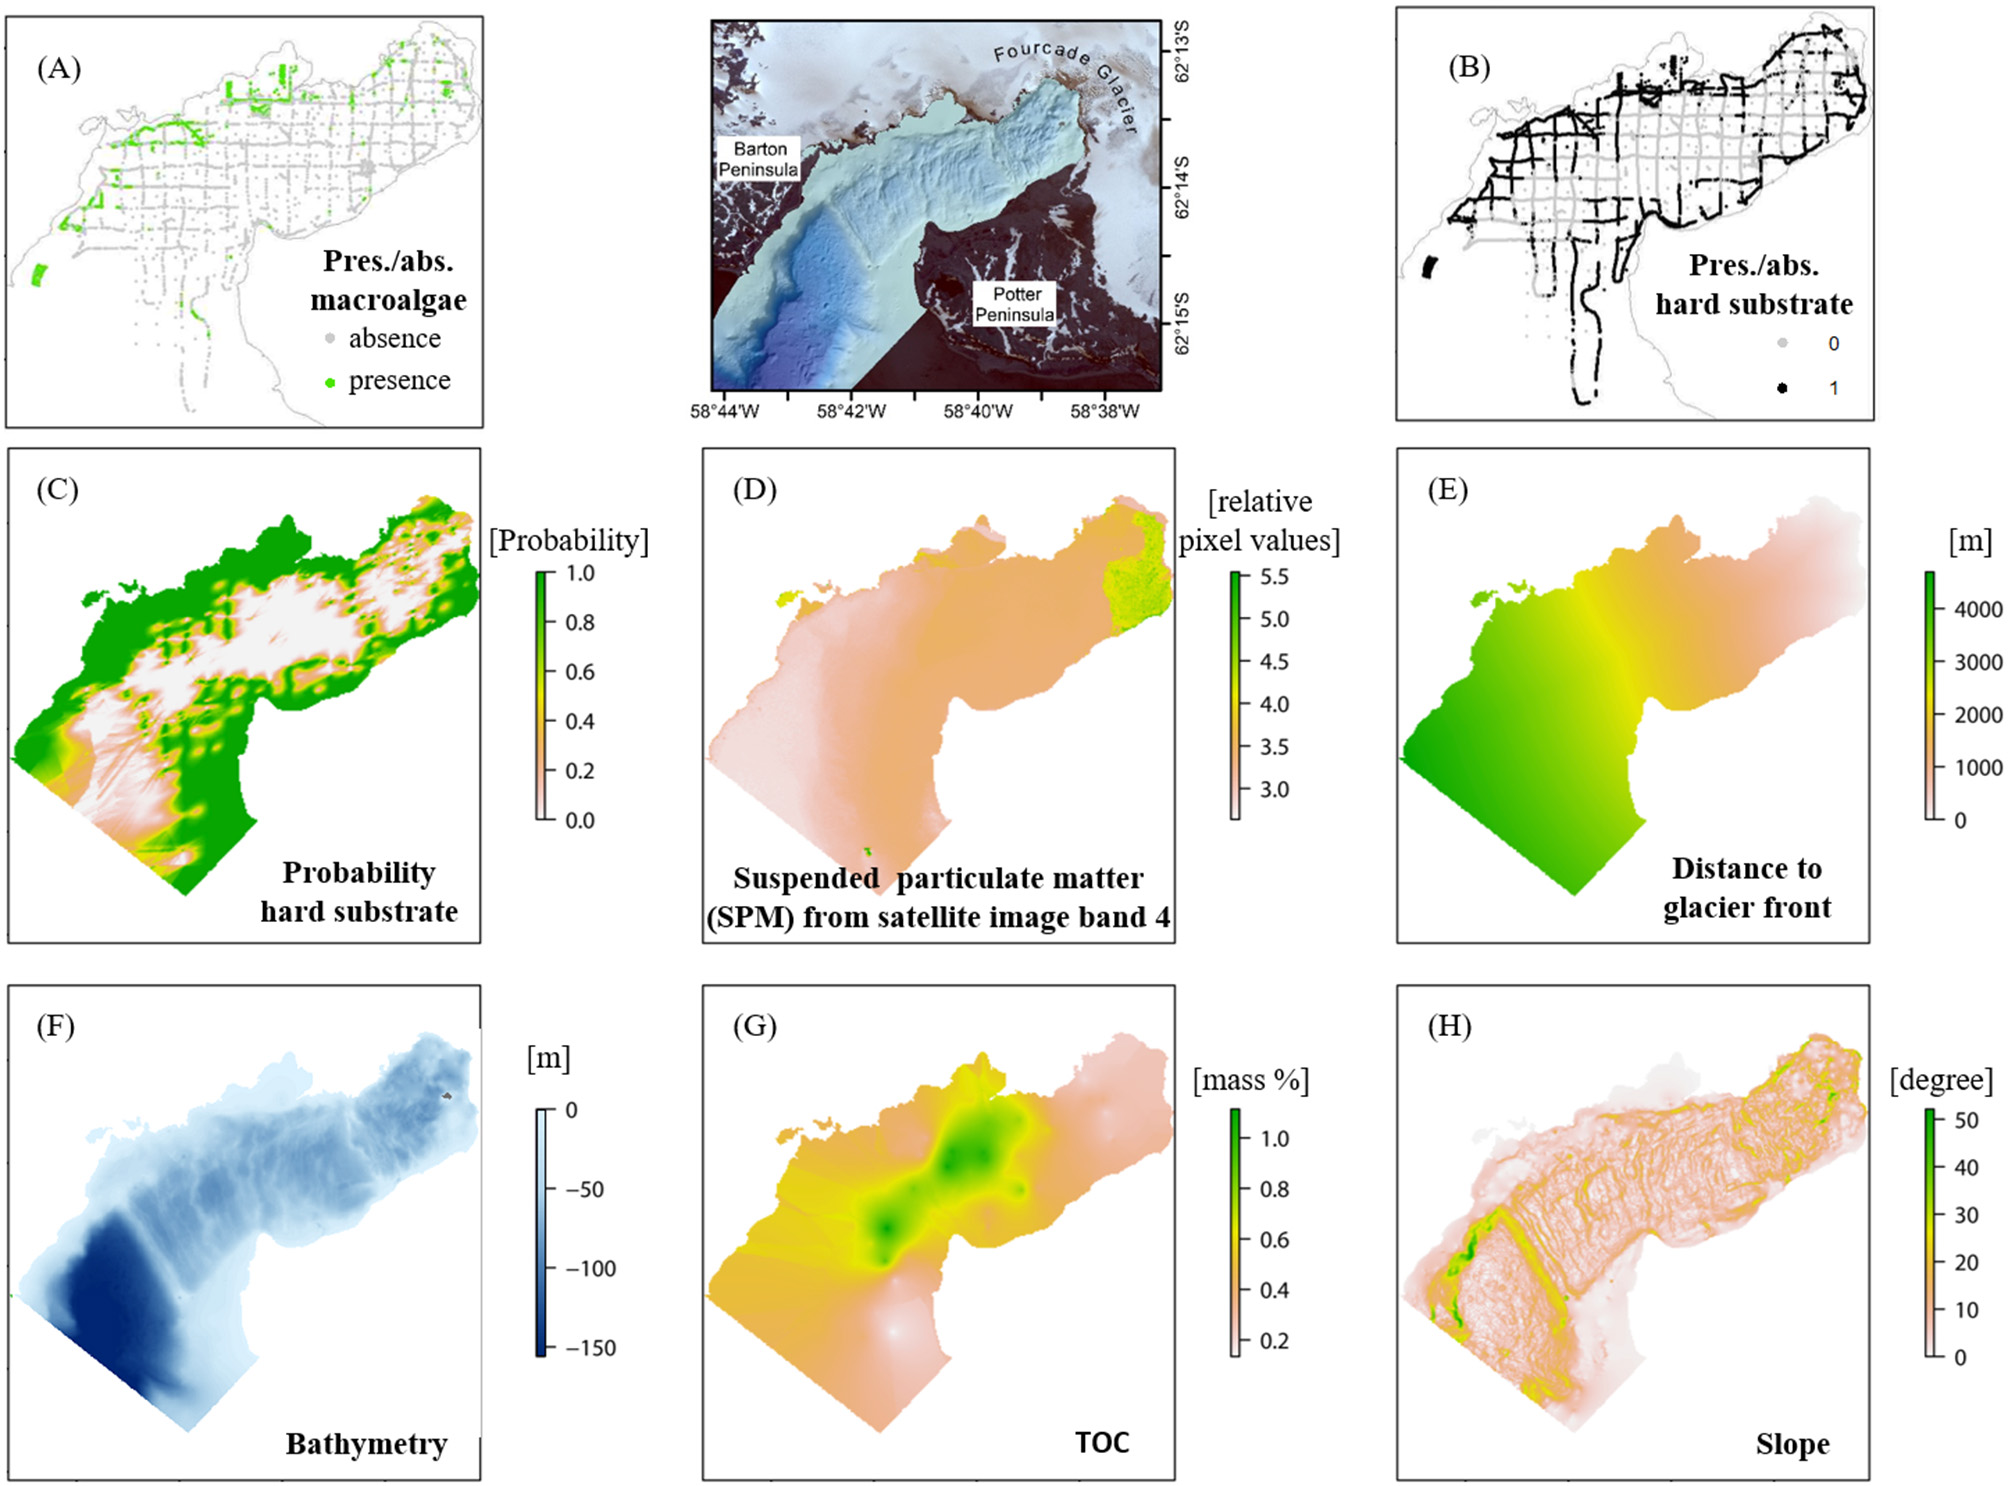
Input data for the spatial distribution modeling (SDM) in Potter Cove located between Barton and Potter Peninsula [map between (A) and (B)]: presence/absence macroalgae (A), presence/absence hard substrate (B) and six relevant environmental variables; probability of hard substrate (C), suspended particulate matter (SPM) (D), distance to the glacier front (E), bathymetry (F), total organic carbon (TOC) (G), and slope (H), ordered by the mean variable importance value resulted from the modeling process. For data sources please refer to Table 1 and Supplementary Table 1. Projection: WGS84, UTM 21S.
The first description of the spatial extent of sublittoral macroalgae coverage in Potter Cove was published by Klöser et al. (1996). Macroalgae distribution was manually extrapolated toward depth based on small-scale dive observations (video transects) recorded down to 30 m water depth during the summer season 1993/1994. For reason of comparability, we georeferenced and clipped the published map to the extent of our study area (785.31 ha) and the areas assigned to macroalgae coverage were digitized (109.63 ha, 13.96%). A mean macroalgal summer production of 5.55 t ha−1 was calculated based on the accumulated monthly production published by Quartino and Boraso de Zaixso (2008). Their sampling was performed by scuba diving at six sites, from January to March 1994, 1995, and 1996. Three sampling units of 1 m2 were placed at 0, 5, 10, 20, and 30 m along 26 transects perpendicular to the shore. Biomass data from two sites obtained during two summer seasons 1994–1995 and published growth rates (Wiencke, 1990a,b; Gömez and Wiencke, 1997) were used to calculate the macroalgal production. Quartino and Boraso de Zaixso (2008) assumed biomass as a mean over the water depth of 0–30 m. We used the same assumptions to estimate the macroalgal summer production per area in the simulations.
The hard substrate presence and absence data set resulted from several data sources acquired between 2010 and 2015 with different methodologies: van Veen grab samples, video material and photographs, acoustic data, and derivatives inferred from assumption 3 as defined above. The final data set was interpolated using indicator kriging, which produced a probability raster of occurrence (Figure 2C). For detailed information, see Supplementary Material and Supplementary Table 1.
Environmental Variables
The use of the Biomod2 spatial-temporal framework requires the definition of thematic maps (raster data) that describe the macroalgae related ecosystem.
The spatial coverage of a SPM plume (snapshot of a normal situation) is visible on the satellite image from 2013/03/07 (DigitalGlobe., 2014) and was derived from its 4th image band. The continuous raster cell values of the satellite image provide relative SPM values with a high spatial resolution of the SPM data set; the darker the cell color the higher the corresponding SPM value (Figure 2D). SPM is a highly dynamic variable both and space and time depending on the weather conditions. It is mostly connected to air temperature and wind speed and direction. The geostatistical data analysis revealed that the interpolation of a consistent data set would not result in a reliable raster data set representing e.g., seasonal mean values. We therefore decided to use an SPM snapshot, which represents an accurate and spatially consistent data set of the SMP plume extent and relative SPM amount in the water characteristically for normal weather conditions on King George Island according to meteorological data (doi: 10.1594/PANGAEA.80825, doi: 10.1594/PANGAEA.808250, doi: 10.1594/PANGAEA.758314).
The mean Euclidean distance to the nearest glacier front (Figure 2E) was calculated in ArcGIS 10.5.1 based on the glacier front digitized from the satellite image (DigitalGlobe., 2014).
The bathymetry raster (Figure 2F) with a resolution of 5 × 5 m was processed based on single beam data from the Argentinean Antarctic Institute (Instituto Antártico Argentino, IAA) published in Wölfl et al. (2014), and multibeam data acquired by the United Kingdom Hydrographic Office (UKHO, 2012) with a cell size of 5 × 5 m. A coastline digitized from the satellite image (DigitalGlobe., 2014) supplemented the interpolation process. The “Topo to Raster” tool in ArcMap 10.3 was used to merge the three data sets, with the coastline representing the 0-m-contour for the interpolation process (“contour type option”). For a detailed description of the data processing refer to Jerosch and Scharf (2015).
The TOC [mass%] raster (Figure 2G) was interpolated using the top sediment layers (up to 2 cm) of 47 published (Monien et al., 2014) and 10 unpublished (Monien, unpublished) push core samples taken in 2010. The statistical errors of several interpolation methods (e.g., IDW, Empirical Bayesian Kriging, Indicator, Ordinary, and Co-Kriging) with changing settings were compared (Supplementary Material).
The slope (Figure 2H) is defined as the seabed gradient in the direction of maximum inclination (e.g., Lundblad et al., 2006; Wilson et al., 2007) and was calculated from the directional East-West and North-South gradient of the processed bathymetry raster (DEM Surface Tools, Jenness, 2013).
Clipping and bilinear resampling of the environmental raster input to the same resolution of 5 × 5 m was processed on a raster stack in an R statistics environment (R-3.1.2, RCoreTeam, 2014). All geospatial raster data were projected to UTM21S (WGS1984) coordinates, clipped and resampled to the resolution and the extent of a template raster for the SDM.
Projection Induced by Climate Change
Even if climate warming slows down during a period of transient cooling (Turner et al., 2016; Oliva et al., 2017), the time lag of ice mass response to the current climatic conditions will cause further glacial retreat until the glacier is in equilibrium with the climatic boundary conditions (Osmanoglu et al., 2014; Falk et al., 2018). “Equilibrium” means mass accumulation equaling ablation resulting in an overall mass balance of zero. For the future scenarios, we neglected the process of hard substrate variation in the model since the glacier is currently on land. For the past scenarios we referred to the ice-free areas of the years 1988 and 1995 based on the glacier front lines published by Rückamp et al. (2011). Assuming constancy of the present retreat rates on land in the future, we can compute changes of the present ice-mass extent, which is between 35 and 90 m terrestrial elevation of the glacier equilibrium line, and the 110 or 230 m altitude of the Warzawa Icefield equilibrium line. Under these future scenarios, the distance melt water would travel through lose rocks and thawing soil would roughly double or triple (Falk et al., 2018). Based on these predictions for glacial retreat and assuming a linear increase of SPM discharge (derived from Schloss et al., 2012) with increasing distance between the glacier front and the coastline, we contrived four different modeling scenarios for a predictive analysis with varying amounts of SPM entering the Potter Cove marine system. Scenarios 1 and 2 represent conditions with lower SPM discharge (0.75- and 0.5-fold). Scenarios 3 and 4 represent an increasing rate of meltwater discharge (moderate to intense) into the system (1.25- and 1.5- fold). For each of the scenarios, supplemental ensemble models (EMs) were calculated that consider the same modeling approaches identified for the “tom” status best fit. The only difference consists in the modified SPM raster cell values: scenario 1: assuming 50% of the “tom” status SPM raster value, scenario 2: 75%, scenario 3: 125%, scenario 4: 150% (Table 2). The appropriate years representing the scenarios were estimated by a linear extrapolation of the significant regression line published by Schloss et al. (2012) for Potter Cove summer SPM data between 1990 and 2010. We set the estimated SPM value therein for the year 2010 (17.296 mg m−3) as 100% and used this value as a basis to identify years for the simulated scenarios as follows: years 1991 (scenario 1), 1998 (scenario 2), 2019 (scenario 3), and 2026 (scenario 4). Scenario 3 qualifies as “future scenario” because the “tom” status of macroalgae presence data relates to data acquired between 2008 and 2015.
Table 2
| Scenario (Year) | SPM (%) in the cove | Area (ha) covered by macroalgae* | Macroalgal summer production [t]+ | Macroalgal coverage [%] of “tom” status |
|---|---|---|---|---|
| 1 (1991) | 50 | 142.75 | 792.26 | +127.02 |
| 2 (1998) | 75 | 100.25 | 556.39 | +59.43 |
| “tom” (2008–15) | 100 | 62.88 | 348.98 t | 100.00 |
| 3 (2019) | 125 | 25.39 | 140.91 | −59.62 |
| 4 (2026) | 150 | 7.4 | 41.07 | −88.23 |
Macroalgae progression over simulated time spans (1991-2026) depending on varying SPM intensities (*Probability of macroalgal occurrence >75%; +after Quartino and Boraso de Zaixso, 2008 applying a mean summer production of 5.55 t ha−1).
Biomod2 Model Calibration and Validation
Species Distribution Modeling
We applied ten different modeling algorithms and two different prevalence-independent (discrimination) performance metrics, the threshold-independent Relative Operating Characteristic (ROC), and the threshold-dependent True Skill statistic (TSS) scores with 10 permutations to test the importance of each variable relevant for the modeled response variable within the Biomod2 environment (section Modeling Approach). Single models were run with repeated random data splits; hence, 70% of the data were used to train the models, while the residual 30% of data were used to validate model performance. Due to the cross-validation procedure, each of the 10 algorithms was replicated 20 times for the model calibration, amounting to a total number of 200 modeled results. Hydroacoustic data were weighted by 0.75 and image data by 1 (section Species Distribution Modeling).
Model Validation
The area under the ROC curve (AUC) validation statistic is a commonly used threshold independent accuracy index that ranges from 0 to 1 (1 = highly accurate prediction, 0.5 = prediction no better than random) for assessing the capacity of species distribution models. The ROC index defines the probability that an SDM will rank a presence locality higher than an absence (Pearce and Ferrier, 2000; Liu et al., 2009) and is therefore not well-suited for modeling presence only data (van Proosdij et al., 2016). According to Pearce and Ferrier (2000), rates higher than 0.9 indicate excellent discrimination because the sensitivity rate is high, relative to the false positive rate.
The deviance between observations and predictions (the subtraction of the output score from 1 for presences and from 0 for absences) throughout the whole cove may reflect the areas where commission error (negative deviance) and omission error (positive deviance) spatially coincide (Lobo et al., 2008). The deviances between observations and predictions are expressed as under- and overestimations as follows: underestimation is defined as −97 to −50% deviance of measured to predicted value (e.g., measured 1 for presence and measured 0.25), moderate underestimation −50 to −25%, good −25 to 25%, moderate overestimation 25 to 50%, overestimation 50 to 91% (e.g., measured 0 for absence and measured 0.75). Besides over and underestimation, this itemization also reveals the regional distribution of the errors; information, which is not provided by the TSS and the ROC scores.
As the AUC is used for SDM evaluation (e.g., Vorsino et al., 2014), but also has been criticized (e.g., Jiménez-Valverde, 2012), we also provide the evaluation criterion TSS, recommended by Allouche et al. (2006). The TSS is a measure of performance of species distribution models and prevalence independent and favors the combination of binary predictions which best separate presences from absences. It corresponds to the sum of sensitivity and specificity minus one. The “sensitivity” value denotes the proportion of presences correctly predicted, whereas the “specificity” value denotes the proportion of absences correctly predicted (Barbet-Massin et al., 2012). TSS statistic ranges from −1 to +1 and tests the concordance between the expected and observed distribution. A TSS value of +1 indicates perfect agreement between the observed and expected distributions, whereas the value 0 defines a model which has a predictive performance no better than random. An evaluation metric quality measure of 0.7 or higher indicates good or very good performance of the model (Thuiller et al., 2010).
Ensemble Modeling
The application on biomod2 is one of several current approaches to modeling species' distributions using presence/absence data and environmental data. Because of stochastic elements in the algorithm and underdetermination of the system (multiple solutions for the model optimization), no unique solution is produced. Such ensemble models have been used extensively in credit scoring applications and other areas because they are considered to be more stable and, more importantly, predict better than single classifiers (Lessmann et al., 2015). They are also known to reduce model bias and variance (Kim et al., 2006; Tsai and Hsiao, 2010). Ensemble classifiers pool the predictions of multiple base models. Much empirical and theoretical evidence has shown that model combination increases predictive accuracy (Paleologo et al., 2010; Finlay, 2011). Biomod2 proposes an ensemble modeling approach implying the synthesis of two or more SDMs of best fit to a single ensemble model (EM), thus to improve model accuracy by including an indication of fuzziness and to asses model congruence. This inclusive statistical procedure improves the stability and accuracy of predictive non-linear models, because it integrates uncertainties in parameter values and model structure. The approach has already been applied for ecosystem degradation by Vorsino et al. (2014) and for Antarctic sea-level rise simulations by DeConto and Pollard (2016). EMs consider uncertainties such as dependence on the initial conditions and partially incomplete model formulation.
In this study, the EM was enhanced successively by the systematic parameter selection and an optimization of the TSS threshold by visual revision. The total number of alternative realizations (200) was scaled by a binomial GLM to ensure comparable results. The EM was calculated as the mean value of 135 alternative realizations with a high TSS value (>0.7) defined as “good” prediction accuracy (Thuiller et al., 2010).
Results
Model Quality Assessment
The algorithm-ranking by TSS and ROC scores for all alternative realizations (Figure 3) shows best performance of the RF algorithm, followed by CTA, GBM, MaxEnt, and GAM. All 20 realizations of these five algorithms were incorporated into the EM. Furthermore, the majority of MARS (16) and FDA (14) realizations had mean TSS scores clearly >0.7 and a ROC >0.9. Five ANN realizations barely achieved a TSS evaluation score between 0.70 and 0.72 and a ROC between 0.90 and 0.91. GLM and SRE performance was comparatively weak. Hence, these algorithms were not included in the EM. The lineup of the most suitable realizations for each algorithm (Figure 4) highlights the spatial distinctions between the results. Most of the models showed good or very good performance in terms of predictive power and accuracy, with highest ROC values of 0.980 and 0.941, obtained for the RF and CTA models, respectively. The poorest performance was shown by the SRE model which had a mean ROC of 0.768. Nevertheless, the mapped distribution patterns varied remarkably depending on the model used. For response curves see Supplementary Figure 2. The EM predicts the spatial occurrence of macroalgae in Potter Cove with a high statistical reliability (TSS 0.833/ROC 0.975).
Figure 3
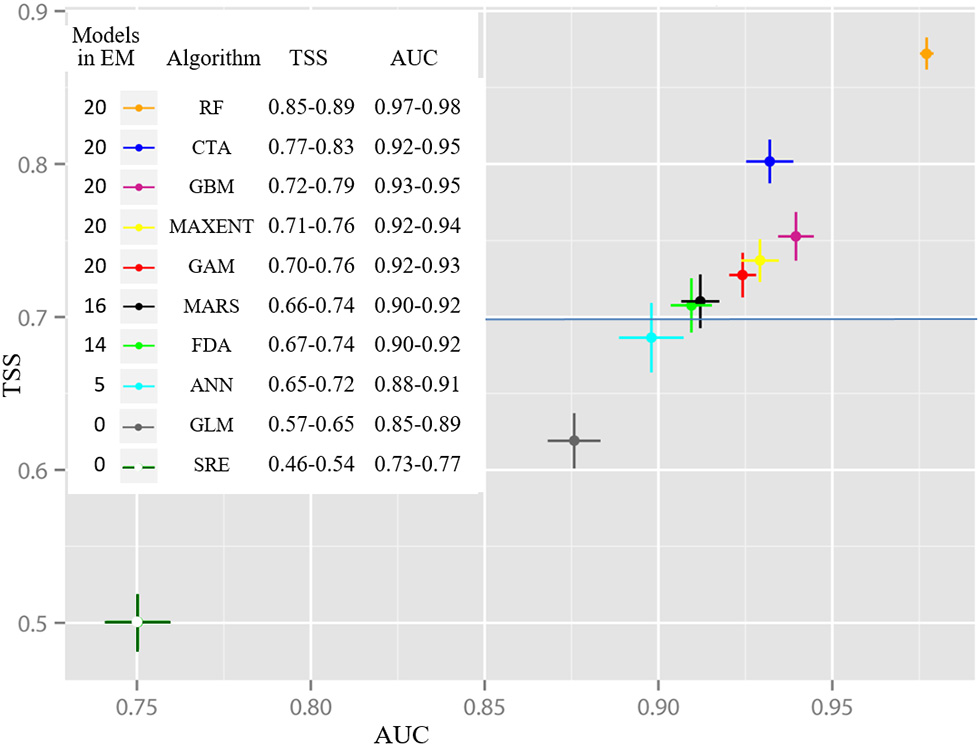
Averaged evaluation scores of Relative Operating Characteristic (ROC) and True skill statistic (TSS) ordered by modeling algorithms (20 runs each) indicate best performance of Random Forest (RF) whereas Species Range Envelope (SRE) was the least well-performing modeling algorithm. The points represent the averaged values; the deviation bars indicate standard deviation of the evaluation scores across each group and number of runs included in the ensemble model (EM).
Figure 4
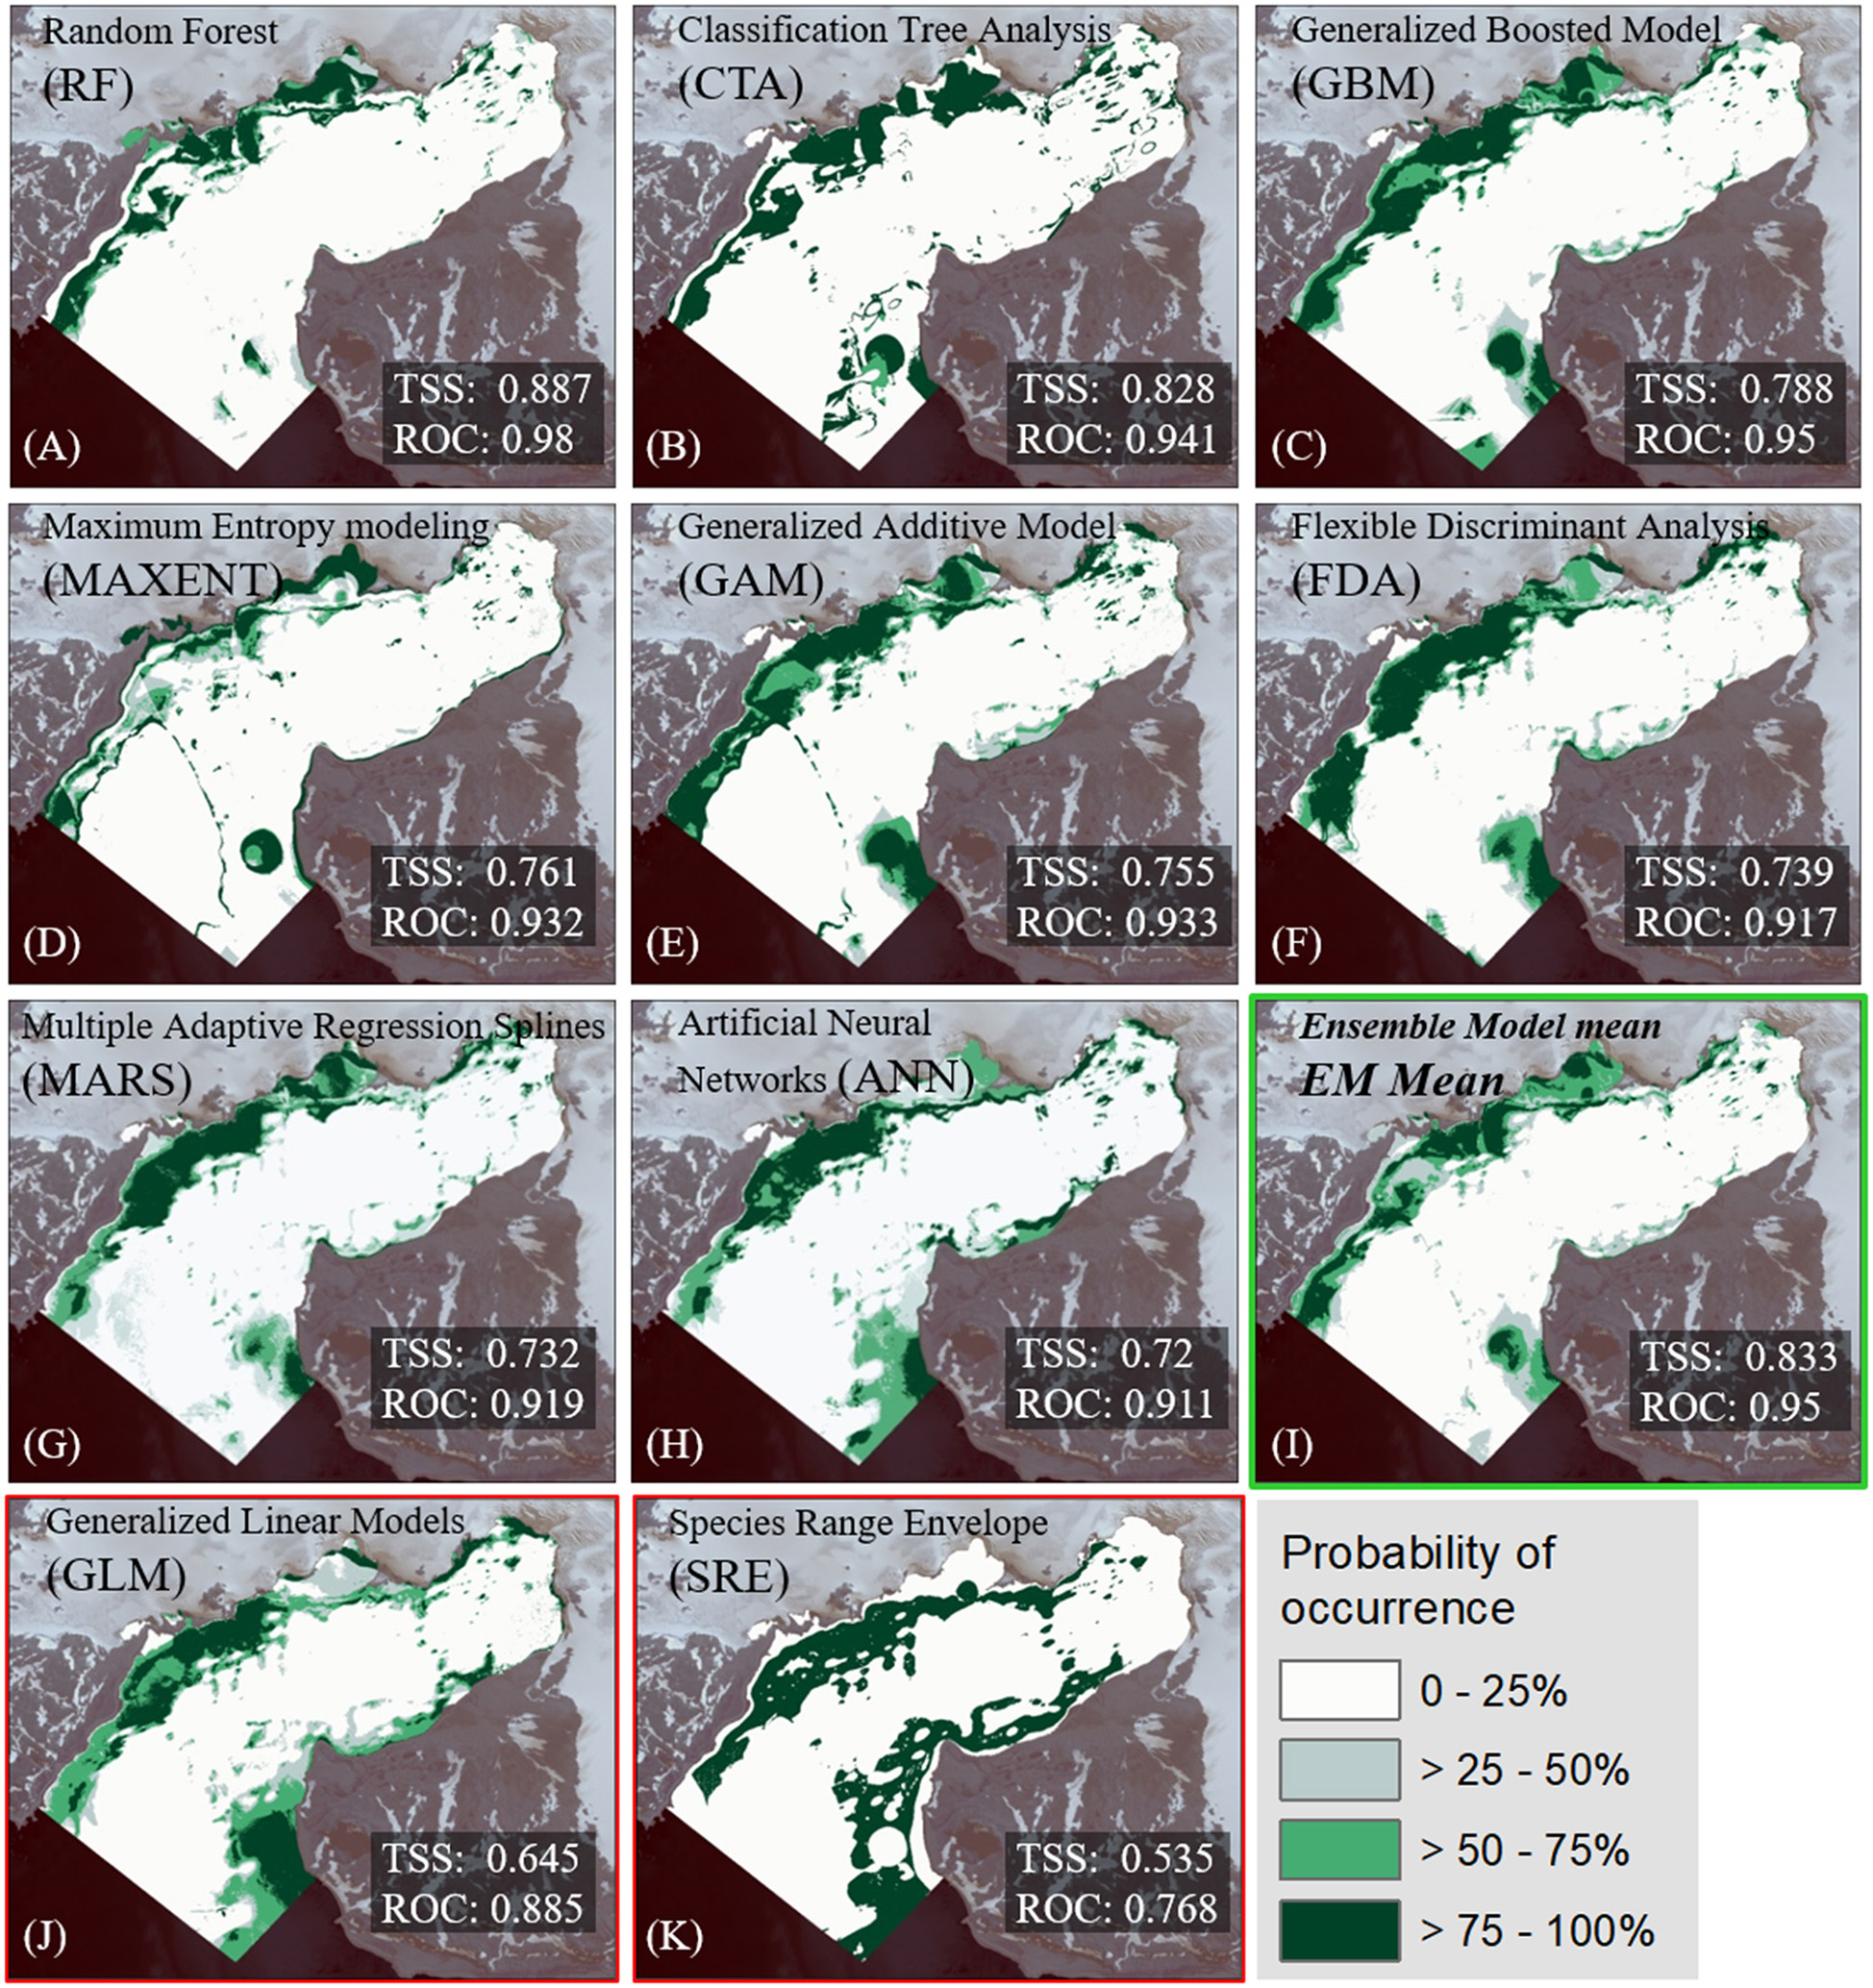
Most accurate results according to TSS and ROC measures for macroalgae distribution per SDM-algorithm are shown (A–K). The models are ordered by their predictive quality according their True skill statistic (TSS) and Relative Operating Characteristic (ROC) scores. The probability of macroalgae occurrence is given in %. Note that none of the models generated with GLM (J) and SRE (K) scored for the implementation into the EM (TSS <0.7). The final mean Ensemble Model (I) is highlighted with a green frame.
A validation across all 135 models revealed a ranking of environmental variables accounting for the “tom” status macroalgae distribution (Figure 5A) by mean variable importance values from high to low as follows: probability of hard substrate occurrence (36.62%), SPM (24.83%), distance to glacier front (12.35%), TOC (9.69%), bathymetry (9.08%), and slope (7.44%). The percent values were independently determined by the model and no interactions were taken into account between the variables.
Figure 5
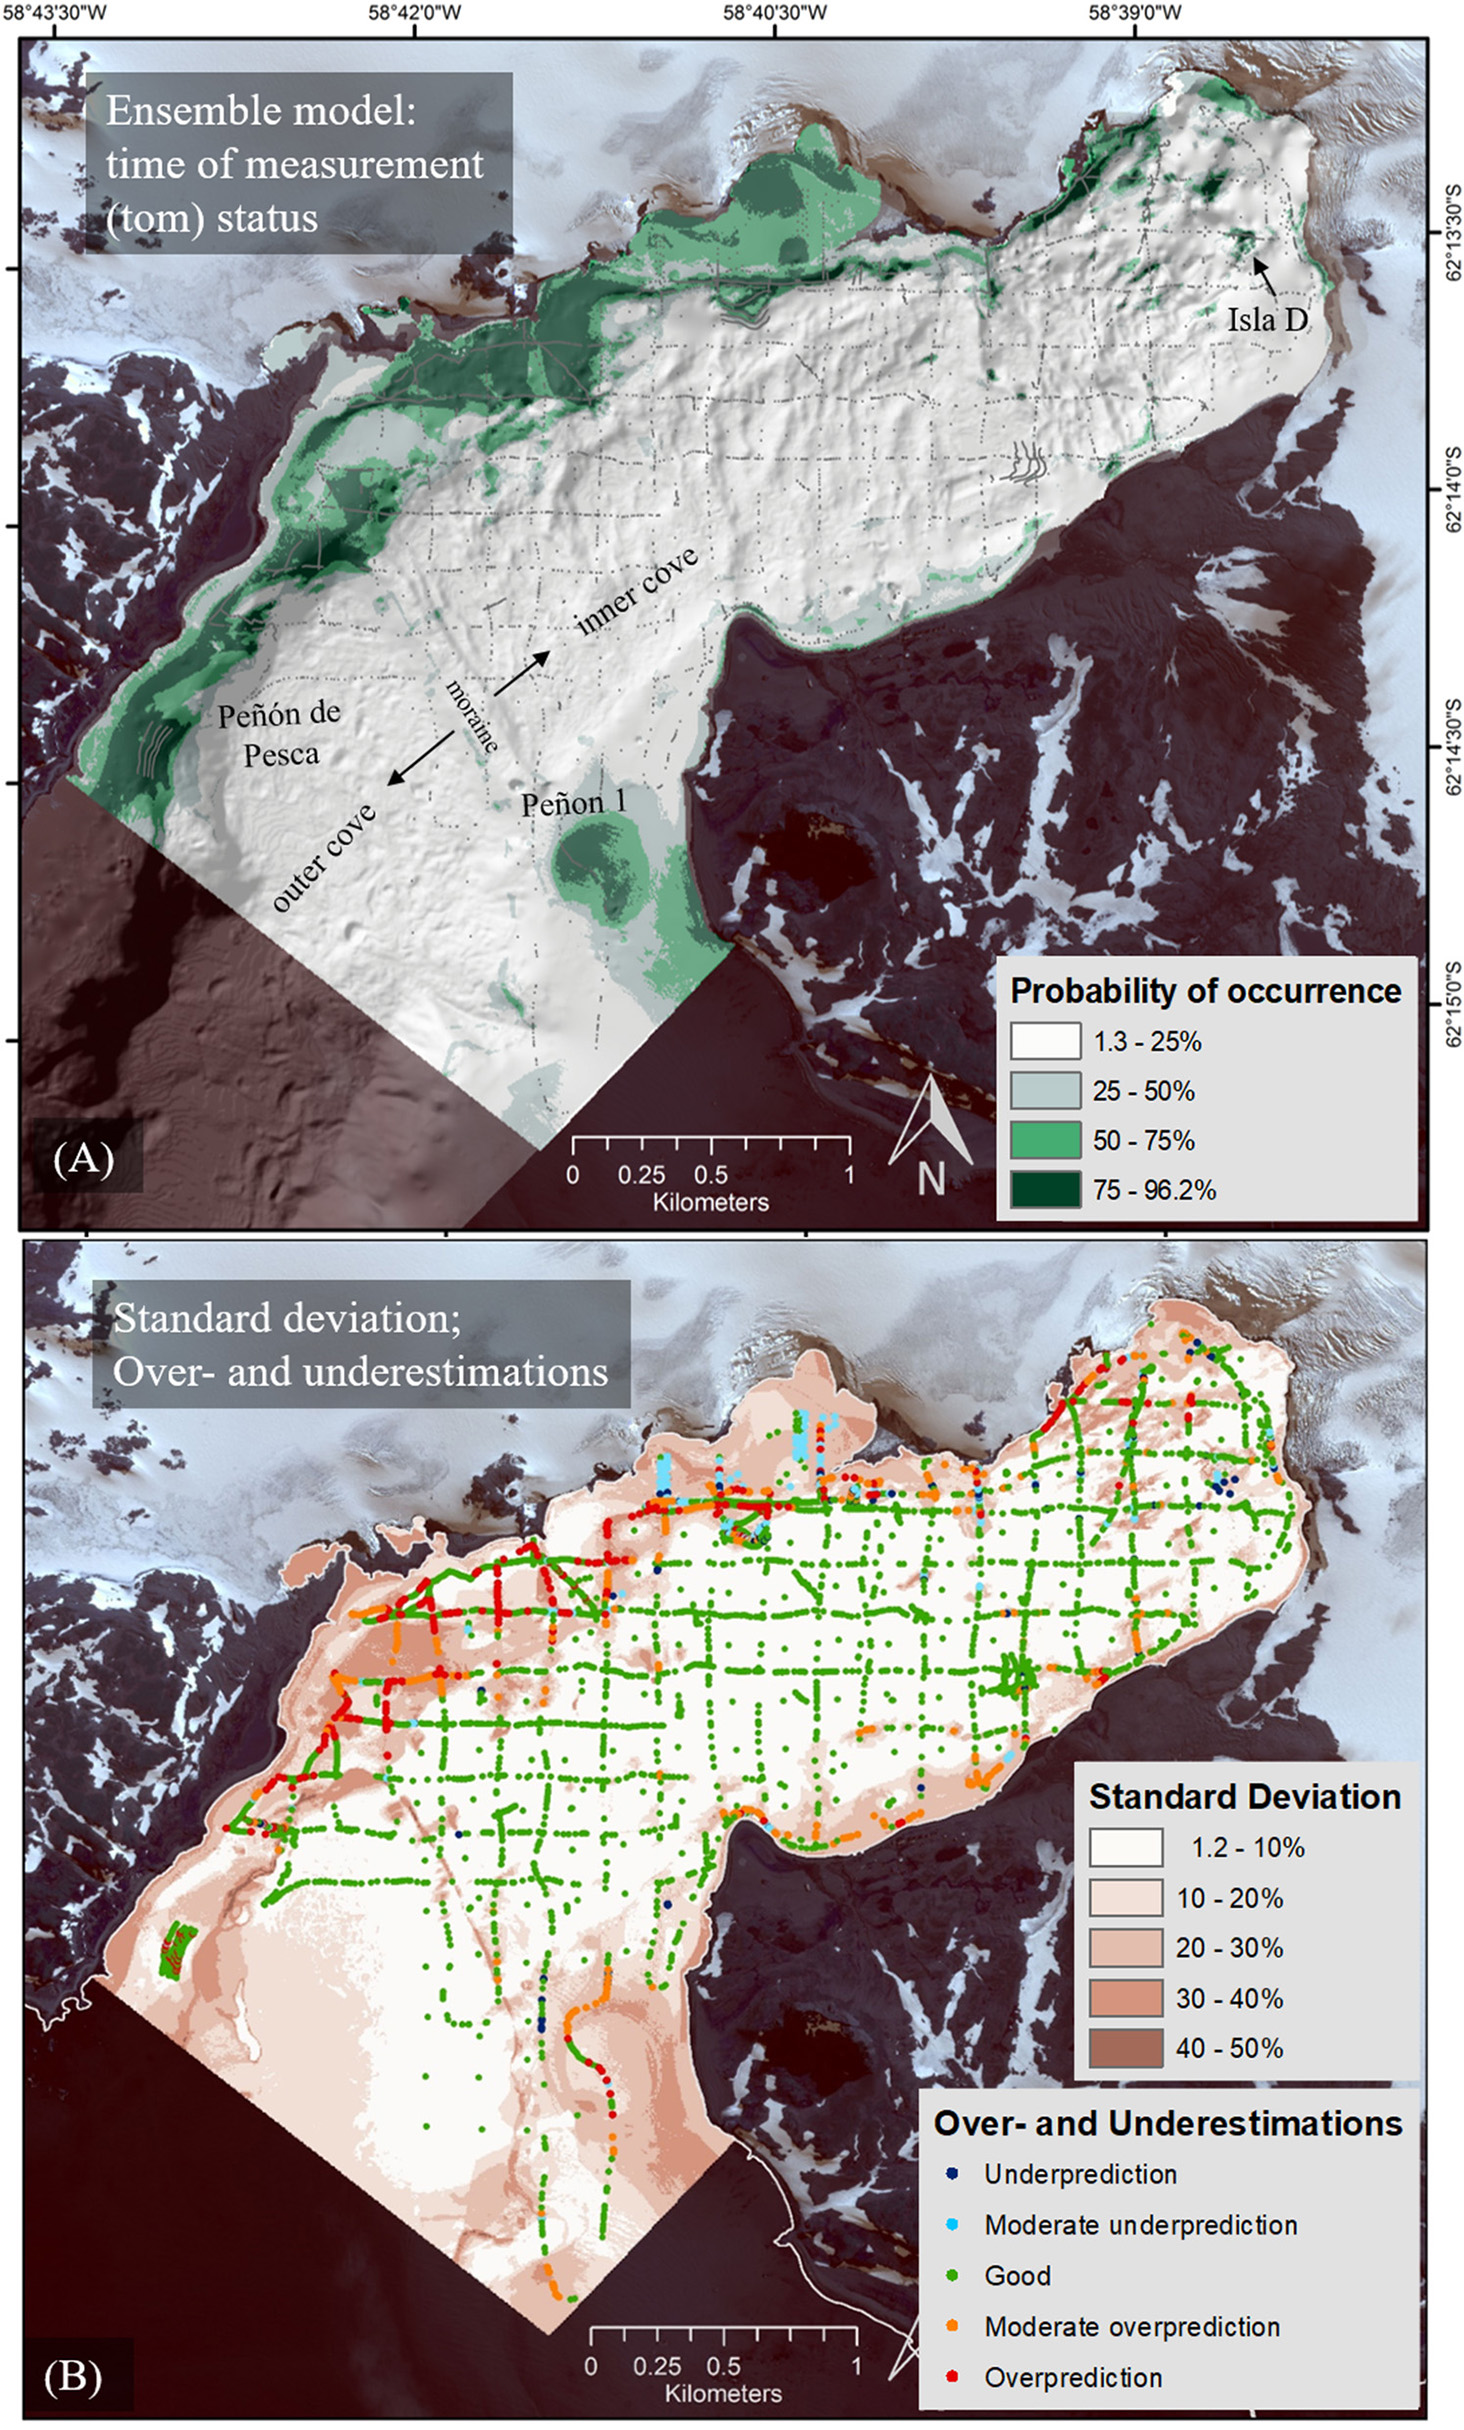
Ensemble model (EM) probabilities of macroalgae occurrence mean (A) and the standard deviation (B). The standard deviation map also provides the mean error (ME) between prediction and measured value (presence/absence) and thus, distinguishes between under and overestimated areas of projected macroalgae. Underestimation: −97 to −50% deviance of measured to predicted value (e.g., measured 1 for presence and measured 0.25), moderate underestimation −50 to −25%, good −25 to 25%, moderate overestimation 25 to 50%, overestimation 50 to 91% (e.g., measured 0 for absence and measured 0.75).
Simulation of Macroalgal Distribution in Potter Cove
In the “tom” status EM (2008–2015) in Figure 5A, macroalgae communities are concentrated on the northern and northwestern shores of Potter Cove, with diminishing occurrence probability toward the inner glacier-proximal cove section (northeast). The northwestern areas represent hard substrates exposed by glacial retreat. A second region of high occurrence is located close to the southeastern edge of the cove opening into Maxwell Bay (Peñón 1) which has a longer history as ice-free area. Areas of uncertainties and differences between the alternative realizations were determined based on standard deviation and under- and overestimated areas (Figure 5B). Small standard deviations were typical for the deeper parts of the cove where macroalgae are absent. The high scores of standard deviations in the northern part of Potter Cove resulted from small-scale variability in the binary-coded macroalgae input data set of presence (1) and absence (0), located in close vicinity to each other, as well as from areas of poor sample density. Where the standard deviation was high, the model revealed overestimations, preferably in areas of macroalgae. Here, the model has difficulties to represent the small-scale variability of input data (presence alternates with absence at very close range) and predicts macroalgae presence in areas of general absence of algae. In contrast, only few underestimations occurred in the inner cove (measured presence predicted as absence).
Macroalgae (water depth of >30 m, hard substrate) cover 62.88 ha of the 785.31 ha Potter Cove total bottom area, which equals 8.01% macroalgae coverage in Potter Cove. Applying the mean macroalgal summer production of 5.55 t ha−1 estimated from Quartino and Boraso de Zaixso (2008) the mean summer macroalgae production for the study area in Potter Cove is approximated to 348.98 t in the “tom” scenario (2008-2015). Of the total modeled macroalgal summer production, 5.22% are estimated for the newly ice-free areas due to glacier retreat (3.48 ha), which amounts to 19.31 t (Supplementary Figure 3).
The scenario maps derived from the “tom” EM display the potential macroalgae distributions, based on the assumptions of varying SPM transport dynamics into Potter Cove (see section Biomod2 Model Calibration and Validation) relating to different states of glacier retreat in past and future. Scenario 1 (simulating the state in 1991; Figure 6A) and scenario 2 (1998; Figure 6B) show more spatially extended macroalgae occurrence probability under reduced SPM input and thus higher light availability in the water column. Especially in the southern peripheral region and in the inner glacial proximal cove section of Potter Cove, macroalgal presence probability becomes significantly greater compared to the 2008–2015 “tom” status. We validated our modeling approach for the past by overlaying the macroalgae distribution obtained in scenario 1 (status 1991) with the digitized map of Klöser et al. (1996) and the original in situ data from 1994 to 1996 (Quartino et al., 2005), and with the coastline of Fourcade glacier from 1995 (Rückamp et al., 2011). Almost everywhere, the predicted areas match fully with the in situ data (Figure 5), which additionally confirms the validity of our model.
Figure 6
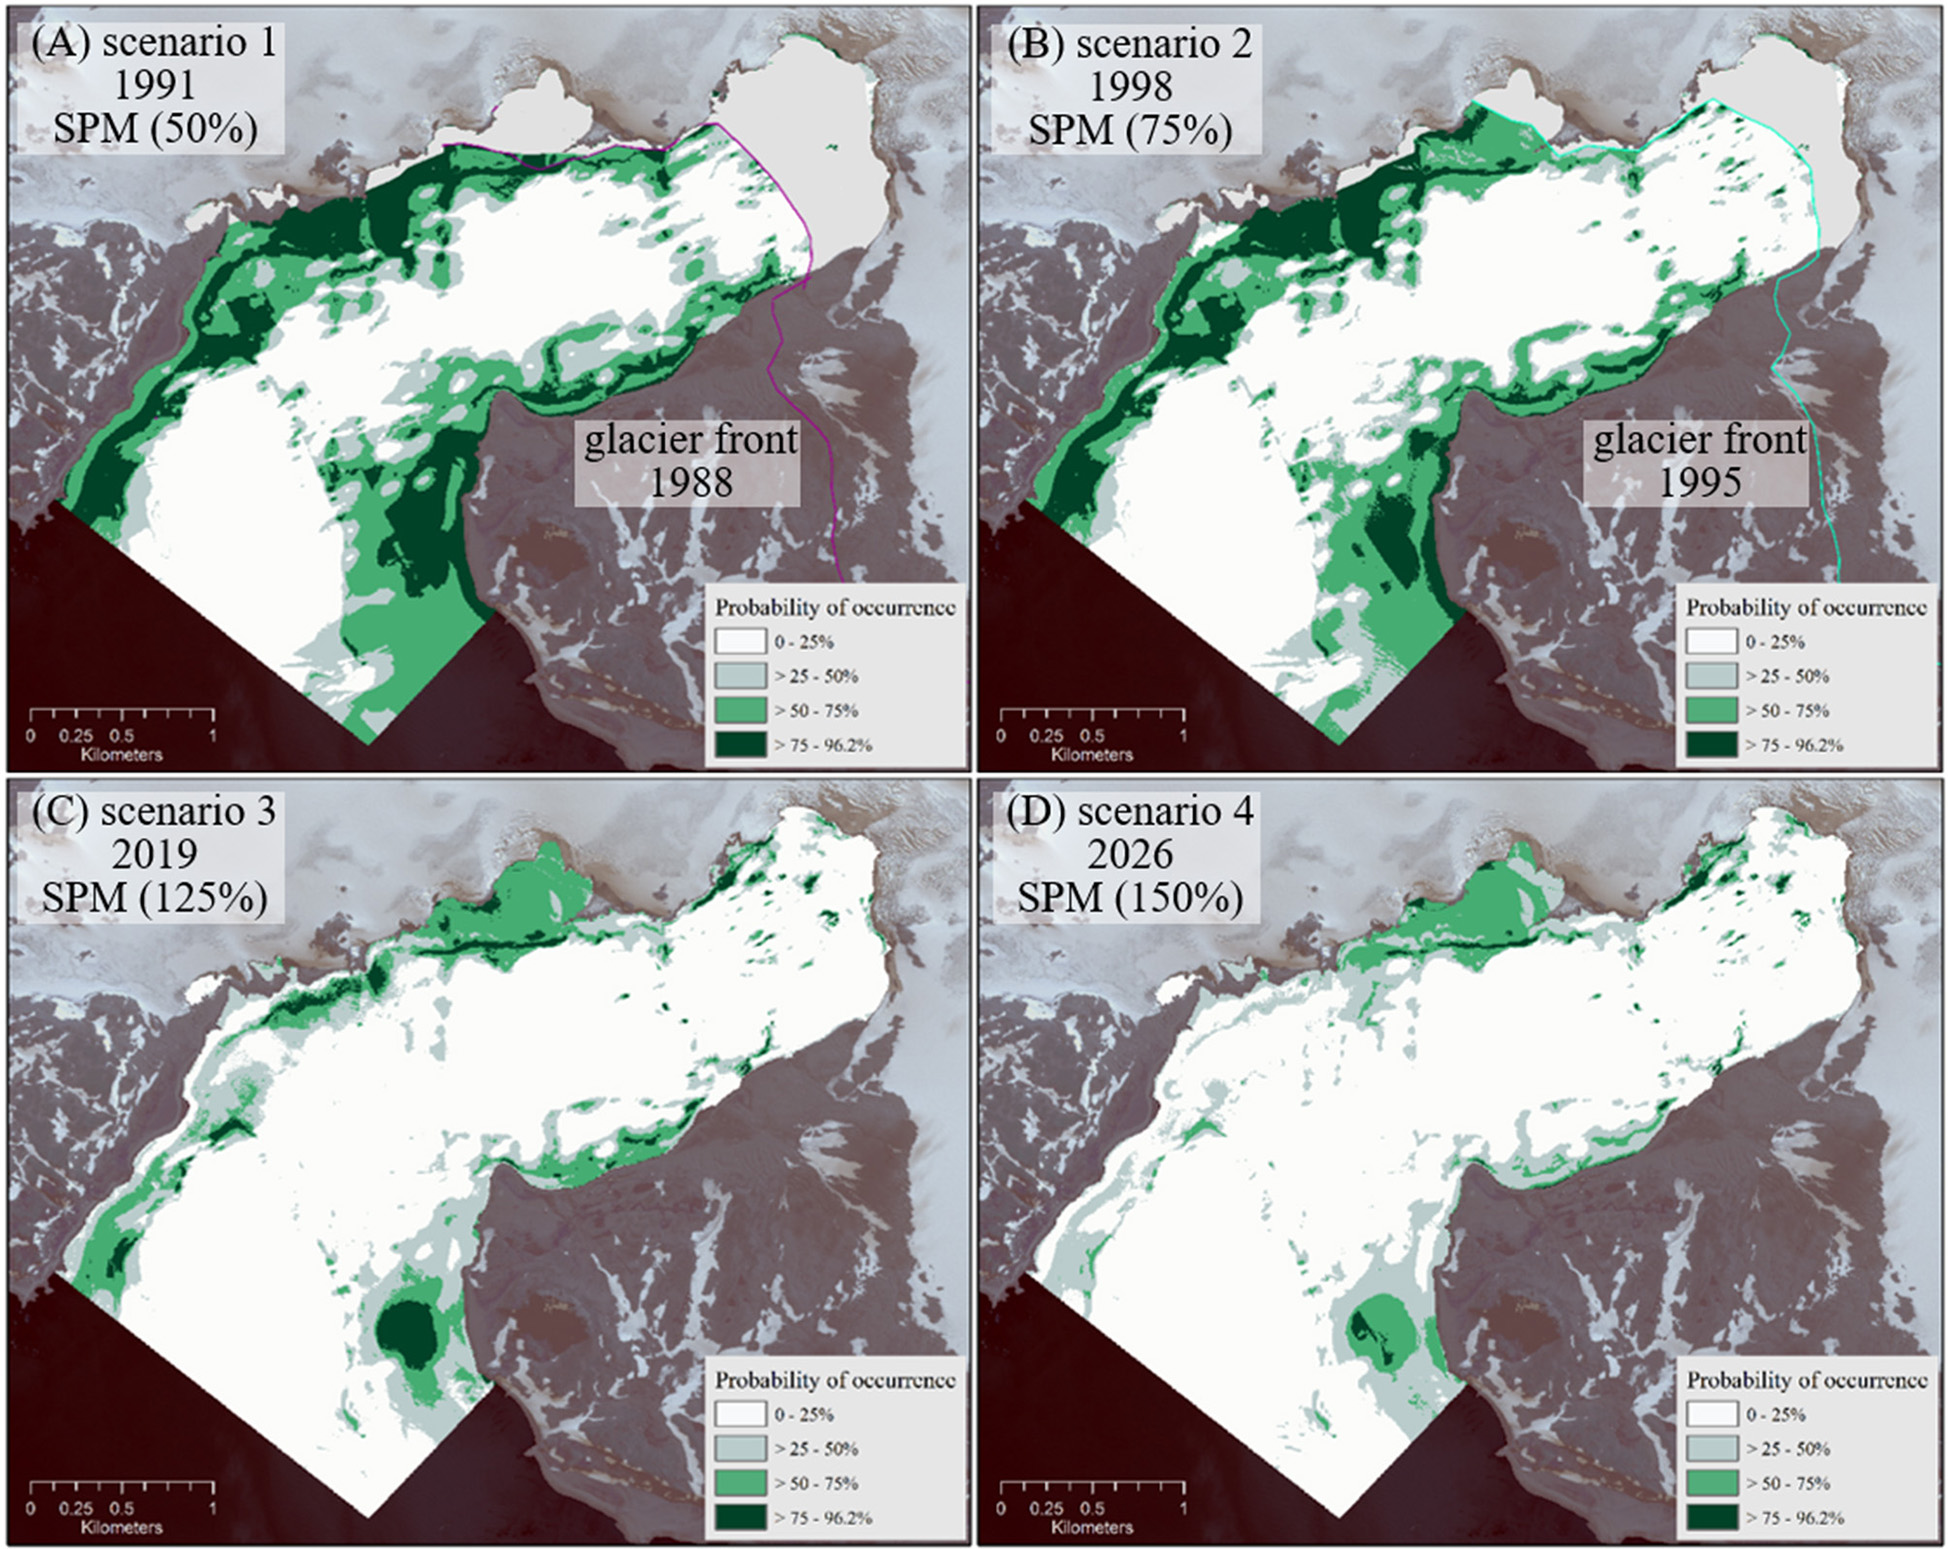
Potential macroalgae distribution [%] under the assumptions made for scenarios 1–4 (A–D). Glacier fronts from 1988 and 1995 (Rückamp et al., 2011) provide an approximation of ice-free area extend in the cove for the past scenarios 1 and 2 (A,B).
Scenarios 3 (year presumed 2019) and 4 (2026) in Figures 6C,D assume increased sediment stress in the near future and predict a decrease of areas inhabited by macroalgae compared to the “tom” (2008–2015) scenario. The most significant negative changes are predicted for the northwestern area close to the outer cove (Peñón de Pesca).
As a general trend, macroalgal coverage is decreasing between the past, over the “time of measurement,” toward the future scenarios, under conditions of increasing SPM runoff into the cove, the basic assumption in our simulations (Figure 6). This results in a decrease of macroalgal summer production over time. In scenario 1 (1991) the macroalgae suitable habitat area (probability >75%) extends over 142.75 ha. Applying the mean macroalgal summer production estimate of 5.55 t ha−1 (Quartino and Boraso de Zaixso, 2008) this equals 792.26 t. In scenario 2 (1998) only 100.25 ha are covered by macroalgae equaling 556.39 t. In contrast, macroalgae area extension decreases to 25.39 ha ( 140.91 t) in scenario 3 and to only 7.4 ha in scenario 4 ( 41.07 t). Distribution maps for macroalgae under varying SPM conditions (Figure 6) are available at doi: 10.1594/PANGAEA.854410 (Jerosch et al., 2015).
Discussion
Enhanced spatial knowledge of suitable habitat conditions for macroalgal growth allowed for refined estimations of macroalgal summer production in Potter Cove on KGI, compared to previously published estimates based on straight forward up-scaling. We deem the integrative EM approach preferable over single SDM based approaches, as it accounts for uncertainty (e.g., initial conditions, imperfect model formulation), and model congruence (e.g., Vorsino et al., 2014; DeConto and Pollard, 2016). In agreement with the ecology and physiology of benthic macroalgae (Wiencke and Clayton, 2002; Hanelt et al., 2003; Zacher et al., 2009; Hurd et al., 2014), the present EM identified hard substrate occurrence and SPM distribution in surface waters as the main drivers for macroalgae distribution and colonization in this Antarctic fjord. Sufficient light availability is, indeed, an important prerequisite for a positive carbon balance and the build-up of macroalgal biomass (Gomez et al., 1997; Deregibus et al., 2016). On the other hand, the model does not include important factors such as ice scouring in the inner part of the cove (Deregibus et al., 2017), sedimentation effects on algal grazers (Zacher et al., 2016), and it does not account for obvious interactions and feedback loops between different input variables. Newly opening hard substrate surfaces in glacial proximity can be smothered and buried under sediment deposits as glacial run-off continues, reducing macroalgae habitat availability.
To our knowledge, we here present the first correlative distribution model of macroalgae in polar regions. The SDM was evaluated reliably (TSS 0.833/ROC 0.975) by using independent field data for past and present scenarios. Both continuous performance metrics such as AUC and binary performance metrics such as TSS are independent of prevalence (i.e., proportion of spatial coverage). They are often employed as they are frequently implemented in software solutions such as Biomod2. Prevalence-independent metrics are, however, limited to measuring discrimination and cannot be used to assess calibration. Binary metrics often select models that have reduced ability to separate presences from absences, which can lead to uncertain estimates (Lawson et al., 2014). We applied 20 runs for each algorithms, generating 20 AUC and TSS values for each model, to provide a more informative evaluation of model accuracy than only one estimate. We used AUC and TSS, two evaluation methods found in many published examples (e.g., Hijmans, 2012; Vorsino et al., 2014), to compare the modeling results obtained with different algorithms for our data set. However, we agree with the recommendation of Lawson et al. (2014) and Muscarella et al. (2014) to use the wider application of prevalence-dependent continuous metrics, particularly likelihood-based metrics such as Akaike's Information Criterion (AIC), to assess the performance of presence–absence models. As AIC has not yet been implemented in Biomod2, combination with the R package ENMeval (Muscarella et al., 2014) is recommended for future SDM studies.
Furthermore, the model could be improved by applying structured, spatially segregated allocation of data to calibration and validation data sets instead of random splitting, to assess the ability of the model to predict more distant locations and to conduct spatially independent model evaluations (Dormann et al., 2007; Hijmans, 2012; Muscarella et al., 2014; Roberts et al., 2017). This is especially recommended in studies in which training and test data sets are not spatially independent in all areas as was the case in Potter Cove. This approach could have in particular improved the predictions in the northern part of the cove where under- and overestimations occur in close vicinity (Figure 5; Barnes and Clarke, 2011; Lawson et al., 2014; Muscarella et al., 2014; Boavida-Portugal et al., 2018).
The model considers two decisive but opposed effects influencing the distribution of macroalgae: new ice-free areas due to tidewater glacier retreat provide new potential habitats while increased sediment run-off reduces light availability, the prerequisite for algal growth (Quartino et al., 2013). The extrapolation of a linear regression on long-term SPM data (1991–2010) (after Schloss et al., 2012) to the year 2026 was used to simulated two past and two future scenarios with distinct SPM levels. We studied macroalgae distribution in the year of glacier transition on land; hence no more newly ice-free areas can be expected in future Potter Cove scenarios. However, apparently the time elapsed since ice retreat has not allowed for appreciable macroalgal growth in every section of the newly available habitat. Hence, the model predicts further alterations of the macroalgal habitat in Potter Cove as long as SPM concentrations increase during growing season and a likely decrease in macroalgae biomass, albeit with new colonization of recently ice-free and still not overgrown habitats in the inner cove.
The EM predicts decreasing macroalgal area coverage for particular scenarios with increasing sediment run-off through the past to the recent past (“tom” status) and into the future. Both, the predicted “tom” status (2008–2015) and the past 1991 scenario 1 could be confirmed by comparing to empirical knowledge of past macroalgal distribution, based on underwater video and photographic transects. Macroalgae presence/absence data (Figure 2A) reveal low macroalgae distribution along the south coast, which explains low probability values in the “tom” scenario, whereas future and past scenarios show ample macroalgae probabilities. This effect is caused by hard substrate availability and by local variation of SPM. Both, measured and then interpolated SPM data, as well as the satellite pixels, show slightly lower SPM values along the southern coast. However, SPM residence time and plume extension are highly variable in space and time. Nevertheless, we can predict low macroalgae probability on the southern coast because the currents push the SPM plume (Lim et al., 2013) toward this side, and because the sandy bottom is covered by smaller and looser stones and rubble rather than by rocks as on the north coast.
The modeled mean summer macroalgae production for 1991 is 23% greater than the production estimated for 1994–1995 (790 vs. 608.65 t) based on phototransects (Klöser et al., 1996; Quartino and Boraso de Zaixso, 2008) and calculated for exactly the same spatial extent of study area. We attribute the main difference to a methodological underestimation due to the low data density. According to the modeled results, there is indication for a higher macroalgae coverage at the northern coast of the cove compared to the study of Klöser et al. (1996) (Supplementary Figure 3). However, decreasing production over time in our simulation is in good agreement with our recent results showing a slight decrease in production from 1991 to 1994–1995.
SPM significantly depends on the climate weather conditions, mainly air temperature and wind speed as well as the duration of these weather conditions. Our analysis showed that the weather conditions (wind speed and direction) 1 day or hours before the measurement correlate to the SPM amount in the water column. We are currently working on modeling the SMP dynamics in Potter Cove coupled with FESOM-C (Androsov et al., 2019), which will be used for future SDMs in Potter Cove. This new analysis shows that meteorological conditions on the day before the measurement strongly influence spatial SPM concentrations in Potter Cove surface waters (Neder and Fofonova, unpublished data).
The SPM snapshot we used in this study indicates decreasing SPM concentration from the head toward the outer cove. On the same transect, macroalgae maximum growth depth and the summer production increase reciprocally and macroalgal species composition changes (Quartino et al., 2013; Deregibus et al., 2016; Campana et al., 2018). Increasing turbidity, meaning less light availability may lead to an upward shift of the macroalgae at the coastline, because they do not maintain positive carbon balance at deeper depth under high SPM (Deregibus et al., 2016). An upward shift of macroalgae was also found for an Arctic fjord comparing data from the mid-90ies with 2012–2014 (Bartsch et al., 2016). Not only the decreased light availability for the algae, but also the sediment per se may reduce the macroalgal recruitment success by up to 100% (Zacher et al., 2016). This may be due to processes such as sediment scour and burial (Airoldi, 2003).
While scenarios 1 (1991) and 2 (1998) model macroalgal coverage of 143 ha and 100 ha, Klöser et al. (1996) made their approximation for 110 ha in 1993/94. The model describes the past and the “tom” status of macroalgal distribution in Potter Cove with a slight tendency of an underestimation. The arguably crude projection of macroalgal community distribution and inferred productivity in a future of increasing discharge of eroded sediments for 2019 (scenario 3) and 2026 (scenario 4) highlights a general trend toward a dramatically reduced macroalgal summer productivity inside Potter Cove as melting of the Fourcade glacier continues. This process is mitigated by an increased colonization and productivity by macroalgae inside the cove in shallow hard bottom areas formerly covered by the glacier (Quartino et al., 2013; Deregibus et al., 2016; Campana et al., 2018) and hence predicts a general increase in benthic primary production in polar coastal areas.
This rather drastic decline of productivity presumably represents an overestimation because modeled SPM values were reduced/increased equally in all areas of the cove and by assuming a linear relation between distance to the glacier and SPM change in time. Monien et al. (2017) stated, however, that up to 50% of the plume sediments are deposited in glacier proximal areas (the inner cove) and do not affect all areas equally as assumed in our model. This is also indirectly confirmed by light measurements at different sites of the cove, measuring higher light penetration in the outer cove compared to the inner cove (Quartino et al., 2013; Deregibus et al., 2016). Furthermore, the satellite image showing the SPM plume represents a snapshot of a single day, potentially failing to adequately represent the general situation. However, even if changes will be less pronounced, the negative effect of increased sedimentation on macroalgal distribution and production is clearly visible and reproducible with our applied data sets.
More spatial aspects that structure benthic communities in polar areas can be added to the model such as ice scouring and sea ice timing (Smale et al., 2008; Barnes, 2017; Deregibus et al., 2017). Clark et al. (2013) predicted that earlier ice break-up can shift shallow water ecosystems from invertebrate dominated to macroalgae dominated communities, in areas with hard substrate present. In recent years we observed higher frequency of ice-free winters in Potter Cove (doi: 10.1594/PANGAEA.773378, Gómez Izquierdo et al., 2009). In the outer areas of Potter Cove big icebergs are a major disturbance factor (Klöser et al., 1996) and iceberg incidence inside the cove has increased in recent years (Deregibus et al., 2017). Contrary, ice disturbance in the inner cove is produced by flow of ice blocks through the glacier front line (Falk et al., 2016), which may diminish in the future as the glacier front retreats further onto land. Ice scouring was signaled as a driver of increased macroalgal patchiness in shallower shelf areas (Clarke et al., 2007; Clark et al., 2015) and the coexistence of early and late successional stages (Quartino et al., 2005; Barnes, 2017). Results of ongoing experiments in Potter Cove will provide detailed information about ice disturbance influence on macroalgae (Deregibus et al., 2017) and as soon as transferred into a spatial data set, they can be included in the model.
Arguably, the productivity estimates presented here are limited to present day data availability. To get more reliable productivity measurements, it would be very important to take year-round data of the main biomass builders into account, as many Antarctic macroalgae show highly seasonal growth starting in late winter/spring (Wiencke and Clayton, 2002). However, late winter to early spring data on algal physiology and light climate are extremely rare and difficult to obtain for polar coasts. For the future we recommend to conduct an appropriate spatial habitat monitoring program for representative areas which could serve to improve productivity estimates. For improved biomass estimations, we need models for single macroalgal species, since decreasing productivity can also result from replacement of kelp by more robust but smaller macroalgae species. Furthermore, a monitoring programme should include biological feedback in terms of zoobenthos succession on newly ice-free hard substrates as shown by Lagger et al. (2017) and Campana et al. (2018).
Conclusions
There is an urgent need to quantify and model geographic shifts of species and community distribution ranges in times of global change (Sahade et al., 2015; Singer et al., 2016; Urban et al., 2016). Quality assessed extrapolation of single measurements in coastal areas and coastal structures such as glacial coves highlights the ecologically relevance of local analyses and supports regional and global budgeting of carbon cycling. Correlative models can spatially simulate effects of climate change and allow for reproduction of the results. Species distribution models provide a statistical validation of the results and ranking of the model-relevant environmental variables for cause-effect assessments. Statistical models are robust and applicable to many groups of species; however, they do not yet consider ecosystem functions and feedback loops such as species interactions. The combination of robust statistical correlative models with mechanism-orientated modeling is a promising approach for future biomass approximations in coastal Antarctic fjord systems under climate change with the next generation of species distribution models (Urban et al., 2016). It remains however unclear whether the projections resulting from such models are more reliable (Singer et al., 2016). Here, we provide the first step for spatial-temporal ecosystem modeling of macroalgae in the Antarctic Peninsula region. An exceptional long-term and high-density database, rarely available in polar coastal environments, was used for model construction. The approach can be expanded to associated questions, such as the distribution of macroalgal-associated fauna, or to improve regional macroalgal distribution estimates for systems similarly influenced by glacial erosion. Factors to be considered would include sea ice coverage, hard substrate, and SPM data in the areas of interest. Significant reductions of macroalgal productivity as we are predicting for Potter Cove is an assumption that can be tested in the upcoming decades. As more data layers for ice scour and grazers become available, the model can be refined.
Statements
Author contributions
KJ, DA, and KZ contributed conception and design of the study. KJ, FS, and HP organized the database and ran the statistical analysis and the R codes. MQ and FS analyzed video transects recorded in 2011–2012. KJ wrote the first draft of the manuscript. DA, KZ, HP, UF, DD, GC, and MQ wrote sections of the manuscript. All authors contributed to manuscript revision, read and approved the submitted version.
Funding
The research was supported by Grants JE 680/1-1 and ZA 753/1-1 of the priority programme SPP 1158 Antarctic Research with Comparative Investigations in Arctic Ice Areas of the German Research Foundation (DFG). The present manuscript also presents an outcome of the EU research network IMCONet funded by the Marie Curie Action IRSES, within the Seventh Framework Programme (FP7 IRSES, Action No. 318718).
Acknowledgments
The work was performed based on data collected at Carlini (former Jubany) Station, Dallmann Laboratory, within the framework of the scientific collaboration existing between Instituto Antártico Argentino/Dirección Nacional del Antártico and Alfred Wegener Institute, Helmholtz Centre for Polar and Marine Research. Special thanks to Patrick Monien for providing unpublished TOC data and to Irene Schloss for the scenario specification of the SPM magnitude. Many thanks to Stephan Frickenhaus for constructive comments, which improved the manuscript.
Conflict of interest
The authors declare that the research was conducted in the absence of any commercial or financial relationships that could be construed as a potential conflict of interest.
Supplementary material
The Supplementary Material for this article can be found online at: https://www.frontiersin.org/articles/10.3389/fevo.2019.00207/full#supplementary-material
The following are the supplementary data to this article: Supplementary Material supplies details about the modeling procedure, the input data processing and the model validation. The table in Supplementary Table 1 provides precise information about the input data.
References
1
Airoldi L. (2003). The effects of sedimentation on rocky coast assemblages, in Oceanography and Marine Biology: An Annual Review, eds GibsonR. N.AtkinsonR. J. A. (London, UK: Taylor & Francis), 161–236.
2
Allouche O. Tsoar A. Kadmon R. (2006). Assessing the accuracy of species distribution models: prevalence, kappa and the true skill statistic (TSS). J. Appl. Ecol.43, 1223–1232. 10.1111/j.1365-2664.2006.01214.x
3
Androsov A. Fofonova V. Kuznetsov I. Danilov S. Rakowsky N. Harig S. et al . (2019). FESOM-C v.2: coastal dynamics on hybrid unstructured meshes. Geosci. Model Dev.12, 1009–1028. 10.5194/gmd-12-1009-2019
4
Barbet-Massin M. Jiguet F. Albert C. H. Thuiller W. (2012). Selecting pseudo-absences for species distribution models: how, where and how many?Methods Ecol. Evol.3, 327–338. 10.1111/j.2041-210X.2011.00172.x
5
Barnes D. K. (2017). Polar zoobenthos blue carbon storage increases with sea ice losses, because across-shelf growth gains from longer algal blooms outweigh ice scour mortality in the shallows. Glob. Change Biol.23, 5083–5091. 10.1111/gcb.13772
6
Barnes D. K. Clarke A. (2011). Antarctic marine biology. Curr. Biol.21:R451-7.
7
Barnes D. K. A. Peck L. S. (2008). Vulnerability of Antarctic shelf biodiversity to predicted regional warming. Clim. Res.37, 149–163. 10.3354/cr00760
8
Bartsch I. Paar M. Fredriksen S. Schwanitz M. Daniel C. Hop H. et al . (2016). Changes in kelp forest biomass and depth distribution in Kongsfjorden, Svalbard, between 1996–1998 and 2012–2014 reflect Arctic warming. Polar Biol.39, 2021–2036. 10.1007/s00300-015-1870-1
9
Boavida-Portugal J. Rosa R. Calado R. Pinto M. Boavida-Portugal I. Araújo M. B. et al . (2018). Climate change impacts on the distribution of coastal lobsters. Mar. Biol.165:186. 10.1016/j.cub.2011.04.012
10
Brouwer P. E. Geilen E. Gremmen N. J. Lent F. V. (1995). Biomass, cover and zonation pattern of sublittoral macroalgae at Signy Island, South Orkney Islands, Antarctica. Botanica Marina38, 259–270. 10.1515/botm.1995.38.1-6.259
11
Campana G. L. Zacher K. Deregibus D. Momo F. R. Wiencke C. Quartino M. L. (2018). Succession of Antarctic benthic algae (Potter Cove, South Shetland Islands): structural patterns and glacial impact over a four-year period. Polar Biol.41, 377–396. 10.1007/s00300-017-2197-x
12
Campana G. L. Zacher K. Fricke A. Molis M. Wulff A. Liliana Quartino M. et al . (2009). Drivers of colonization and succession in polar benthic macro- and microalgal communities. Botanica Marina52, 655–667. 10.1515/BOT.2009.076
13
Clark G. F. Raymond B. Riddle M. J. Stark J. S. Johnston E. L. (2015). Vulnerability of Antarctic shallow invertebrate-dominated ecosystems. Austral Ecol.40, 482–491. 10.1111/aec.12237
14
Clark G. F. Stark J. S. Johnston E. L. Runcie J. W. Goldsworthy P. M. Raymond B. et al . (2013). Light-driven tipping points in polar ecosystems. Glob. Chang. Biol.19, 3749–3761. 10.1111/gcb.12337
15
Clark G. F. Stark J. S. Palmer A. S. Riddle M. J. Johnston E. L. (2017). The roles of sea-ice, light and sedimentation in structuring shallow Antarctic benthic communities. PLoS ONE12:e0168391. 10.1371/journal.pone.0168391
16
Clarke A. Murphy E. J. Meredith M. P. King J. C. Peck L. S. Barnes D. K. et al . (2007). Climate change and the marine ecosystem of the western Antarctic Peninsula. Philos. Trans. R. Soc. B Biol. Sci.362, 149–166. 10.1098/rstb.2006.1958
17
Constable A. J. Melbourne-Thomas J. Corney S. P. Arrigo K. R. Barbraud C. Barnes D. K. et al . (2014). Climate change and Southern Ocean ecosystems I: how changes in physical habitats directly affect marine biota. Glob. Change Biol.20, 3004–3025. 10.1111/gcb.12623
18
Cook A. J. Holland P. R. Meredith M. P. Murray T. Luckman A. Vaughan D. G. (2016). Ocean forcing of glacier retreat in the western Antarctic Peninsula. Science353, 283–286. 10.1126/science.aae0017
19
DeConto R. M. Pollard D. (2016). Contribution of Antarctica to past and future sea-level rise. Nature531, 591–597. 10.1038/nature17145
20
DeLaca T. Lipps J. H. (1976). Shallow-water marine associations, Antarctic Peninsula. Antarct. J. U.S.11, 12–20.
21
Deregibus D. Quartino M. L. Campana G. L. Momo F. R. Wiencke C. Zacher K. (2016). Photosynthetic light requirements and vertical distribution of macroalgae in newly ice-free areas in Potter Cove, South Shetland Islands, Antarctica. Polar Biol.39, 153–166. 10.1007/s00300-015-1679-y
22
Deregibus D. Quartino M. L. Zacher K. Campana G. L. Barnes D. K. A. (2017). Understanding the link between sea ice, ice scour and Antarctic benthic biodiversity–the need for cross-station and international collaboration. Polar Rec.53, 143–152. 10.1017/S0032247416000875
23
DigitalGlobe . (2014). WorldView-2 scene 103001001F612100, Image Courtesy of / Copyright © DigitalGlobe - Longmont, Colorado. All rights reserved, Catalog ID: 103001001F612100. Sensor: WV02, Band Info: Pan_MS1_MS2, Resolution 0.5*0.5m (accessed November 3, 2013).
24
Dormann C. McPherson J. M. Araújo M. Bivand R. Bolliger J. Carl G. et al . (2007). Methods to account for spatial autocorrelation in the analysis of species distributional data: a review. Ecography30, 609–628. 10.1111/j.2007.0906-7590.05171.x
25
Dormann C. F. Elith J. Bacher S. Buchmann C. Carl G. Carré G. et al . (2013). Collinearity: a review of methods to deal with it and a simulation study evaluating their performance. Ecography36, 27–46. 10.1111/j.1600-0587.2012.07348.x
26
Dormann C. F. Schymanski S. J. Cabral J. Chuine I. Graham C. Hartig F. et al . (2012). Correlation and process in species distribution models: bridging a dichotomy. J. Biogeogr.39, 2119–2131. 10.1111/j.1365-2699.2011.02659.x
27
Duarte C. M. Losada I. J. Hendriks I. E. Mazarrasa I. Marbà N. (2013). The role of coastal plant communities for climate change mitigation and adaptation. Nat. Clim. Change3, 961–968. 10.1038/nclimate1970
28
Elith J. Graham C. H. (2009). Do they? How do they? WHY do they differ? On finding reasons for differing performances of species distribution models. Ecography32, 66–77. 10.1111/j.1600-0587.2008.05505.x
29
Elith J. Leathwick J. R. (2009). Species distribution models: ecological explanation and prediction across space and time. Annu. Rev. Ecol. Evol. System.40, 677–697. 10.1146/annurev.ecolsys.110308.120159
30
Falk U. Gieseke H. Kotzur F. Braun M. (2016). Monitoring snow and ice surfaces on King George Island, Antarctic Peninsula, with high-resolution TerraSAR-X time series. Antarctic Sci.28, 135–149. 10.1017/S0954102015000577
31
Falk U. López D. A. Silva-Busso A. (2018). Multi-year analysis of distributed glacier mass balance modelling and equilibrium line altitude on King George Island, Antarctic Peninsula. Cryosphere12, 1211–1232. 10.5194/tc-12-1211-2018
32
Finlay S. (2011). Multiple classifier architectures and their application to credit risk assessment. Eur. J. Oper. Res.210, 368–378. 10.1016/j.ejor.2010.09.029
33
Fischer G. Wiencke C. (1992). Stable carbon isotope composition, depth distribution and fate of macroalgae from the Antarctic Peninsula region. Polar Biol.12, 341–348. 10.1007/BF00243105
34
Gómez Izquierdo D. R. Quartino M. L. Fernández-Ajo A. Abele D. (2009). Photographs of Potter Cove, King George Island, Looking Northeast Towards Glacier in 2009. Buenos Aires: PANGAEA. 10.1594/PANGAEA.773378
35
Gomez I. Weykam G. Klöser H. Wiencke C. (1997). Photosynthetic light requirements, metabolic carbon balance and zonation of sublittoral macroalgae from King George Island (Antarctica). Marine Ecol. Prog. Ser. 148, 281–293. 10.3354/meps148281
36
Gömez I. Wiencke C. (1997). Seasonal growth and photosynthetic performance of the Antarctic macroalga Desmarestia menziesii (Phaeophyceae) cultivated under fluctuating Antarctic daylengths. Botanica Acta110, 25–31. 10.1111/j.1438-8677.1997.tb00607.x
37
Guisan A. Thuiller W. (2005). Predicting species distribution: offering more than simple habitat models. Ecol. Lett.8, 993–1009. 10.1111/j.1461-0248.2005.00792.x
38
Hanelt D. Wiencke C. Bischof K. (2003). Photosynthesis in marine macroalgae, in Photosynthesis in Algae, eds LarkumA. W.DouglasS.RavenJ. A. (Dordrecht: Kluwer Academic Publisher), 413–435.
39
Hass H. C. Wölfl A. C. Kuhn G. Jerosch K. Scharf F. Abele D. (2016). Hydroacoustic habitat mapping in Potter Cove (King George Island, Antarctica). Geophys. Res. Abstracts18:4463.
40
Hijmans R. J. (2012). Cross-validation of species distribution models: removing spatial sorting bias and calibration with a null model. Ecology93, 679–688. 10.1890/11-0826.1
41
Hoegh-Guldberg O. Bruno J. F. (2010). The impact of climate change on the world's marine ecosystems. Science328, 1523–1528. 10.1126/science.1189930
42
Hurd C. L. Harrison P. J. Bischof K. Lobban C. S. (2014). Seaweed Ecology and Physiology.Cambridge, UK: Cambridge University Press, 551.
43
Iken K. Quartino M. Barrera-Oro E. Palermo J. Wiencke C. Brey T. (1998). Trophic relations between macroalgae and herbivores. Rep. Polar Marine Res.299, 258–262.
44
Jenness J. (2013). DEM Surface Tools for ArcGIS (surface_area. exe). Version 21375. Flagstaff, AZ: Jenness Enterprises. Available online at: http://www.jennessent.com/arcgis/surface_area.htm (accessed March 14, 2013).
45
Jerosch K. Pehlke H. Monien P. Scharf F. Weber L. Kuhn G. et al . (2018). Benthic meltwater fjord habitats formed by rapid glacier recession on King George Island, Antarctica. Philos. Trans. A Math. Phys. Eng. Sci.376:20170178. 10.1098/rsta.2017.0178
46
Jerosch K. Scharf F. K. (2015). High Resolution Bathymetric Compilation for Potter Cove, WAP, Antarctica, With Links to Data in ArcGIS Format.Bremerhaven: PANGAEA. 10.1594/PANGAEA.853593
47
Jerosch K. Scharf F. K. Deregibus D. Campana G. L. Zacher K. Pehlke H. et al . (2015). Ensemble Prediction Distribution Maps of Macroalgae for Current Conditions and Four Climate Change Scenarios and High Resolution Bathymetry for Potter Cove, WAP, and Antarctica.Bremerhaven: PANGAEA. 10.1594/PANGAEA.854410
48
Jiménez-Valverde A. (2012). Insights into the area under the receiver operating characteristic curve (AUC) as a discrimination measure in species distribution modelling. Glob. Ecol. Biogeogr.21, 498–507. 10.1111/j.1466-8238.2011.00683.x
49
Kim H. Ducklow H. W. Abele D. Barlett E. M. R. Buma A. G. Meredith M. P. et al . (2018). Inter-decadal variability of phytoplankton biomass along the coastal West Antarctic Peninsula. Philos. Trans. R. Soc. A376:20170174. 10.1098/rsta.2017.0174
50
Kim M.-J. Min S.-H. Han I. (2006). An evolutionary approach to the combination of multiple classifiers to predict a stock price index. Expert Syst. Appl.31, 241–247. 10.1016/j.eswa.2005.09.020
51
Klöser H. Quartino M. L. Wiencke C. (1996). Distribution of macroalgae and macroalgal communities in gradients of physical conditions in Potter Cove, King George Island, Antarctica. Hydrobiologia333, 1–17. 10.1007/BF00020959
52
Lagger C. Nime M. Torre L. Servetto N. Tatián M. Sahade R. (2017). Climate change, glacier retreat and a new ice-free island offer new insights on Antarctic benthic responses. Ecography41, 579–591. 10.1111/ecog.03018
53
Lawson C. R. Hodgson J. A. Wilson R. J. Richards S. A. Freckleton R. (2014). Prevalence, thresholds and the performance of presence-absence models. Methods Ecol. Evol.5, 54–64. 10.1111/2041-210X.12123
54
Lessmann S. Baesens B. Seow H.-V. Thomas L. C. (2015). Benchmarking state-of-the-art classification algorithms for credit scoring: an update of research. Eur. J. Oper. Res.247, 124–136. 10.1016/j.ejor.2015.05.030
55
Lim C. H. Lettmann K. Wolff J.-O. (2013). Numerical study on wave dynamics and wave-induced bed erosion characteristics in Potter Cove, Antarctica. Ocean Dyn.63, 1151–1174. 10.1007/s10236-013-0651-z
56
Liu C. White M. Newell G. (2009). Measuring the accuracy of species distribution models: a review, in Proceedings of 18th World IMACs/MODSIM Congress Cairns (Citeseer).
57
Lobo J. M. Jiménez-Valverde A. Real R. (2008). AUC: a misleading measure of the performance of predictive distribution models. Glob. Ecol. Biogeogr.17, 145–151. 10.1111/j.1466-8238.2007.00358.x
58
Lundblad E. R. Wright D. J. Miller J. Larkin E. M. Rinehart R. Naar D. F. et al . (2006). A benthic terrain classification scheme for American Samoa. Marine Geod.29, 89–111. 10.1080/01490410600738021
59
Merow C. Smith M. J. Edwards T. C. Guisan A. McMahon S. M. Normand S. et al . (2014). What do we gain from simplicity versus complexity in species distribution models?Ecography37, 1267–1281. 10.1111/ecog.00845
60
Miller J. A. (2014). Virtual species distribution models: using simulated data to evaluate aspects of model performance. Prog. Phys. Geogr.38, 117–128. 10.1177/0309133314521448
61
Monien D. Monien P. Brünjes R. Widmer T. Kappenberg A. Silva Busso A. A. et al . (2017). Meltwater as a source of potentially bioavailable iron to Antarctica waters. Antarct. Sci.29, 277–291. 10.1017/S095410201600064X
62
Monien P. Lettmann K. A. Monien D. Asendorf S. Wölfl A.-C. Lim C. H. et al . (2014). Redox conditions and trace metal cycling in coastal sediments from the maritime Antarctic. Geochim. Cosmochim. Acta141, 26–44. 10.1016/j.gca.2014.06.003
63
Monien P. Schnetger B. Brumsack H.-J. Hass H. C. Kuhn G. (2011). A geochemical record of late Holocene palaeoenvironmental changes at King George Island (maritime Antarctica). Antarct. Sci.23, 255–267. 10.1017/S095410201100006X
64
Muscarella R. Galante P. J. Soley-Guardia M. Boria R. A. Kass J. M. Uriarte M. et al . (2014). ENMeval: an R package for conducting spatially independent evaluations and estimating optimal model complexity forMaxentecological niche models. Methods Ecol. Evol.5, 1198–1205. 10.1111/2041-210X.12261
65
Oliva M. Navarro F. Hrbácek F. Hernández A. Nývlt D. Pereira P. et al . (2017). Recent regional climate cooling on the Antarctic Peninsula and associated impacts on the cryosphere. Sci. Total Environ.580, 210–223. 10.1016/j.scitotenv.2016.12.030
66
Osmanoglu B. Navarro F. J. Hock R. Braun M. Corcuera M. I. (2014). Surface velocity and mass balance of Livingston Island ice cap, Antarctica. Cryosphere8, 1807–1823. 10.5194/tc-8-1807-2014
67
Paleologo G. Elisseeff A. Antonini G. (2010). Subagging for credit scoring models. Eur. J. Oper. Res.201, 490–499. 10.1016/j.ejor.2009.03.008
68
Pearce J. Ferrier S. (2000). Evaluating the predictive performance of habitat models developed using logistic regression. Ecol. Model.133, 225–245. 10.1016/S0304-3800(00)00322-7
69
Pineda E. Lobo J. M. (2009). Assessing the accuracy of species distribution models to predict amphibian species richness patterns. J. Anim. Ecol.78, 182–190. 10.1111/j.1365-2656.2008.01471.x
70
Quartino M. L. Boraso de Zaixso A. L. (2008). Summer macroalgal biomass in Potter Cove, South Shetland Islands, Antarctica: its production and flux to the ecosystem. Polar Biol.31, 281–294. 10.1007/s00300-007-0356-1
71
Quartino M. L. Deregibus D. Campana G. L. Latorre G. E. Momo F. R. (2013). Evidence of macroalgal colonization on newly ice-free areas following glacial retreat in Potter Cove (South Shetland Islands), Antarctica. PLoS ONE8:e58223. 10.1371/journal.pone.0058223
72
Quartino M. L. Zaixso H. E. Boraso de Zaixso A. L. (2005). Biological and environmental characterization of marine macroalgal assemblages in Potter Cove, South Shetland Islands, Antarctica. Botanica Marina48, 187–197. 10.1515/BOT.2005.029
73
RCoreTeam (2014). R: A Language and Environment for Statistical Computing. Vienna: R Foundation for Statistical Computing. 2013. Available online at: http://www.R-project.org/.
74
Reichardt W. Dieckmann G. (1985). Kinetics and trophic role of bacterial degradation of macro-algae in Antarctic coastal waters, in Antarctic Nutrient Cycles and Food Webs, eds SiegfriedW. R.CondyP. R.LawsR. M. (Berlin; Heidelberg: Springer).
75
Roberts D. R. Bahn V. Ciuti S. Boyce M. S. Elith J. Guillera-Arroita G. et al . (2017). Cross-validation strategies for data with temporal, spatial, hierarchical, or phylogenetic structure. Ecography40, 913–929. 10.1111/ecog.02881
76
Rückamp M. Braun M. Suckro S. Blindow N. (2011). Observed glacial changes on the King George Island ice cap, Antarctica, in the last decade. Glob. Planetary Change79, 99–109. 10.1016/j.gloplacha.2011.06.009
77
Sahade R. Lagger C. Torre L. Momo F. Monien P. Schloss I. et al . (2015). Climate change and glacier retreat drive shifts in an Antarctic benthic ecosystem. Sci. Adv.1:e1500050. 10.1126/sciadv.1500050
78
Schloss I. R. Abele D. Moreau S. Demers S. Bers A. V. González O. et al . (2012). Response of phytoplankton dynamics to 19-year (1991–2009) climate trends in Potter Cove (Antarctica). J. Marine Syst.92, 53–66. 10.1016/j.jmarsys.2011.10.006
79
Singer A. Johst K. Banitz T. Fowler M. S. Groeneveld J. Gutiérrez A. G. et al . (2016). Community dynamics under environmental change: How can next generation mechanistic models improve projections of species distributions?Ecol. Model.326, 63–74. 10.1016/j.ecolmodel.2015.11.007
80
Smale D. A. Brown K. M. Barnes D. K. Fraser K. P. Clarke A. (2008). Ice scour disturbance in Antarctic waters. Science321, 371–371. 10.1126/science.1158647
81
Sorte C. J. B. Williams S. L. Carlton J. T. (2010). Marine range shifts and species introductions: comparative spread rates and community impacts. Glob. Ecol. Biogeogr.19, 303–316. 10.1111/j.1466-8238.2009.00519.x
82
Thuiller W. Georges D. Engler R. (2014). Biomod2: Ensemble Platform for Species Distribution Modeling. R package version 3. 1–64. Available online at: http://CRANR-projectorg/package=biomod2 (accessed December 10, 2014).
83
Thuiller W. Lafourcade B. Araújo M. B. (2010). Presentation Manual for BIOMOD. Grenoble: Laboratoire d'écologie Alpine, University Joseph Fourier.
84
Tsai C.-F. Hsiao Y.-C. (2010). Combining multiple feature selection methods for stock prediction: union, intersection, and multi-intersection approaches. Decis. Support Syst.50, 258–269. 10.1016/j.dss.2010.08.028
85
Turner J. Lu H. White I. King J. C. Phillips T. Hosking J. S. et al . (2016). Absence of 21st century warming on Antarctic Peninsula consistent with natural variability. Nature535:411. 10.1038/nature18645
86
UKHO (2012). Multibeam Data Set 20120114 - Potter Cove, Cell Size 5*5 m From the United Kingdom Hydrographic Office. Contains Public Sector Information, Licensed Under the Open Government Licence v2.0. Crown Copyright, UKHO.
87
Urban M. C. Bocedi G. Hendry A. P. Mihoub J. B. Pe'er G. Singer A. et al . (2016). Improving the forecast for biodiversity under climate change. Science353:aad8466. 10.1126/science.aad8466
88
van Proosdij A. S. J. Sosef M. S. M. Wieringa J. J. Raes N. (2016). Minimum required number of specimen records to develop accurate species distribution models. Ecography39, 542–552. 10.1111/ecog.01509
89
Vorsino A. E. Fortini L. B. Amidon F. A. Miller S. E. Jacobi J. D. Price J. P. et al . (2014). Modeling Hawaiian ecosystem degradation due to invasive plants under current and future climates. PLoS ONE9:e95427. 10.1371/journal.pone.0095427
90
Wiencke C. (1990a). Seasonality of brown macroalgae from Antarctica—a long-term culture study under fluctuating Antarctic daylengths. Polar Biol.10, 589–600. 10.1007/BF00239370
91
Wiencke C. (1990b). Seasonality of red and green macroalgae from Antarctica—a long-term culture study under fluctuating Antarctic daylengths. Polar Biol.10, 601–607. 10.1007/BF00239371
92
Wiencke C. Amsler C. D. Clayton M. N. (2014). Macroalgae, in Biogeographic Atlas of the Southern Ocean, eds BroyerC.KoubbiP.GriffithsH. J.RaymondB.d' Udekem d'AcozC.Van de PutteA. P.DanisB.DavidB.GrantS.GuttJ.HeldC.HosieG.HuettmannF.PostA.Ropert-CoudertY. (Cambridge, UK: Scientific Committee on Antarctic Research), 66–73.
93
Wiencke C. Clayton M. N. (2002). Antarctic seaweeds, in Synopses of the Antarctic Benthos, Book 9, ed WägeleJ. W. (Ruggell: ARG Gantner Verlag KG).
94
Wilson M. F. O'Connell B. Brown C. Guinan J. C. Grehan A. J. (2007). Multiscale terrain analysis of multibeam bathymetry data for habitat mapping on the continental slope. Marine Geod.30, 3–35. 10.1080/01490410701295962
95
Wölfl A.-C. Lim C. H. Hass H. C. Lindhorst S. Tosonotto G. Lettmann K. A. et al . (2014). Distribution and characteristics of marine habitats in a subpolar bay based on hydroacoustics and bed shear stress estimates—Potter Cove, King George Island, Antarctica. Geo Marine Lett.34, 435–446. 10.1007/s00367-014-0375-1
96
Wölfl A.-C. Wittenberg N. Feldens P. Hass H. C. Betzler C. Kuhn G. (2016). Submarine landforms related to glacier retreat in a shallow Antarctic fjord. Antarct. Sci.28, 475–486. 10.1017/S0954102016000262
97
Zacher K. Bernard M. Bartsch I. Wiencke C. (2016). Survival of early life history stages of Arctic kelps (Kongsfjorden, Svalbard) under multifactorial global change scenarios. Polar Biol.39, 2009–2020. 10.1007/s00300-016-1906-1
98
Zacher K. Roleda M. Y. Wulff A. Hanelt D. Wiencke C. (2009). Responses of Antarctic Iridaea cordata (Rhodophyta) tetraspores exposed to ultraviolet radiation. Phycol. Res.57, 186–193. 10.1111/j.1440-1835.2009.00538.x
Summary
Keywords
seaweed distribution modeling, bioclimatic ecosystem change, distribution shift, macroalgae summer production, South Shetland Islands, Antarctica
Citation
Jerosch K, Scharf FK, Deregibus D, Campana GL, Zacher K, Pehlke H, Falk U, Hass HC, Quartino ML and Abele D (2019) Ensemble Modeling of Antarctic Macroalgal Habitats Exposed to Glacial Melt in a Polar Fjord. Front. Ecol. Evol. 7:207. doi: 10.3389/fevo.2019.00207
Received
26 June 2018
Accepted
20 May 2019
Published
13 June 2019
Volume
7 - 2019
Edited by
Bruno Danis, Free University of Brussels, Belgium
Reviewed by
Charlene Guillaumot, Free University of Brussels, Belgium; Charles Amsler, College of Arts and Sciences, University of Alabama at Birmingham, United States
Updates
Copyright
© 2019 Jerosch, Scharf, Deregibus, Campana, Zacher, Pehlke, Falk, Hass, Quartino and Abele.
This is an open-access article distributed under the terms of the Creative Commons Attribution License (CC BY). The use, distribution or reproduction in other forums is permitted, provided the original author(s) and the copyright owner(s) are credited and that the original publication in this journal is cited, in accordance with accepted academic practice. No use, distribution or reproduction is permitted which does not comply with these terms.
*Correspondence: Kerstin Jerosch kerstin.jerosch@awi.de
This article was submitted to Biogeography and Macroecology, a section of the journal Frontiers in Ecology and Evolution
Disclaimer
All claims expressed in this article are solely those of the authors and do not necessarily represent those of their affiliated organizations, or those of the publisher, the editors and the reviewers. Any product that may be evaluated in this article or claim that may be made by its manufacturer is not guaranteed or endorsed by the publisher.