 Pandeng Wang1
 Yongjian Chen2
 Yingtao Sun3Sha Tan1Siyuan Zhang1
 Zhiheng Wang4
 Jizhong Zhou5,6,7Gan Zhang3
 Wensheng Shu1,8
 Chunling Luo3,9*
 Jialiang Kuang1,5*
- 1State Key Laboratory of Biocontrol, Guangdong Key Laboratory of Plant Resources, College of Ecology and Evolution, Sun Yat-sen University, Guangzhou, China
- 2Department of Soil Water and Environmental Science, University of Arizona, Tucson, AZ, United States
- 3Guangzhou Institute of Geochemistry, Chinese Academy of Sciences, Guangzhou, China
- 4Key Laboratory for Earth Surface Processes of the Ministry of Education, Institute of Ecology, College of Urban and Environmental Sciences, Peking University, Beijing, China
- 5Department of Microbiology and Plant Biology, Institute for Environmental Genomics, University of Oklahoma, Norman, OK, United States
- 6Earth and Environmental Sciences, Lawrence Berkeley National Laboratory, Berkeley, CA, United States
- 7State Key Joint Laboratory of Environment Simulation and Pollution Control, School of Environment, Tsinghua University, Beijing, China
- 8School of Life Sciences, South China Normal University, Guangzhou, China
- 9College of Natural Resources and Environment, South China Agricultural University, Guangzhou, China
Plant pathogens are increasingly considered as important agents in promoting plant coexistence, while plant symbionts like ectomycorrhizal fungi (EMF) can facilitate plant dominance by helping conspecific individuals to defend against plant pathogens. However, we know little about their relationships with plants at large scales. Here, using soil fungal data collected from 28 forest reserves across China, we explored the latitudinal diversity gradients of overall fungi and different fungal functional guilds, including putative plant pathogens, EMF, and saprotrophic fungi. We further linked the spatial patterns of alpha diversities of putative plant pathogens and EMF to the variation of plant species richness. We found that the relationships between latitude and alpha diversities of putative plant pathogens and EMF were region-dependent with sharp diversity shifts around the mid-latitude (~35°N), which differed from the unimodal diversity distributions of the overall and saprotrophic fungi. The variations in the diversities of putative plant pathogens and EMF were largely explained by the spatial regions (south vs. north/subtropical zone vs. temperate zone). Additionally, the alpha diversities of these two fungal guilds exhibited opposing trends across latitude. EMF could alter the relationship between diversities of putative plant pathogens and plants in the south/subtropical region, but not vice versa. We also found that the ratio of their alpha diversities (EMF to putative plant pathogens) was negatively related to plant species richness across the spatial regions (north to south), and explained ~10% of the variation of plant species richness. Overall, our findings suggest that plant-microbe interactions not only shape the local plant diversity but also may have non-negligible contributions to the large-scale patterns of plant diversity in forest ecosystems.
Introduction
The increase in species richness from polar to equatorial regions is well known for plant communities (Kier et al., 2005; Kreft and Jetz, 2007; Qian and Ricklefs, 2008; Wang et al., 2012). This latitudinal gradient of biodiversity has attracted a great interest from ecologists (Willig et al., 2003), which is one of the most general patterns for different types of organisms on the earth (Helmut, 2004). Although recent studies have reported clear diversity distribution patterns (e.g., unimodal and negative linear) of different fungal functional guilds like ectomycorrhizal fungi (EMF) and arbuscular mycorrhizal fungi (AMF) across latitude (Tedersoo et al., 2012; Davison et al., 2015), how the diversity of plant pathogens changes along the latitude remains underreported (but see Tedersoo et al., 2014), leaving a significant gap in our knowledge. Furthermore, accumulating empirical evidences have supported that plant pathogens play an important role in promoting plant species coexistence through negative plant-soil feedback at local scales (Bradley et al., 2008; Van der Heijden et al., 2008; Bever et al., 2012, 2015). Thus, exploring the spatial distribution of plant pathogens and their associations with plants at large scales is essential to obtaining a deeper understanding of potential mechanisms underlying large-scale plant diversity patterns (Bever et al., 2015).
The Janzen-Connell hypothesis (Janzen, 1970; Connell, 1971) has been widely recognized as one of the central forces organizing plant communities. It assumes that the recruitment of host-specific natural enemies, such as plant fungal pathogens, can help to maintain plant diversity in forest ecosystems (Mangan et al., 2010; Comita et al., 2014; Liu et al., 2015; LaManna et al., 2016, 2017). However, to what extent the diversity of fungal pathogens relates to plant diversity is still underreported. According to the basic assumption of the Janzen-Connell hypothesis, most of the plant enemies are host specific, expectedly resulting in consistent latitudinal gradients of diversities between plants and their fungal pathogens (Peay et al., 2016). In other words, higher plant diversity should lead to a higher diversity of fungal pathogens (Rottstock et al., 2014). Meanwhile, plant pathogens also interact with other fungal guilds, such as EMF who can help plants to defend against pathogens (Sikes et al., 2009; Laliberté et al., 2015) by reducing infection sites (Azcón-Aguilar and Barea, 1997) or releasing antibiotic compounds (Marx, 1972). Additionally, recent experimental studies found that local plant diversity can be influenced by varied plant responses to soil fungi (from negative to positive plant-soil feedbacks) through different types of mycorrhizal association (Bennett et al., 2017) and different strategies of nutrient acquisition (Teste et al., 2017). Thus, a comprehensive study linking the spatial distributions of different fungal functional guilds (e.g., EMF and plant pathogens) to plant diversity across latitude is urgently needed.
Furthermore, most plant-soil feedback investigations have focused on the changes in plant performances using potting experiments with the application of fungicide or inoculation of several fungal isolates (e.g., pathogens and EMF) (Pernilla Brinkman et al., 2010), which may, to some extent, overlook the relationships between different fungal functional guilds in natural conditions. Recently, sequencing-based profiling of fungal communities has successfully captured the structures of different fungal functional groups and trophic guilds (Öpik et al., 2009; Peay et al., 2012; Taylor et al., 2014; Tedersoo et al., 2014; Davison et al., 2015; Liang et al., 2016; Nguyen et al., 2016b; Hannula et al., 2017; Leff et al., 2017), making it possible to explore the large-scale diversity patterns of different fungal functional guilds and to further identify whether the shift of their association (i.e., EMF vs. plant pathogens) is related to the plant diversity in forest ecosystems.
Here, based on the molecular techniques and a well-defined fungal guilds database (Nguyen et al., 2016a), we profiled the soil fungal communities of 431 soil samples that were collected from 28 forest reserves along a large latitudinal range across China. We aimed to answer two questions: (1) How do the diversities of different fungal guilds change across latitude and whether the diversity of plant pathogens has the same negative relationship with latitude as plants? (2) How are the diversities of EMF and plant pathogens related to plant species richness at large scales (i.e., across China)?
Materials and Methods
Soil Sampling
In total, 28 mountain forest reserves located across a broad range of latitudes (21° ~ 53°N) and longitudes (100° ~ 129°E) in China were surveyed in 2012 (Figure 1 and Table S1). These forest reserves are characterized by a wide range of climate zones (from subtropical to temperate region), vegetation types (from evergreen broad-leaf forest to coniferous forest), mean annual temperature (from −6°C to 22°C), and mean annually precipitation (from 100 to 2,214 mm) (see detailed information in Table S1). In each forest reserve, 2–15 sampling locations were randomly chosen along the same aspect of the mountain. In each sampling location, 3 top layer soils (10 cm depth) located ~5 m apart from each other were collected after the removal of vegetation litter. Soils were stored in sterilized polyethylene bags and kept on ice immediately in the field and then transported to the laboratory. A few soil samples were discarded, because their bags were broken during transportation. Finally, we obtained a total of 472 soil samples from the 28 forest reserves. Each sample was separated into two subsamples: one for subsequent chemical analyses and the other stored at −20°C for molecular experiment.
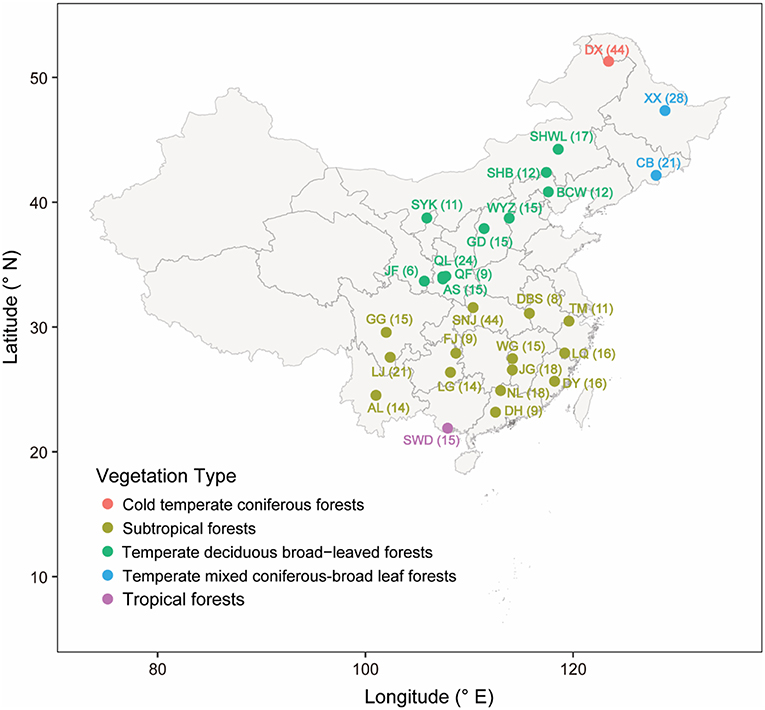
Figure 1. Map of sampling sites, points indicate the positions of forest reserves. The point colors indicate different vegetation types. The name and sample number of each forest reserve were labeled beside the point.
Spatial and Environmental Variables, and Plant Species Richness
In this study, the latitude, longitude, and elevation of each sample were recorded by a portable GPS machine. Environmental variables included 11 soil physiochemical properties and four climate conditions. Soil pH and electrical conductivity (EC) were measured by specific electrodes (Sartorius PB-10, Göttingen, Germany) based on the soil suspension (1:2.5 of soil to deionized water). Total organic carbon (TOC) was measured by a Shimadzu TOC Analyzer (TOC-Vcsh; Shimadzu, Kyoto, Japan). The SmartChem Discrete Auto Analyzer (SmartChem®200; WESTCO Scientific Instruments Inc.) was used to measure total nitrogen (TN) and total P. Available Ca, Mg, Al, P, K were extracted using Mehlich-III solution and measured by Inductively Coupled Plasma Optical Emission Spectrometry (ICP-OES, Optima 2100DV; Perkin-Elmer, Massachusetts, USA). Total K was also measured by ICP-OES after sample digestion.
Climate conditions for 2012, including mean annual temperature (MAT), mean annual precipitation (MAP), mean annual humidity (MAH), and mean annual evapotranspiration (MAE), were downloaded from public datasets generated by weather stations in China (http://data.cma.cn/site/index.html). These mean annual values were derived from 194 weather stations across China to represent the regional climate conditions. We predicted the climate conditions for our sampling locations through these datasets using Kriging (Gräler et al., 2016). Notably, instead of using actual records of climate conditions at the sampling dates, we aimed to use these annual measures to explore how the regional climate conditions, which were more associated with latitude, affect the distributions of overall fungi and different fungal guilds.
We obtained plant species richness from Wang et al. (2010). In brief, the plant species richness of each forest reserve was determined based on its spatial location and the woody plant distribution map (spatial resolution: 50 × 50 km), which was created by Fang et al. (2011). In this database, they compiled the plant species distributions in China from all floras published before 2008, including Flora of China, Higher Plants of China, Flora Reipublicae Popularis Sinicae, more than 120 volumes of provincial floras, and many local floras across China. Moreover, 21 senior botanists from different regions of China were invited to check and supplement the plant species distributions in each region to improve the accuracy of this database. This distribution map matched the survey-based map within 95% confidence (Wang et al., 2012).
DNA Extraction and Sequencing
For each soil sample, DNA was extracted from 0.5 g fresh soil using the MoBio PowerSoil DNA extraction kit (Carlsbad, CA) following the manufacturer's instructions. All DNA samples were stored at −20°C before polymerase chain reaction (PCR) amplification. To determine the fungal community composition, we amplified the second nuclear ribosomal internal transcribed spacer (ITS2) region of the rRNA operon by using a primer set ITS3 (5′- GCATCGATGAAGAACGCAGC-3′) and ITS4 (5′- TCCTCCGCTTATTGATATGC-3′). To permit multiplexing of samples, a 12-bp barcode unique to each sample was linked to the primer ITS3's 5′ end. The PCR reaction system included 25 μL 2 × premix (TaKaRa), 1 μL forward and reversed primers (10 mM), 30 ng DNA, and double-distilled water which was added to make the total volume 50 μL. We also included a negative control (no added DNA in reaction system) for each batch. PCR conditions were as follows: preheat 30 s at 98°C, then 35 cycles of 98°C for 10 s, annealing at 52°C for 25 s and extension at 72°C for 30 s, with a final extension at 72°C for 8 min. PCR products from different samples were pooled together in equimolar concentrations and purified by E.Z.N.A.® Gel Extraction Kit (Omega BioTek, Doraville, USA). The pooled PCR products were sequenced on a 2 × 300 paired-end MiSeq NextGen platform (Illumina; San Diego, CA, USA).
Sequence Processing and Fungal Functional Guilds Identification
After removing the low-quality bases (Phred quality scores <20) from the 3′ end of raw reads, we used FLASH (version 1.2.11) (Magoc and Salzberg, 2011) to merge the pair-end reads. Then, we demultiplexed merged sequences to samples based on their unique barcodes by using MOTHUR (version 1.36.1) (Schloss et al., 2009). During this process, barcodes and primers were trimmed, and short and low-quality sequences were filtered, with parameters: minlength = 300, maxhomop = 12, qwindowsize = 50, qwindowaverage = 20, maxambig = 0, pdiffs = 2, bdiffs = 1. We clustered high-quality sequences into OTUs (Operational Taxonomic Unit) at the 97% similarity threshold and removed chimeras by using USEARCH (version 8.0) (Edgar, 2013). After removing singletons, we assigned a taxonomic name to each OTU by using the Ribosomal Database Project (RDP) classifier (Wang et al., 2007) with a confidence threshold of 0.8 against UNITE database (version 7.2) (Kõljalg et al., 2013). We removed OTUs that were classified as “unknown,” “Plantae,” and “Protista.” Before subsequent analyses, we rarefied each sample to equal sequencing depth (900 sequences) to reduce the influence of unequal sequencing depth on diversity comparison.
We used FUNGuild (Nguyen et al., 2016a) to classified OTUs into different functional guilds based on their taxonomic names. A total of 2,893 OTUs (25% of all OTUs, accounting for 66% of the total number of sequences) were annotated into a single or multiple functional guilds. To avoid the annotation uncertainty, we removed the OTUs with annotation confidence rank of “possible.” We obtained 193 OTUs that were only assigned to plant pathogen. In case of ignoring some identified plant pathogens, we inspected the OTUs that were also assigned to other guilds besides plant pathogen by literature searching based on their taxonomic affinities. By doing this, we finally obtained 205 plant pathogen OTUs (Table S2). We performed the same procedure for EMF and obtained 420 EMF OTUs (Table S3). As for saprotrophic fungi, which is the most dominant functional group in forests (Nguyen et al., 2016b), 1,128 OTUs were assigned to the single trophic mode of “Saprotroph” (Table S4). Because our soil samples did not come from plant roots, only 14 AMF OTUs, accounting for 0.1% of the total sequences, were found in our dataset. Thus, AMF were not considered in the subsequent analyses.
Statistical Analyses
In this study, some of the forest reserves (i.e., CB, DX, SHWL, SNJ, and TM) span a large range of different latitudes/longitudes. To capture more detailed spatial variations of fungal communities, soil samples from these forest reserves were divided into 2~3 groups based on their locations. Meanwhile, a total of 41 samples, which were located far away (>37 km) from other neighboring sites, were discarded to ensure the representativeness in assessing the fungal diversity for the area. In total, 33 reserves/groups (431 samples) were included for subsequent analyses (see detailed information in Table S1, we will refer to “reserve/group” as “reserve” in the rest of this paper). We examined the changes of community compositions of overall fungi and different fungal guilds (i.e., plant pathogens, EMF, and saprotrophic fungi) across latitude by calculating the relative abundances (number of sequences belonging to one phylum or genus/total sequence number of the same sample) at phylum level and genus level, respectively (Figure S1). NMDS (non-metric multidimensional scaling) based on Jaccard distance was also performed to display the latitudinal variations of the community compositions of overall fungi and different fungal functional guilds. To explore the detailed spatial pattern of each genus of plant pathogens and EMF, we calculated their occurrence frequencies at sample or forest level by counting the samples or forest reserves they occurred in. Their latitude distribution ranges were calculated based on the minimum and maximum latitudes of the samples or forests they occurred in.
We calculated alpha diversities of overall fungi and different guilds as the mean OTU numbers of all soil samples within a given reserve. We plotted the alpha diversities against latitude to visualize their relationships and fitted linear or quadratic regression lines to these relationships based on AIC values. By doing this, we found that the alpha diversities of plant pathogens and EMF had a sharp shift around 35°N, which is also the boundary between subtropical and temperate climate zones, and their changes along latitude were region-dependent. Thus, we split the forest reserves into two spatial regions (detailed information in Table S1): north region (subtropical forests) and south region (temperate forests) and fitted the regression line for each region. To evaluate whether these patterns were robust to potential errors or misclassifications in the identification of fungal functional guilds, we subsampled the OTUs of each fungal guild using different thresholds (from 0.5 to 0.9 with step 0.1; the percentage of OTUs we kept) and redid the analyses. Theoretically, subsampling the OTUs of each fungal guild would reduce or remove the potential errors in the identification of different fungal guilds with the cost of losing some correct identifications. We could observe the same patterns (Figure S2), even when we only used half of the original data. This indicates that our results are robust to potential errors in the identification of fungal functional guilds. To estimate the independent relative contributions of spatial region, soil properties, and climate conditions to the variation of alpha diversity, we performed hierarchical variation partition by using package “hier.part” (Walsh et al., 2013). We subjected variables of soil properties and climate conditions to principal components analysis (PCA) and selected the first three PCs (account for more than 60% variation) and first two PCs (account for more than 90% variation) to represent soil properties and climate conditions, respectively. The total explained variation of alpha diversity was determined by multiple regression model. We further conducted the Pearson correlation to identify the relationships between different environmental factors and the alpha diversities of different fungal functional guilds (Table S5). Because the sampling dates were not related with the diversities of overall fungi (Pearson: r = −0.004, P = 0.98), plant pathogens (Pearson: r = 0.086, P = 0.63), EMF (Pearson: r = −0.016, P = 0.93), and saprotrophic fungi (Pearson: r = 0.083, P = 0.64), we did not include sampling dates into our model.
In this study, we aimed to link the spatial diversity patterns of EMF and plant pathogens to the variation of plant species richness across latitude. Since a similar region-dependent pattern was observed for plant species richness (Figure S3), we related plant species richness to the diversities of plant pathogens and EMF by calculating Pearson correlations for the north and south regions separately. To examine whether the diversity of EMF (plant pathogens) could alter the relationship between plant species richness and the diversity of plant pathogens (EMF), we first removed the effect of EMF (plant pathogens) on plant pathogens (EMF) by extracting the residuals of their linear regression and then recalculated the correlation between plant species richness and the residuals of diversity of plant pathogens (EMF). In addition, we identified the genus-level correlations between EMF and plant pathogens based on their relative abundances in each sample (Table S6). To explore whether the shift of association (alpha diversity ratio) between EMF and plant pathogens is related to the changes of plant species richness across latitude, we plotted EMF-to-pathogen ratio against plant species richness and fitted regression lines for each region and overall forests. Then, we used hierarchical variation partition to disentangle the independent relative contributions of EMF-to-pathogen ratio, spatial region, and climate conditions to the variation of plant species richness. The total contribution was determined by multiple regression model. All statistical analyses were performed in R version 3.3.2 (R Core Team., 2016).
Results
After quality control and assembly, we obtained a total of 1,806,829 high-quality sequences with an average of 4,192 ± 2,373 (mean ± SD) sequences per sample, which were clustered into 1,1295 OTUs at the 97% similarity level. The number of OTUs detected in each sample ranged from 101 to 317, with an average of 206 according to the rarefied OTU table. Based on the taxonomic affiliations of OTUs, we identified 205 plant pathogens (Table S2), 420 EMF (Table S3), and 1,128 saprotrophic fungi (Table S4) in our dataset.
Community Compositions and Distribution Ranges
Generally, NMDS ordinations of community compositions of overall fungal communities, as well as different fungal functional guilds showed that their community structures varied along the latitudinal gradient (Figure 2). More specifically, the overall fungal communities were dominated by phylum Ascomycota (relative abundance: 31.6–85.3%, Figure S1a) across all forest reserves. Fusarium, which could be detected in all the forests and appeared in 383 of the 431 samples (Figures 3A,B), was the most dominant fungal genus among all the identified plant pathogens in this study (Figure S1b). In our dataset, we identified three species (Fusarium solani; Fusarium langsethiae; Fusarium oxysporum) with affinity to Fusarium (Table S2). Among all plant pathogens, about half of them (104/205) were endemic and only detected in less than 7 of 28 forests (Table S2). For EMF, the most widespread genus was Inocybe, which was found in all forests and appeared in 332 of the 431 samples (Figures 3C,D) and had a higher relative abundance in higher latitudes (Figure S1c). Other EMF genera, like Russula and Cortinarius, were more abundant in lower latitudes (Figure S1c). As for saprotrophic fungi, Penicillium was frequently detected in lower latitudes, and Pseudogymnoascus had higher relative abundance in higher latitudes (Figure S1d).
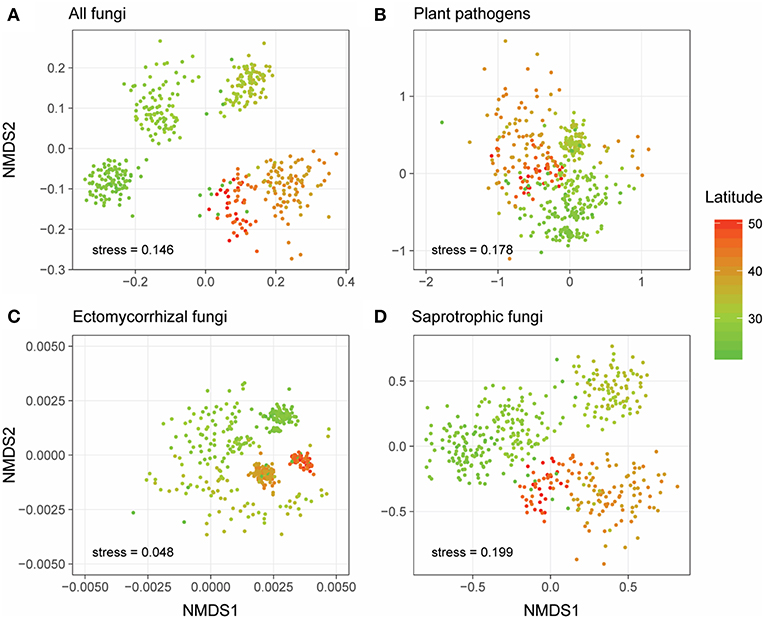
Figure 2. Non-metric multidimensional scaling (NMDS) ordinations of the community compositions (OTU level) of all fungi (A), plant pathogens (B), ectomycorrhizal fungi (EMF) (C), and saprotrophic fungi (D) based on Jaccard distance. Sample points were colored based on their latitude locations.
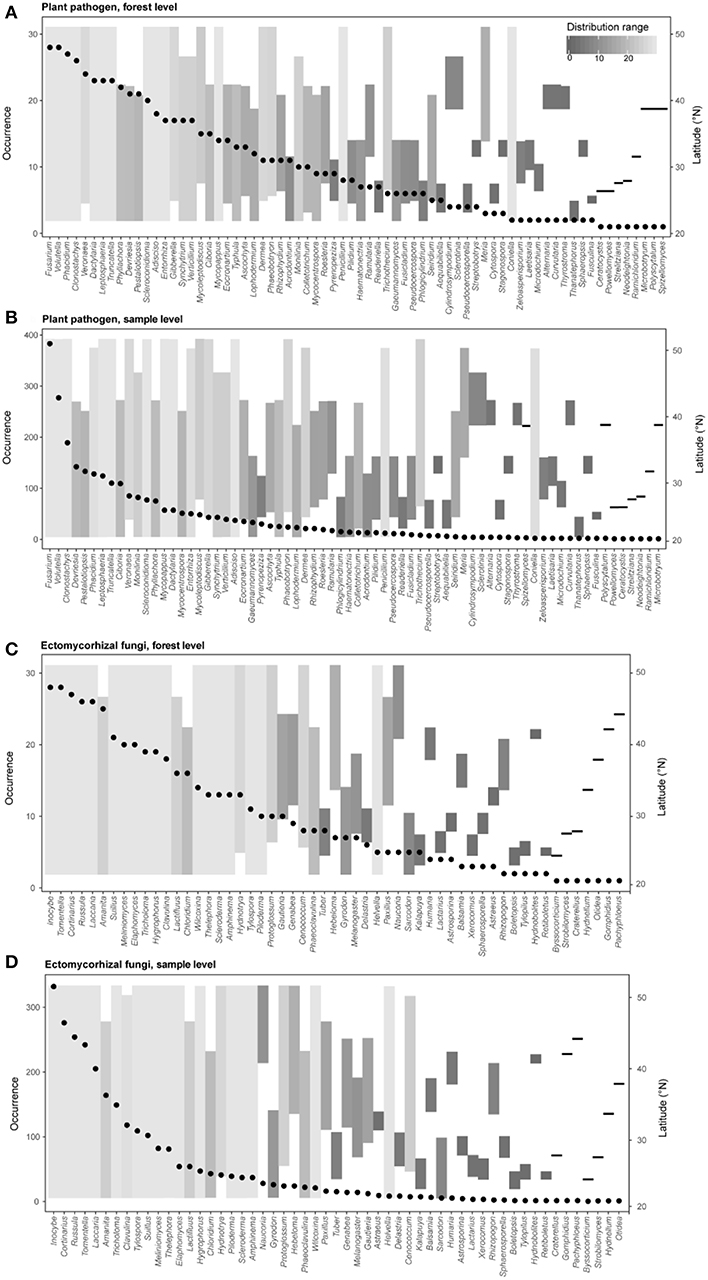
Figure 3. Occurrence frequencies and latitude distribution ranges of different genera of plant pathogens (A, forest level; B, sample level) and ectomycorrhizal fungi (C, forest level; D, sample level) in this study. Points represent occurrence number of a given genus (left y-axis) across different forest reserves or all samples. Bar plots show the detected latitude range (right y-axis) and the distribution range (colors) of each fungal genus.
We further explored the occurrence frequencies and distribution ranges of different identified fungal genera for plant pathogens and EMF and found that only several genera of pathogens (e.g., Fusarium, Volutella, Clonostachys, and Phacidium) and EMF (e.g., Inocybe, Cortinarius, Russula, Tomentella and Laccaria) were widespread (i.e., high occurrence and large distribution range) (Figure 3). Our results also revealed that some pathogens in genera (e.g., Penicillium, Trichothecium, and Coniella) and EMF in genera (e.g., Cenococcum and Helvella) were hardly detected but had wide latitude ranges, suggesting that the occurrence frequencies and distribution ranges are decoupled (Figure 3). Furthermore, most of the genera (plant pathogens: 62 of 70; EMF: 52 of 59) could be detected in the subtropical region (lower than ~35°N) (Figure 1), with a few of them (e.g., Sclerotinia and Humaria) only observed at higher latitudes (Figure 3).
Latitudinal Diversity Gradients and Variation Partitioning
Unlike the linear latitudinal diversity pattern of plants, the alpha diversities (OTU richness) of overall fungi and saprotrophic fungi were significantly and unimodally related to latitude (overall fungi: = 0.17, P < 0.01; saprotrophic fungi: = 0.11, P < 0.01) and peaked at around 35°N (Figures 4A,D), which is the boundary between subtropical and temperate zones (Figure 1). However, the relationships between latitude and diversities of plant pathogens and EMF were obviously region-dependent (Figures 4B,C). In the south region, the alpha diversities of plant pathogens and EMF showed significantly positive ( = 0.47, P < 0.01) and negative correlations ( = 0.46, P < 0.01) with latitude, respectively. However, we did not observe significant trends in the north region. These latitudinal diversity gradients of overall fungi, as well as different fungal guilds, were consistent with higher sequencing depth (Figure S4).
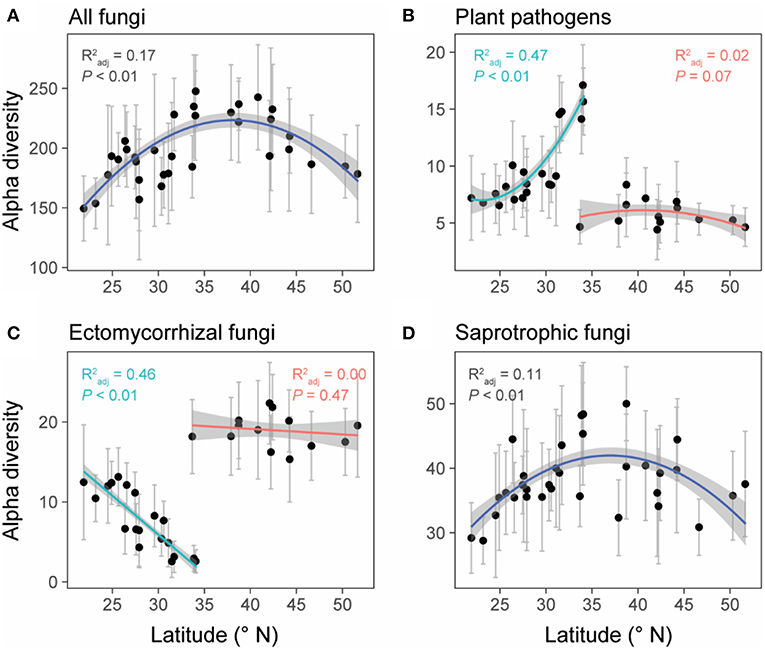
Figure 4. The relationships between latitude and the alpha diversities (OTU level) of all fungi (A), plant pathogens (B), ectomycorrhizal fungi (EMF) (C), and saprotrophic fungi (D). Data points represent the mean (±SD) alpha diversity of each forest reserve. Linear or polynomial (degree = 2) regression lines were selected to fit the data points based on AIC values. Forest reserves were grouped into two spatial regions (north and south) based on the diversity patterns of plant pathogens and EMF (detailed information showed in methods and Table S1). We fitted regression lines to these two regions separately for plant pathogens and EMF. Gray shadows represent 95% confidence interval.
The six representative variables (i.e., soil: the first three PCs; climate: the first two PCs; region: north and south) collectively explained 25, 51, 66, and 17% of the variances in alpha diversities of overall fungi, plant pathogens, EMF, and saprotrophic fungi, respectively. Soil PC1 was the main driver for the alpha diversities of overall fungi (relative 61.0% and pure 15.3% = 61.0% × 25% explanation) and saprotrophic fungi (relative 46.8%; pure 7.96%) (Figures 5A,D). Specifically, available Ca and Mg were the major factors (Table S5). Meanwhile, spatial region explained the most variations of alpha diversities of plant pathogens (relative 49.8%; pure 25.4%) and EMF (relative 65.2%; pure 43.0%) (Figures 5B,C). Besides the effect of region, the soil PC1 and climate PC1 were the most important environmental factors influencing the alpha diversities of plant pathogens and EMF, respectively (Figures 5B,C).
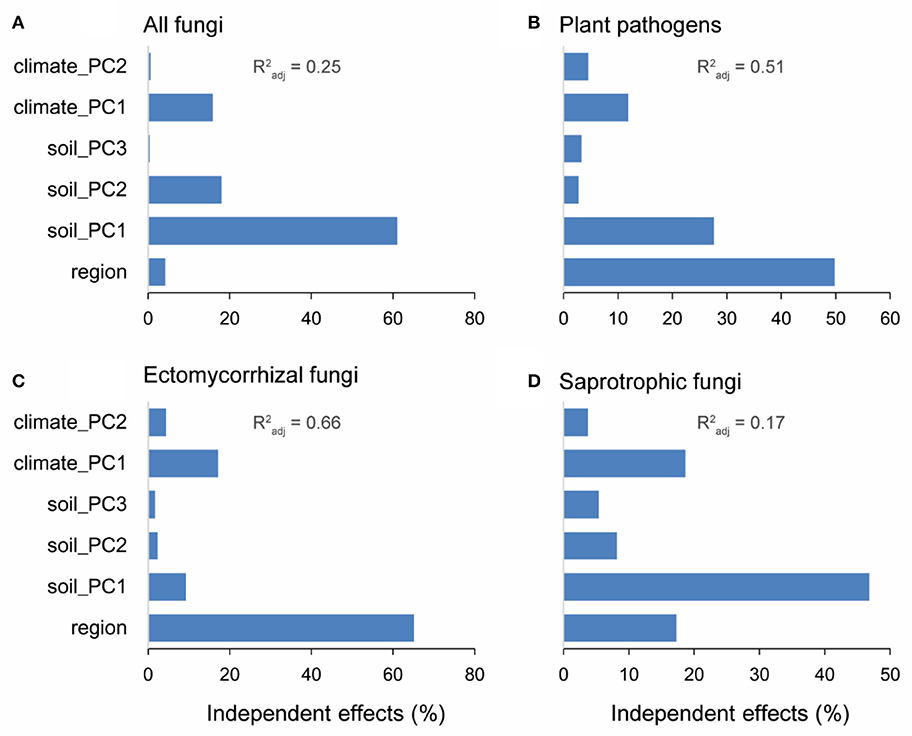
Figure 5. Results of hierarchical variation partitioning of the alpha diversities (OTU level) for all fungi (A), plant pathogens (B), ectomycorrhizal fungi (EMF) (C), and saprotrophic fungi (D). Forest reserves were grouped into two spatial regions (south and north) based on the diversity patterns of plant pathogens and EMF. Variables of soil properties and climate conditions were subjected to principal components analysis (PCA). The first three PCs (account for more than 60% variation) and first two PCs (account for more than 90% variation) were selected to represent soil properties and climate conditions, respectively. shows the proportion of explained variation of alpha diversity by multiple regression with these six variables.
Relationships Between Plants, EMF, and Plant Pathogens
Expectedly, the relationship between latitude and plant species richness was negative across China, while it was also region-dependent with a steeper slope in the south region (Figure S3). The results of Pearson correlations showed significant (P < 0.01) but contrary relationships between plant species richness and the diversities of plant pathogens and EMF in the south region, with positive relationship for EMF (Pearson r = 0.298, P < 0.01) and negative relationship for plant pathogens (Pearson r = −0.227, P < 0.01) (Table 1). However, the negative relationship between plant species richness and pathogens' OTU richness was conditional and varied. It became non-significant (Pearson r = −0.090, P = 0.128) for species richness after removing the effect of EMF on plant pathogens, but not vice versa (Table 1). In the north region, we did not find any significant relationships between plant species richness and the alpha diversities of EMF and plant pathogens (Table 1). We subsequently assessed the associations between EMF and plant pathogens based on the relative abundances of different genera in each sample and found that most of the genera pairs (1892/1932) were negatively related (Table S6). Furthermore, we found that the EMF-to-pathogen diversity ratio was significantly and negatively associated with plant species richness across the spatial regions (Pearson: r = −0.658, P < 0.01), although this relationship did not keep when we examined it in each region (Figure 6A). Variation partitioning also showed that the independent contribution of EMF-to-pathogen ratio (relative 12.5%; pure 10.0 %) to the variation of plant species richness was comparable with the contributions of mean annual precipitation (relative 13.1%; pure 10.5%) and mean annual humidity (relative 13.4%; pure 10.7%) (Figure 6B).
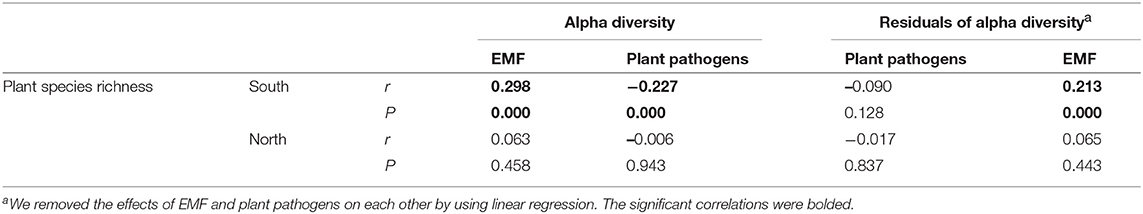
Table 1. Pearson correlations between plant species richness and the alpha diversities of plant pathogens and ectomycorrhizal fungi (EMF).
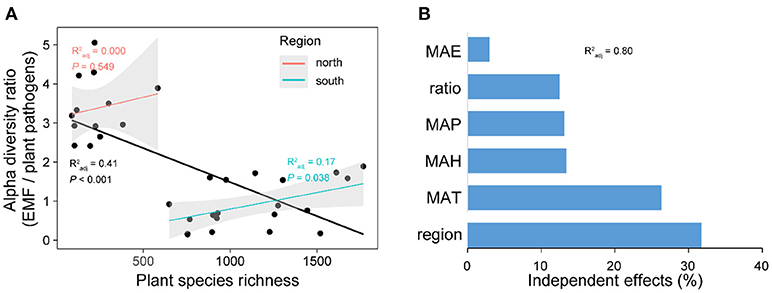
Figure 6. The relationship between plant species richness and the alpha diversity (OTU richness) ratio between ectomycorrhizal fungi (EMF) and plant pathogens (A). The independent contributions of spatial region, climate conditions, and EMF-to-pathogen ratio to the variation of plant species richness across latitude (B). In (A), forest reserves were grouped into two spatial regions (north and south) based on the diversity patterns of plant pathogens and EMF. Linear regression lines were fitted to the all data points (black line) and data points of each region. Gray shadows represent 95% confidence interval. MAP, mean annual precipitation; MAT, mean annual temperature; MAH, mean annual humidity; MAE, mean annual evapotranspiration. in (B) shows the proportion of explained variation of plant species richness by multiple regression with the six variables.
Discussion
Here, we report a first attempt to explore the large-scale biogeographic pattern of plant pathogens in forest ecosystems of China and conduct a comparison of diversity patterns between different fungal functional guilds by using sequencing-based profiling and taxonomy-based functional identification. Our results reveal an obvious community turnover of overall fungi and different fungal guilds across latitude (Figure 2), and exhibit the occurrence frequencies and distribution ranges of different fungal genera for plant pathogens and EMF (Figure 3). With large-scale molecular-based surveys, we are now able to capture the biogeography of fungi and different fungal guilds (Öpik et al., 2009; Tedersoo et al., 2014; Davison et al., 2015; Nguyen et al., 2016b; Pärtel et al., 2017), which can help generate hypotheses and guide future studies. For example, our results showed that even though the occurrence frequencies were distinct between the widespread plant pathogens, such as Volutella ciliata (brown root rot; Ebben and Williams, 1956), Phacidium lacerum (fruit rot; Wiseman et al., 2016), Fusarium solani (sudden death syndrome; Nelson and Toussoun, 1989), and hardly detected species like Coniella fragariae (Foliage blight; Griffiths et al., 2004), their distribution ranges were all large (Figure 3 and Table S2). In addition, we also detected some psychrophilic species that have been reported by previous studies, such as Sclerotinia borealis (Hoshino et al., 2010) and Humaria hemisphaerica (Lang et al., 2011) (Figure 3 and Table S2). Interestingly, their latitude distribution ranges (restricted in high latitudes) in our study supported the fact that they had psychrophilic characters. Therefore, our molecular-based results may provide important clues for the testing of host-specificity and evolutionary adaptation of fungi species in future studies.
Previous studies have observed a negative relationship between species richness and latitude for different types of organisms (Helmut, 2004), including vascular plants (Kier et al., 2005), amphibians (Buckley and Jetz, 2007), mammals (Ceballos and Ehrlich, 2006), endophytic fungi (Arnold, 2007), and marine bacteria (Pommier et al., 2007). However, we found that the alpha diversity of overall fungi was unimodally related to latitude with peaking richness around the mid-latitude (~35°N) in China, at the boundary between subtropical and temperate zones (Figure 1). Ma et al. (2017) also reported a similar biogeographic pattern of soil fungi in their recent study across eastern China. However, Tedersoo et al. (2014) found a different trend of fungal diversity at the global scale, revealing a monotonic increase in overall fungal richness toward the equator. These contrasting fungal diversity patterns are possibly caused by different surveyed latitude ranges (China vs. globe). After we further inspected the global diversity pattern of soil fungi showed by Tedersoo et al. (2014), we also found a unimodal trend with fungal diversity peaking around 40°N and declining around 25°N (Figure S5), which was also supported by the recent study (Bahram et al., 2018). Given the fact that the region around 35°N in China had experienced more climate fluctuations during the last 20 ka BP (kiloyear Before Present) (Shen et al., 2012), it's believed that the higher fungi diversity in this region (Figure 4A) is the result of their accumulative adaptive evolution in response to these vagaries of climate conditions. Besides, as a transition area between subtropical and temperate biomes (Figure 1), species richness is expected to be higher in this ecotone than the flanking community (Senft, 2009). Among all the environmental factors we collected, soil properties explained the most variation of the overall fungal diversity (Figure 5A) and calcium was the most important soil property that positively related to fungi diversity (Table S5), which was also found by Tedersoo et al. (2014). One possible explanation is that calcium could accumulate during the decay of wood debris (Smith et al., 2007) and higher fungi diversity could result in a higher decay rate (Van der Wal et al., 2013).
Unexpectedly, the relationship between latitude and the alpha diversity of plant pathogens was region-dependent, from positive in the south region to non-significant in the north region. Notably, the alpha diversity of EMF also exhibited a region-dependent relationship with latitude, from negative in the south region to non-significant in the north region, contrasting with the unimodal relationship showed by Tedersoo et al. (2012). Such region-dependent patterns might be largely due to the distinct climate zones formed by the special geography of China, which naturally divided China into humid subtropical and temperate arid regions by the Qinling Mountains (Mattauer et al., 1985; Shen et al., 2012). Variation partitioning also supported that spatial region was the main driver of the variations in diversities of plant pathogens and EMF (Figure 5). In line with a previous study (Tedersoo and Nara, 2010), we found that EMF diversity was higher in the temperate zone than subtropical zone. Tedersoo and Nara (2010) proposed three potential mechanisms (historical-biogeographic factors, habitat diversity, and resource availability-fragmentation) to explain this pattern. As for the alpha diversity of plant pathogens, contrasting with our expectation, we didn't find a positive relationship between diversities of plants and plant pathogens (Table 1). One possible explanation is that their association could be altered by EMF (Table 1), owing to the biotic interaction between plant pathogens and EMF (Duchesne et al., 1988; Perrin, 1990), which is partly supported by the opposing trends of their diversities along latitude (Figures 4B,C). It should be noted that the opposing diversity trends of plant pathogens and EMF are also possibly caused by the different ectomycorrhizal plant (EcM plant) richness and proportions in different forests. Although we do not have the data on EcM plant richness and proportions in the 28 surveyed forests, previous studies (Tedersoo and Nara, 2010; Brundrett and Tedersoo, 2018) have reported that temperate forests often have more EcM plants than tropical forests. Higher EcM plant proportion could result in higher EMF diversity by providing more habitats (host plants), which might reduce physical space for plant pathogens. Although there is no direct experimental evidence, a similar idea has been proposed that the presence of a given saprophytic fungus species or group of species might exclude the colonization of new saprophytic fungi species on the same substrate (Rayner and Todd, 1980; Boddy, 2000).
Based on the survey data of forest plants, Johnson et al. (2012) found that conspecific negative density dependence (CNDD) is a general mechanism driving plant diversity in forest ecosystems. While in this study, we tried to understand the diversity distribution of plants from a different angle by associating diversities of plants and different fungal guilds across latitude. Recent studies have reported the distinct effects of plant pathogens and symbionts on plant diversity. On the one hand, the accumulation of host-specific fungal pathogens promotes plant coexistence by causing CNDD (Bagchi et al., 2010, 2014; Mangan et al., 2010; Comita et al., 2014; Bever et al., 2015). On the other hand, plant symbionts like EMF facilitate conspecific recruitment by helping conspecifics to defend against plant pathogens and to acquire limiting nutrients from the soil, which will promote plant dominance and reduce diversity (Bever et al., 2012; Laliberté et al., 2015; Bennett et al., 2017). These ideas are partly supported by our results with the facts that the higher EMF-to-pathogen diversity ratio is related to lower plant species richness, while the lower ratio is related to higher plant species richness across the spatial regions (Figure 6A). Although the EMF-to-pathogen diversity ratio had no significant relationship with plant species richness in each region, when we viewed this relationship at a larger scale, it was significantly negative with a sharp shift in EMF-to-pathogen ratio between the two spatial regions (north and south). This sharp shift might be caused by the special geography of China as mentioned before. Furthermore, the independent contribution of the EMF-to-pathogen diversity ratio to the variation of plant species richness was comparable with the contributions of climate conditions, such as mean annual precipitation and mean annual humidity (Figure 6B). The fact that temperate forests have more EcM plants (Tedersoo and Nara, 2010; Brundrett and Tedersoo, 2018) but fewer plant species than subtropical/tropical forests further supported our inference. To our knowledge, this is the first study reporting the large-scale relationships between diversities of plants and different fungal guilds in natural forest ecosystems. Furthermore, this study suggests that the plant-microbe interactions not only shape the local plant diversity but also may provide non-negligible contributions to the large-scale patterns of plant diversity besides that of the water-energy dynamics (Kreft and Jetz, 2007) and regional effects (Ricklefs and He, 2016).
Conclusions
In summary, we reported the large-scale biogeographic patterns of the overall fungal communities and different fungal functional guilds, and subsequently linked their diversity distributions to the large-scale plant diversity pattern. Our results reveal clear region-dependent latitudinal diversity patterns of plant pathogens and EMF and suggest that their potential biotic interaction may contribute to the variation of plant species richness across different types of forest ecosystems. Through sequencing-based technology and taxonomy-based functional assignment, we are now able to characterize the changes of fungal communities at large scales, which will be beneficial in detecting the structural dynamics of different soil fungal functional guilds (Öpik et al., 2009; Tedersoo et al., 2014; Davison et al., 2015; Nguyen et al., 2016b; Pärtel et al., 2017). Notably, sequencing- and taxonomy-based identification of plant pathogens cannot ensure their pathogenicity, and comprehensive testing of the pathogenicity and host-specificity at the large scale is still a great challenge. However, these molecular technologies can provide important clues about the potential pathogenic relationships between plants and fungi with greater sampling efforts at a larger scale. Thus, in future studies, by combing direct testing through greenhouse experiments and sequencing-based investigations at the fields, we will gain a better understanding of plant-soil feedbacks (Bever et al., 2012).
Data Availability
The representative sequences of fungal OTUs, their abundances in each sample and the phylogenetic tree have been deposited in figshare (https://doi.org/10.6084/m9.figshare.5917435).
Author Contributions
GZ and CL provided the soil samples. ZW provided the plant species richness dataset. PW, YS, ST, and SZ performed the experiments. JK and YC did the bioinformatic analyses and PW did the statistical analyses. PW and JK wrote the manuscript with contributions from all authors.
Conflict of Interest Statement
The authors declare that the research was conducted in the absence of any commercial or financial relationships that could be construed as a potential conflict of interest.
Acknowledgments
We thank Colin Bates, Shaopeng Li, and Lin Jiang for their comments on this manuscript. This work was supported by National Natural Science Foundation of China (No. 31600403, 31800422, 41673111, U1501232, and 41622106), Natural Science Foundation of Guangdong Province, China (No. 2016A030312003) and the U.S. National Science Foundation MacroSystems Biology program under the contract (NSF EF-1065844). PW was supported by International Program for Ph.D. Candidates at Sun Yat-Sen University.
Supplementary Material
The Supplementary Material for this article can be found online at: https://www.frontiersin.org/articles/10.3389/fevo.2019.00216/full#supplementary-material
References
Arnold, A. E. (2007). Understanding the diversity of foliar endophytic fungi: progress, challenges, and frontiers. Fungal Biol. Rev. 21, 51–66. doi: 10.1016/j.fbr.2007.05.003
Azcón-Aguilar, C., and Barea, J. M. (1997). Arbuscular mycorrhizas and biological control of soil-borne plant pathogens–an overview of the mechanisms involved. Mycorrhiza 6, 457–464. doi: 10.1007/s005720050147
Bagchi, R., Gallery, R. E., Gripenberg, S., Gurr, S. J., Narayan, L., Addis, C. E., et al. (2014). Pathogens and insect herbivores drive rainforest plant diversity and composition. Nature 506, 85–88. doi: 10.1038/nature12911
Bagchi, R., Swinfield, T., Gallery, R. E., Lewis, O. T., Gripenberg, S., Narayan, L., et al. (2010). Testing the Janzen-Connell mechanism: pathogens cause overcompensating density dependence in a tropical tree. Ecol. Lett. 13, 1262–1269. doi: 10.1111/j.1461-0248.2010.01520.x
Bahram, M., Hildebrand, F., Forslund, S. K., Anderson, J. L., Soudzilovskaia, N. A., Bodegom, P. M., et al. (2018). Structure and function of the global topsoil microbiome. Nature 560, 233–237. doi: 10.1038/s41586-018-0386-6
Bennett, J. A., Maherali, H., Reinhart, K. O., Lekberg, Y., Hart, M. M., and Klironomos, J. (2017). Plant-soil feedbacks and mycorrhizal type influence temperate forest population dynamics. Science 355, 181–184. doi: 10.1126/science.aai8212
Bever, J. D., Mangan, S. A., and Alexander, H. M. (2015). Maintenance of plant species diversity by pathogens. Annu. Rev. Ecol. Evol. Syst. 46, 305–325. doi: 10.1146/annurev-ecolsys-112414-054306
Bever, J. D., Platt, T. G., and Morton, E. R. (2012). Microbial population and community dynamics on plant roots and their feedbacks on plant communities. Annu. Rev. Microbiol. 66, 265–283. doi: 10.1146/annurev-micro-092611-150107
Boddy, L. (2000) Interspecific combative interactions between wood-decaying basidiomycetes. FEMS Microbiol. Ecol. 31, 185–194. doi: 10.1016/S0168-6496(99)00093-8.
Bradley, D. J., Gilbert, G. S., and Martiny, J. B. H. (2008). Pathogens promote plant diversity through a compensatory response. Ecol. Lett. 11, 461–469. doi: 10.1111/j.1461-0248.2008.01162.x
Brundrett, M. C., and Tedersoo, L. (2018). Evolutionary history of mycorrhizal symbioses and global host plant diversity. New Phytol. 220, 1108–1115. doi: 10.1111/nph.14976
Buckley, L. B., and Jetz, W. (2007). Environmental and historical constraints on global patterns of amphibian richness. Proc. R. Soc. B. 274, 1167–1173. doi: 10.1098/rspb.2006.0436
Ceballos, G., and Ehrlich, P. R. (2006). Global mammal distributions, biodiversity hotspots, and conservation. Proc. Natl. Acad. Sci. U.S.A. 103, 19374–19379. doi: 10.1073/pnas.0609334103
Comita, L. S., Queenborough, S. A., Murphy, S. J., Eck, J. L., Xu, K. Y., Krishnadas, M., et al. (2014). Testing predictions of the Janzen–Connell hypothesis: a meta-analysis of experimental evidence for distance- and density-dependent seed and seedling survival. J. Ecol. 102, 845–856. doi: 10.1111/1365-2745.12232
Connell, J. H. (1971). “On the role of natural enemies in preventing competitive exclusion in some marine animals and in rain forest trees,” in Dynamics of Populations, eds P. J. den Boer and G. R. Gradwell (Wageningen: Centre for Agricultural Publications and Documentation), 298–312.
Davison, J., Moora, M., Öpik, M., Adholeya, A., Ainsaar, L., Bâ, A., et al. (2015). Global assessment of arbuscular mycorrhizal fungus diversity reveals very low endemism. Science 349, 970–973. doi: 10.1126/science.aab1161
Duchesne, L. C., Peterson, R. L., and Ellis, B. E. (1988). Interaction between the ectomycorrhizal fungus Paxillus involutus and Pinus resinosa induces resistance to Fusarium oxysporum. Can. J. Bot. 66, 558–562. doi: 10.1139/b88-080
Ebben, M. H., and Williams, P. H. (1956). Brown root rot of tomatoes. Ann. Appl. Biol. 44, 425–436. doi: 10.1111/j.1744-7348.1956.tb02137.x
Edgar, R. C. (2013). UPARSE: highly accurate OTU sequences from microbial amplicon reads. Nat. Methods 10, 996–998. doi: 10.1038/nmeth.2604
Fang, J. Y., Wang, Z. H., and Tang, Z. Y. (2011). Atlas of Woody Plants in China: Distribution and Climate. Berlin; Heidelberg: Springer Science & Business Media.
Gräler, B., Pebesma, E., and Heuvelink, G. (2016). Spatio-temporal interpolation using gstat. R. J. 8, 204–218. doi: 10.32614/RJ-2016-014
Griffiths, M., Wylie, R., Lawson, S., Pegg, G., and McDonald, J. (2004). “Known or potential threats from pests and diseases to prospective tree species for high value timber plantings in northern Australia,” in Prospects for High-Value Hardwood Timber Plantations in the'Dry'Tropics of Northern Australia. (Mareeba, QLD) 19th-21st October.
Hannula, S. E., Morriën, E., de Hollander, M., Van der Putten, W. H., van Veen, J. A., and de Boer, W. (2017). Shifts in rhizosphere fungal community during secondary succession following abandonment from agriculture. ISME J. 11, 2294–2304. doi: 10.1038/ismej.2017.90
Helmut, H. (2004). On the generality of the latitudinal diversity gradient. Am. Nat. 163, 192–211. doi: 10.1086/381004
Hoshino, T., Terami, F., Tkachenko, O. B., Tojo, M., and Matsumoto, N. (2010). Mycelial growth of the snow mold fungus, Sclerotinia borealis, improved at low water potentials: an adaption to frozen environment. Mycoscience 51, 98–103. doi: 10.1007/S10267-009-0013-3
Janzen, D. H. (1970). Herbivores and the number of tree species in tropical forests. Am. Nat. 104, 501–528. doi: 10.1086/282687
Johnson, D. J., Beaulieu, W. T., Bever, J. D., and Clay, K. (2012). Conspecific negative density dependence and forest diversity. Science 336, 904–907. doi: 10.1126/science.1220269
Kier, G., Mutke, J., Dinerstein, E., Ricketts, T. H., Küper, W., Kreft, H., et al. (2005). Global patterns of plant diversity and floristic knowledge. J. Biogeogr. 32, 1107–1116. doi: 10.1111/j.1365-2699.2005.01272.x
Kõljalg, U., Nilsson, R. H., Abarenkov, K., Tedersoo, L., Taylor, A. F. S., Bahram, M., et al. (2013). Towards a unified paradigm for sequence-based identification of fungi. Mol. Ecol. 22, 5271–5277. doi: 10.1111/mec.12481
Kreft, H., and Jetz, W. (2007). Global patterns and determinants of vascular plant diversity. Proc. Natl. Acad. Sci. U.S.A. 104, 5925–5930. doi: 10.1073/pnas.0608361104
Laliberté, E., Lambers, H., Burgess, T. I., and Wright, S. J. (2015). Phosphorus limitation, soil-borne pathogens and the coexistence of plant species in hyperdiverse forests and shrublands. N. Phytol. 206, 507–521. doi: 10.1111/nph.13203
LaManna, J. A., Mangan, S. A., Alonso, A., Bourg, N. A., Brockelman, W. Y., Bunyavejchewin, S., et al. (2017). Plant diversity increases with the strength of negative density dependence at the global scale. Science 356, 1389–1392. doi: 10.1126/science.aam5678
LaManna, J. A., Walton, M. L., Turner, B. L., and Myers, J. A. (2016). Negative density dependence is stronger in resource-rich environments and diversifies communities when stronger for common but not rare species. Ecol. Lett. 19, 657–667. doi: 10.1111/ele.12603
Lang, C., Seven, J., and Polle, A. (2011). Host preferences and differential contributions of deciduous tree species shape mycorrhizal species richness in a mixed Central European forest. Mycorrhiza 21, 297–308. doi: 10.1007/s00572-010-0338-y
Leff, J. W., Lynch, R. C., Kane, N. C., and Fierer, N. (2017). Plant domestication and the assembly of bacterial and fungal communities associated with strains of the common sunflower, Helianthus annuus. N. Phytol. 214, 412–423. doi: 10.1111/nph.14323
Liang, M. X., Liu, X. B., Gilbert, G. S., Zheng, Y., Luo, S., Huang, F. M., et al. (2016). Adult trees cause density-dependent mortality in conspecific seedlings by regulating the frequency of pathogenic soil fungi. Ecol. Lett. 19, 1448–1456. doi: 10.1111/ele.12694
Liu, Y., Fang, S. Q., Chesson, P., and He, F. L. (2015). The effect of soil-borne pathogens depends on the abundance of host tree species. Nat. Commum. 6:10017. doi: 10.1038/ncomms10017
Ma, B., Dai, Z. M., Wang, H. Z., Dsouza, M., Liu, X. M., He, Y., et al. (2017). Distinct biogeographic patterns for archaea, bacteria, and fungi along the vegetation gradient at the continental scale in Eastern China. mSystems 2:e00174–16. doi: 10.1128/mSystems.00174-16
Magoc, T., and Salzberg, S. L. (2011). FLASH: fast length adjustment of short reads to improve genome assemblies. Bioinformatics 27, 2957–2963. doi: 10.1093/bioinformatics/btr507
Mangan, S. A., Schnitzer, S. A., Herre, E. A., Mack, K. M. L., Valencia, M. C., Sanchez, E. I., et al. (2010). Negative plant-soil feedback predicts tree-species relative abundance in a tropical forest. Nature 466, 752–755. doi: 10.1038/nature09273
Marx, D. H. (1972). Ectomycorrhizae as biological deterrents to pathogenic root infections. Annu. Rev. Phytopathol. 10, 429–454. doi: 10.1146/annurev.py.10.090172.002241
Mattauer, M., Matte, P., Malavieille, J., Tapponnier, P., Maluski, H., Qin, X. Z., et al. (1985). Tectonics of the Qinling Belt: build-up and evolution of eastern Asia. Nature 317, 496–500. doi: 10.1038/317496a0
Nelson, P. E., and Toussoun, T. A. (1989). Frequency and pathogenicity of Fusarium solani recovered from soybeans with sudden death syndrome. Plant Dis. 73, 581–584. doi: 10.1094/PD-73-0581
Nguyen, N. H., Song, Z. W., Bates, S. T., Branco, S., Tedersoo, L., Menke, J., et al. (2016a). FUNGuild: an open annotation tool for parsing fungal community datasets by ecological guild. Fungal Ecol. 20, 241–248. doi: 10.1016/j.funeco.2015.06.006
Nguyen, N. H., Williams, L. J., Vincent, J. B., Stefanski, A., Cavender-Bares, J., Messier, C., et al. (2016b). Ectomycorrhizal fungal diversity and saprotrophic fungal diversity are linked to different tree community attributes in a field-based tree experiment. Mol. Ecol. 25, 4032–4046. doi: 10.1111/mec.13719
Öpik, M., Metsis, M., Daniell, T. J., Zobel, M., and Moora, M. (2009). Large-scale parallel 454 sequencing reveals host ecological group specificity of arbuscular mycorrhizal fungi in a boreonemoral forest. N. Phytol. 184, 424–437. doi: 10.1111/j.1469-8137.2009.02920.x
Pärtel, M., Öpik, M., Moora, M., Tedersoo, L., Szava-Kovats, R., Rosendahl, S., et al. (2017). Historical biome distribution and recent human disturbance shape the diversity of arbuscular mycorrhizal fungi. N. Phytol. 216, 227–238. doi: 10.1111/nph.14695
Peay, K. G., Kennedy, P. G., and Talbot, J. M. (2016). Dimensions of biodiversity in the Earth mycobiome. Nat. Rev. Micro. 14, 434–447. doi: 10.1038/nrmicro.2016.59
Peay, K. G., Schubert, M. G., Nguyen, N. H., and Bruns, T. D. (2012). Measuring ectomycorrhizal fungal dispersal: macroecological patterns driven by microscopic propagules. Mol. Ecol. 21, 4122–4136. doi: 10.1111/j.1365-294X.2012.05666.x
Pernilla Brinkman, E., Van der Putten, W. H., Bakker, E.-J., and Verhoeven, K. J. F. (2010). Plant–soil feedback: experimental approaches, statistical analyses and ecological interpretations. J. Ecol. 98, 1063–1073. doi: 10.1111/j.1365-2745.2010.01695.x
Perrin, R. (1990). Interactions between mycorrhizae and diseases caused by soil-borne fungi. Soil Use Manage. 6, 189–194. doi: 10.1111/j.1475-2743.1990.tb00834.x
Pommier, T., Canbäck, B., Riemann, L., Boström, K., Simu, K., Lundberg, P., et al. (2007). Global patterns of diversity and community structure in marine bacterioplankton. Mol. Ecol. 16, 867–880. doi: 10.1111/j.1365-294X.2006.03189.x
Qian, H., and Ricklefs, R. E. (2008). Global concordance in diversity patterns of vascular plants and terrestrial vertebrates. Ecol. Lett. 11, 547–553. doi: 10.1111/j.1461-0248.2008.01168.x
R Core Team. (2016). R: A Language and Environment for Statistical Computing. Vienna: R Foundation for Statistical Computing.
Rayner, A. D., and Todd, N. (1980). Population and community structure and dynamics of fungi in decaying wood. Adv. Bot. Res. 7, 333–420. doi: 10.1016/S0065-2296(08)60090-7
Ricklefs, R. E., and He, F. L. (2016). Region effects influence local tree species diversity. Proc. Natl. Acad. Sci. U.S.A. 113, 674–679. doi: 10.1073/pnas.1523683113
Rottstock, T., Joshi, J., Kummer, V., and Fischer, M. (2014). Higher plant diversity promotes higher diversity of fungal pathogens, while it decreases pathogen infection per plant. Ecology 95, 1907–1917. doi: 10.1890/13-2317.1
Schloss, P. D., Westcott, S. L., Ryabin, T., Hall, J. R., Hartmann, M., Hollister, E. B., et al. (2009). Introducing mothur: open-source, platform-independent, community-supported software for describing and comparing microbial communities. Appl. Environ. Microbiol. 75, 7537–7541. doi: 10.1128/AEM.01541-09
Senft, A. R. (2009). Species Diversity Patterns at Ecotones. Chapel Hill, NC: The University of North Carolina.
Shen, Z. H., Fei, S. L., Feng, J. M., Liu, Y. N., Liu, Z. L., Tang, Z. Y., et al. (2012). Geographical patterns of community-based tree species richness in Chinese mountain forests: the effects of contemporary climate and regional history. Ecography 35, 1134–1146. doi: 10.1111/j.1600-0587.2012.00049.x
Sikes, B. A., Cottenie, K., and Klironomos, J. N. (2009). Plant and fungal identity determines pathogen protection of plant roots by arbuscular mycorrhizas. J. Ecol. 97, 1274–1280. doi: 10.1111/j.1365-2745.2009.01557.x
Smith, K. T., Shortle, W. C., Jellison, J., Connolly, J., and Schilling, J. (2007). Concentrations of Ca and Mg in early stages of sapwood decay in red spruce, eastern hemlock, red maple, and paper birch. Can. J. For. Res. 37, 957–965. doi: 10.1139/X06-264
Taylor, D. L., Hollingsworth, T. N., McFarland, J. W., Lennon, N. J., Nusbaum, C., and Ruess, R. W. (2014). A first comprehensive census of fungi in soil reveals both hyperdiversity and fine-scale niche partitioning. Ecol. Monogr. 84, 3–20. doi: 10.1890/12-1693.1
Tedersoo, L., Bahram, M., Põlme, S., Kõljalg, U., Yorou, N. S., Wijesundera, R., et al. (2014). Global diversity and geography of soil fungi. Science 346:1256688. doi: 10.1126/science.1256688
Tedersoo, L., Bahram, M., Toots, M., DiÉDhiou, A. G., Henkel, T. W., KjØLler, R., et al. (2012). Towards global patterns in the diversity and community structure of ectomycorrhizal fungi. Mol. Ecol. 21, 4160–4170. doi: 10.1111/j.1365-294X.2012.05602.x
Tedersoo, L., and Nara, K. (2010). General latitudinal gradient of biodiversity is reversed in ectomycorrhizal fungi. New Phytol. 185, 351–354. doi: 10.1111/j.1469-8137.2009.03134.x
Teste, F. P., Kardol, P., Turner, B. L., Wardle, D. A., Zemunik, G., Renton, M., et al. (2017). Plant-soil feedback and the maintenance of diversity in Mediterranean-climate shrublands. Science 355, 173–176. doi: 10.1126/science.aai8291
Van der Heijden, M. G. A., Bardgett, R. D., and Van Straalen, N. M. (2008). The unseen majority: soil microbes as drivers of plant diversity and productivity in terrestrial ecosystems. Ecol. Lett. 11, 296–310. doi: 10.1111/j.1461-0248.2007.01139.x
Van der Wal, A., Geydan, T. D., Kuyper, T. W., and De Boer, W. (2013). A thready affair: linking fungal diversity and community dynamics to terrestrial decomposition processes. FEMS Microbiol. Rev. 37, 477–494. doi: 10.1111/1574-6976.12001
Wang, Q., Garrity, G. M., Tiedje, J. M., and Cole, J. R. (2007). Naive Bayesian classifier for rapid assignment of rRNA sequences into the new bacterial taxonomy. Appl. Environ. Microbiol. 73, 5261–5267. doi: 10.1128/AEM.00062-07
Wang, Z. H., Fang, J. Y., Tang, Z. Y., and Lin, X. (2010). Patterns, determinants and models of woody plant diversity in China. Proc. R. Soc. B. 278, 2122–2132. doi: 10.1098/rspb.2010.1897
Wang, Z. H., Fang, J. Y., Tang, Z. Y., and Lin, X. (2012). Relative role of contemporary environment versus history in shaping diversity patterns of China's woody plants. Ecography 35, 1124–1133. doi: 10.1111/j.1600-0587.2011.06781.x
Willig, M. R., Kaufman, D. M., and Stevens, R. D. (2003). Latitudinal gradients of biodiversity: pattern, process, scale, and synthesis. Annu. Rev. Ecol. Evol. Syst. 34, 273–309. doi: 10.1146/annurev.ecolsys.34.012103.144032
Keywords: latitudinal diversity gradient, plant pathogen, ectomycorrhizal fungi, forest ecosystems, plant-soil feedback
Citation: Wang P, Chen Y, Sun Y, Tan S, Zhang S, Wang Z, Zhou J, Zhang G, Shu W, Luo C and Kuang J (2019) Distinct Biogeography of Different Fungal Guilds and Their Associations With Plant Species Richness in Forest Ecosystems. Front. Ecol. Evol. 7:216. doi: 10.3389/fevo.2019.00216
Received: 12 March 2019; Accepted: 23 May 2019;
Published: 07 June 2019.
Edited by:
Charles K. Lee, University of Waikato, New ZealandReviewed by:
Justine Karst, University of Alberta, CanadaLeho Tedersoo, University of Tartu, Estonia
Copyright © 2019 Wang, Chen, Sun, Tan, Zhang, Wang, Zhou, Zhang, Shu, Luo and Kuang. This is an open-access article distributed under the terms of the Creative Commons Attribution License (CC BY). The use, distribution or reproduction in other forums is permitted, provided the original author(s) and the copyright owner(s) are credited and that the original publication in this journal is cited, in accordance with accepted academic practice. No use, distribution or reproduction is permitted which does not comply with these terms.
*Correspondence: Chunling Luo, Y2xsdW9AZ2lnLmFjLmNu; Jialiang Kuang, a2ppYWxpYW5nQG91LmVkdQ==