 Nickolay I. Hristov
 Dionysios Nikolaidis1,3
 Louise C. Allen
- 1Information Design Studio, Center for Design Innovation, Winston-Salem, NC, United States
- 2Department of Biological Sciences, Winston-Salem State University, Winston-Salem, NC, United States
- 3Animusing Productions, Winston-Salem, NC, United States
- 4Structure and Motion Laboratory, Royal Veterinary College, London, United Kingdom
Concerns about the state of decline of the North American monarch butterfly (Danaus plexippus) have prompted their consideration for listing under the Endangered Species Act. Data suggest a substantial decline (> 80%) in overwintering numbers for both eastern and western monarch populations. Making an accurate status assessment is difficult due to highly variable density estimates in the eastern monarch overwintering sites. We have developed a novel application of terrestrial LiDAR scanning (TLS) which creates a scene using millions of LASER-based distance measurements in the landscape. In this technology report we discuss the use of TLS and development of Subtractive Volume Estimation (SVE) methodology for estimating overwintering monarch butterfly populations. The principle proposition of the SVE method is to compare volumetric differences between two TLS surveys, a reference scan that records roosting monarch butterflies in their overwintering environment and a derivative scan, that records the same site without butterflies. Using paired long-range laser scanners, we collected data from four overwintering sites; two in California and two in central Mexico. To help estimate the number of butterflies, we developed an accurate 3D model of an individual monarch. To test the SVE method, we created digital 3D models of bare tree trunks and distal branches, based on laser scans at two sites and combined them with our monarch model to create virtual reference and derivative point clouds. To convert from volume to number of butterflies, we introduce a scaling factor, n, which represents the estimated volume occupied by one butterfly and a correction factor, f, which accounts for variation in clustering behavior and scanner position. While work is ongoing, we confirm that TLS combined with SVE is a suitable technique for surveying clusters of overwintering monarchs at overwintering sites in Mexico and the US.
Introduction
The globally recognized monarch butterfly (Danaus plexippus) is imperiled, threatened by a fast-changing world across much of its distribution (Thogmartin et al., 2017b; Wilcox et al., 2019). To conserve the iconic species, a growing community of scientists, policymakers and the public must select the right tools and act fast. Novel technologies have long been an indispensable part of the scientific enterprise and a catalyst for new discoveries (Hristov et al., 2008; Chilson et al., 2012). Human history is rich with examples of the impact and contribution of such tools as vehicles for the exploration of new frontiers. Population size is an important variable for understanding the biology, ecology, and conservation of any organism. However, estimating the size of large group-living organisms, like the monarch butterfly, under field conditions has been notoriously challenging (Hristov et al., 2010). LiDAR technology, a 3D measurement technique, and its associated computational tools offer a promising method to help tackle the challenge and assess the abundance and density measures needed to build on decades-long efforts to monitor monarch populations in Mexico and the US.
Monarch butterflies exhibit one of the most impressive displays of animal migration, spanning multiple generations and migrating over thousands of kilometers across the continent. Monarchs east of the Rocky Mountains overwinter in dense aggregations in high-elevation Oyamel fir (Abies religiosa) forests in Mexico, while western monarchs overwinter more diffusely at numerous sites in trees on the California coast (Urquhart and Urquhart, 1976; Malcolm, 2018). Regular monitoring of the overwintering population in Mexico began in 1994 by World Wildlife Fund-Mexico in collaboration with a number of other organizations (including the Comisión Nacional De Áreas Naturales Protegidas and Secretaría De Medio Ambiente Y Recursos Naturales; Thogmartin et al., 2017a). The Mexican overwintering population is mapped as total forest area occupied in hectares which is used as an index of population size (Rendón-Salinas et al., 2017). Annual western overwintering population estimates in California began in 1997 (Malcolm, 2018) and records are kept by the Xerces Society1, but estimates, via mark-recapture methods, were made as early as the 1970s (Tuskes and Brower, 1978). Currently, the California overwintering estimates are produced via direct visual counting of clusters using an “area method” in groves along the coast2.
While the methods of estimation differ, data show a consistent decrease in overwintering numbers for both eastern and western monarch populations (Brower et al., 2012; Semmens et al., 2016; Rendón-Salinas et al., 2017; Schultz et al., 2017; Malcolm, 2018). By some measures, monarch abundance may have declined more than 80% over the past 25 years, leading to a petition in 2014 for listing under the Endangered Species Act3. US Fish and Wildlife Service (USFWS) is leading a monarch status assessment, to be finalized by 2020, to determine whether the monarch should be listed. The accurate assessment of the size and seasonal dynamics of overwintering monarch butterflies, therefore, is increasingly urgent.
One challenge for completing an accurate status assessment is difficulty determining accurate numbers of the eastern monarch population, due to the size of the task. While monarchs settle in up to 300 sites in coastal California, estimated millions concentrate in just a few locations in Central Mexico (Urquhart and Urquhart, 1976; Malcolm, 2018). As mentioned above, occupied area estimates have been used as a proxy for monitoring the eastern monarch population (Rendón-Salinas and Tavera-Alonso, 2014; Vidal and Rendón-Salinas, 2014; Vidal et al., 2014). There is considerable variation in density estimates at these sites, from 6.9 to 60.9 million butterflies per hectare, making it difficult to obtain accurate numbers–numbers which are critical for conservation efforts (reviewed in Thogmartin et al., 2017a). Regular monitoring has produced evidence of population decline; however, with monarchs now clustered on fewer and fewer trees, more precise and accurate estimates of their population at the individual level are critical. One of the most promising methods of estimating density is the capture-recapture method replicated over multiple years, (Calvert, 2004; Thogmartin et al., 2017a), however the method is disruptive to overwintering butterflies and is currently not allowed. To overcome this limitation, we look to technology to help build upon the decades of work to more accurately and precisely estimate the density and numbers of overwintering monarchs in a non-invasive way (Hristov et al., 2008). The solution, while more critical for use in the eastern overwintering sites, due to their concentration over a smaller area, will be useful for the entire North American population of the species.
To address this urgent need, we propose a novel approach for monarch population estimation using terrestrial LiDAR scanning (TLS) and associated digital tools. TLS creates a detailed digital survey using millions of LASER-based distance measurements from a scanning device to objects in the landscape. We have created innovative workflows and analytical algorithms for obtaining and converting TLS scans and high-resolution imagery of overwintering monarch aggregations into cumulative volumes and estimates of monarch abundance. Terrestrial LiDAR scanning and other photographic techniques have recently been used by biologists to visually count individual bats (Azmy et al., 2012; Shazali et al., 2017), and butterflies (Leong et al., 2017) in clusters. The technology has also been used in other large-scale applications like estimating tree biomass (Momo Takoudjou et al., 2018). In contrast, we expand the use of TLS to generate high-resolution 3D models and use the volumetric data in the models to estimate the number of butterflies in these overwintering sites.
In this technology report we discuss the use of TLS and imaging methods and the development and application of an innovative Subtractive Volume Estimation technique for estimating overwintering monarch butterfly populations. The Subtractive Volume Estimation (SVE) method works by comparing the detailed geometry of a site with and without the animals of interest, deriving as a result an estimate of the overall bio-volume and eventually an estimate for the number of individuals and density. The SVE method has shown great promise to enable the estimation of large clusters of animals and can help increase population count precision and accuracy through technology.
Materials and Methods
Overwintering Sites
We collected data from four monarch overwintering sites; two in California, USA (Santa Cruz Lighthouse Field State Park and Pismo State Beach Butterfly Grove) representing the western population of the species and two sites in central Mexico (Carpinteros and San Antonio) representing the eastern population4. The data was collected over 3 years from 2017–2019.
Terrestrial LiDAR Scanning
To collect TLS data, we used a pair of FARO S70 long-range laser scanners (Faro Technologies, Lake Mary, Florida, USA). This model has a maximum scanning resolution of 700 megapixels and is capable of scanning objects up to 70 m away with a ranging accuracy of ± 1 mm at that distance. The S70 also has the ability to generate a 350 megapixel, composite, color image based on 64 pictures captured with its on-board camera. The composite image can then be overlaid on top of the point cloud during post-processing of the data to give a realistic representation of the color space of the surveyed environment. Individual scan settings ranged from ½ to ¼ of the maximum resolution, based on the complexity of the surveyed environment, with lower settings used for more cluttered environments and higher-resolution scans used in more open, uncluttered environments. Scanning quality, the number of successful readings before a distance-estimate is recorded, was set at 2x; therefore, we collected approximately 175 million and 44 million distance measurements per scan at ½ and ¼, respectively. The beam diameter at exit for the S70 was 2.12 mm (beam divergence 0.3 mrad). The vertical and horizontal step size of the scanner was 0.009°. On average, we positioned the scanners 5.39 meters away from butterfly clusters of interest resulting in a minimum resolvable feature diameter of 1.53 and 3.07 mm at ½ and ¼ resolutions respectively; well below the dimensions of the roosting butterflies. Each scan took between 3 and 12 min so an entire survey generally took < 2 h. We used a pair of scanners to speed up the surveys and worked early in the morning, between sunrise and 10:00 local time. Any measurements of overwintering groves must be taken before ambient temperatures reach ≈16°C, which is the flight threshold for monarchs (Masters et al., 1988). Above that temperature, the butterflies grow increasingly active and begin to leave their clusters. TLS surveys were composed of 8–25 scan positions depending on the size and complexity of the surveyed site. Our goal was to capture most of the groves where butterflies were roosting; from 2–10 trees on approx. 0.2–0.4 hectares at California sites and 0.6–1.7 hectares with dozens of trees in central Mexico. The resulting point-cloud datasets were represented by over 352 million points in California and 4.4 billion points in Mexico. We were able to capture every portion of the habitat where butterflies were roosting at the California sites and large sections of the habitat at the sites in Mexico. From these composite datasets we selected clusters with different densities of butterflies for further analysis.
Subtractive Volume Estimation
The principle proposition of our Subtractive Volume Estimation (SVE) method is to compare the volumetric differences between two TLS surveys, a reference scan that records the roosting monarch butterflies in their overwintering environment and a derivative scan, that records the same site without the butterflies. The subtraction of the two geometric volumes results in an expression of the biovolume of the clustering insects. To convert from total volume of butterflies to number of individuals, we introduce a scaling factor, n, which represents a species-specific volumetric estimate of the space occupied by one individual. Monarch butterflies arrange themselves differently depending on the ambient temperature, characteristics of their environment and overall size and density of the cluster (Masters et al., 1988; Vidal and Rendón-Salinas, 2014). In addition, differences in the precision of the laser survey due to distance from the scanner, angle of incidence of the laser beam and surface reflectivity require an additional variable, correction factor f, that accounts for these characteristics of the TLS instrument and survey process. The result is an estimate for the number of butterflies in a subset cluster of the overall group or the entire colony (Figure 1).
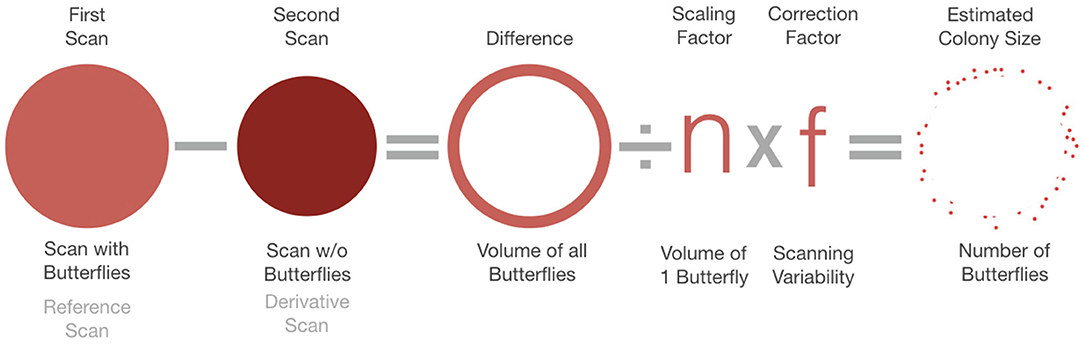
Figure 1. The analysis of Terrestrial LiDAR Scanning (TLS) data follows a numerical model based on shape analysis. Subtractive Volume Estimation (SVE) compares a scan with butterflies, referred to as the reference scan, to a scan without butterflies, known as the derivative scan and calculates the difference between the two shapes. That difference represents the volume of butterflies present. The final estimated colony size is based on dividing that volume by a scaling factor, n, which represents the volume of an individual butterfly multiplied by a correction factor f that accounts for characteristics of the TLS survey.
Data Processing
The individual, raw LiDAR scans were processed and registered together into a composite point cloud using FARO Scene5, a proprietary software provided by the scanner manufacturer. Additionally, we applied outlier, edge and stray-point filters in FARO Scene that removed any noise in the data. The point cloud data was then exported for further manipulation by other computational tools.
Few analytical tools exist for point cloud data, therefore, to make use of the richness of LiDAR data, the point clouds must first be converted to polygonal geometry—a rather computationally intensive process (Figure 2). Additionally, the polygonal 3D models of these clusters must be enveloped in complete surfaces to be suitable for 3D metrology. The subtraction of volume calculation can be done in either of two ways: (1) direct shape subtraction where the surveyed objects or scenes do not change between the reference and derivative scan (e.g., tree trunk; see Figure 11A and Supplementary Video 2 for example) and the subtracted metrics have a spatial meaning and (2) an arithmetic subtraction of the volumes when organic structures, such as branches, change their shape or position between the reference and derivative scans due to the weight of the butterflies (Figure 11B and Supplementary Video 3).
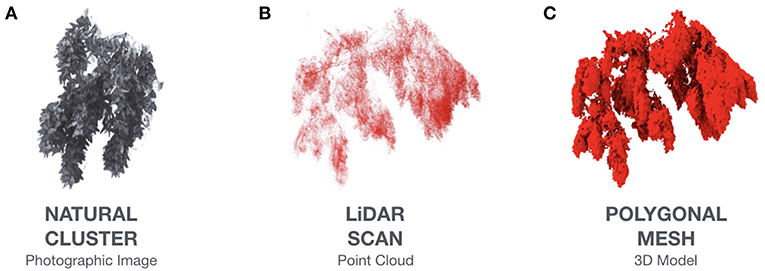
Figure 2. Visual representation of 3 steps of the TLS/SVE workflow from data acquisition of a natural cluster (A), to the generation of point cloud data (B), to the conversion to a polygonal mesh (C) that can be manipulated and measured.
To analyze the clustering shapes, we categorize the roosting aggregations of butterflies into three types based on features of the clusters—(A) Type 1, tree-trunk clusters, (B) Type 2, distal branch clusters, and (C) Type 3, canopy clusters (Figure 3 and Supplementary Video 1). Overwintering sites along the California coast feature mostly Type 2 clusters while sites in central Mexico display all three types.
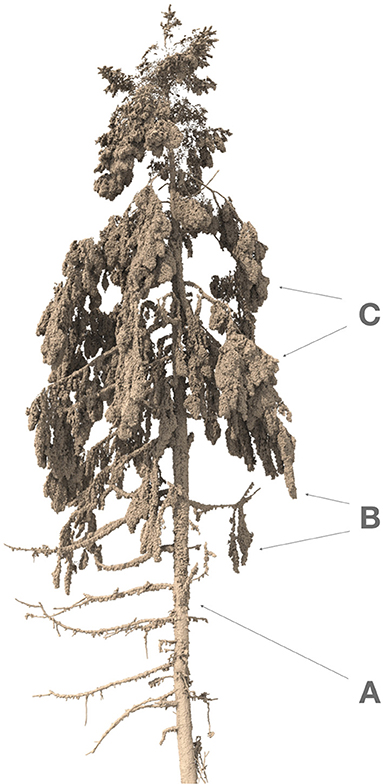
Figure 3. Roosting clusters of monarch butterflies can be classified into three types based on the features of the aggregation: (A) Type 1, tree-trunk clusters–a regular pattern of clustering on the surface of the tree trunk which allows easy survey and modeling to assess the number of butterflies; (B) Type 2, distal branch clusters–a dense mass of butterflies is clustered on a distal branch that is visible from multiple directions; (C) Type 3, canopy clusters–a very dense mass of butterflies is clustered on several branches that occlude each other and the interior of the tree to form an opaque cluster/mass that is difficult to image three-dimensionally. See also Supplementary Video 1.
To estimate the individual number of butterflies in the total subtracted volume of a cluster, we calculated both the scaling factor, n, and correction factor, f, as described above. To derive n we developed a physically accurate 3D model of an individual monarch butterfly using scaled reference images of naturally dead monarch butterflies found at the survey sites. There are no substantial size differences between male and female butterflies and both sexes overwinter at the same sites. The model allowed us to calculate the maximum species-specific volume of an individual butterfly. The scaling factor, n, for Danaus plexippus, is 49 cm3 (Figure 4). Simulations described below showed that butterfly volume n derived from virtual pointclouds were not constant and therefore needed additional modification. We derive the correction factor f based on two approaches that both require starting with known numbers of butterflies: (1) The 3D model was used as an instancing reference—a 3D modeling technique that allows the efficient generation of large, repetitive geometries based on a single reference (see below; Figure 4), and (2) we identified instances in the LiDAR surveys where we could count individual butterflies or small clusters of them roosting on tree surfaces and extracted their volumes. While (1) initially indicated that n is not constant in clusters with different densities, necessitating the formulation of f, (2) provided a more realistic measure based on the performance of the LiDAR scanners in natural clusters.
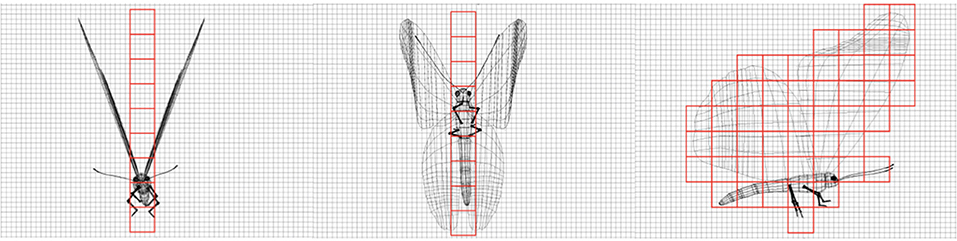
Figure 4. Physically accurate 3D model of an individual monarch butterfly, which was created using scaled reference images of naturally dead monarch butterflies found at the survey sites. The model was used to calculate an estimate for the space occupied by an individual butterfly.
Testing and Modeling
Validation is an important component of computational and simulation methods as such approaches generally produce a numerical result; but, it is important to understand if such estimates are representative of biological reality. Since invasive or destructive methods of testing and validation that require the handling of butterflies were not an option for this project, to assess the accuracy of the estimation process, we developed a virtual, physically accurate, 3D model of roosting butterflies and arranged them on (1) tree-trunks and (2) distal branches. At present, because of the size, three-dimensional complexity, inability of LiDAR to see through opaque surfaces and need for additional proofing data, Type 3, canopy clusters remain a challenge and are the focus of ongoing efforts.
We describe the validation process for the tree-trunk models, but a similar procedure is used for distal branch models. We created digital 3D models of bare tree trunks and distal branches of Oyamel and Eucalyptus trees (Eucalyptus globulus), based on laser scans in California and Mexico (Figure 5) and combined these models with the 3D model of a monarch butterfly (described above) to create virtually simulated reference and derivative point clouds. In this virtual environment we were able to “place” known numbers of butterflies in the scene to validate the performance of the SVE algorithm. We used an adapted, virtual photogrammetric method to create point-cloud representations of these virtual 3D structures. Photogrammetry, also known as structure from motion, stitches highly overlapped digital images into an accurate 3-dimensional representation of the scene (Edward et al., 2001). The photogrammetry program, Agisoft Photoscan6, analyzes the position and rotation difference of specific patterns between different photos and derives the shape of objects on those photos, as well as the position of the camera that took the photo in relation to those objects. Through experimentation we found that 1 degree of separation between renders was adequate to accurately and effectively calculate a point cloud. We rotated the camera so that it is always facing the center of the trunk, and we took a render at each 1° interval. We processed the entire image-sequence in Agisoft Photoscan to calculate a collective point cloud representation of the photographed geometry. A similar process captured the tree trunk without butterflies. The two point clouds were imported into a point-cloud editing program called MeshLab7 where we used a Screened Poisson Surface Reconstruction algorithm (Kazhdan and Hoppe, 2013) to generate a polygonal surface from adjacent points in the point cloud. The result was two cylindrical 3D models representing the bare tree, and the tree populated with butterflies. Next, the 3D models were closed to make them “watertight,” having no holes in the geometry, a requirement for volumetric calculations, and the resulting objects were imported into 3D Coat8, a digital sculpting program that treats 3D objects as voxel-based volumes. In this program there are tools that allow the accurate subtraction of one volume from another, and the export of resulting volume as a new object. The subtracted volume difference between the bare trunk and trunk with butterfly models was imported once again into MeshLab, where we calculated the volume of the end shape (Figure 6). The process was repeated for a variety of butterfly clusters (with varying known numbers of virtual butterflies) to derive a direct connection between changes in volume and butterfly numbers.
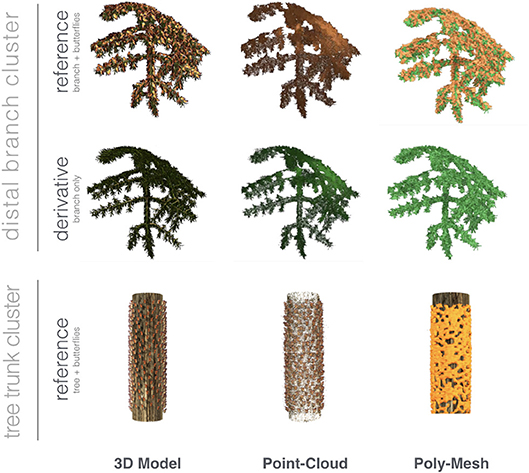
Figure 5. Examining the steps of TLS/SVE processing using virtual models of an Oyamel fir distal branch and tree trunk examples. In each case, a virtual 3D model is surveyed using virtual photogrammetry to create a point-cloud representation. That data is converted to a polygonal model that is suitable for quantitative analysis. In the distal branch example, shown are the data for the reference scan, including the branch with butterflies and derivative scan of the branch without butterflies. These quantitatively accurate models are used to validate the results from the TLS estimation of real-world butterfly aggregations.
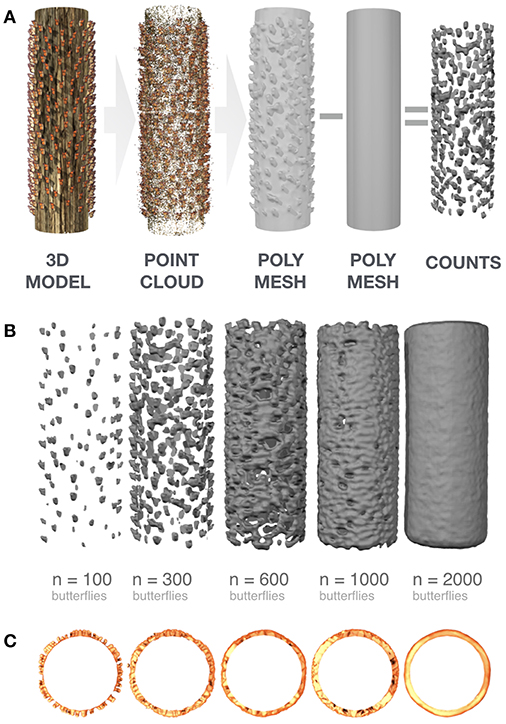
Figure 6. Steps in the TLS/SVE analysis workflow using a modeled section of an Oyamel fir trunk. (A) The 3D model is surveyed via virtual photogrammetry to produce a point cloud which is then converted to a polygonal mesh; this represents the reference scan. A similarly derived polygonal mesh of the trunk without butterflies, the derivative scan, is subtracted from the reference scan so that the butterflies are separated from their roosting substrate. (B) Subtracted volumes of butterflies derived from simulated clusters of different sizes using a virtual application of the TLS/SVE workflow. The process allows the accurate calculation of correction factors specific to the photogrammetric survey of each cluster. (C) Cross-sections of the subtracted volume shapes for butterfly clusters of 100–2,000 individuals, indicating increasing density of the resulting shapes.
The workflow sequence presented here uses generally available software tools which make them more accessible to potential users and facilitate adoption of this new methodology in practice. Other computational and metrology environments exist such as the industry-standard, Innovmetric Polyworks9 which provide integrated and more consistent and robust editing and analytical capabilities for higher-order and larger-scale computations when larger clusters or entire sites must be estimated.
Results
In this technology report we describe the development of an analytical workflow that begins with the acquisition of three-dimensional TLS data in the field and ends with an estimate of the number of butterflies in a section of the roosting habitat.
Derivation of Correction Factors
When comparing the simulated 3D models of clusters with an increasing number of butterflies with their surveys derived from virtual photogrammetry, we observed, as expected, that the total volume of the subtractive volume envelopes increased from 503 cm3 for 10 butterflies to 177,780 cm3 for 2,000 butterflies (Figures 6, 7). However, when dividing the total subtractive volume for each cluster by the number of butterflies, known exactly from the simulation engine, to arrive at a representative volume for an individual butterfly, the estimated volume per butterfly was not constant as might be expected (reference values from Figure 8). Instead, it changed as a function of the number of butterflies in the simulated clusters in a non-linear way.
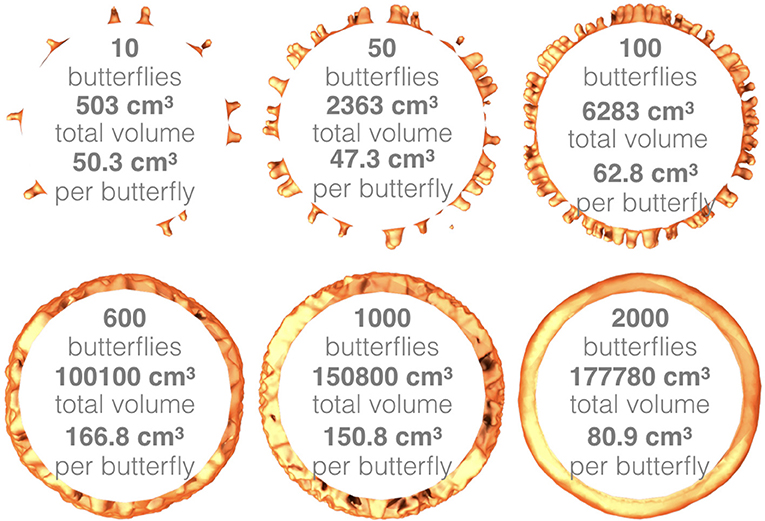
Figure 7. To validate the accuracy of the TLS/SVE estimation results, clusters of different densities of butterflies were simulated in virtually, and the total volumes and the per butterfly volumes were calculated for each case. Variation in clustering behavior, density, and scanner performance can cause the per butterfly volume to vary, requiring a correction factor to account for this effect.
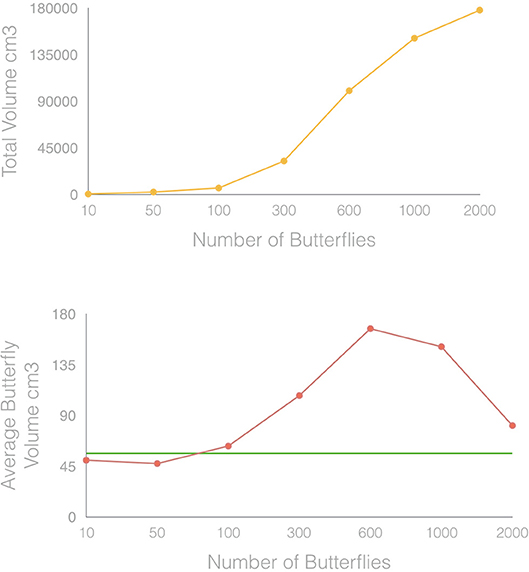
Figure 8. Results for total cluster volume and individual butterfly volume derived from virtual simulation of butterfly clusters of different size. Predictably, the total volume of the clusters increased with increased number of butterflies. However, the calculated average volume of an individual butterfly in each of these clusters (red line), deviated from the empirically measured value (green line).
If the virtual photogrammetric surveys recorded correctly the geometry of the simulated roosting butterflies, we would have had a 1:1 relationship between the number of butterflies entered in the simulation and the number of butterflies estimated through the SVE process. However, this is not the case. This inconsistency is explained by the relationship between the number of butterflies and the distance among them and how TLS and photogrammetry represent this inter-individual spacing. Noting that when butterflies are fewer (10–100), thus further apart, the laser and photogrammetric processes correctly detect individual butterflies as separate geometric objects and accurately represent their volumes. On the other end of the spectrum, in dense clusters of many butterflies (≥ 2,000), individuals are arranged closely together and their collective mass is captured accurately by TLS/Photogrammetry as a single envelope. However, during intermediate densities (300–1,000), the spacing among butterflies falls into a range where the virtual photogrammetric process cannot distinguish individual butterflies as separate objects and fuses them into one, filling the intermediate gaps between neighboring butterflies–a product that we call phantom volume. As a result of this additional volume, the estimate for the calculated volume of an individual butterfly (i.e., division of total envelope by correct number of butterflies) incorrectly increases (Figures 9, 10) at these intermediate values (300–1,000 butterflies). Because of these observations we computed the correction factor f that is included as part of the scaling factor n used for estimating the number of individual butterflies in the total subtracted volume from simulated and natural clusters.
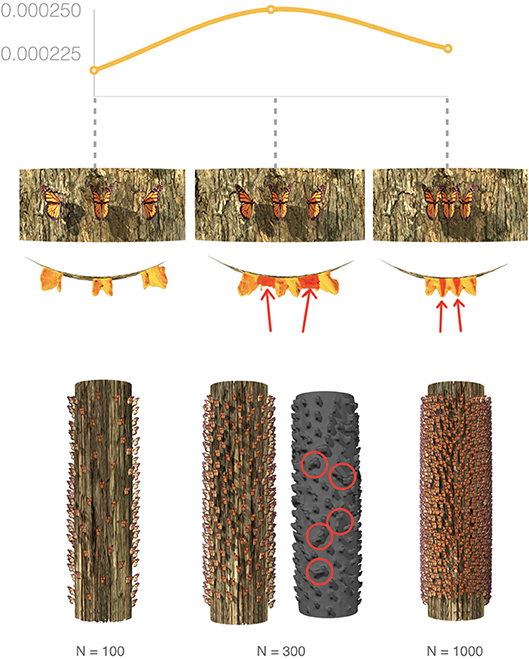
Figure 9. Illustration of the non-linear deviation of estimates of individual butterfly volume as a function of cluster size and inter-individual spacing. The per butterfly volume is relatively low when around 100 butterflies are spaciously arranged and the photogrammetric and laser-scanning processes correctly detect each individual. At the other end of the spectrum, when 1,000 butterflies are arranged on the tree section, the survey processes correctly records the mass of tightly clustered individuals. However, the per butterfly volume is higher at intermediate values when gaps between intermittently spaced butterflies are not detected correctly and phantom volume is generated, necessitating the introduction of a correction factor (see text and Figure 11).
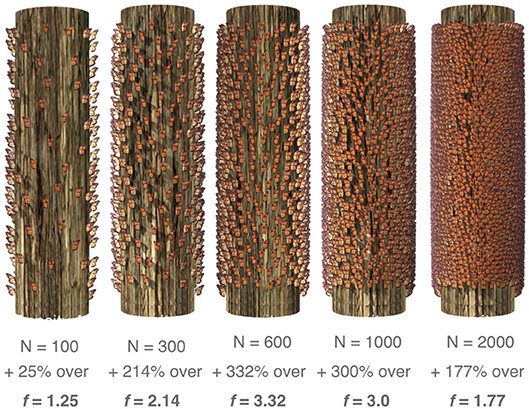
Figure 10. Virtual models of tree trunks covered in different numbers of simulated butterflies. N represents the number of butterflies “placed” on the tree, % represents how much the SVE calculations deviated from the known volume of a single individual and f represents the derived correction factor for each monarch density.
Estimation of Natural Clusters
Based on these calculations and using values of 49 cm3 and 0.29 for n and f respectively, values derived from a small patch of butterflies on a twin-trunk tree at the San Antonio site, we estimate that 192 butterflies occupy a volume of 0.002657 m3 in that cluster. Thus, 2,641 butterflies occupy 0.0365 m3 of volume for every 1-meter length of trunk with Type 1 clusters exclusively. Given the approximately 12 meter section covered by butterflies on each trunk of the tree (24 meters combined for both trunks), we estimate that 63,378 butterflies, occupying 0.8770 m3 roosted on the entire tree (Figure 11A and Supplementary Video 2). Similarly, for an SVE analysis of a tree from the Carpinteros site, consisting of Type 1 and Type 2 clusters, we estimate that the total volume of the clusters is 0.3917 cubic meters, resulting in an estimated 36,995 butterflies for the entire tree (Figure 11B and Supplementary Video 3).
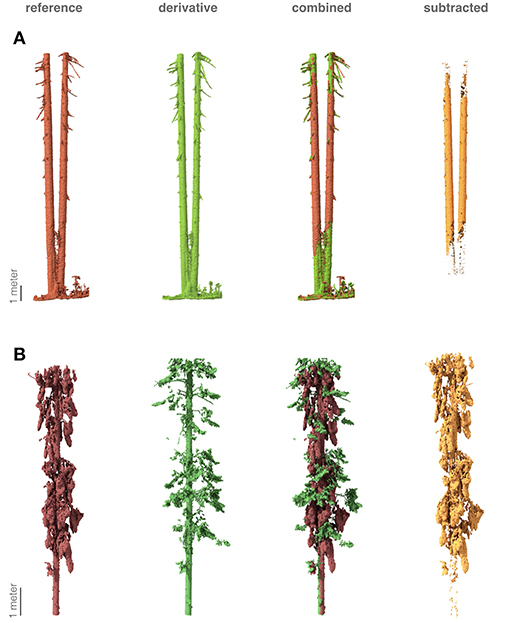
Figure 11. Three-dimensional models based on TLS scans of Oyamel fir trees in central Mexico. (A) Using the SVE analytical method, we estimate that 63,378 butterflies are present on this two-trunk tree at the San Antonio site. (B) Using the same approach, we estimate that 36,995 butterflies occupied the clusters of this tree at the Carpinteros site. See also Supplementary Videos 1, 2.
Discussion
The overwintering population size of monarch butterflies in Mexico, expressed as hectares of forest, has become the most commonly cited measure of yearly monarch abundance. Millions to hundreds of millions of monarch adults may inhabit these few hectares of central Mexican forest in the winter. There is a great variation in published estimates of overwintering density (Brower et al., 2004; Calvert, 2004) making extrapolation to the entire population difficult. Thogmartin et al. (2017a) used 6 published density estimates to develop a probability distribution for monarch overwintering density in Mexico. While they were able to calculate a median density of 21.1 million per hectare, they acknowledge that considerable uncertainty in the estimated densities remain. Such uncertainty in overwintering densities (and population counts) is a problem when building conservation interventions and particularly when trying to assess the effectiveness of such efforts.
In this technical report, we share progress and early achievements in the development of a novel workflow and analytical methods for extracting monarch abundance and density information from TLS. We confirm the suitability and exciting potential of TLS in combination with digital analytical techniques such as SVE, to provide a reliable and non-disruptive method for more accurately estimating overwintering monarch butterfly densities and population size. We demonstrate that, 3D, polygonal reconstructions based on TLS surveys have ample resolution and accuracy to enable the separation of butterflies from the background vegetation and the estimation of butterfly clusters from a few individuals in a simple arrangement to thousands in intricate clusters. Furthermore, we have developed a unique, non-destructive method for validating our estimates, via quantitative 3D modeling and virtual environments.
With these achievements, we deliver on the primary goal of this initiative–to provide an alternative approach to monarch estimation at the individual level that can expand on the decades of monitoring work in North America. Such efforts are well suited for establishing a repeatable standard for calculating overwintering density per unit areas. The work presented here can significantly reduce the uncertainty in density estimates that are still very much part of the conversation about monarch conservation (Thogmartin et al., 2017a). Therefore, this novel technological approach could be combined with the current area estimate methodology (Rendón-Salinas et al., 2017) for practical monitoring efforts that use the two techniques hand-in-hand.
Despite these promising results, important work remains as we continue to expand the application of the approach to larger sections of forest and clusters with more complex structures. Improved speed, accuracy, portability and new developments in analytical capabilities will help the process and fine-tune the workflows. Still we recognize that, despite its promise and important capabilities, novel application and great promise, TLS/SVE have several shortcomings: At present, we have not attempted to estimate the number of butterflies in Type 3, canopy clusters as we do not know enough about their internal structure. TLS is a surface survey tool, thus dense, canopy clusters in Mexico will require further data collection and analysis to understand the intricate structure of the interior of these massive aggregations. For example, it may be equally possible that these clusters are densely packed with butterflies or largely hollow and thus any assumption, one way or the other, would significantly affect the outcome and estimates in each case (Figure 3A). Additional observations, scanning techniques and detailed analyses are underway to inform the application of this method with regards to these Type 3 clusters. Similarly, TLS scanners are expensive and current computational methods for analysis of the data are tedious, time-consuming and requiring trained staff to perform both the data collection and analytics.
Nevertheless, TLS combined with SVE brings important and promising capabilities to establish the foundation for future development of individual-based whole-colony assessment. With its high inherent accuracy and smooth workflow, TLS/SVE sets the groundwork for moving this agenda forward. Perhaps the greatest promise of such future developments is the use of spectral imaging in combination with photogrammetry. Just as we described in the validation work discussed here, photogrammetric (aka Structure from Motion) reconstructions from serial sequences of images can produce detailed point-cloud data that can be used for 3D models to analyze for census estimates. This capability, combined with emerging evidence that spectral imaging, particularly IR photography, provides strong separation of monarch butterflies from background vegetation—a challenging computer vision problem (Figure 12). The two technologies combined, could offer an even more efficient and affordable technique for monarch butterfly enumeration. Further technical developments could provide important new proxies that could develop in a similar way to bat census work over the last two decades (Betke et al., 2008; Kloepper et al., 2016; Hristov pers. obs.). In that work initial efforts were intensive and expensive (multiple years and ~$500K) while current work is quicker and cheaper (a few evenings and $1–2K) which offers agencies, field workers, policy managers, and others accessible, effective tools for managing and conserving resources. As this technology matures, and more user-friendly and capable processing environments for stitching reconstructions emerge, the early work described by TLS will be superseded by these more accessible technologies and tools.
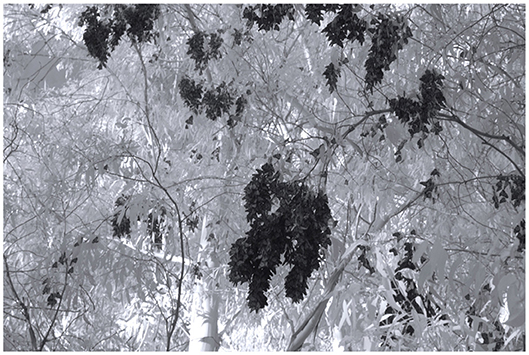
Figure 12. A reflective IR photograph of a cluster of monarch butterflies at Pismo Beach State Park Monarch Butterfly Grove, California, showing the absorption of monarchs in the IR part of the electromagnetic spectrum. This effect has potential to be used to identify visually clusters of monarchs in complex environments and thus aid computer vision analysis.
In the meantime, TLS and associated analytics offer an important formalization of the methods and practices to collect, organize and archive critical temporal and spatial information on monarch butterfly distribution and population trends. TLS not only provides important survey data that can serve as the starting point for further analysis and estimation, it serves as a detailed record in space and time to archive the overwintering behavior of the species, similar to efforts around the world to protect and archive sites of historic and cultural importance by groups like CYARK10 This is particularly important in the face of unprecedented change in distribution and population numbers for the monarch butterfly.
Conclussion
The Species Status Assessment for the monarch is currently underway by FWS with completion required by 2020. Improved abundance estimates are important for use in monarch extinction risk models that have been created for the Assessment. An ultimate goal is to vastly improve our ability to quantify the number and density of butterflies at overwintering sites, particularly in the highly localized eastern monarch sites in central Mexico. This paper describing the establishment of a robust TLS workflow and the development of SVE-based analytical algorithms improves our chances of making that goal a reality and these efforts stand to benefit the field of animal enumeration tremendously. Ultimately, this method is one of several early steps to understanding the dynamic aggregation of monarchs at a finer scale that will allow for more precise and accurate density and populations estimations.
Author Contributions
NH conceived and designed the study. LA and NH collected the data. NH, LA, DN, and TH analyzed the data and contributed to technology adaptations. NH and LA wrote the manuscript.
Conflict of Interest Statement
DN is the owner of Animusing Productions.
The remaining authors declare that the research was conducted in the absence of any commercial or financial relationships that could be construed as a potential conflict of interest.
Acknowledgments
We are extremely grateful to our colleagues who helped facilitate access and work at field sites, including Ronnie Glick, Danielle Bronson, with California State Parks, and Samantha Markum with USFWS and our collaborators with CONANP, WWF-Mexico, and the stewards of the Monarch Biosphere Preserve, Mexico. We are thankful to undergraduate assistants at Winston-Salem State University, Georgina Dzikunu, Zaria Jean, and Timothy Nixon, for help with TLS processing and analysis and to Raunak Kapoor and Trent Spivey for help with data collection. We also thank Ryan Lebar for insight into spectral photography. We thank Ryan Drum and Shauna Marquardt from USFWS and Ralph Grundel and Wayne Thogmartin from USGS for constructive conversations that helped shape this work. We wish to thank Lisa Stack, without whose logistical expertise this work would not have been accomplished and Chris White, Tommy Maddox, and Chris Morabito from Faro Technologies for technical support with LiDAR. Two reviewers (KC and JR) improved greatly the quality and clarity of the manuscript for which we are especially grateful. This work was supported by the US Department of the Interior via DOI US Fish and Wildlife Service awards (F18AC00004 and 0040294142) and the Commission for Environmental Cooperation, with additional support provided by National Science Foundation DRL-1514776. Publication costs were supported by a Winston-Salem State University Faculty Professional Development Committee research grant to LA. Funders had no role in study design, data collection and analysis, decision to publish, or preparation of the manuscript.
Supplementary Material
The Supplementary Material for this article can be found online at: https://www.frontiersin.org/articles/10.3389/fevo.2019.00266/full#supplementary-material
Supplementary Video 1. A high-resolution, three-dimensional, animated model of an Oyamel Fir tree in central Mexico covered in monarch butterflies. The model is generated based on TB LiDAR which is then converted into high-resolution, polygonal mesh. The intricate detail of the model allows the analysis of elaborate clusters and roosting patterns of the butterflies. We identify three clustering patterns on these trees: Type 1, tree trunk clusters; Type 2, distal branch clusters and Type 3, canopy clusters (see also Figure 3).
Supplementary Video 2. A high-resolution, three-dimensional, animated model of a pair of Oyamel Fir trees in central Mexico (San Antonio site) covered in monarch butterflies with Type 1 clusters. The model is generated based on TB LiDAR which is then converted into high-resolution, polygonal mesh. The intricate detail of the model allows the analysis of elaborate clusters and roosting patterns of the butterflies. Segment at 00:00–00:07 shows the point cloud without butterflies; segment at 00:07–00:13 shows the high-resolution polygonal mesh without butterflies; segment at 00:13–00:19 shows the point cloud with butterflies; segment at 00:19–00:24 shows high-resolution polygonal mesh with butterflies; segment at 00:24–00:30 shows the combined, with and without butterflies, mesh models; segment at 00:30–00:36 shows the subtracted volume of the butterflies used for the number of individuals estimate (see also Figure 11A).
Supplementary Video 3. A high-resolution, three-dimensional, animated model of an Oyamel Fir tree in central Mexico (Carpinteros site) covered in monarch butterflies with Type 1 and Type 2 clusters. The model is generated based on TB LiDAR which is then converted into high-resolution, polygonal mesh. The intricate detail of the model allows the analysis of elaborate clusters and roosting patterns of the butterflies. Segment at 00:00–00:06 shows the point cloud with butterflies; segment at 00:06–00:12 shows the high-resolution polygonal mesh with butterflies; segment at 00:12–00:18 shows the point cloud without butterflies; segment at 00:18–00:24 shows the high-resolution polygonal mesh without butterflies; segment at 00:24–00:30 shows the combined, with and without butterflies, mesh models; segment at 00:30–00:36 shows the subtracted volume of the butterflies used for the number of individuals estimate (see also Figure 11B).
Footnotes
2. ^www.pgmuseum.org/blog/2014/10/17/how-do-you-count-monarch-butterflies
3. ^www.biologicaldiversity.org/species/invertebrates/pdfs/Monarch_ESA_Petition.pdf
4. ^www.xerces.org/wp-content/uploads/2015/10/MonarchMap-NatureServe-10.20.png
References
Azmy, S. N., Sah, S. A. M., Shafie, N. J., Ariffin, A., Majid, Z., Ismail, M. N. A., et al. (2012). Counting in the dark: non-intrusive laser scanning for population counting and identifying roosting bats. Sci. Rep. 2:524. doi: 10.1038/srep00524
Betke, M., Hirsh, D., Makris, N. C., McCracken, G. F., Procopio, M., Hristov, N. I., et al. (2008). Thermal imaging reveals significantly smaller brazilian free-tailed bat colonies than previously estimated. J. Mammal. 89, 18–24. doi: 10.1644/07-MAMM-A-011.1
Brower, L. P., Kust, D. R., Rendon-Salinas, E., Serrano, E. G., Kust, K. R., Miller, J., et al. (2004). “Catastrophic winter storm mortality of monarch butterflies in Mexico during January 2002” in The Monarch Butterfly: Biology and Conservation, eds. K. S. Oberhauser and M. J. Solensky (Ithaca, NY: Cornell University Press, 151–166.
Brower, L. P., Taylor, O. R., Williams, E. H., Slayback, D. A., Zubieta, R. R., and Ramírez, M. I. (2012). Decline of monarch butterflies overwintering in Mexico: is the migratory phenomenon at risk? Insect Conserv. Diversity 5, 95–100. doi: 10.1111/j.1752-4598.2011.00142.x
Calvert, W. H. (2004). “Two methods estimating overwintering monarch population size in Mexico” in The Monarch Butterfly: Biology and Conservation, eds. K. S. Oberhauser and M. J. Solensky (Ithaca, NY: Cornell University Press, 121–127.
Chilson, P. B., Bridge, E., Frick, W. F., Chapman, J. W., and Kelly, J. F. (2012). Radar aeroecology: exploring the movements of aerial fauna through radio-wave remote sensing. Biol. Lett. 8, 698–701. doi: 10.1098/rsbl.2012.0384
Edward, M., James, B., and McGlone, J. C. (2001). Introduction to Modern Photogrammetry. New Jersey, NJ: John Wily and Sons.
Hristov, N. I., Betke, M., Hirsh, D., Bagchi, A., and Kunz, T. H. (2010). Seasonal variation in colony size of braziilian free-tailed bats at carlsbad cavern based on thermal imaging. J. Mammal. 91, 183–192. doi: 10.1644/08-MAMM-A-391R.1
Hristov, N. I., Betke, M., and Kunz, T. H. (2008). Applications of thermal infrared imaging for research in aeroecology. Integrat. Comp. Biol. 48, 50–59. doi: 10.1093/icb/icn053
Kazhdan, M., and Hoppe, H. (2013). Screened poisson surface reconstruction. ACM Trans. Graphics 32:29. doi: 10.1145/2487228.2487237
Kloepper, L. N., Linnenschmidt, M., Blowers, Z., Branstetter, B., Ralston, J., and Simmons, J. A. (2016). Estimating colony sizes of emerging bats using acoustic recordings. R. Soc. Open Sci. 3:160022. doi: 10.1098/rsos.160022
Leong, K. L., Walker, J. H., Dees, R., and Sletteland, H. (2017). Use of cluster photographs to estimate overwintering monarch butterfly, Danaus plexippus Linnaeus, 1758 (Lepidoptera: Danaidae), populations at selected California overwinter sites. Pan-Pacific Entomol. 93, 229–233. doi: 10.3956/2017-93.4.229
Malcolm, S. B. (2018). Anthropogenic impacts on mortality and population viability of the monarch butterfly. Ann. Rev. Entomol. 63, 277–302. doi: 10.1146/annurev-ento-020117-043241
Masters, A. R., Malcolm, S. B., and Brower, L. P. (1988). Monarch butterfly (Danaus plexippus) thermoregulatory behavior and adaptations for overwintering in Mexico. Ecology 69, 458–467. doi: 10.2307/1940444
Momo Takoudjou, S., Ploton, P., Sonké, B., Hackenberg, J., Griffon, S., de Coligny, F., et al. (2018). Using terrestrial laser scanning data to estimate large tropical trees biomass and calibrate allometric models: a comparison with traditional destructive approach. Methods Ecol Evol. 9, 905–916. doi: 10.1111/2041-210X.12933
Rendón-Salinas, E., Martínez-Meza, F., Cruz-Piña, M., and Fajardo-Arroyo, A. (2017). Superficie Forestal Ocupada por las Colonias de Hibernación de la Mariposa Monarca en México en la temporada 2016-2017. Available online at http://awsassets.panda.org/downloads/superficie_de_bosque_ocupado_por_la_mariposa_monarca_en_los_santuarios_de_mexico__2016_2.pdf (accessed December, 2018).
Rendón-Salinas, E., and Tavera-Alonso, G. (2014). Monitoeo de la Superficie Forestal Ocupada por las Colonias de Hibernación de la Mariposa Monarca en Diciembre de 2013. World Wildlife Fund-México, Zitácuaro, Michoacán. Available online at: http://assets.panda.org/downloads/monitoreo_mariposa_monarca_en_mexico_2013_2014.pdf (accessed December, 2018).
Schultz, C. B., Brown, L. M., Pelton, E., and Crone, E. E. (2017). Citizen science monitoring demonstrates dramatic declines of monarch butterflies in western North America. Biol. Conser. 214, 343–346. doi: 10.1016/j.biocon.2017.08.019
Semmens, B. X., Semmens, D. J., Thogmartin, W. E., Wiederholt, R., López-Hoffman, L., Diffendorfer, J. E., et al. (2016). Quasi-extinction risk and population targets for the Eastern, migratory population of monarch butterflies (Danaus plexippus). Sci. Rep. 6:23265. doi: 10.1038/srep23265
Shazali, N., Chew, T. H., Shamsir, M. S., Tingga, R. C. T., Mohd-Ridwan, A. R., and Khan, F. A. A. (2017). Assessing bat roosts using the LiDAR system at wind cave nature reserve in sarawak, Malaysian Borneo. Acta Chiropterologica. 19, 199–210. doi: 10.3161/15081109ACC2017.19.1.016
Thogmartin, W. E., Diffendorfer, J. E., López-Hoffman, L., Oberhauser, K., Pleasants, J., Semmens, B. X., et al. (2017a). Density estimates of monarch butterflies overwintering in central Mexico. Peer J. 5. doi: 10.7717/peerj.3221
Thogmartin, W. E., Wiederholt, R., Oberhauser, K., Drum, R. G., Diffendorfer, J. E., Altizer, S., et al. (2017b). Monarch butterfly population decline in North America: identifying the threatening processes. R. Soc. Open Sci. 4:170760. doi: 10.1098/rsos.170760
Tuskes, P. M., and Brower, L. P. (1978). Overwintering ecology of the monarch butterfly, Danaus plexippus L., in California. Ecol. Entomol. 3, 141–153. doi: 10.1111/j.1365-2311.1978.tb00912.x
Urquhart, F. A., and Urquhart, N. R. (1976). The overwintering site of the eastern population of the monarch butterfly (Danaus p. plexippus Danaidae) in southern Mexico. J. Lepidopterists' Soc. 30, 153–158
Vidal, O., López-García, J, and Rendón-Salinas, E. (2014). Trends in deforestation and forest degradation after a decade of monitoring in the Monarch Butterfly biosphere reserve in Mexico. Conserv. Biol. 28, 177–186. doi: 10.1111/cobi.12138
Vidal, O., and Rendón-Salinas, E. (2014). Dynamics and trends of overwintering colonies of the monarch Butterfly in Mexico. Biol. Conserv. 180, 165–175. doi: 10.1016/j.biocon.2014.09.041
Keywords: LiDAR, monarch butterfly, population estimates, overwintering counts, technology
Citation: Hristov NI, Nikolaidis D, Hubel TY and Allen LC (2019) Estimating Overwintering Monarch Butterfly Populations Using Terrestrial LiDAR Scanning. Front. Ecol. Evol. 7:266. doi: 10.3389/fevo.2019.00266
Received: 01 January 2019; Accepted: 25 June 2019;
Published: 23 July 2019.
Edited by:
Wayne E. Thogmartin, United States Geological Survey (USGS), United StatesReviewed by:
Kim Calders, Ghent University, BelgiumJason John Rohweder, United States Geological Survey (USGS), United States
Copyright © 2019 Hristov, Nikolaidis, Hubel and Allen. This is an open-access article distributed under the terms of the Creative Commons Attribution License (CC BY). The use, distribution or reproduction in other forums is permitted, provided the original author(s) and the copyright owner(s) are credited and that the original publication in this journal is cited, in accordance with accepted academic practice. No use, distribution or reproduction is permitted which does not comply with these terms.
*Correspondence: Nickolay I. Hristov, aHJpc3Rvdm5AY2RpdW5jLm9yZw==