 David F. Willer
 Kevin Smith2
- 1Aquatic Ecology Group, Department of Zoology, University of Cambridge Conservation Research Institute, University of Cambridge, Cambridge, United Kingdom
- 2International Union for Conservation of Nature, Cambridge, United Kingdom
Species extinctions are occurring at an unprecedented rate and there is a global need to understand whether conservation effort is appropriately allocated to protect those species at risk. In this study three major measures of global conservation effort across IUCN Red List Threats and Habitats were assessed; staff time spent by the largest cluster of conservation organizations in the world—Cambridge Conservation Initiative, efforts by international NGOs through social media, and global conservation research publications since the year 2000. We find global conservation effort is generally aligned with global conservation priorities, but there are important outliers. Shrublands and rocky areas receive disproportionately little investment across all effort measures relative to the number of high extinction risk species, threats from residential and commercial development receive relatively low research and time investment despite social media attention, while marine areas and climate change receive more attention than expected. Governments and society must make critical conservation decisions in the context of rapid global change, and there is potential for key Threats or Habitats to receive less attention than required. The global conservation community would be wise to carefully consider and improve its understanding of effort-priority mismatches if the greatest number of high extinction risk species are to be protected.
Introduction
Conserving biodiversity is recognized as the cornerstone of protecting global ecosystem services, which are estimated to be worth over USD $127 trillion yr−1 (Mace et al., 2012; Costanza et al., 2017). Scientists believe we are now driving Earth's sixth mass extinction event (Ceballos et al., 2017), and with continued ineffective management the annual value of our ecosystems could halve by 2050 (Costanza et al., 2017). Conservation organizations are working hard to protect our natural capital, focusing on particular threats, habitat, geography, or taxa, with their contributions ranging from policy engagement to running projects on the ground (Waldron et al., 2013, 2017; IUCN, 2018). Given effort investment by conservation NGOs is increasing but resources and time remain scarce, it is becoming increasingly important to understand if effort is being spent where it is most needed (Larsen, 2016).
The International Union for Conservation of Nature (IUCN) Red List represents an invaluable tool for conservation organizations to appropriately allocate their effort. The Red List is recognized as the world's most comprehensive inventory of species' conservation status, with over 91,000 species assigned metrics including extinction risk, Habitats occupied and Threats exposed to IUCN (2017). Agriculture, aquaculture and biological resource use currently threaten the largest number of high extinction risk species, while forests and wetlands contain the most (Figure 1).
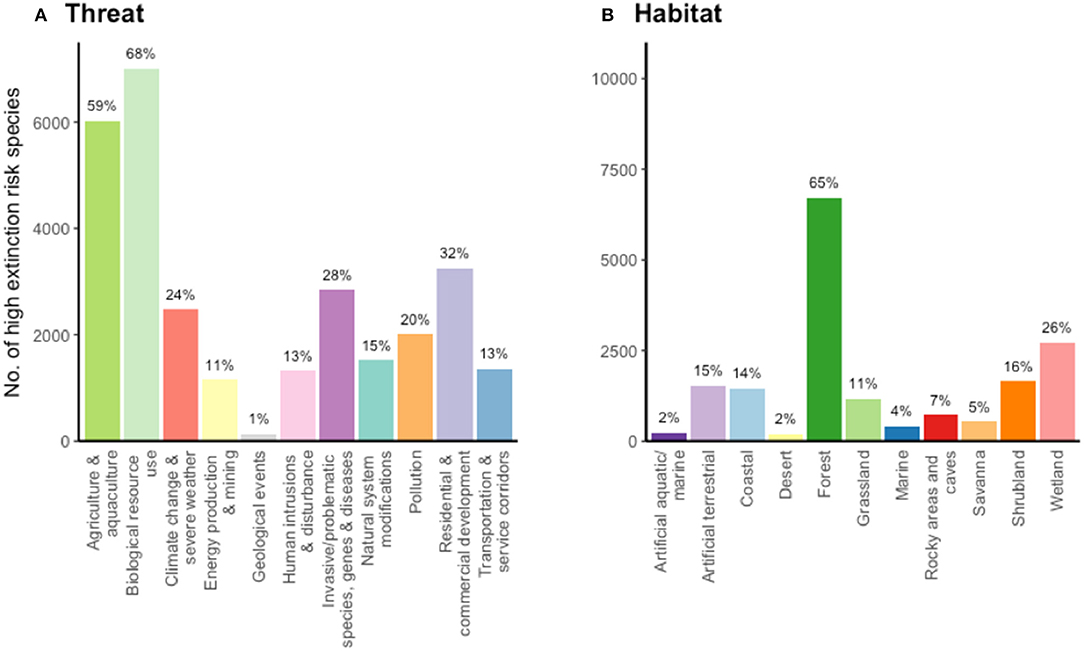
Figure 1. The number of high extinction risk species in each Red List Threat and Habitat class. Percentages on bars refer to the percentage of high extinction risk comprehensively assessed taxa that occupy the habitat (B) or are exposed to the threat (A). Data are from Red List version 2017.3 (see Table S1). High extinction risk refers to species in six of the eight Red List categories; Near Threatened (NT), Vulnerable (VU), Endangered (EN), Critically Endangered (CR), Extinct in the Wild (EW), Extinct (EX). Least Concern (LC), and Data Deficient (DD) are the remaining two categories. To date 35,306 of the >91,000 Red List species have been comprehensively assessed, and of these 10,249 are classed as high extinction risk.
We asked whether global effort in terms of research, social media, and time investment is aligned to biodiversity priorities set out by the Red List. Specifically: (1) How has conservation research been distributed across the Red List Threat and Habitat categories since the year 2000; (2) What is the distribution of Twitter posts from international conservation NGOs across Red List Threat and Habitat categories; (3) What proportion of time do academics and NGO staff working within the largest cluster of conservation organizations in the world, the Cambridge Conservation Initiative (CCI), spend on each Red List Threat and Habitat; (4) How does the amount of research, Twitter posts, and time allocation on each Red List Threat and Habitat correlate with the number of threatened species, and where are the key mismatches?
Materials and Methods
Red List Analysis
Red List data (version 2017.3) were obtained using the International Union for Conservation of Nature (IUCN) Red List API and R Statistics (IUCN, 2017; R Core Team, 2018) (see R Code S1). The broadest or “level 1” Threat and Habitat data for all species in the 31 taxonomic groups comprehensively assessed by the IUCN (Table S1) were retrieved; the number of comprehensively assessed groups continues to grow as the IUCN work down a priority list. The data were then filtered to leave only species in classifications we tagged as “high extinction risk;” Near Threatened (NT), Vulnerable (VU), Endangered (EN), Critically Endangered (CR), Extinct in the Wild (EW), Extinct (EX). The remaining two classifications we did not class as “high extinction risk” were Least Concern (LC), and Data Deficient (DD) for those species where not enough information is available to assign a category of extinction risk. A few Habitats were combined; “rocky areas” and “caves and subterranean habitats” were merged into “rocky areas and caves;” “marine neritic,” “marine intertidal” and “marine coastal/supratidal” were merged into “coastal;” “marine oceanic” and “marine deep benthic” were merged into “marine;” and “introduced vegetation” was added to the “artificial terrestrial” Habitat. This created a total of 11 Threats and 11 Habitats. The number of species in “high extinction risk” classifications from comprehensively assessed taxonomic groups in each Threat and Habitat category were then counted (Table S1).
The number of threatened species in comprehensively assessed taxonomic groups is regarded by the IUCN as the best available representation of global conservation priorities. The comprehensive assessment methodology prioritizes generating and updating datasets for species groups which are known to contain many threatened or near-threatened species, and there is not a bias toward specific Threats or Habitats. The number of threatened species in each Threat or Habitat class is thus a fair metric to represent the proportion of all species in those classes that are threatened (Bland et al., 2017; IUCN, 2019). Alternative metrics such as the proportion of threatened species in comprehensively assessed groups are less useful, because they misleadingly inflate the proportion of all species that are threatened, due to the preferential selection of threatened species in the comprehensive assessment process (Brummitt et al., 2015; IUCN, 2019). Following IUCN guidance our study used the number of threatened (high extinction risk species) as the conservation-priority metric to compare against effort metrics, and this also enabled comparison of our data with other studies which have used the same metric (Brummitt et al., 2015; Bellard et al., 2016; Titley et al., 2017).
Search Keywords
The keywords used for the research and Twitter analyses were obtained from “level two” of the IUCN Threat and Habitat classification criteria (IUCN, 2017). “Level two” contains a wide selection of keywords for each “level 1” Threat and Habitat category, and was used as a standardized criteria to ensure our search keywords would capture as many relevant Twitter and research posts as possible. Table S2 shows the keywords used for each Threat and Habitat category.
Research Analysis
The Scopus literature database API was used to search for all scientific articles published between 01/01/2000 and 31/12/2017 containing “conservation” and “biodiversity” and at least one Habitat or Threat keyword, in the title, abstract, or keywords (Elsevier, 2018). The number of articles corresponding to each Threat and Habitat for each year were recorded (Table S3).
Twitter Analysis
Twitter data were obtained using the Twitter API and R Statistics (R Core Team, 2018; Twitter, 2018). A list of 85 international NGOs was selected from the IUCN members list of 107 international NGOs; the 22 NGOs with no Twitter profiles or profiles with no direct conservation relevance were excluded. Profile data and the most recent 3200 tweets, excluding retweets, from all 85 NGOs were downloaded on 29/05/2018. To ensure fair comparison between NGOs, 150 days of data between 31/12/2017 and 29/05/2018 were selected. This was the longest period that could be selected across all organizations, as several NGOs had their 3200th most recent tweet on 31/12/2017, and no more than 3200 tweets can be retrieved due to limits imposed by the Twitter API. The selected tweets were then searched using the keywords for each Threat and Habitat, and the number of tweets corresponding to each Threat and Habitat was counted (Tables S4, S5, R Code S4).
Time Analysis
Time data were obtained using a SurveyMonkey survey sent out to nine conservation organizations within the Cambridge Conservation Initiative (CCI) (Table S6) (SurveyMonkey Inc., 2018). The nine organizations were: Royal Society for the Protection of Birds, BirdLife International, International Union for Conservation of Nature, United Nations Environment Programme World Conservation Monitoring Center, Cambridge Conservation Forum, Fauna and Flora International, TRAFFIC, British Trust for Ornithology, and the University of Cambridge Conservation Research Institute. Insurance was provided by the University of Cambridge, and ethical approval by the Psychology Research Ethics Committee, University of Cambridge. Individuals were asked the following six questions: “Which organization do you work for?;” “Estimate the percentage of your time that was spent working on the following biodiversity Threats over the past year;” “Estimate the percentage of your time that was spent working on the following Habitats over the past year;” “Imagine funding and job requirements were not an object, and you were acting in the best interest for conservation. What percentage of your time would you spend working on the following biodiversity Threats over the next year?;” “Imagine funding and job requirements were not an object, and you were acting in the best interest for conservation. What percentage of your time would you spend working on the following Habitats over the next year?;” and “Any other comments?” Some individuals did not fully complete the survey, so there were fewer responses to the later questions. Of the 68 individuals who completed every question, 11 were from academic and 57 from non-academic organizations. Data in the “other threats” category, a category added to the survey to make completion by participants easier, were not used in the analysis.
Data Presentation and Statistics
All data were analyzed and plotted using R Statistics (Tables S1–S8 and R Code S1–S6) (R Core Team, 2018). For the time data (Figure 4), paired sample Wilcoxon tests identified differences in how people spent time last year compared to how they would spend it next year on Threats and Habitats, see Table S7 for V and p-values. Median and mean response values for each Threat and Habitat for last year and next year were then calculated. Means were standardized so that each Threat and Habitat total was out of 100 for use in Figure 4 and the manuscript (medians were not used for this purpose due to the low resolution of responses given by any individual; employees tended to give scores to the nearest 10%). For the scatterplots (Figure 5), major axis models were used to test for positive correlation between each conservation effort variable and the number of high extinction risk species, and also between research and time effort. Equations and statistics are presented in the results.
Results
Research
Our findings reveal conservation research is growing rapidly but is not proportionately distributed across the number of high extinction risk species in each Red List Threat and Habitat. In 2017 over 3700 peer reviewed scientific articles were published with both “biodiversity” and “conservation” in the title, abstract, or keywords; a seven-fold increase since the year 2000 (Elsevier, 2018). Over the past 5 years climate change and agriculture received nearly 40% of research attention, whilst invasive species, energy production, and transportation combined received just 13% (Figure 2A). Forest Habitats accounted for 37% of research across all 11 Habitats, whilst shrublands and rocky areas both made up <1% (Figure 2B).
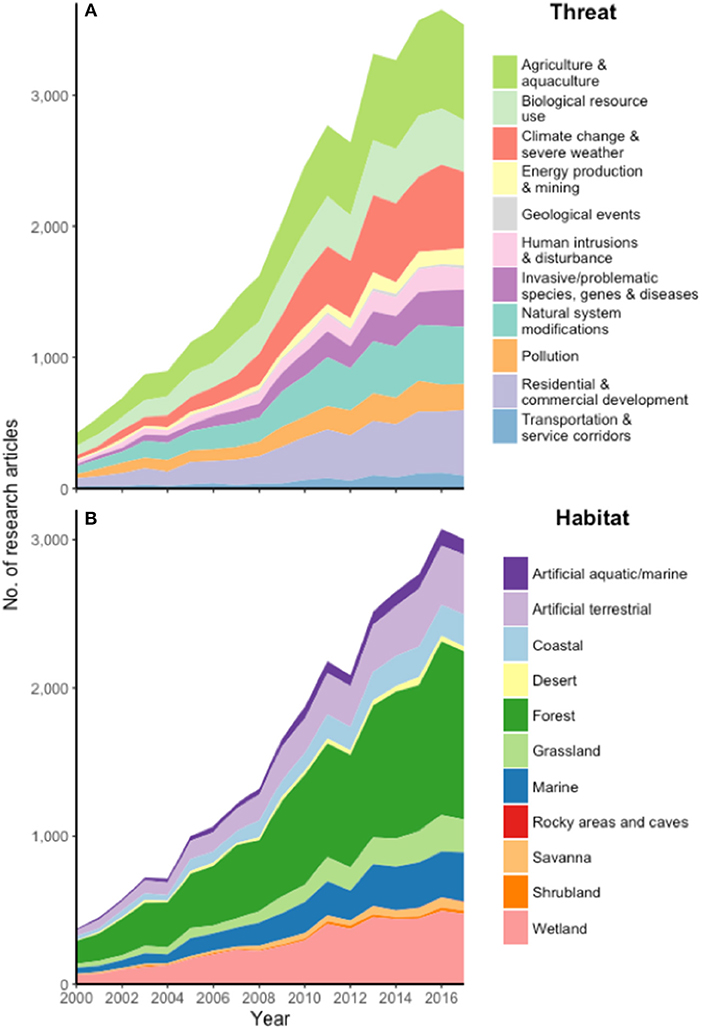
Figure 2. The number of research articles relating to Red List Threats and Habitats. Research articles allocated to a specific Threat (A) or Habitat (B) contained “biodiversity” and “conservation” and at least one keyword corresponding to the Threat or Habitat, in the title, keywords, or abstract of the article. Data are for 01/01/2000 to 31/12/2017 and obtained from Scopus literature database (Elsevier, 2018).
Social Media
Twitter posts from large international conservation NGOs were also focussed toward certain Habitats and Threats. Climate change, agriculture, and biological resource use accounted for 52% of Threat-related Twitter posts, from all 85 assessed NGOs over 150 consecutive days in 2018. Invasive species and transportation each received just 2%. Nearly 70% of Habitat posts concerned forests or marine environments, whilst rocky areas and shrubland received zero attention. Unsurprisingly, some Habitat-specific NGOs displayed especially narrow focus, for example the African Wildlife Foundation on savannas, and the Rainforest Alliance on forests (Figure 3).
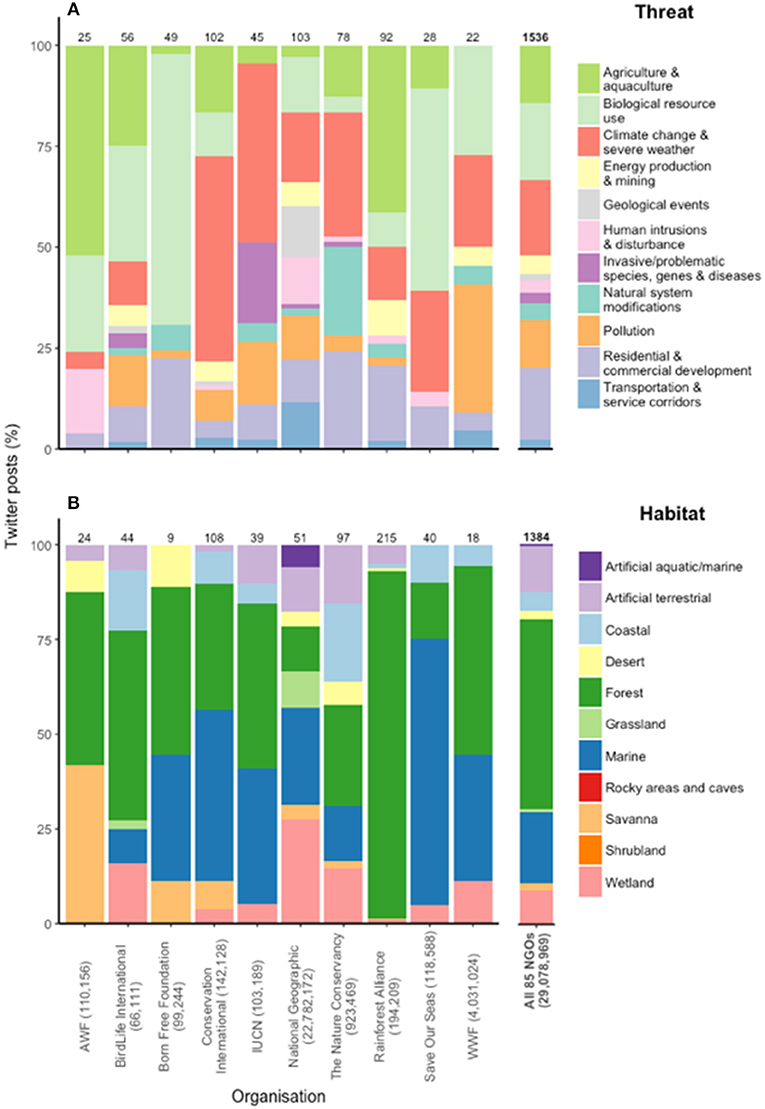
Figure 3. Twitter posts on Red List Threats and Habitats. Twitter posts allocated to a specific Threat (A) or Habitat (B) contained at least one keyword corresponding to the Threat or Habitat. The right-hand bars are a total from the 85 international NGOs with Twitter profiles who are members of the IUCN. The left-hand bars are the top 10 most followed NGOs of the 85. Data are from 150 days between 31/12/2017 and 29/05/2018, and the number of posts is shown on top of the bars for each NGO. The number of followers on 29/05/2018 is shown after each NGO name.
Time Investment
Conservation practitioners within CCI invest the majority of their time on a few key Habitats and Threats and would not choose to dramatically alter this. Over the past year forest, wetland and marine Habitats received 55% of time, whilst rocky areas and deserts received just over 1% each. For Threats, 39% of time was spent on agriculture and biological resource use, while invasive species, natural system modifications, transportation, pollution and development combined received only 28% (Figure 4, left). When conservation practitioners were asked how they would spend their time to best help conservation if funding and job requirements were not an object, they gave a response which suggested they would only slightly alter their time allocation, but with the same few Habitats and Threats still receiving the majority of attention. Forests, wetlands, and marine Habitats would still receive 58% of time, whilst deserts would receive significantly more time (twice current 1%) (paired sample Wilcoxon, V = 40, p < 0.05). Agriculture and biological resource use would still receive 36% of time, although climate change would receive significantly more attention (5% on top of current 8%) (paired sample Wilcoxon, V = 249, p < 0.01) (Figure 4, right).
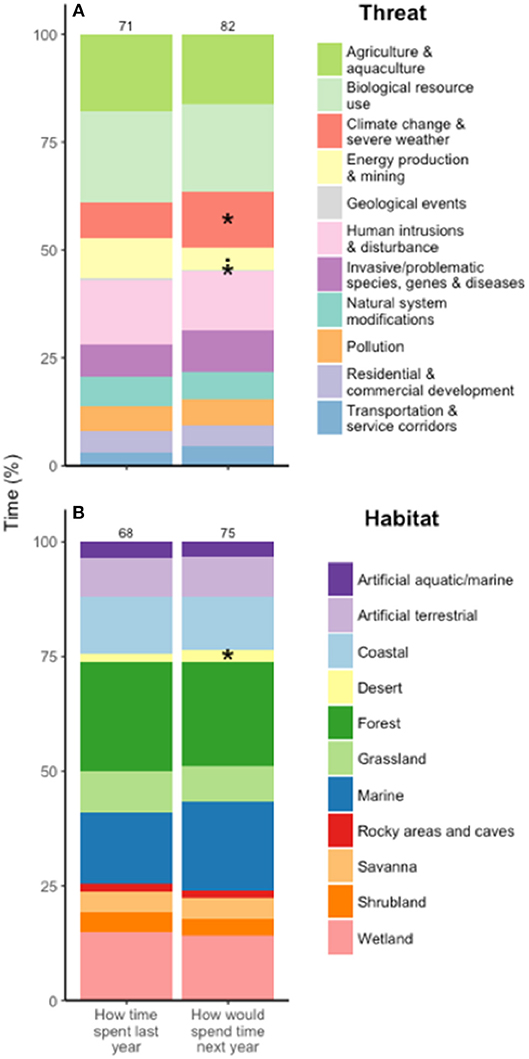
Figure 4. How conservation practitioners spent their time last year and how they would spend it next year, for Threats (A) and Habitats (B). Survey responses are from nine leading internationally-focussed biodiversity conservation organizations (see Methods in section Time analysis). “Last year” is 01/08/2017–31/07/2018. “How would spend time next year” assumed that conservation practitioners were acting in conservation's best interest and that funding and job requirements were not an object. The *indicates a significant (Paired Wilcoxon test, p < 0.05) and. near significant (p = 0.07) difference between “last year” and “next year” for threats or habitats. The number of individual responses to each question is shown on top of each bar.
Conservation Effort and Priorities
The amount of research, social media, and time allocated to Red List Threats and Habitats does positively correlate with number of high extinction risk species present in each category, but there are a few key outliers (Figure 5). Shrublands have the third greatest number of high extinction risk species of all Habitats (1,650 species), yet along with rocky areas receive consistently less than expected attention across all effort measures (Figure 5, right). In comparison, marine Habitats contain relatively fewer (422) high extinction risk species yet receive greater than expected attention across all measures. Patterns of outliers are not completely consistent across research, social media, and time components. There is a tendency for Twitter to give a lot of attention to development, an area which receives little time or research relative to the number of high risk species in this category (Figure 5, left). Invasive species receive very little attention on Twitter, despite posing a high extinction risk to over 10,000 species. Climate change receives a relatively large amount of research and social media attention relative to the number of high extinction risk species, although this is not reflected in staff time. More broadly though, the focus of the academic community and conservation NGOs is closely aligned; there is a highly significant correlation between research and time effort for Habitats (p < 0.001), and a near-significant correlation for Threats (p = 0.06) (see Figure S1). Full equations for the positive correlations between effort variables and species are as follows: research vs. species for Threats y = 319.80 + 0.41x, r2 = 0.40, p < 0.05; Twitter vs. species for Threats y = 39.12 + 0.038x, r2 = 0.52, p < 0.05; time vs. species for Threats y = 2.81 + 0.0024x, r2 = 0.62, p < 0.01; research vs. species for Habitats y = 29.26 + 0.79x, r2 = 0.84, p < 0.001; Twitter vs. species for Habitats y = 0.095x – 23.23, r2 =0.74, p < 0.001; time vs. species for Habitats y = 4.37 + 0.0030x, r2 = 0.63, p < 0.01. The positive correlations between research and time effort: for Threats y = 306.82x – 1394.32, r2 = 0.35, p = 0.06; for Habitats y = 233.34x – 847.87, r2 = 0.84, p < 0.001.
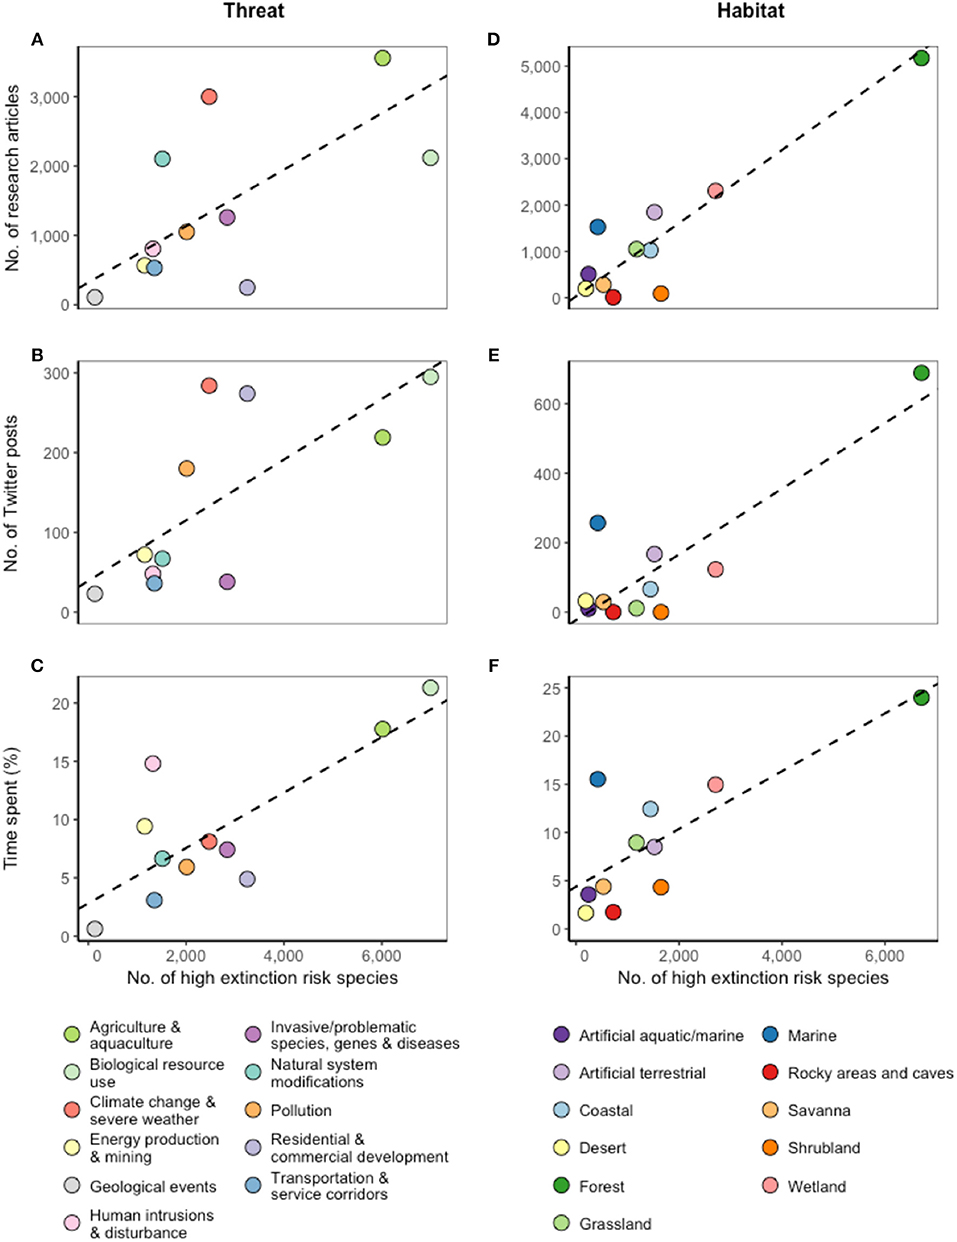
Figure 5. Conservation effort relative to the number of high extinction risk species across Red List Threats and Habitats. Research data covers 5 years 01/01/2013–31/12/2017, Twitter data 150 consecutive days 31/12/2017–29/05/2018, and time data one year 01/08/2017 – 31/07/2018. Black dotted lines are major axis models (for A–F: r2 = 0.40, 0.52, 0.62, 0.84, 0.74, 0.63 respectively; all p < 0.05). Points above the line receive above average effort per species, points below the line receive below average effort per species.
Discussion
The focus of global effort and conservation Red List priorities do in general line up, but there are key mismatches that cannot be ignored. Shrublands and rocky areas receive disproportionately little investment across research, social media and staff time effort measures relative to the number of high extinction risk species. Threats from residential and commercial development receive relatively low research and time investment despite high social media attention, and invasive species receive little media attention. Marine areas and climate change receive more attention than expected across all effort measures.
The presence of these mismatches corroborates with recent studies that are just beginning to understand whether the global community is distributing its conservation efforts appropriately. In 2018 it was shown that drivers of biodiversity loss do not always align with research efforts; ‘habitat change’ and ‘pollution’ drivers were falling behind conservation targets, a parallel seen in the lack of effort on residential and commercial development threats in our study (Mazor et al., 2018). Mazor et al. also showed there was insufficient conservation progress on ‘invasive species’, reflected in the low media attention in our study, and concerning given invasive species are the biggest factor in species extinction (Bellard et al., 2016). We also now know that biodiversity research is biased toward temperate regions (Brummitt et al., 2015; Titley et al., 2017). Our study did not assess geographic bias directly, but the high prevalence of European and North American conservation organizations in the Twitter and time investigations, and the fact that CCI as the largest cluster of conservation organizations in the world is based in Cambridge, UK, would support the presence of a temperate bias.
To avoid further expansion of mismatches, the global community should be made more aware of and improve its understanding of mismatches now. More species data are needed; at the time of this study, only 33,536 of the 91,000 species on the IUCN Red List are part of taxonomic groups that have been comprehensively assessed. More information on the activities of governmental organizations is required, with studies to date focussing primarily on researchers and NGOs. We should also consider carefully which effort measures exhibit the most influence, whether it be research, social media, time, or others, to avoid mistakes and ineffective conservation action. Scientists caution that if tweets do not accurately convey conservation priorities misinformation can cascade through social media, and the same will apply across other communication and organizational networks (Bombaci et al., 2016). Today perfect allocation of conservation funds and resources to Threats and Habitats is perhaps an unrealistic goal, but improving our understanding of mismatches can help us come closer to achieving this goal.
Effort in conservation continues to grow as the threats posed to global biota become increasingly pressing. While maintaining species diversity may not be the primary goal of all conservation efforts, it is certainly a very important one (Hooper et al., 2005). Conservation researchers, practitioners, and donor organizations would therefore be wise to consider which Habitats are at greatest risk of biodiversity loss and which Threats are the most important drivers when designing and implementing conservation strategies. In doing so, the greatest gains for global biodiversity may be achieved. Resources to protect biodiversity and our ecosystems are limited and the environmental, human, and economic costs of failure are of enormous magnitude. Effective allocation of our resources should be seen as a top global priority.
Data Availability
All datasets for this study are included in the manuscript and the Supplementary Files.
Ethics Statement
This study was carried out in accordance with the recommendations of the Psychology Research Ethics Committee, University of Cambridge with written informed consent from all subjects. All subjects gave written informed consent in accordance with the Declaration of Helsinki. The protocol was approved by the Psychology Research Ethics Committee, University of Cambridge.
Author Contributions
DW, DA, and KS participated in the design of the study and wrote the manuscript. All authors gave final approval for publication.
Funding
This project was funded by the Biotechnology and Biological Sciences Research Council.
Conflict of Interest Statement
KS is the Invasive Species Programme Officer for the International Union for Conservation of Nature.
The remaining authors declare that the research was conducted in the absence of any commercial or financial relationships that could be construed as a potential conflict of interest.
Acknowledgments
We thank the International Union for Conservation of Nature (IUCN) for assistance with the study. We thank Prof. Andrew Balmford for feedback on the study.
Supplementary Material
The Supplementary Material for this article can be found online at: https://www.frontiersin.org/articles/10.3389/fevo.2019.00297/full#supplementary-material
References
Bellard, C., Cassey, P., and Blackburn, T. M. (2016). Alien species as a driver of recent extinctions. Biol. Lett. 12, 1–4. doi: 10.1098/rsbl.2015.0623
Bland, L. M., Bielby, J., Kearney, S., Orme, C. D. L., Watson, J. E. M., and Collen, B. (2017). Toward reassessing data-deficient species. Conserv. Biol. 31, 531–539. doi: 10.1111/cobi.12850
Bombaci, S. P., Farr, C. M., Gallo, H. T., Mangan, A. M., Stinson, L. T., Kaushik, M., et al. (2016). Using Twitter to communicate conservation science from a professional conference. Conserv. Biol. 30, 216–225. doi: 10.1111/cobi.12570.
Brummitt, N. A., Bachman, S. P., Griffiths-Lee, J., Lutz, M., Moat, J. F., Farjon, A., et al. (2015). Green plants in the red: a baseline global assessment for the IUCN sampled red list index for plants. PLoS ONE 10:e0135152. doi: 10.1371/journal.pone.0135152
Ceballos, G., Ehrlich, P. R., and Dirzo, R. (2017). Biological annihilation via the ongoing sixth mass extinction signaled by vertebrate population losses and declines. Proc. Natl. Acad. Sci. U.S.A. 114, E6089–E6096. doi: 10.1073/pnas.1704949114.
Costanza, R., de Groot, R., Braat, L., Kubiszewski, I., Fioramonti, L., Sutton, P., et al. (2017). Twenty years of ecosystem services: how far have we come and how far do we still need to go? Ecosyst. Serv. 28, 1–16. doi: 10.1016/j.ecoser.2017.09.008
Elsevier (2018). Scopus. Available online at: https://www.scopus.com (accessed June 13, 2018).
Hooper, D. U., Chapin, F. S., Ewel, J. J., Hector, A., Inchausti, P., Lavorel, S., et al. (2005). Effects of biodiversity on ecosystem functioning: a consensus of current knowledge. Ecol. Monogr. 75, 3–35. doi: 10.1890/04-0922
IUCN (2017). The IUCN Red List of Threatened Species. Version 2017-3. Available online at: http://www.iucnredlist.org (accessed June 30, 2018).
IUCN (2018). International Union for Conservation of Nature. Website data. Available online at: https://www.iucn.org (accessed July 28, 2018).
IUCN (2019). Red List Assessment Process. Available online at: https://www.iucnredlist.org/assessment/process (accessed July 5, 2019).
Larsen, P. (2016). The good, the ugly and the dirty harry's of conservation: rethinking the anthropology of conservation NGOs. Conserv. Soc. 14:21. doi: 10.4103/0972-4923.182800.
Mace, G. M., Norris, K., and Fitter, A. H. (2012). Biodiversity and ecosystem services: a multilayered relationship. Trends Ecol. Evol. 27, 19–26. doi: 10.1016/j.tree.2011.08.006
Mazor, T., Doropoulos, C., Schwarzmueller, F., Gladish, D. W., Kumaran, N., Merkel, K., et al. (2018). Global mismatch of policy and research on drivers of biodiversity loss. Nat. Ecol. Evol. 2, 1071–1074. doi: 10.1038/s41559-018-0563-x
R Core Team (2018). R: A Language and Environment for Statistical Computing. R Foundation for Statistical Computing, Vienna. Available online at: https://www.R-project.org/; Available at: http://www.gbif.org/resource/81287
SurveyMonkey Inc. (2018). SurveyMonkey Inc., San Mateo, CA. Available online at: www.surveymonkey.com
Titley, M. A., Snaddon, J. L., and Turner, E. C. (2017). Scientific research on animal biodiversity is systematically biased towards vertebrates and temperate regions. PLoS ONE 12:e0189577. doi: 10.1371/journal.pone.0189577
Twitter (2018). Twitter, Inc. Available online at: https://developer.twitter.com/en.html (accessed June 13, 2018).
Waldron, A., Miller, D. C., Redding, D., Mooers, A., Kuhn, T. S., Nibbelink, N., et al. (2017). Reductions in global biodiversity loss predicted from conservation spending. Nature 551, 364–367. doi: 10.1038/nature24295
Keywords: biodiversity, conservation, red list, global effort, staff time, research, social media, global priorities
Citation: Willer DF, Smith K and Aldridge DC (2019) Matches and Mismatches Between Global Conservation Efforts and Global Conservation Priorities. Front. Ecol. Evol. 7:297. doi: 10.3389/fevo.2019.00297
Received: 16 February 2019; Accepted: 24 July 2019;
Published: 07 August 2019.
Edited by:
Matt W. Hayward, University of Newcastle, AustraliaReviewed by:
Spartaco Gippoliti, Storia della Fauna, ItalyAlienor Chauvenet, Griffith Health, Griffith University, Australia
Copyright © 2019 Willer, Smith and Aldridge. This is an open-access article distributed under the terms of the Creative Commons Attribution License (CC BY). The use, distribution or reproduction in other forums is permitted, provided the original author(s) and the copyright owner(s) are credited and that the original publication in this journal is cited, in accordance with accepted academic practice. No use, distribution or reproduction is permitted which does not comply with these terms.
*Correspondence: David F. Willer, ZHc0NjBAY2FtLmFjLnVr