 Ladd M. Irvine
 Daniel M. Palacios
 Barbara A. Lagerquist
 Bruce R. Mate
- Department of Fisheries and Wildlife, Marine Mammal Institute, Oregon State University, Newport, OR, United States
Intermediate-duration archival tags were attached to eight blue whales (Balaenoptera musculus; four females, three males, one of unknown sex), and five fin whales (B. physalus; two females, one male, two of unknown sex) off southern California, USA, in summer 2014 and 2015. Tags logged 1-Hz data from tri-axial accelerometers, magnetometers, and a depth sensor, while acquiring Fastloc GPS locations. Tag attachment duration ranged from 18.3 to 28.9 d for blue whales and 4.9–16.0 d for fin whales, recording 1,030–4,603 dives and 95–3,338 GPS locations per whale across both species. Feeding lunges (identified from accelerometer data) were used to characterize “feeding bouts” (i.e., sequences of feeding dives with <60 min of consecutive non-feeding dives), within-bout behavior, and to examine the spatial distribution of feeding effort. Whales fed near the tagging locations (Point Mugu and San Miguel Island) for up to 7 d before dispersing as far south as Ensenada, Mexico, and north to Cape Mendocino, California. Dispersal within southern California waters differed by sex in both species with males undertaking offshore, circuitous excursions, while females remained more coastal, suggesting that movement patterns on the feeding grounds may not be exclusively related to energy gain. Feeding bout characteristics were similar for both species, with the median bout having 24 dives and lasting 3.3 h for blue whales (n = 242), and 19 dives while lasting 2.7 h for fin whales (n = 59). Bout duration was positively correlated with the number of feeding lunges per dive within a bout for both species, suggesting whales left poor-quality prey patches quickly but fed intensively for up to 34.9 h when prey was abundant. Feeding bouts occurred further apart as the distance from shore increased, but there was no corresponding difference in the number of feeding lunges per dive, suggesting the whales were feeding at the same rate throughout their range, but that prey was more dispersed in offshore waters. This may be evidence of two feeding strategies, with spatially aggregated foraging around highly localized, topographically forced upwelling centers nearshore, and more dispersed foraging in larger areas of elevated, but patchy, productivity offshore.
Introduction
Blue (Balaenoptera musculus) and fin (B. physalus) whales are the two largest species of cetaceans and both occur off the west coast of the United States (USA). Blue whales arrive seasonally beginning in the late spring-early summer and feed on aggregations of krill (Thysanoessa spinifera and Euphausia pacifica; Fiedler et al., 1998; Croll et al., 2005; Nickels et al., 2018) until the late fall-early winter when they migrate south to breeding areas off Baja California, Mexico, in the Gulf of California, and near an offshore oceanographic feature called the Costa Rica Dome (Mate et al., 1999; Bailey et al., 2010; Irvine et al., 2014). Although the seasonal movements of fin whales are less well-understood, they occur year-round off southern California (Stafford et al., 2009; Sirovic et al., 2015; Scales et al., 2017) suggesting they do not follow the typical baleen whale pattern of migrating to lower latitudes during the winter to breed and calve (see also Edwards et al., 2015; Geijer et al., 2016; Jiménez López et al., 2019). Fin whales primarily feed on the same species of krill as blue whales, but can also feed on small fish and squid (Pauly et al., 1998). Both species are listed in the USA as “Endangered” under the Endangered Species Act and consequently are labeled as “Depleted” and “Strategic” stocks under the Marine Mammal Protection Act. Additionally, blue whales are considered “Endangered” and fin whales “Vulnerable” according to the IUCN Red List of Threatened Species (Cooke, 2018a,b).
As with other rorquals, blue and fin whales feed by engulfing large volumes of water and schooling prey, then expelling the water through fibrous baleen plates to retain the prey (Goldbogen et al., 2017). This engulfment, termed “lunge feeding,” occurs during a rapid acceleration through/into a school of prey and can happen multiple times per dive. The evolution of this feeding behavior is closely tied with the animal's large size, as it allows them to efficiently exploit highly concentrated prey patches (Goldbogen et al., 2011, 2012; Goldbogen and Madsen, 2018). In blue whales this feeding behavior has been shown to vary based on local prey concentrations, indicating they are able to adapt foraging strategies to maximize prey capture (Goldbogen et al., 2015) and energetic efficiency (Hazen et al., 2015).
While sexual differences in distribution and behavior are well-documented in toothed whales (Bigg et al., 1990; Whitehead, 2003; Parsons et al., 2009), such dynamics are less well-understood for rorqual whales, which are largely non-sexually dimorphic, but are known to occur (e.g., Laidre et al., 2009). Sex-based differences in acoustic behavior have been documented for both blue and fin whales, with most of the more complex vocal repertoire of each species being produced exclusively by males and believed to be related to reproduction, while singular calls are produced by both sexes in the context of foraging (Croll et al., 2002; Oleson et al., 2007; Stimpert et al., 2015; Lewis et al., 2018). Further, spatial variability in the type and rate of calling has been documented in blue whales off southern California, suggesting there may be spatial separation of behavioral activities (Lewis and Sirovic, 2018), although a lack of direct observation makes the underlying process unclear, as both feeding and reproductive calls are recorded throughout the feeding season in southern California (Lewis and Sirovic, 2018). Considering that animals in southern California waters are exposed to a variety of regional stressors like ship strikes (Berman-Kowalewski et al., 2010; Redfern et al., 2013) and anthropogenic sound (Goldbogen et al., 2013; DeRuiter et al., 2017), a potential spatial segregation arising from behavioral differences between sexes could lead to disproportionate impacts (Sprogis et al., 2016) over short temporal scales (Pirotta et al., 2018) or on long-term population fitness (Pirotta et al., 2019).
To understand broad-scale ecological patterns arising from observed species distributions, including interactions among sympatric species, it is often relevant to understand how fine-scale behavior influences the larger trend (Evans, 2012). The movements and distribution of blue and fin whales at the scale of the eastern North Pacific Ocean have been described using satellite telemetry (Bailey et al., 2010; Irvine et al., 2014; Scales et al., 2017), ship based surveys (Redfern et al., 2013), and acoustic data (Burtenshaw et al., 2004; Sirovic et al., 2015). However, there is little data to explain how the broad-scale distributions of these animals are influenced by variations in behavior at more local scales. Here we used intermediate-duration data-logging tags to examine the fine-scale movements and diving behavior of blue and fin whales off southern and central California over periods of multiple weeks. Our primary goal was to characterize how feeding behavior varies across this region, including potential differences between the sexes and between the two species, which occur in sympatry in this region. Our results indicate a strong spatial and temporal heterogeneity in blue and fin whale foraging behavior, with implications for prey patchiness and quality. As such, this study provides new insights into the underlying drivers of broad-scale movement and occurrence during the feeding season for two of earth's largest predators.
Materials and Methods
Tag Configuration and Deployment
This study used Advanced Dive Behavior (ADB) tags, a configuration of the Wildlife Computers (Seattle, WA, USA) MK-10 time-depth recorder platform, which can record depth, temperature, and tri-axial accelerometer, and magnetometer data at 1-Hz resolution for multiple weeks before releasing from the whale for recovery (Mate et al., 2017). A Fastloc® GPS receiver and patch antenna were included in each tag to acquire GPS-quality locations (Bryant, 2007), along with an Argos Platform Terminal Transmitter for sending GPS location and summarized dive data messages via the satellite-based Argos Data Collection and Location System. Complete details of ADB tag construction and design configuration are provided in Mate et al. (2017).
Tags were deployed on blue and fin whales in southern California waters during August 2014 and July 2015. Field work was supported by the 25.6-m research vessel R/V Pacific Storm. Tags were mounted in a semi-implantable stainless steel housing and deployed at close range (2–4 m) from a 6.7-m rigid-hulled inflatable boat using the Air Rocket Transmitter System, a modified compressed-air line-throwing gun (Heide-Jorgensen et al., 2001; Mate et al., 2007). Tags were deployed 1–4.5 m forward of the dorsal fin of the whale and no more than 20 cm down from the mid-line, following the protocol described in Mate et al. (2007). Tags were programmed to release from their housing for recovery 21 d after the start of field operations or if the tag recorded no change in depth for 24 h, indicating the housing had been shed from the whale and sunk to the bottom with the tag still attached. Following release, tags were located and recovered using an uplink receiver that was capable of acquiring, decoding, and solving Argos-transmitted Fastloc GPS location messages sent by the tags in real time, along with information on the tag's general location and the rate and direction of drift. A discussion of factors affecting attachment duration and tag recovery is presented in Mate et al. (2017).
Whenever possible, skin and blubber samples were collected simultaneously to tagging (on the same surfacing) using a crossbow. Crossbow bolts were fitted with circular cutting tips 4 cm in length and 8 mm in diameter, which removed a plug of skin and blubber from the whale. Sex determination was made from skin samples by amplification of regions on the X and Y chromosomes (Aasen and Medrano, 1990; Gilson et al., 1998).
Data Collection and Transmission
Tags were programmed to collect data from the various sensors (depth, accelerometer, magnetometer, and temperature) at 1 Hz for the duration of the deployment. While deployed, acquisition of a Fastloc GPS location was attempted every 7 min or the next time the whale surfaced after this time had elapsed. All data were stored in an onboard archive for download after tag recovery. The dive summary data from the Argos transmissions were not used in this study, although locations estimated from Argos transmissions (Argos 2016) were used to examine movements of whales whose tags were not recovered. Further details about ADB tag dive summary messages are described in Mate et al. (2017).
Data Analysis
Maps were made using ArcGIS® software ArcMap™ 10.3 by Esri and the ArcGIS Online Ocean Basemap. Data manipulation and analysis for this study was conducted using Matlab (The Mathworks Inc, 2015) and R (R Core Team, 2018). The same suite of analyses were used for both blue and fin whales, except as noted for cases when data for one species were too limited for complete analyses. To detect feeding lunges, the change in the acceleration vector (“Jerk”) was calculated from the accelerometer data as the norm of the difference between consecutive acceleration values (Simon et al., 2012; Allen et al., 2016). The Jerk is thus a measure of rapid changes in acceleration and orientation of the tagged whale. Lunge-feeding events in rorquals are characterized by a peak in Jerk with a coincident increase in the roll angle for multiple seconds, as the whale typically accelerates and rolls when opening its mouth to engulf prey (Goldbogen et al., 2006; Simon et al., 2012; Allen et al., 2016). A subsequent minimum in the Jerk value, as the whale ceases most movement to expel the water and filter out prey, signals the end of the lunge. Together, these three criteria (Jerk maximum, increase in roll, and subsequent Jerk minimum) were used to identify feeding lunges in the data records based on the lunge detection methodology described by Allen et al. (2016), but modified to use a more conservative Jerk peak threshold and without the use of acoustic data. The large number of dives recorded by tags during their deployment periods precluded direct confirmation of each feeding lunge identified by the lunge detection algorithm for the entire data record. Instead, we implemented a validation protocol by randomly selecting 10% of dives from each track and visually reviewing them to estimate the percentage of correctly detected lunges (true positives), falsely detected lunges (false positives), and correctly identified feeding dives (dives with at least one true positive). Validation statistics were summarized for each tag and are presented briefly in the Results section, with a more detailed description in the Supplementary Material.
Dive summaries were generated for each track by isolating any submergence >10 m in depth (hereafter a “dive”) from the tag's depth record and calculating maximum dive depth, dive duration, and the number of lunges that occurred during the dive. The dive end times were then matched to the nearest GPS location recorded by the tag, as locations were generally collected as the whale surfaced from a dive. If there was not a location within 10 min of a dive, a location was estimated by linear interpolation between the temporally closest GPS locations before and after the dive using the dive time to determine where on the line the location should fall. For tracks with less frequent GPS locations this resulted in linear segments of interpolated dive locations that do not represent the exact movement of the whale.
In order to distinguish between series of related feeding dives, a log-survivorship analysis (Holford, 1980; Gentry and Kooyman, 1986) was conducted on the time between feeding dives (i.e., dives with at least one detected lunge) for each tag record. In this case, the log-survivorship analysis graphically showed the number of feeding dive sequences (on a log scale) as a function of the time between them, and the goal was to identify a point along the curve where the number of feeding dive sequences stabilized as time between feeding dives continued to increase, suggesting a natural break in the data. Sequences of dives defined by this criterion were isolated and labeled “feeding bouts.” To assess the horizontal extent of each feeding bout and the overall spatial scale of foraging effort, minimum convex polygons were created using the corresponding dive locations for bouts with at least three GPS locations (i.e., not including bouts with interpolated dive locations; see Supplementary Figure 1). We report feeding bout summary statistics including bout duration, time, and distance between consecutive bouts, and distance to the closest bout from the entire track. We also report summaries of dives within each feeding bout, including number of dives per bout, mean maximum dive depth and duration, mean number of lunges per dive, and the number of dives without a lunge. The univariate distributions of feeding bout metrics were assessed graphically using probability density plots, while inter-species comparisons of the distributions were made using Bhattacharyya's similarity coefficient (Bhattacharyya, 1943; Guillerme and Cooper, 2016). When Bhattacharyya's similarity coefficient between two distributions is <0.05, the distributions are significantly different, and when the coefficient is >0.95, the distributions are significantly similar. Values between these two thresholds can be used to indicate the probability of overlap between the distributions but cannot be used to determine if they are significantly different or similar (Guillerme and Cooper, 2016).
Trends among these metrics were formally assessed using generalized linear mixed models (GLMMs), with the tag number as a random-effect grouping variable to account for differences between individuals, a fixed-effect “species” indicator variable, and an interaction term between the predictor of interest and the species indicator variable when inter-species comparisons were desired (Bolker et al., 2009; Harrison et al., 2018). Variables were log-transformed as needed based on graphical assessment of the data. Models were implemented in R using the lme4 package (Bates et al., 2015) or GLMMadaptive (Rizopoulos, 2019) using a two part/hurdle model if it was necessary to account for zero inflated data (GLMMzi). P-values were derived using the lmerTest package (Kuznetsova et al., 2017). We report and discuss p-values from these GLMMs in the context of levels of support for the outcome (rather than as a binary threshold of significance), with p-values <0.01 offering strong support, p-values between 0.01 and 0.1 offering suggestive, but inconclusive support, and p-values >0.1 offering no support (Gerrodette, 2011; Greenland et al., 2016; Wasserstein and Lazar, 2016).
To further examine fine-scale differences in feeding behavior between individuals, we isolated sections of tracks where two whales were in proximity to each other. Whales were considered to be in proximity when locations from one track were no more than 1 km away from another whale within 30 min from the time of the location. We present a representative map of these track sections and also report dive summary statistics for each section of track in close proximity to another whale for comparison between individuals.
Results
During this study, eight blue whales were tracked for a median of 22.4 d (range = 18.3–28.9 d; Table 1) and five fin whales were tracked for a median of 14.2 d (range = 4.9–16.0 d; Table 1). Tags were deployed near Point Mugu in 2014 and off the west end of San Miguel Island in 2015 with the exception of blue Whale # 2015_838, which was deployed near Point Mugu in 2015 (Figure 1). All eight blue whale tags and three of five fin whale tags were recovered. In two cases the tags were found on the shore several years after having been thought to be lost.
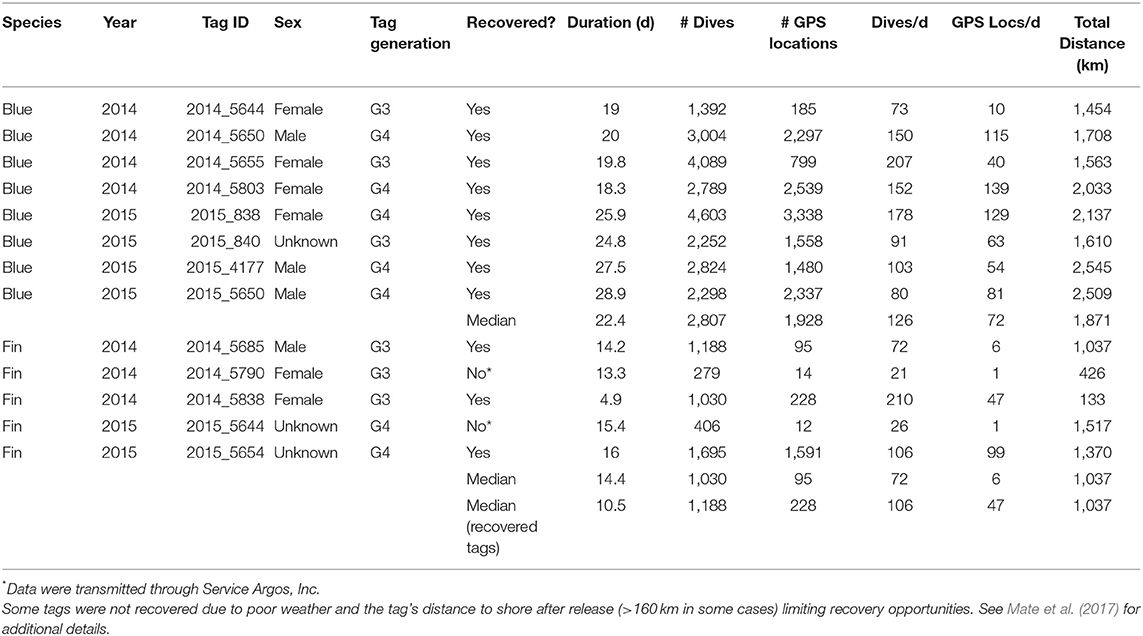
Table 1. Deployment summary for ADB tags attached to eight blue and five fin whales in southern California waters during August 2014 and July 2015.
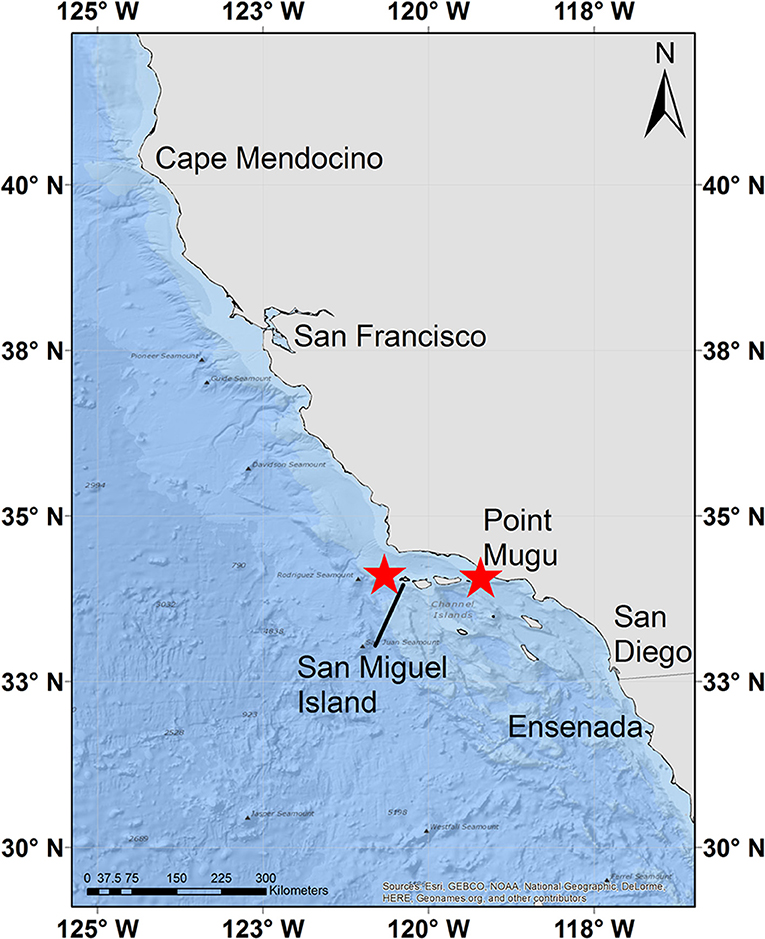
Figure 1. A map of the study area with ADB tag deployment locations marked by red stars.
Tagged animals of both species dispersed as far north as Cape Mendocino in northern California, and as far south as Ensenada, Baja California, Mexico, during their tracking periods (Figures 2, 3 and Supplementary Figure 4). However, most of the tracks, and the majority of feeding dives (89%) occurred within southern California waters. Two blue whales (Whale # 2014_5650 and Whale # 2015_4177) and one fin whale (Whale # 2014_5685) made a clockwise loop across a large portion of southern California waters. All three of these whales were male, while females remained closer to shore until leaving southern California waters (Figures 2, 3).
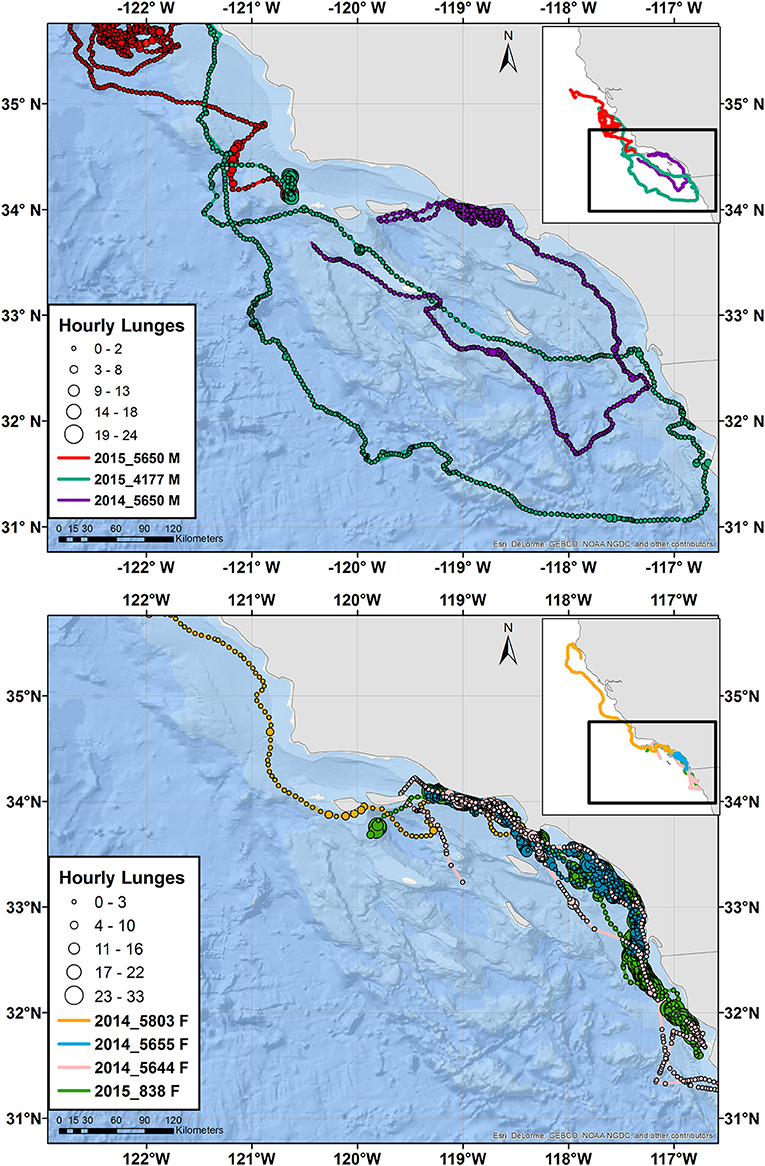
Figure 2. Tracks of male (top) and female (bottom) blue whales instrumented with ADB tags in August 2014 and July 2015. Main maps zoom in on southern California, while the inset maps show the full extent of the tracks with the zoomed region identified by a black square. Circles indicate hourly average locations, with circle size scaling to number of feeding lunges per hour and circle color indicating a different individual, per the tag number shown in the key. The track for one additional blue whale of unknown sex is presented in Supplementary Figure 4.
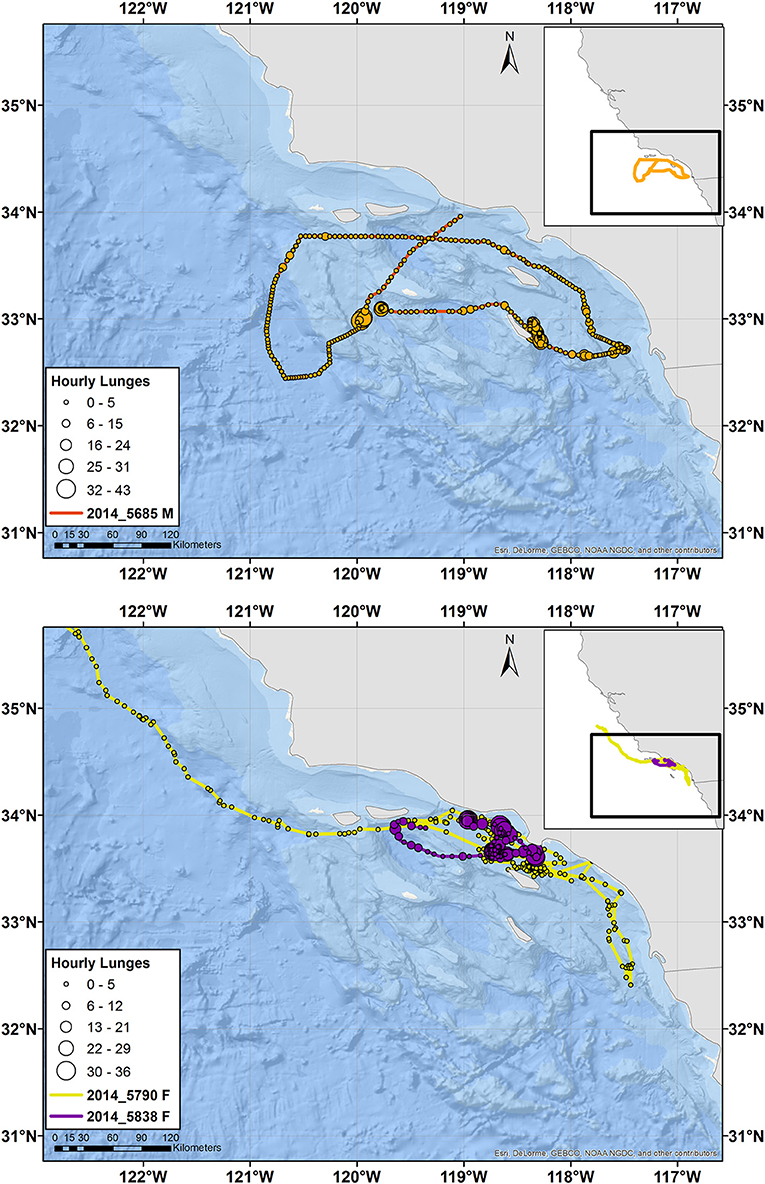
Figure 3. Tracks of male (top) and female (bottom) fin whales instrumented with ADB tags off southern California in August 2014. Main maps zoom in on southern California, while the inset maps show the full extent of the tracks with the zoomed region identified by a black square. Circles indicate hourly average locations, with circle size scaling to number of feeding lunges per hour and circle color indicating a different individual, per the tag number shown in the key. Note that the tag for Whale # 2014_5790 was not recovered and therefore no feeding data are available, but locations received through Argos are shown. The tracks for two additional fin whales of unknown sex are presented in Supplementary Figure 4.
The eight blue whale ADB tags recorded a median of 126 dives > 10 m in depth per day (range = 73–207 dives/d; Table 1), whereas the three recovered fin whale tags recorded a median of 106 dives/d (range = 84–210 dives/d; Table 1). The number of Fastloc GPS locations recorded by the tags varied widely, with recovered blue whale tags recording a median of 72 locations per day (range = 10–139; Table 1) and recovered fin whale tags recording a median of 46.5 locations per day (range = 1–99; Table 1). Some variability in the number of locations was likely due to different hardware configurations within the tags, as all tags using newer Fastloc v. 3 technology recorded at least 54 locations per day while only one tag using Fastloc v. 1 recorded more than 47 locations per day (Table 1; see also Mate et al., 2017).
Validation of the feeding lunge detection algorithm indicated a mean true positive rate of 70.5% (sd = 20.1%) and a mean false positive rate of 13.6% (sd = 10.0%). The mean percentage of correctly identified feeding dives (dives with at least one lunge) was 85.3% (sd = 16.8%), suggesting mis-classified lunges (both false positive or false negative) often occurred during dives with other correctly identified lunges. Additional details of the validation methodology and results are presented in the Supplementary Materials.
Tagged whales of both species generally made deeper dives during the daytime than at night (Supplementary Figures 2, 3 and Supplementary Table 1), although there was high variability within and between individuals, and daytime surface feeding was recorded on multiple occasions both visually while in the field and in the data record. Daytime dive depths were deepest near San Miguel Island where maximum dive depths reached 362 m for blue whales and 365 m for fin whales. Dive durations were as long as 30.7 min for blue whales and 23.1 min for fin whales (Supplementary Figures 2, 3 and Supplementary Table 1). Almost no feeding lunges were recorded during dives >20 min in duration for either species. Feeding activity (as measured by lunge-feeding events) generally took place during daylight hours, although nighttime lunges were recorded on some occasions for both species (Supplementary Figures 2, 3 and Supplementary Table 1). Most blue whale feeding effort was concentrated near the tagging areas, with additional areas of elevated feeding effort southwest of San Miguel Island and offshore of central California (Figure 2 and Supplementary Figure 4). Whales tagged near Point Mugu also heavily used the nearshore waters extending south to San Diego. Tagged fin whales showed a similar trend (Figure 3 and Supplementary Figure 4).
Log-survivorship curves for all tags stabilized at 60 min or less (Supplementary Figure 5), so a criterion of at least 60 min with no feeding dives was used to differentiate between feeding bouts. A total of 242 blue whale feeding bouts and 59 fin whale feeding bouts were identified in the tag records (Tables 2, 3). For blue whales, the median number of feeding bouts made per whale was higher in 2014 (median = 35, range = 22–38, 4 tags) compared to 2015 (median = 23, range = 17–45, 4 tags), despite tags remaining attached for a median of over 7 d longer in 2015 (Table 1). The number of fin whale feeding bouts was more similar across years (range = 13–25 bouts, 3 tags), although the more limited number and duration of tracks was too small for inter-annual comparisons. Across both years, feeding bouts were separated by a median of 5.7 h (range = 1–231.9 h) for blue whales and a median of 3.1 h (range = 1–227.6 h) for fin whales, and were generally small in area (median = 5.6 km2, range = 0.003–546.5 km2 for blue whales; and median = 7.6 km2, range = 0.001–317.1 km2 for fin whales). The median blue whale feeding bout contained 23.5 feeding dives over 3.3 h (range = 4–360 feeding dives and 0.2–34.9 h, respectively), while the median fin whale feeding bout contained 19 feeding dives and lasted 2.7 h (range = 4–142 feeding dives and 0.3–19.6 h, respectively; Tables 2, 3).
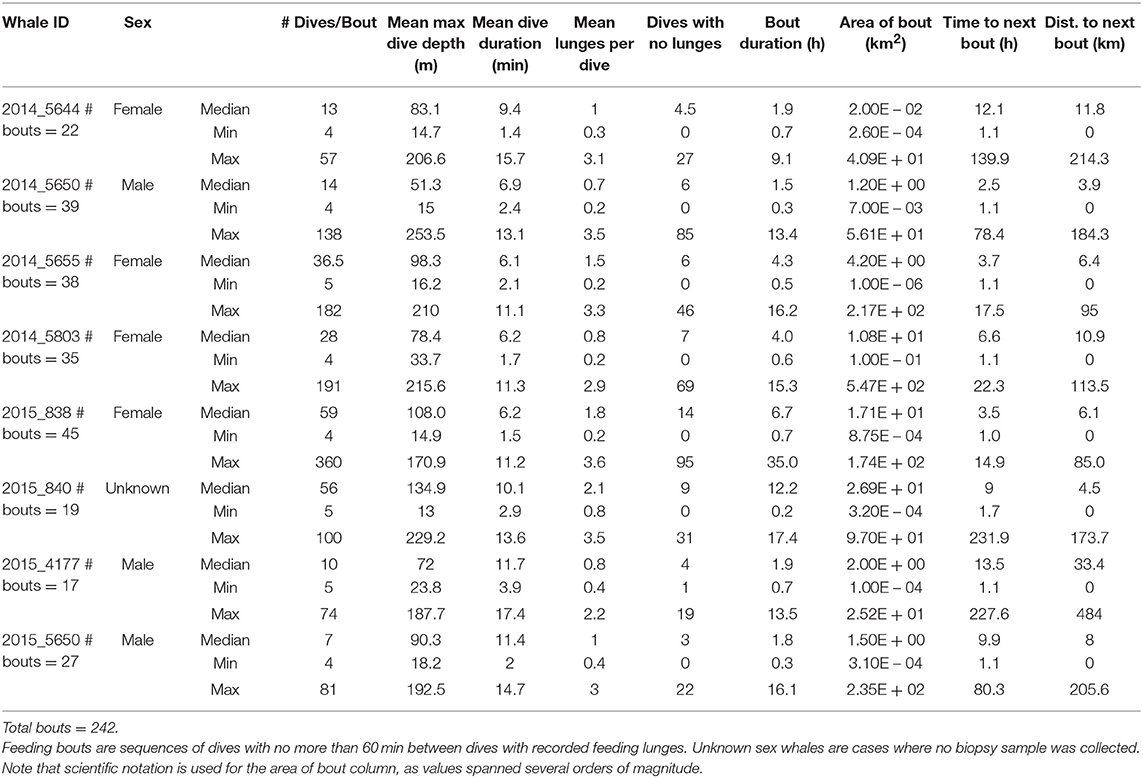
Table 2. Summary of dives occurring during feeding bouts made by eight blue whales instrumented with ADB tags off southern California in August 2014 and July 2015.
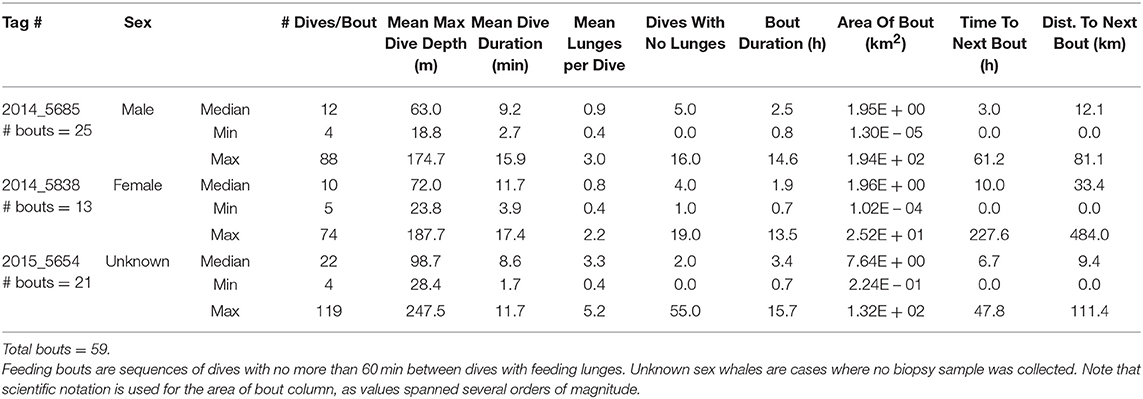
Table 3. Summary of dives occurring during feeding bouts made by three fin whales instrumented with ADB tags off southern California in August 2014 and July 2015.
Median bout duration for the four female blue whale tags (3.9 h) was twice that of males (1.8 h) although median bout duration of Whale # 2014_5644 (a female) was = 1.9 h. Female feeding bouts had a lower proportion of non-feeding dives than those of males (0.26 vs. 0.38; Table 2). The distribution of feeding bout duration was similar for both blue and fin whales (Bhattacharyya's similarity coefficient = 0.934), with a strong peak near 2 h and a secondary peak at 14–15 h (Figure 4). Mean feeding lunges per dive within bouts varied substantially for both blue and fin whales, but feeding bout duration increased with increasing mean lunges per dive (GLMM, p-value <0.001), with no significant difference between blue and fin whales (GLMM, interaction p-value = 0.84; Figure 5). The median bout duration for one blue whale (Whale # 2015_840, of unknown sex) was 12.2 h, suggesting it fed almost continuously during daylight hours on many days. Another blue whale (# 2015_838) fed continuously for almost 1.5 days (Table 2 and Figure 2).
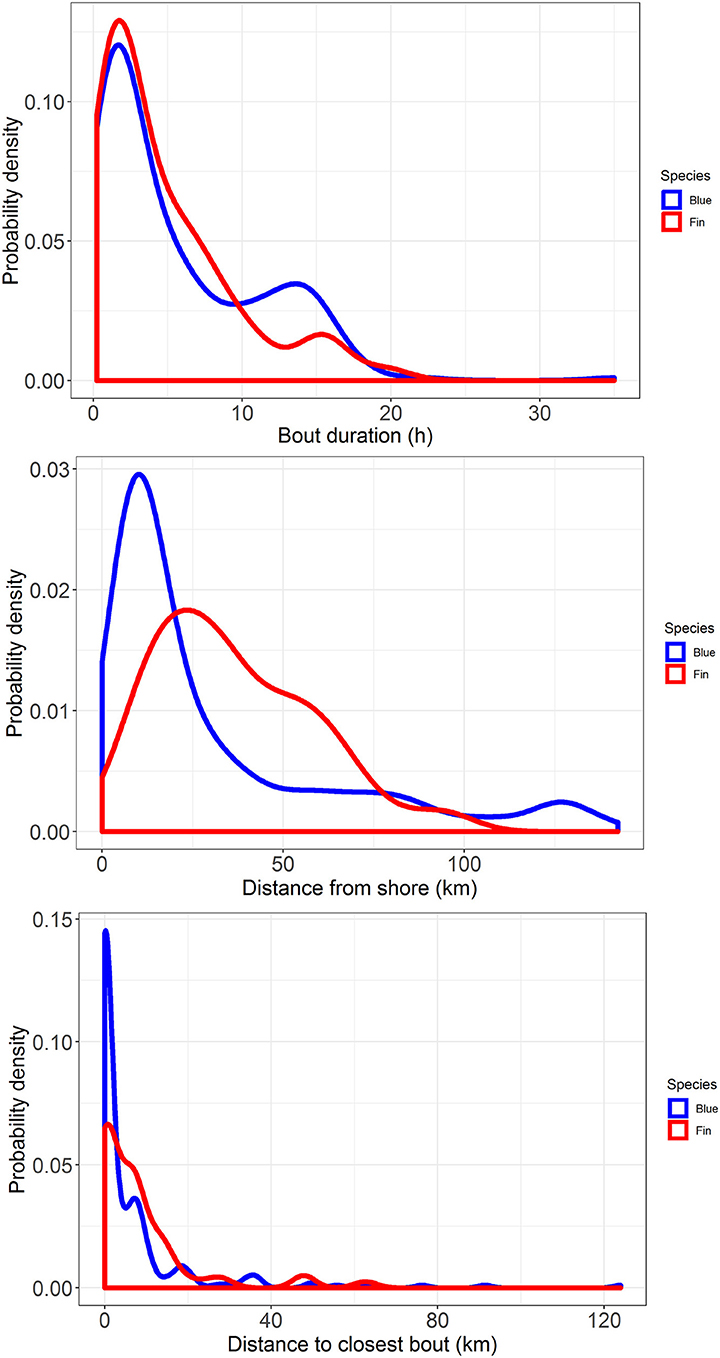
Figure 4. Probability density plots of feeding bout duration (top), distance from shore (middle), and distance to the closest bout (bottom) for blue whales (blue lines), and fin whales (red lines) tracked off southern California with ADB tags in August 2014 and July 2015.
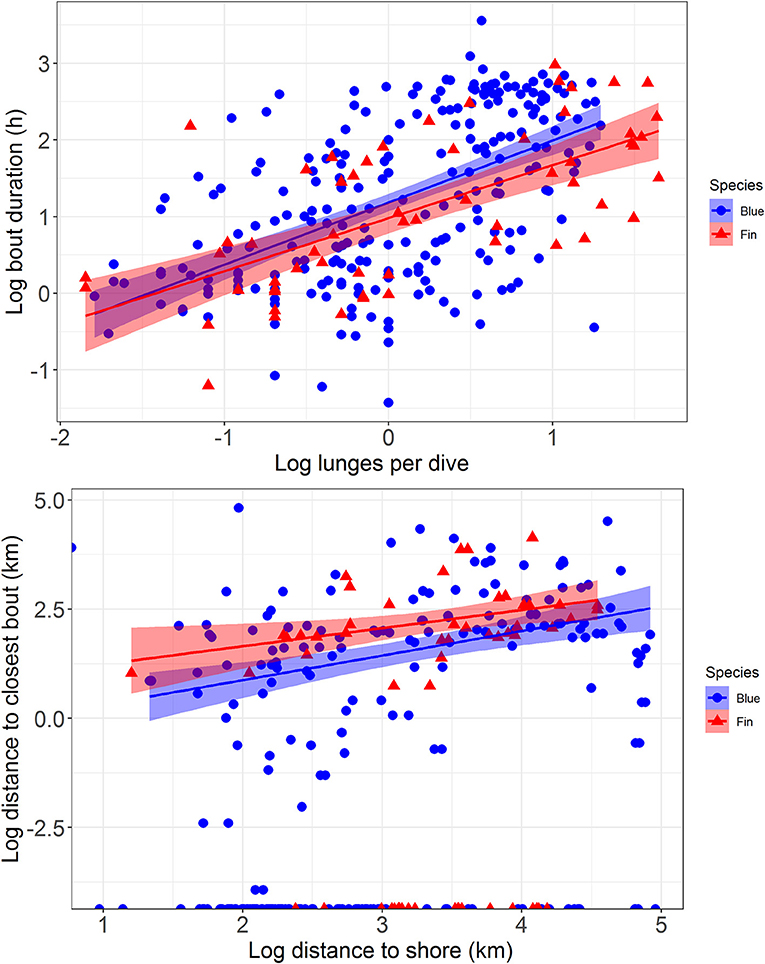
Figure 5. The relationship between average number of feeding lunges per dive within a feeding bout and the duration of that bout (top) and the distance to shore of a feeding bout compared to the distance to the next closest bout (bottom), with regression lines and 95% confidence intervals fitted to the data. Data are from blue whales (blue circles and lines) and fin whales (red triangles and lines) tracked with ADB tags off southern California in August 2014 and July 2015.
Comparison of the distributions for closest feeding bout and for the distance to shore of a feeding bout between blue and fin whales (Figure 4) using Bhattacharyya's similarity coefficient was inconclusive in terms of providing support for similarity or difference between them, although the probability of overlap was relatively high in both cases (Bhattacharyya's similarity coefficient = 0.840 and 0.833, respectively). Investigation of the distance between closest feeding bouts required accounting for zero-inflated data, as 44% of bouts overlapped spatially with at least one other bout from the same track, resulting in many zero distances. As the distance to shore of a feeding bout increased, the distance between closest feeding bouts also increased (GLMMzi, p-value <0.005), indicating that feeding bouts were more dispersed further offshore (Figure 5). However, there was no significant difference in the average number of lunges per dive made within bouts as a function of the distance from shore (GLMM, p-value = 0.77), suggesting the whales were feeding at the same rate throughout the study area. There was suggestive but inconclusive evidence that bouts were more dispersed for fin whales compared to blue whales after accounting for the distance to shore (GLMMzi p-value = 0.093), but there were no inter-species differences in the effect of distance to shore on both the distance to the closest bout (GLMMzi interaction p-value = 0.80) or the number of lunges per dive (GLMM interaction p-value = 0.96).
In two cases, a tagged whale passed through an area without stopping, where another tagged whale of the same species was feeding. Blue Whale # 2015_4177 (a male) passed through an area 1 day after Whale # 2015_840 (of unknown sex) had fed nearly continuously during daylight hours in the same location and more broadly for 12 d (Supplementary Figure 6). Similarly, fin Whale # 2014_5685 (a male) passed through a different area <1 day before Whale # 2014_5838 (a female) spent 4 d feeding there (not shown). Both whales passing through were male and their movements were part of a larger circuit of southern California waters (Figures 2, 3). The males' dive records were visually reviewed to ensure no feeding lunges had been missed by the lunge detection algorithm during this period of time.
One pair of blue whales each from 2014 to 2015 were recorded feeding in the same geographic space, in one case showing strong differences in dive behavior and in the other showing strong similarities. Whale # 2014_5650 (a male) and Whale # 2014_5803 (a female), tagged off Point Mugu, were in close proximity 13 times across an 8-d period, including times with both feeding and non-feeding behavior (Supplementary Table 2). While the characteristics of close-proximity periods were highly variable, Whale # 2014_5803 generally dove more deeply and recorded more feeding lunges than Whale # 2014_5650. On two occasions it dove to over twice the depth as Whale # 2014_5650, and in one instance, was foraging when Whale # 2014_5650 was not (Supplementary Table 2). During one of the longer periods of close proximity, both whales appeared to have been behaving similarly after passing closer than 0.5 km from each other (Supplementary Figures 7, 8), with both whales making foraging dives to a similar depth. An hour later, Whale # 2014_5803 was feeding at almost twice the depth as Whale # 2014_5650 (Supplementary Figures 7, 8) while in the same geographic space. In contrast, in 2015, Whale # 2015_4177 (a male) and Whale # 2015_5650 (also a male), tagged off San Miguel Island, fed in close proximity for 4.5 h on 8 July (the day they were tagged). These whales fed at approximately the same depth (mean maximum dive depth = 273 and 212 m, respectively; Supplementary Figure 9) and shifted their feeding depth shallower during and after sunset with remarkable synchrony. Three other close-proximity events were recorded in 2015 but all were very limited in duration and number of dives recorded, so will not be presented. Other tagged whales from 2014 may have been in close proximity but the smaller number of Fastloc GPS locations collected by those tags did not allow for fine-scale resolution of their movements. In contrast to blue whales, there were no instances of close proximity between tagged fin whales, or between blue and fin whales, despite both being tagged in the same areas; in one case on the same day (e.g., blue Whale # 2014_5655 and fin Whale # 2014_5685), and in two cases of fin whales (Whale #s 2014_5790 and 2014_5838) being tagged on a day when a tagged blue whale (Whale # 2014_5655) was re-sighted nearby.
Discussion
The data presented here constitute the longest continuous dive behavior records collected to date for blue and fin whales, which allowed us to examine fine-scale behavior over timescales that previously have not been possible. Both species were observed and tagged concurrently during this study and subsequently occupied generally similar areas during their tracking periods, allowing for a comparative analysis between these two species, which occur in sympatry off California. Our focus was on characterizing feeding effort and its scales of variability over periods of multiple weeks. Short- to intermediate-duration (<6 h) feeding bouts were most numerous for both species and there was a positive correlation between bout duration and the number of feeding lunges made per dive within a bout. Blue whales have been shown to adjust their behavior and number of lunges made per dive based on the density of prey in the area (Goldbogen et al., 2015; Hazen et al., 2015), so the correlation between bout duration and number of lunges per dive suggests that the whales tracked in this study left lower-density prey patches quickly, while staying longer, and foraging more intensely, in higher-density patches. Some of the observed short-duration bouts may also represent the whales exhausting a highly localized abundance of prey. These results suggest the whales were following the marginal value theorem (Charnov, 1976), a foundational model of ecological theory that postulates that animals feeding in a patchy environment make decisions about when to depart a patch based on their assessment of its value, with the main prediction being that animals should spend more time in patches of higher quality (Mcnair, 1982).
Feeding bouts were more dispersed further offshore, although the whales were able to feed at the same rate throughout southern California waters, as the number of lunges per dive within a feeding bout did not change as a function of distance to shore. While there was evidence of inter-species differences in relation to distance from shore, they may have been the result of the more extensive use of offshore waters or more limited sample size of fin whales. The greater distance between bouts offshore suggests there may be two feeding strategies, with whales concentrating on highly localized, physically forced upwelling centers nearshore, such as off San Miguel Island (Fiedler et al., 1998), and more dispersed areas of elevated productivity offshore, likely driven by nearshore productivity that has been advected offshore, or by open-ocean Ekman pumping (Rykaczewski and Checkley, 2008). This has a range of implications for both habitat modeling and abundance estimation, as well as for managers trying to mitigate anthropogenic interactions, as the multiple scales of behavior and occurrence should be accounted for.
The spatial scale of feeding bouts was highly variable within and between individuals. The size of the feeding bout areas was likely an overestimate, as convex hulls are sensitive to irregular, concave shapes of the underlying points (Burgman and Fox, 2003; Supplementary Figure 1) and GPS locations were somewhat sparse in some cases, such that the number of locations may have been insufficient to define the true extent of the area being used for feeding. Despite this, median feeding bout size for fin and blue whales (5.6 and 7.6 km2, respectively) appeared to correspond with the spatial scale of krill patches described off central California (1.8–7.4 km; Santora et al., 2011a). While some of the feeding bouts were significantly larger than the median values (>200 km2), krill patches up to 18 km in extent have been recorded in some years (Santora et al., 2011a), suggesting the larger feeding bouts may have been indicative of broad-scale areas of elevated krill abundance.
Logistics and expense limit direct study of key prey resources such as krill to fine-scales, from which broader-scale predictions are made and sometimes compared to the distribution of predatory species for validation (Santora et al., 2011a,b, 2014, 2017). Modeled krill distributions have also been used to better understand spatial and temporal aspects of their patchiness (Dorman et al., 2015; Messie and Chavez, 2017). The feeding data for tagged blue and fin whales presented here can offer further insight into the distribution and scale of prey patches across southern and central California waters, similar to how seabird foraging tracks have been used to infer prey availability and patch quality in other areas (Chimienti et al., 2017). Since direct observations of prey abundance were not available for this study, linking blue and fin whale feeding bouts to modeled krill distribution could be an additional step to both validate krill models and tie the overserved whale behavior more directly to prey abundance.
Tagged whale feeding behavior characteristics (like maximum dive depth or lunges per dive) fit into broadly similar ranges across individuals, although there was also evidence of fine-scale variability among individuals within those ranges, exemplified by the instances where two tagged blue whales (Whale # 2014_5803 and Whale # 2014_5650) were feeding in close proximity to one another but at different depths. Without knowing the structure of the prey field, it is difficult to be sure if these differences were related to the individual or the composition of prey being exploited. The observed differences may be a reflection of different individuals having different energetic requirements, allowing some whales to forage less intensively on lower prey concentrations (e.g., less dense prey at shallower depths), different age classes, or different prey species. However, across their entire tracks, Whale # 2014_5803 fed at deeper depths than Whale # 2014_5650, and this trend continued when the two occupied the same geographic space, suggesting the observed variability in dive behavior between individuals was likely due to different foraging strategies. It is not unusual for individuals to use a subset of their population's ecological niche due to variations of intrinsic traits or trade-offs that restrict an individual's ability to generalize (Bolnick et al., 2003). Further work is needed to better understand individual differences in rorqual behavior.
Previous work has found evidence of broad-scale spatial segregation between blue and fin whales off southern California (Fiedler et al., 1998; Irvine et al., 2014; Sirovic et al., 2015; Scales et al., 2017). However, our results showed that feeding behavior of tagged blue and fin whales was similar over a broad scale, with feeding occurring in relatively localized areas (median bout duration = 3.3 and 2.7 h, respectively; median bout area = 5.6 and 7.6 km2, respectively) and with similar non-feeding periods in between (median time between bouts = 5.7 and 3.1 h, respectively). At finer scales, the characteristics of individual feeding bouts were also similar between the two species, with the exception that fin whales recorded a higher maximum number of lunges per dive than blue whales (5.2 vs. 3.6, on average), consistent with previously observed species-specific differences in feeding rates (Friedlaender et al., 2015).
The observed similarities in feeding behaviors between the two species are likely a result of the highly specialized nature of lunge-feeding behavior (Goldbogen et al., 2006, 2011, 2017; Cade et al., 2016) and suggests the whales were feeding on krill given their highly stereotyped behavior (Cade et al., 2016). This further suggests the two species may potentially compete for a similar prey resource. Variations in the target prey species (Fossette et al., 2017), and even life stage of the same krill species (Santora et al., 2010), have also been shown to affect the spatial distribution of sympatric whale species. There was suggestive evidence that fin whale feeding bouts were more dispersed compared to blue whales, so it is possible that fine scale differences in the timing or location of feeding between the two species may be the underlying driver of the previously observed broad-scale differences in spatial distribution (Fiedler et al., 1998; Irvine et al., 2014; Sirovic et al., 2015; Scales et al., 2017). However, without an understanding of the underlying distribution and demographics of the local prey resources, it is difficult to attribute a reason to any inter-species differences in the spatial distribution of fine-scale feeding we observed.
Three tagged whales (two blue and one fin; all males) made clockwise circuits of southern California waters with only limited feeding effort, despite passing through areas where other tagged whales were feeding. Blue whales have been shown to adjust their dive behavior based on the density of prey in the area (Goldbogen et al., 2015; Hazen et al., 2015), so it is possible they encountered prey in insufficient concentrations for them to feed upon. More broadly, males and females of central-place foragers are known to have different sex-based foraging strategies arising from different energetic requirements during reproduction and resulting in differential exploitation of the offshore and coastal environment (Breed et al., 2006; Austin et al., 2019). A similar process could be driving the observed differences between male blue and fin whales. Alternatively, blue whales are known to engage in social behavior while in southern California (Lomac-MacNair and Smultea, 2016). Visual inspection of the tag records revealed that many dives made by individuals of both species during the circuits of offshore waters had the characteristics of dives made while whales are vocalizing (shallow, flat-bottomed, minimal acceleration; see Calambokidis et al., 2007; Oleson et al., 2007; Stimpert et al., 2015). Additionally, it has been suggested that the better acoustic propagation properties of offshore waters (Sirovic et al., 2015) make them advantageous for reproductive calls (Lewis and Sirovic, 2018). Thus, we speculate these circuits in southern California waters by males of both species were related to reproduction, although we caution that this is based on a rather small number of individuals. Little is known about blue and fin whale breeding behavior, but our interpretation implies that courtship, or at least advertising and searching for a potential mate, may begin while on the feeding grounds.
The potential difference in movement and areas occupied by males and females has the added implication of possible sex-based differences in exposure to regional stressors like anthropogenic sound (Goldbogen et al., 2013; DeRuiter et al., 2017) or ship strikes (Berman-Kowalewski et al., 2010; Redfern et al., 2013), which are of particular concern in the Southern California Bight. Differing levels of exposure to anthropogenic stressors arising from sexual segregation is a common situation for wildlife (Sprogis et al., 2016), and is especially problematic if it occurs to a species where one sex may be more susceptible to such impacts (Symons et al., 2014; Baird et al., 2015). If further studies confirm our observations about sex–specific differences in habitat use (at least within southern California), managers may need to consider mitigation strategies that explicitly address differential impacts based on sex.
The movements of whales on the feeding grounds are generally assumed to be driven by the search for prey, such that fine-scale behavior can be directly linked to broad-scale ecological patterns like distribution. The results presented here support this idea, showing whales of both species quickly left presumably poor-quality prey patches, with the implication that variable prey density drives local whale movements, while the existence of multiple, persistent hotspots of krill aggregation along the west coast of the USA drive the broad-scale seasonal movement pattern (Abrahms et al., 2019; Palacios et al., 2019). However, sex also appeared to influence movement patterns and habitat use, at least within southern California waters. While this result is based on a relatively limited number of individuals, it constitutes a substantial refinement to our understanding of blue and fin whale behavior on the feeding grounds. Continuing to link fine-scale behavior to broader-scale movement is an important area of research, which was aided by the comparatively long data records generated by the tags used in this study. Developing a better understanding of the underlying mechanisms driving broad-scale behavior is critical to better assist the recovery of these endangered whales.
Data Availability
The data used in this study are published as a Movebank Data Repository under a Creative Commons Zero license (Irvine et al., 2019).
Ethics Statement
Tagging was conducted under the authorization of National Marine Fisheries Service Marine Mammal Protection Act/Endangered Species Act Research/Enhancement Permit No. 14856 and Oregon State University Institutional Animal Care and Use Committee Permit No. 4495.
Author Contributions
LI conceived the study, led field work, conducted the data analysis, and drafted the manuscript. DP helped secure funding for the project, helped conceive the study, participated in the field work, consulted on analysis methodologies, and critically reviewed the manuscript. BL participated in the field work, assisted with data analysis, and critically reviewed the manuscript. BM secured funding for the project and critically reviewed the manuscript.
Funding
Funding for this study was provided by the Department of the Navy, Commander, U.S. Pacific Fleet under the Marine Species Monitoring Program via subcontract with HDR, Inc. (Contract No. N62470-15-D-8006). We thank Jessica Bredvik (Naval Facilities Engineering Command, Southwest) for technical and contract support, and Kristen Ampela (HDR, Inc.) for project management.
Conflict of Interest Statement
The authors declare that the research was conducted in the absence of any commercial or financial relationships that could be construed as a potential conflict of interest.
Acknowledgments
We thank the people who assisted with tagging, including Tomas Follett, Craig Hayslip, Theresa Kirchner, and Natalie Mastick, as well as the crew of the R/V Pacific Storm. We thank C. Scott Baker and Debbie Steel of the Cetacean Conservation and Genomics Laboratory at Oregon State University for genetic sex determination of biopsy samples of tagged whales. The Argos Data Collection and Location System was used for this project (http://www.argos-system.org/). The system is operated by CLS. Argos is an international program that relies on instruments provided by the French Space Agency (CNES) flown on polar-orbiting satellites operated by NOAA, EUMETSAT, and the Indian Space Research Organization (ISRO). We also thank two reviewers and the Topic Editor San Boutin for helpful comments that significantly improved earlier drafts of this manuscript.
Supplementary Material
The Supplementary Material for this article can be found online at: https://www.frontiersin.org/articles/10.3389/fevo.2019.00338/full#supplementary-material
References
Aasen, E., and Medrano, J. F. (1990). Amplification of the ZFY and ZFX genes for sex identification in humans, cattle, sheep and goats. Bio Technol. 8, 1279–1281. doi: 10.1038/nbt1290-1279
Abrahms, B., Hazen, E. L., Aikens, E. O., Savoca, M. S., Goldbogen, J. A., Bograd, S. J., et al. (2019). Memory and resource tracking drive blue whale migrations. Proc. Natl. Acad. Sci. U.S.A. 116, 5582–5587. doi: 10.1073/pnas.1819031116
Allen, A. N., Goldbogen, J. A., Friedlaender, A. S., and Calambokidis, J. (2016). Development of an automated method of detecting stereotyped feeding events in multisensor data from tagged rorqual whales. Ecol. Evol. 6, 7522–7535. doi: 10.1002/ece3.2386
Argos (2016). Argos User's Manual 2007–2016. Collecte Localisation Satellites. Available online at: http://www.argos-system.org/manual/
Austin, R. E., De Pascalis, F., Arnould, J. P. Y., Haakonsson, J., Votier, S. C., Ebanks-Petrie, G., et al. (2019). A sex-influenced flexible foraging strategy in a tropical seabird, the magnificent frigatebird. Mar. Ecol. Prog. Ser. 611, 203–214. doi: 10.3354/meps12859
Bailey, H., Mate, B. R., Palacios, D. M., Irvine, L., Bograd, S. J., and Costa, D. P. (2010). Behavioural estimation of blue whale movements in the northeast pacific from state-space model analysis of satellite tracks. Endanger. Species. Res. 10, 93–106. doi: 10.3354/esr00239
Baird, R. W., Mahaffy, S. D., Gorgone, A. M., Cullins, T., McSweeney, D. J., Oleson, E. M., et al. (2015). False killer whales and fisheries interactions in Hawaiian waters: evidence for sex bias and variation among populations and social groups. Mar. Mamm. Sci. 31, 579–590. doi: 10.1111/mms.12177
Bates, D. M., Mächler, M., Bolker, B., and Walker, S. (2015). Fitting linear mixed-effects models using lme4. J. Statist. Softw. 67, 1–48. doi: 10.18637/jss.v067.i01
Berman-Kowalewski, M., Gulland, F. M. D., Wilkin, S., Calambokidis, J., Mate, B., Cordaro, J., et al. (2010). Association between blue whale (Balaenoptera musculus) mortality and ship strikes along the California coast. Aquat. Mamm. 36, 59–66. doi: 10.1578/AM.36.1.2010.59
Bhattacharyya, A. K. (1943). On a measure of divergence between two statistical populations defined by their probability distributions. Bull. Calcutta Math. Soc. 35, 99–109.
Bigg, M. A., Olesiuk, P. F., Ellis, G. M., Ford, K. B., and Balcomb, K. C III. (1990). Social organization and genealogy of resident killer whales (orcinus orca) in the coastal waters of British Columbia and Washington State. Rep Int Whal Comm. 12, 383–405.
Bolker, B. M., Brooks, M. E., Clark, C. J., Geange, S. W., Poulsen, J. R., Stevens, M. H., et al. (2009). Generalized linear mixed models: a practical guide for ecology and evolution. Trends Ecol. Evol. 24, 127–135. doi: 10.1016/j.tree.2008.10.008
Bolnick, D. I., Svanbäck, R., Fordyce, J. A., Yang, L. H., Davis, J. M., Hulsey, C. D., et al. (2003). The ecology of individuals: incidence and implications of individual specialization. Am. Nat. 161, 1–28. doi: 10.1086/343878
Breed, G. A., Bowen, W. D., McMillan, J. I., and Leonard, M. L. (2006). Sexual segregation of seasonal foraging habitats in a non-migratory marine mammal. Proc. R. Soc. B-Biol. Sci. 273, 2319–2326. doi: 10.1098/rspb.2006.3581
Bryant, E. (2007). 2D Location Accuracy Statistics for Fastloc Cores Running Firmware Versions 2.2 & 2.3. Wildtrack Telemetry Systems Ltd., 6.
Burgman, M. A., and Fox, J. C. (2003). Bias in species range estimates from minimum convex polygons: implications for conservation and options for improved planning. Anim. Conserv. 6, 19–28. doi: 10.1017/S1367943003003044
Burtenshaw, J. C., Oleson, E. M., Hildebrand, J. A., McDonald, M. A., Andrew, R. K., Howe, B. M., et al. (2004). Acoustic and satellite remote sensing of blue whale seasonality and habitat in the Northeast Pacific. Deep Sea Res. 51, 967–986. doi: 10.1016/j.dsr2.2004.06.020
Cade, D. E., Friedlaender, A. S., Calambokidis, J., and Goldbogen, J. A. (2016). Kinematic diversity in rorqual whale feeding mechanisms. Curr. Biol. 26, 2617–2624. doi: 10.1016/j.cub.2016.07.037
Calambokidis, J., Schorr, G. S., Steiger, G. H., Francis, J., Bakhtiari, M., Marshall, G., et al. (2007). Insights into the underwater diving, feeding, and calling behavior of blue whales from a suction-cup-attached video-imaging tag (Crittercam). Mar. Technol. Soc. J. 41, 19–29. doi: 10.4031/002533207787441980
Charnov, E. L. (1976). Optimal foraging, the marginal value theorem. Theor. Popul. Biol. 9, 129–136. doi: 10.1016/0040-5809(76)90040-X
Chimienti, M., Cornulier, T., Owen, E., Bolton, M., Davies, I. M., Travis, J. M. J., et al. (2017). Taking movement data to new depths: inferring prey availability and patch profitability from seabird foraging behavior. Ecol. Evol. 7, 10252–10265. doi: 10.1002/ece3.3551
Cooke, J. G. (2018a). Balaenoptera musculus. IUCN Red List Threat. Species 2018:e.T2477A50226195. doi: 10.2305/IUCN.UK.2018-2.RLTS.T2477A50226195.en
Cooke, J. G. (2018b). Balaenoptera physalus. IUCN Red List Threat. Species 2018: e.T2478A50349982. doi: 10.2305/IUCN.UK.2018-2.RLTS.T2478A50349982.en
Croll, D. A., Clark, C. W., Acevedo, A., Tershy, B., Flores, S., Gedamke, J., et al. (2002). Only male fin whales sing loud songs. Nature 417:809. doi: 10.1038/417809a
Croll, D. A., Marinovic, B., Benson, S., Chavez, F. P., Black, N., Ternullo, R., et al. (2005). From wind to whales: trophic links in a coastal upwelling system. Mar. Ecol. Prog. Ser. 289, 117–130. doi: 10.3354/meps289117
DeRuiter, S. L., Langrock, R., Skirbutas, T., Goldbogen, J. A., Calambokidis, J., Friedlaender, A. S., et al. (2017). A multivariate mixed hidden Markov model for blue whale behaviour and responses to sound exposure. Ann. Appl. Stat. 11, 362–392. doi: 10.1214/16-AOAS1008
Dorman, J. G., Sydeman, W. J., Garcia-Reyes, M., Zeno, R. A., and Santora, J. A. (2015). Modeling krill aggregations in the central-northern California Current. Mar. Ecol. Prog. Ser. 528, 87–99. doi: 10.3354/meps11253
Edwards, E. F., Hall, C., Moore, T. J., Sheredy, C., and Redfern, J. V. (2015). Global distribution of fin whales balaenoptera physalus in the post-whaling era (1980-2012). Mamm. Rev. 45, 197–214. doi: 10.1111/mam.12048
Evans, M. R. (2012). Modelling ecological systems in a changing world. Philos. Trans. R. Soc. Lond. B Biol. Sci. 367, 181–190. doi: 10.1098/rstb.2011.0172
Fiedler, P. C., Reilly, S. B., Hewitt, R. P., Demer, D., Philbrick, V. A., Smith, S., et al. (1998). Blue whale habitat and prey in the California Channel Islands. Deep Sea Res. 45, 1781–1801. doi: 10.1016/S0967-0645(98)80017-9
Fossette, S., Abrahms, B., Hazen, E. L., Bograd, S. J., Zilliacus, K. M., Calambokidis, J., et al. (2017). Resource partitioning facilitates coexistence in sympatric cetaceans in the California Current. Ecol. Evol. 7, 9085–9097. doi: 10.1002/ece3.3409
Friedlaender, A. S., Goldbogen, J. A., Hazen, E. L., Calambokidis, J., and Southall, B. L. (2015). Feeding performance by sympatric blue and fin whales exploiting a common prey resource. Mar. Mamm. Sci. 31, 345–354. doi: 10.1111/mms.12134
Geijer, C. K. A., Notarbartolo di Sciara, G., and Panigada, S. (2016). Mysticete migration revisited: are mediterranean fin whales an anomaly? Mamm. Rev. 46, 284–296. doi: 10.1111/mam.12069
Gentry, R. L., and Kooyman, G. C. (1986). Furs Seals: Maternal Strategies on Land and at Sea. Furs Seals: Maternal Strategies on Land and at Sea. Princeton, NJ: Princeton University Press.
Gerrodette, T. (2011). Inference without significance: measuring support for hypotheses rather than rejecting them. Mar. Ecol. 32, 404–418. doi: 10.1111/j.1439-0485.2011.00466.x
Gilson, A., Syvanen, M., Levine, K., and Banks, J. (1998). Deer gender determination by polymerase chain reaction: validation study and application to tissues, bloodstains, and hair forensic samples from california. Med. Microbiol. Immunol. 84, 159–169.
Goldbogen, J. A., Cade, D. E., Calambokidis, J., Friedlaender, A. S., Potvin, J., Segre, P. S., et al. (2017). How baleen whales feed: the biomechanics of engulfment and filtration. Ann. Rev. Mar. Sci. 9, 367–386. doi: 10.1146/annurev-marine-122414-033905
Goldbogen, J. A., Calambokidis, J., Croll, D. A., McKennaet, M. F., Oleson, E., Potvin, J., et al. (2012). Scaling of lunge-feeding performance in rorqual whales: mass-specific energy expenditure increases with body size and progressively limits diving capacity. Funct. Ecol. 26, 216–226. doi: 10.1111/j.1365-2435.2011.01905.x
Goldbogen, J. A., Calambokidis, J., Oleson, E., Potvin, J., Pyenson, N. D., Schorr, G., et al. (2011). Mechanics, hydrodynamics and energetics of blue whale lunge feeding: efficiency dependence on krill density. J. Exp. Biol. 214, 698–699. doi: 10.1242/jeb.054726
Goldbogen, J. A., Calambokidis, J., Shadwick, R. E., Oleson, E. M., McDonald, M. A., and Hildebrand, J. A. (2006). Kinematics of foraging dives and lunge-feeding in fin whales. J. Exp. Biol. 209 (Pt 7):1231–1244. doi: 10.1242/jeb.02135
Goldbogen, J. A., Hazen, E. L., Friedlaender, A. S., Calambokidis, J., DeRuiter, S. L., Stimpert, A. K., et al. (2015). Prey density and distribution drive the three-dimensional foraging strategies of the largest filter feeder. Funct. Ecol. 29, 951–961. doi: 10.1111/1365-2435.12395
Goldbogen, J. A., and Madsen, P. T. (2018). The evolution of foraging capacity and gigantism in cetaceans. J. Exp. Biol. 221 (Pt 11):jeb166033. doi: 10.1242/jeb.166033
Goldbogen, J. A., Southall, B. L., DeRuiter, S. L., Calambokidis, J., Friedlaender, A. S., Hazen, E. L., et al. (2013). Blue whales respond to simulated mid-frequency military sonar. Proc. Biol. Sci. 280:20130657. doi: 10.1098/rspb.2013.0657
Greenland, S., Senn, S. J., Rothman, K. J., Carlin, J. B., Poole, C., Goodman, S. N., et al. (2016). Statistical tests, P values, confidence intervals, and power: a guide to misinterpretations. Eur. J. Epidemiol. 31, 337–350. doi: 10.1007/s10654-016-0149-3
Guillerme, T., and Cooper, N. (2016). Effects of missing data on topological inference using a total evidence approach. Mol. Phylogenet. Evol. 94(Pt A), 146–158. doi: 10.1016/j.ympev.2015.08.023
Harrison, X. A., Donaldson, L., Correa-Cano, M. E., Evans, J., Fisher, D. N., Goodwin, C. E. D., et al. (2018). A brief introduction to mixed effects modelling and multi-model inference in ecology. PeerJ. 6:e4794. doi: 10.7287/peerj.preprints.3113
Hazen, E. L., Friedlaender, A. S., and Goldbogen, J. A. (2015). Blue whales (Balaenoptera musculus) optimize foraging efficiency by balancing oxygen use and energy gain as a function of prey density. Sci. Adv. 1:e1500469. doi: 10.1126/sciadv.1500469
Heide-Jorgensen, M. P., Kleivane, L., Oien, N., Laidre, K. L., and Jensen, M. V. (2001). A new technique for deploying satellite transmitters on baleen whales: tracking a blue whale (Balaenoptera musculus) in the north atlantic. Mar. Mamm. Sci. 17, 949–954. doi: 10.1111/j.1748-7692.2001.tb01309.x
Holford, T. R. (1980). The analysis of rates and of survivorship using log-linear models. Biometrics 36, 299–305. doi: 10.2307/2529982
Irvine, L. M., Mate, B. R., Winsor, M. H., Palacios, D. M., Bograd, S. J., Costa, D. P., et al. (2014). Spatial and temporal occurrence of blue whales off the U.S. West coast, with implications for management. PLoS ONE 9:e102959. doi: 10.1371/journal.pone.0102959
Irvine, L. M., Palacios, D. M., Lagerquist, B. A., Mate, B. R., and Follett, T. M. (2019). Data from: scales of blue and fin whale feeding behavior off California, USA, with implications for prey patchiness. Movebank Data Repos. doi: 10.5441/001/1.47h576f2
Kuznetsova, A., Brockhoff, P. B., and Christensen, R. H. B. (2017). Lmertest package: tests in linear mixed effects models. J. Stat. Softw. 82, 1–26. doi: 10.18637/jss.v082.i13
Laidre, K. L., Heagerty, P. J., Heide-Jorgensen, M. P., Witting, L., and Simon, M. (2009). Sexual segregation of common minke whales (Balaenoptera acutorostrata) in greenland, and the influence of sea temperature on the sex ratio of catches. ICES J. Mar. Sci. 66, 2253–2266. doi: 10.1093/icesjms/fsp191
Lewis, L. A., Calambokidis, J., Stimpert, A. K., Fahlbusch, J., Friedlaender, A. S., McKenna, M. F., et al. (2018). Context-dependent variability in blue whale acoustic behaviour. R. Soc. Open Sci. 5:180241. doi: 10.1098/rsos.180241
Lewis, L. A., and Sirovic, A. (2018). Variability in blue whale acoustic behavior off southern california. Mar. Mamm. Sci. 34, 311–329. doi: 10.1111/mms.12458
Lomac-MacNair, K., and Smultea, M. (2016). Blue whale (Balaenoptera musculus) behavior and group dynamics as observed from an aircraft off southern California. Anim. Behav. Cogn. 3, 1–21 doi: 10.12966/abc.02.01.2016
López, J. M. E., Palacios, D. M., Jaramillo Legorreta, A., Urbán R, J., and Mate, B. R. (2019). Fin whale movements in the Gulf of California, Mexico, from satellite telemetry. PLoS ONE 14:e0209324. doi: 10.1371/journal.pone.0209324
Mate, B., Mesecar, R., and Lagerquist, B. (2007). The evolution of satellite-monitored radio tags for large whales: one laboratory's experience. Deep-Sea Res. II 54, 224–247. doi: 10.1016/j.dsr2.2006.11.021
Mate, B. R., Irvine, L. M., and Palacios, D. M. (2017). The development of an intermediate-duration tag to characterize the diving behavior of large whales. Ecol. Evol. 7, 585–595. doi: 10.1002/ece3.2649
Mate, B. R., Lagerquist, B. A., and Calambokidis, J. (1999). Movements of North Pacific blue whales during the feeding season off southern California and their southern fall migration. Mar. Mamm. Sci. 15, 1246–1257. doi: 10.1111/j.1748-7692.1999.tb00888.x
Mcnair, J. N. (1982). Optimal giving-up times and the marginal value theorem. Am. Nat. 119, 511–529. doi: 10.1086/283929
Messie, M., and Chavez, F. P. (2017). Nutrient supply, surface currents, and plankton dynamics predict zooplankton hotspots in coastal upwelling systems. Geophys. Res. Lett. 44, 8979–8986. doi: 10.1002/2017GL074322
Nickels, C. F., Sala, L. M., and Ohman, M. D. (2018). The morphology of euphausiid mandibles used to assess selective predation by blue whales in the southern sector of the California Current system. J. Crust. Biol. 38, 563–573. doi: 10.1093/jcbiol/ruy062
Oleson, E. M., Calambokidis, J., Burgess, W. C., McDonald, M. A., LeDuc, C. A., and Hildebrand, J. A. (2007). Behavioral context of call production by eastern north pacific blue whales. Mar. Ecol. Prog. Ser. 330, 269–284. doi: 10.3354/meps330269
Palacios, D. M., Bailey, H., Becker, E. A., Bograd, S. J., DeAngelis, M. L., Forney, K. A., et al. (2019). Ecological correlates of blue whale movement behavior and its predictability in the California Current ecosystem during the summer-fall feeding season. Mov. Ecol. 7:26. doi: 10.1186/s40462-019-0164-6
Parsons, K. M., Balcomb, K. C., Ford, J. K. B., and Durban, J. W. (2009). The social dynamics of southern resident killer whales and conservation implications for this endangered population. Anim. Behav. 77, 963–971. doi: 10.1016/j.anbehav.2009.01.018
Pauly, D., Trites, A. W., Capuli, E., and Christensen, V. (1998). Diet composition and trophic levels of marine mammals. ICES J. Mar. Sci. 55, 467–481. doi: 10.1006/jmsc.1997.0280
Pirotta, E., Mangel, M., Costa, D. P., Goldbogen, J., Harwood, J., Hin, V., et al. (2019). Anthropogenic disturbance in a changing environment: modelling lifetime reproductive success to predict the consequences of multiple stressors on a migratory population. Oikos. 128, 1340–1357. doi: 10.1111/oik.06146
Pirotta, E., Mangel, M., Costa, D. P., Mate, B., Goldbogen, J. A., Palacios, D. M., et al. (2018). A dynamic state model of migratory behavior and physiology to assess the consequences of environmental variation and anthropogenic disturbance on marine vertebrates. Am. Nat. 191, E40–E56. doi: 10.1086/695135
R Core Team (2018). R: A Language and Environment for Statistical Computing. Vienna: R Foundation for Statistical Computing.
Redfern, J. V., McKenna, M. F., Moore, T. J., Calambokidis, J., Deangelis, M. L., Becker, E. A., et al. (2013). Assessing the risk of ships striking large whales in marine spatial planning. Conserv. Biol. 27, 292–302. doi: 10.1111/cobi.12029
Rizopoulos, D. (2019). Glmmadaptive: Generalized Linear Mixed Models Using Adaptive Gaussian Quadrature. R package version 0.6-0. Available online at: https://cran.R-project.Org/package=glmmadaptive (accessed May 14, 2019).
Rykaczewski, R. R., and Checkley, D. M. (2008). Influence of ocean winds on the pelagic ecosystem in upwelling regions. Proc. Natl. Acad. Sci. U.S.A. 105, 1965–1970. doi: 10.1073/pnas.0711777105
Santora, J. A., Dorman, J. G., and Sydeman, W. J. (2017). Modeling spatiotemporal dynamics of krill aggregations: size, intensity, persistence, and coherence with seabirds. Ecography 40, 1300–1314. doi: 10.1111/ecog.02250
Santora, J. A., Ralston, S., and Sydeman, W. J. (2011a). Spatial organization of krill and seabirds in the central california current. ICES J. Mar. Sci. 68, 1391–1402. doi: 10.1093/icesjms/fsr046
Santora, J. A., Reiss, C. S., Loeb, V. J., and Veit, R. R. (2010). Spatial association between hotspots of baleen whales and demographic patterns of antarctic krill euphausia superba suggests size-dependent predation. Mar. Ecol. Prog. Ser. 405, 255–269. doi: 10.3354/meps08513
Santora, J. A., Schroeder, I. D., and Loeb, V. J. (2014). Spatial assessment of fin whale hotspots and their association with krill within an important antarctic feeding and fishing ground. Mar. Biol. 161, 2293–2305. doi: 10.1007/s00227-014-2506-7
Santora, J. A., Sydeman, W. J., Schroeder, I. D., Wells, B. K., and Field, J. C. (2011b). Mesoscale structure and oceanographic determinants of krill hotspots in the california current: implications for trophic transfer and conservation. Prog. Oceanograph. 91, 397–409. doi: 10.1016/j.pocean.2011.04.002
Scales, K. L., Schorr, G. S., Hazen, E. L., Bograd, S. J., Miller, P. I., Andrews, R. D., et al. (2017). Should I stay or should I go? Modelling year-round habitat suitability and drivers of residency for fin whales in the california current. Diver. Distrib. 23, 1204–1215. doi: 10.1111/ddi.12611
Simon, M., Johnson, M., and Madsen, P. T. (2012). Keeping momentum with a mouthful of water: behavior and kinematics of humpback whale lunge feeding. J. Exp. Biol. 215, 3785–3798. doi: 10.1242/jeb.071092
Sirovic, A., Rice, A., Chou, E., Hildebrand, J. A., Wiggins, S. M., Roch, M. A., et al. (2015). Seven years of blue and fin whale call abundance in the Southern California Bight. Endang. Species Res. 28, 61–76. doi: 10.3354/esr00676
Sprogis, K. R., Raudino, H. C., Rankin, R., MacLeod, C. D., and Bejde, L. (2016). Home range size of adult indo-pacific bottlenose dolphins (tursiops aduncus) in a coastal and estuarine system is habitat and sex-specific. Mar. Mamm. Sci. 32, 287–308. doi: 10.1111/mms.12260
Stafford, K. M., Citta, J. J., Moore, S. E., Daher, M. A., and George, J. E. (2009). Environmental correlates of blue and fin whale call detections in the north pacific ocean from 1997–2002. Mar. Ecol. Prog. Ser. 395, 37–53. doi: 10.3354/meps08362
Stimpert, A. K., DeRuiter, S. L., Falcone, E. A., Joseph, J., Douglas, A. B., Moretti, D. J., et al. (2015). Sound production and associated behavior of tagged fin whales (balaenoptera physalus) in the southern california bight. Anim. Biotel. 3:23. doi: 10.1186/s40317-015-0058-3
Symons, J., Pirotta, E., and Lusseau, D. (2014). Sex differences in risk perception in deep-diving bottlenose dolphins leads to decreased foraging efficiency when exposed to human disturbance. J. Appl. Ecol. 51, 1584–1592. doi: 10.1111/1365-2664.12337
Keywords: data loggers, accelerometers, GPS tracking, blue whale, fin whale, feeding behavior, sexual segregation
Citation: Irvine LM, Palacios DM, Lagerquist BA and Mate BR (2019) Scales of Blue and Fin Whale Feeding Behavior off California, USA, With Implications for Prey Patchiness. Front. Ecol. Evol. 7:338. doi: 10.3389/fevo.2019.00338
Received: 02 February 2019; Accepted: 23 August 2019;
Published: 10 September 2019.
Edited by:
Stan Boutin, University of Alberta, CanadaReviewed by:
Inger Suzanne Prange, Appalachian Wildlife Research Institute (United States), United StatesKimberly Goetz, National Institute of Water and Atmospheric Research (NIWA), New Zealand
Copyright © 2019 Irvine, Palacios, Lagerquist and Mate. This is an open-access article distributed under the terms of the Creative Commons Attribution License (CC BY). The use, distribution or reproduction in other forums is permitted, provided the original author(s) and the copyright owner(s) are credited and that the original publication in this journal is cited, in accordance with accepted academic practice. No use, distribution or reproduction is permitted which does not comply with these terms.
*Correspondence: Ladd M. Irvine, bGFkZC5pcnZpbmVAb3JlZ29uc3RhdGUuZWR1