 Florian Duchatel
 Barend M. de C. Bronsvoort
 Samantha Lycett
- Roslin Institute, University of Edinburgh, Edinburgh, United Kingdom
Foot and mouth disease (FMD) is endemic in sub-Saharan Africa. Due to the complexity of the disease epidemiology and the lack of data available, there is a need to use modeling approaches to fill the gaps in our understanding of the virus circulation on this continent. Using a phylogeographic approach, we reconstructed the circulation of FMD virus serotypes A, O, SAT1, and SAT2 in Africa and evaluated the influence of potential environmental and anthropological predictors of virus diffusion. Our results show that the serotypes O and A were introduced to Africa over the last century while the SAT1 and SAT2 serotype have been circulating for at least 400 years in wildlife. Our results also suggest that, outside Southern-Africa, wildlife does not play a role in the maintenance and circulation of the disease within domestic animals. Further, the circulation of serotype O in eastern Africa appears to be facilitated by both indirect transmission through persistence in the environment and anthropological activities such as cattle movements. Evidence for the different epidemiologies of serotypes has been lacking but is essential in developing a modern approach to control of FMD viruses in Africa.
Introduction
Foot and mouth disease (FMD) affects more than 70 species of cloven-hoofed animals (Alexandersen et al., 2003). The disease is characterized by the development of vesicles in and around the mouth, on the feet and possibly in other places on the skin (Alexandersen et al., 2003). The causal agent is a positive-sense, single-stranded RNA virus of the Picornaviridae family (Belsham, 1993) called foot-and-mouth disease virus (FMDV). Its genome encodes the information for 4 capsid proteins (VP1-4) and several non-structural proteins. Based on the level of cross protection between strains, the virus can be divided into seven serotypes, O, A, C, Southern African Territories [SAT] 1, 2, 3, and Asia 1 (Domingo et al., 2002; Schrijver and Vosloo, 2011), which are clinically indistinguishable from each other but which have different epidemiologies. The hosts that are considered to play an active role in these epidemiologies are cattle, buffaloes, pigs, sheep, and goats (Alexandersen and Mowat, 2005).
FMD susceptibility varies according to the host and strain of FMDV involved. The severity of the infection depends of the amount of virus inoculated, the serotype, the host species and the individual immunity (Weaver et al., 2013). The most common route of infection for a new host is by direct contact with an infected animal (Donaldson et al., 2001; Alexandersen et al., 2003). The infection may also occur indirectly through contact with contaminated surfaces or products, such as personnel, vehicle or fomites (Alexandersen and Mowat, 2005). Movement of animals and animal products are considered to play an important role in the disease circulation in endemic areas and are considered to be the main factors for FMDV transboundary spread (Di Nardo et al., 2011).
FMD has been eradicated in many high income countries but is still endemic in numerous low and middle income countries (LMICs) (Robinson et al., 2011), particularly in Africa and South and East Asia. Although FMD has a low mortality rate in adult animals, it causes significant productivity losses that may lead to important and continuous economic losses for farmers and may impact a countries trading ability at a national level (Di Nardo et al., 2011). Although work has been done to understand the impact of FMDV in large scale dairy farms in LMICs (Lyons et al., 2015), there is still a lack of data to quantify its impact more broadly on the economy of endemically infected countries (Casey et al., 2014).
FMDV is endemic in most of sub-Saharan Africa with an epidemiology considered to be more complex than in other regions of the world due to multiple serotype and wildlife reservoirs (Vosloo et al., 2002). However, due to a general lack of surveillance and animal traceability, very few statistics on disease incidence and circulation exist for Africa. Although there are a few studies on animal trade and seasonal migration of nomadic and pastoralist herds in sub-Saharan African (Vosloo et al., 2002; Di Nardo et al., 2011; Tekleghiorghis et al., 2016; Motta et al., 2017), we need analytical approaches that use existing data to improve our understanding, both of the circulation of FMDVs in this part of the world and of the different epidemiologies, in order to develop more modern approaches to control. Even the standard on the endemicity of FMD is based on clinical signs but fails to capture the possibility that the disease might be driven by epidemic waves of different serotypes, a theory first proposed in 2006 by Bronsvoort et al. (2006), and more recently again by Casey-Bryars et al. (2018).
Many wildlife species can be infected by FMDVs in Africa (Weaver et al., 2013), but amongst all these potential hosts, only the Cape buffalo (Syncerus caffer) and impala (Aepyceros melampus) have been implicated in the transmission of FMDV to domestic cattle (Vosloo et al., 2002, 2009). Even though the Cape buffalo is suspected to be the primary reservoir and the main source of SAT serotypes in Southern Africa (Miguel et al., 2013), its role as a viral source for livestock epidemics, especially for the FMDV O, A, and C serotypes, outside Southern Africa is still unclear (Bastos et al., 2000; Thomson et al., 2003; Casey et al., 2014; Tekleghiorghis et al., 2016), and might be unimportant (Casey-Bryars et al., 2018).
It has already been observed that the spatio-temporal occurrence and circulation of FMDV in Africa is affected by human activities through domestic animal movements (Dean et al., 2013; Hamoonga et al., 2014; Allepuz et al., 2015; Wungak et al., 2016). However, several environmental characteristics (Cottam et al., 2006) and attributes, such as the landscape, vegetation, and natural barriers to animal movements (roads, rivers or mountains) have the potential to influence the dynamics and circulation of FMD (Bessell et al., 2008; Dion et al., 2011; Flood et al., 2013).
Since FMDV are single stranded RNA viruses, lack a proof-reading mechanism for their genome replication and replicate to high titers within a host, they display a high realized substitution rate at the between-host level (Domingo et al., 2002). The history of these mutations can provide information on the ecological processes and population events that have shaped the virus evolution even if not directly observed. These processes, along with other evolutionary parameters, can be modeled while reconstructing the phylogenetic trees (Drummond et al., 2003; Kühnert et al., 2011). Furthermore, by combining genetic data and spatial information, phylogeographic tree reconstruction can be used to estimate the unobserved geographic circulation of a pathogen (Pybus and Rambaut, 2009). For example, Cottam et al. showed that it was possible to determine transmission routes using FMD sequences in the outbreak in the UK in 2001 (Cottam et al., 2006). Virus movements can be modeled as discrete transmission events between the sampled locations (Lemey et al., 2009) or as a continuous process using different random walk diffusion models (Lemey et al., 2010). Recently, both discrete and continuous approaches have been extended to test and quantify the contribution of potential environmental and anthropological parameters (predictors of viral diffusion) that might influence the spread and circulation of the studied pathogen (Lemey et al., 2014; Dellicour et al., 2016b).
The aim of this paper is to gain a better understanding of the circulation of FMDV in Africa, comparing discrete and continuous approaches (Lemey et al., 2014; Dellicour et al., 2016a). A detailed discrete phylogeographic analysis of serotypes A, O, SAT1, and SAT2 sequences was performed, and the influence of 13 potential environmental and anthropological predictors of virus diffusion were quantified and tested using both discrete and continuous approaches.
Materials and Methods
Data Collection
To obtain a comprehensive genetic dataset, we first retrieved all available African FMDV A, FMDV O, FMDV SAT1, and FMDV SAT2 genetic sequences in Genbank (accessed on the 15/12/2016 for the serotypes A, O, and SAT2 and on the 11/09/2018 for SAT1). From these datasets we selected all VP1 sequences with, at least, information on the country of sampling and the year of sampling. In total, we gathered 191 FMDV A, 351 FMDV O, 214 FMDV SAT1, and 477 FMDV SAT2 sequences. The sequences were aligned using Multiple Alignment Fast Fourier transformation (MAFFT) (Katoh et al., 2017). Potential recombinant sequences were detected with RDP4 software and any such sequences were removed (Martin et al., 2015).
To reduce the effect of potential sampling, we ran a stratified subsampling procedure to thin the number of sequences to a maximum of three sequences per country of origin per month. For countries with less than three sequences available in total (regardless of temporal span), we grouped them with neighboring countries if possible or else removed them. The final FMDV A dataset was composed of 107 sequences from eight countries, dates ranging from 1966 to 2016. The final FMDV O dataset was composed of 192 sequences from 12 countries, dates ranging from 1964 to 2016. The final FMDV SAT1 dataset was comprised of 117 sequences from 10 countries in total, but grouped into 5 regions for further analysis (because there were only one or two sequences from some countries), dates ranging from 1961 to 2015. The final FMDV SAT2 dataset was composed of 135 sequences from 15 countries, dates ranging from 1970 to 2015 (see Supplementary Tables 1–8 for details, and Supplementary Figures 3–6 for maximum likelihood trees and Supplementary Figures 7–10; Supplementary Tables 10–13 for the corresponding root-to-tip divergence plots and data).
Bayesian Evolutionary Inference
Discrete Phylogeographic Tree Inference
Time-scaled phylogenetic trees were inferred using BEAST 1.8 with the BEAGLE library (Drummond and Rambaut, 2007), and different substitution clock and population evolution models were evaluated by estimating their marginal likelihoods using the Akaike's Information Criterion for MCMC samples (AICM) in Tracer 1.6. Ultimately, a general-time-reversible (GTR) model with site to site rate variation between two categories was selected as the nucleotide substitution model (Tavare, 1986) with a Bayesian skygrid population model and a relaxed uncorrelated log-normal molecular clock model were chosen to model the evolution of the FMDV A, FMDV O, and FMDV SAT1 serotype. The simpler HKY nucleotide substitution model with a constant clock model and a Bayesian skygrid population model were chosen to model the evolution of the FMDV SAT2 serotype (Drummond et al., 2006; Gill et al., 2013), since this combination was favored by the AICM scores and was appropriate for this diverse data set. Posterior sets of trees were generated for each serotype by combining at least two independent Markov Chain Monte Carlo runs of 40 million steps, sampling every thousand with 10% burn-in.
We first reconstructed the time-scaled phylogenetic trees for the four studied serotypes. Thereafter, to reduce the computation time of the GLM and the spatial diffusion analyses, we estimated the spatial model components using subsets of 1,000 trees from the original posterior distributions of trees as input empirical tree distributions. We used TreeAnnotator to summarize maximum clade credibility (MCC) trees and FigTree version 1.4.1 to visualize the annotated trees (Rambaut, 2009; Bouckaert et al., 2014). The software SPREAD3 and Cytoscape were used to identify and visualize the well supported rates of transmission through a Bayes factor test (Bielejec et al., 2016).
For the four serotypes, we reconstructed the discrete transition events between the different sampled countries (or five African regions for SAT1) through the whole phylogeny using the “migration model.” Therefore, an asymmetric continuous-time Markov chain (CTMC) model with an incorporated Bayesian stochastic search variable selection (BSSVS) was used to determine which set of transition rates sufficiently summarizes the epidemiological connectivity between the countries (Lemey et al., 2009). A posterior inference of the complete Markov jump history through the whole genealogy was also performed, in order to quantify state transitions and infer the time spent in each state by the virus.
Environmental and Anthropological Effect Estimation
Monophyletic clade selection
Using the previously reconstructed discrete phylogreographic tree of the FMDV O serotype, we selected a monophyletic clade with a MRCA under 25 years and a posterior probability over 50 % on the location of all its nodes (see Supplementary Figure 1). To avoid uncertainty in the predictor effect estimation analysis, we removed all sequences connected to branches with a length of more than 10 years. At the end of the process, the dataset was composed of 46 FMDV O sequences coming from 31 locations across Kenya, Uganda, and Tanzania (see Supplementary Table 23). The spatial coordinates of sampling for each sequence was retrieved using the GGMAP package in R and the most precise sampling localization name available for each sequence (Kahle and Wickham, 2013).
Generation of predictive factors of FMDV diffusion
A Generalized Linear Model (GLM) extension of the discrete approach was used to test and quantify the enhancing (positive) or impeding (negative) effect of potential predictors on the viral diffusion process (Lemey et al., 2014). This model parametrizes the transmission rate matrix between discrete locations as a log linear function of the potential predictive factor matrices. While reconstructing the phylogeographic history, the model performs Bayesian model averaging to determine which combination of predictor matrices are the best to explain the spatial diffusion process. For each predictor, a Bayes factor (BF) value is calculated based on the ratio of posterior to prior probabilities of inclusion (Trovão et al., 2015).
The different predictors of FMD diffusion considered were: the accessibility to the sampled location (travel time), cattle density, crop density, the elevation of the location, the forest density, the human density, the average yearly precipitation, the scrubland area density, the average daily temperature (Table 1, and for provenance, see Supplementary Table 9). Each potential predictor was retrieved as a raster matrix, representing the predictor spatial localization, and aggregated to a resolution of 0.08 by 0.08, corresponding to pixels of ~8 km by 8 km.
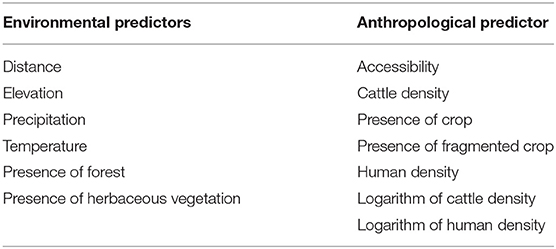
Table 1. Environmental and anthropological predictors tested for an effect on the FMDV serotype O diffusion in Eastern Africa.
The “circuitscape” software was used to determine the predictor values used in our GLM analysis (McRae, 2006). For each predictor, two predictor values were generated, one using the raster as resistance values (impeding the viral diffusion) and the other using the raster as conductance value (enhancing the viral diffusion). To obtain those values, we used a circuit theory approach to estimate modified distances, used as predictor values, between each pair of locations using the raster values as heterogeneity factors (Trovão et al., 2015). Consequently, if a raster was used as a resistance surface, we would estimate large predictor values between the locations separated by high raster values and small predictor values between the locations separated by small raster values. Prior to their inclusion in the GLM analyses, the predictor values were log transformed and standardized. Each analysis was run by comparing the effect of a predictor with a null predictor, corresponding to a random raster.
Complementary to the discrete GLM approach, we tested and quantified the effect of the potential predictors using a continuous coordinate approach. Therefore, we inferred the diffusion of the virus using a random walk model of diffusion and used the SERAPHIM package to test and estimate the effect of the predictors on the virus diffusion (Lemey et al., 2010; Dellicour et al., 2016b). Similarly to the discrete approach, SERAPHIM estimates a modified distance for each pair of locations found at the start and at the end of the phylogeny branches. The correlation between the time spent on each branch and the estimated distance value is then estimated. The statistical significance of this correlation is tested using a randomized phylogeny and expressed in the form of a BF (Dellicour et al., 2016b).
Results
Discrete Phylogenetic Analysis
Evolutionary Parameters Estimation
Overall, we observed a mean substitution rate of 4.67 × 10⁻³ substitutions per site per year and 3.69 × 10⁻³ for the serotypes A and O, respectively. We also estimated a significantly slower substitution rate of 1.8 × 10⁻³ and 1.1 × 10⁻³ for the serotypes SAT1 and SAT2 (see Supplementary Table 14).
Phylogeographic Tree Reconstruction for Serotype A
The reconstructed phylogeographic tree of the African serotype A viruses with the selected evolutionary model has a time to most recent common ancestor (TMRCA) of around 1926 (1890–1950 95% HPD), and using alternative models, the median values ranged from 1913 to 1936. The geographic origin was inferred to be in the eastern part of Africa, with high posterior probabilities for Kenya (49.83%) and Ethiopia (35.95%) (see Figure 1A). African serotype A can be split into eight lineages (indicated in Figure 1A). Some of the lineages originate and circulate in eastern Africa, especially G-I (highlighted clade 3), G-II, and G-VII (highlighted clade 2). However, the western sequences in G-IV (highlighted clade 1) are part of a lineage, which spans western and eastern Africa, containing sequences from Cameroon and Nigeria as well as sequences from Sudan, Ethiopia and Egypt. Considering the lineages in serotype A, a few transmissions events are observable between the two sides of Africa, and all of them involve Sudan as a link between them.
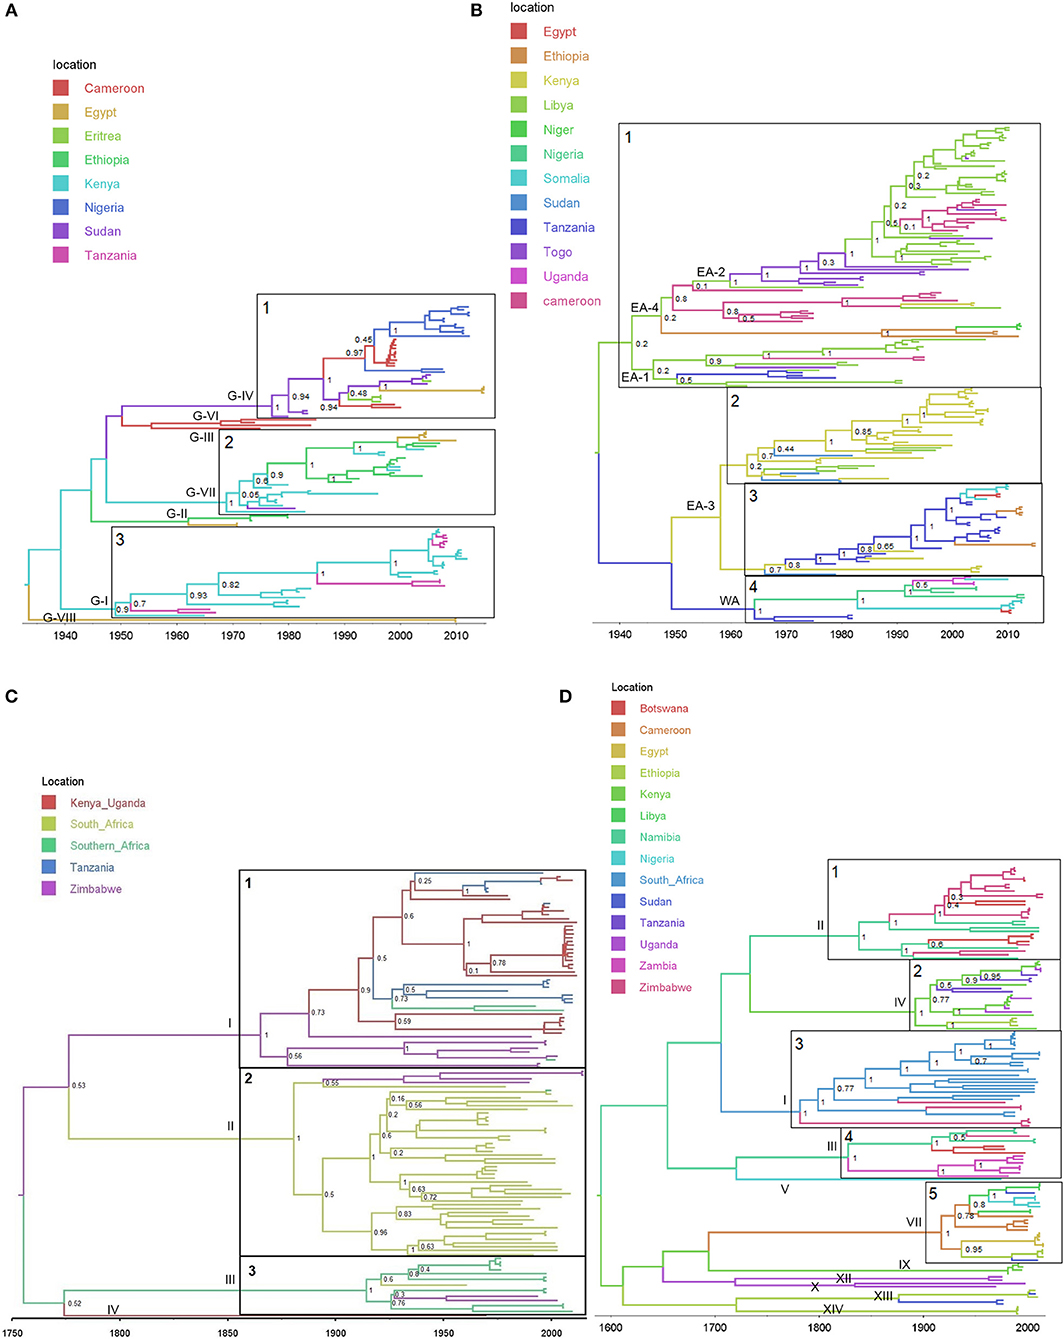
Figure 1. Bayesian MCC time scaled discrete phylogeographic tree for the four studied serotypes. (A) Bayesian phylogeographic tree for serotype A using 107 VP1 sequences. (B) Bayesian phylogeographic tree for serotype O using 192 VP1 sequences. (C) Bayesian phylogeographic tree for serotype SAT1 using 117 VP1 sequences. (D) Bayesian phylogeographic tree for serotype SAT2 using 135 VP1 sequences. The phylogeny branches are colored according to their descendent nodes location with the key for colors shown on the right. The main clades for each of the studied serotypes are identified on the phylogeographic trees. The nodes of the isolated clades are annotated with their posterior probabilities.
Phylogeographic Tree Reconstruction for Serotype O
The TMRCA of the African serotype O is estimated to be 1937 (1921–1952 95% HPD) with the selected model (medians of 1930–1941 for alternative models) and located in the eastern part of Africa with high posteriors probabilities for Kenya (61.49%), Sudan (17.15%) and Uganda (11.42%) (see Figure 1B). The reconstructed phylogeographical tree is composed of four large clades. The first clade (1 in Figure 1B) is almost entirely composed of Kenyan, Tanzanian, and Ugandans sequences with only a few transmissions to other countries, and contains the East Africa topotypes EA-1, EA-2, EA-4. East Africa topotype, EA-3, contains two main parts marked clades 2 and 3 in Figure 1B: clade 2 is mostly situated in Ethiopia with few transitions to Kenya and Somalia, whereas clade 3 is centered in Sudan with incursions into Nigeria, Cameroon, Egypt and Ethiopia. The West Africa topotype WA, marked as clade 4 is centered in West and Central African countries (Cameroon, Nigeria, Niger, and Togo) and seems to originate from Sudan. Overall, we can see that the situation for the serotype O is quite similar to that for the serotype A with only few observed transmissions between the eastern and western sides of Africa, and with Sudan acting as a link between the two sides of Africa.
Phylogeographic Tree Reconstruction for Serotype SAT1
The TMRCA for the serotype SAT1 was estimated at 1755 (1665–1833 95% HPD) with the selected model (medians of 1727–1790 for alternative models). Due to the long timescale and low posterior probabilities near the root of the tree, it is difficult to estimate the location of origin. Unsurprisingly, considering the composition of the dataset, the inferred origin location was in the southern parts of Africa [23% South-Africa, 37% Zimbabwe, and 30% Southern Africa (other countries)].
Figure 1C shows three major clades with posterior probabilities above 75%. Clade 1 seems to have emerged in the middle of the nineteenth century and is composed of topotype I sequences coming from Kenya, Tanzania, Zimbabwe, and Mozambique and Zambia (here indicated as “Southern Africa”). Clade 2 emerged at the end of the nineteenth century and is composed of topotype II sequences almost entirely from South-Africa (and one from Swaziland, colored as “Southern Africa” in Figure 1C), with a single introduction into Zimbabwe. Clade 3 emerged at the start of the twentieth century and is composed of topotype III sequences from Botswana and Nambia (colored as “Southern Africa” in Figure 1C), with an introduction into South Africa and another one in Zimbabwe. It can also be seen that SAT 1-I was introduced in the eastern part of Africa (Tanzania and Kenya) from Zimbabwe in a single introduction near the start of the twentieth century.
Phylogeographic Tree Reconstruction for Serotype SAT2
The TMRCA for serotype SAT2 is estimated as 1,583 (1,440–1,722 95% HPD) with the selected model, but has median values for alternative models ranging from 1,570 to 1,761 and 95% HPD from 1400s to 1800s. Similarly to SAT1, due to these long timescales, long branches and low posterior probabilities for the location at the ancestral nodes, it is difficult to estimate an origin location for the SAT2 dataset comprising diverse topotypes I-XIV (see Figure 1D).
Nevertheless, five major clades corresponding to topotypes with location posterior probabilities above 45% and more than 10 sequences are indicated in Figure 1D. Clade number 1 (topotype II) is exclusively composed of sequences from Botswana, Namibia, and Zimbabwe and seems to have its origin in the first half of the nineteenth century. Clade 2 (topotype IV) is composed of Ethiopian, Kenyan, Ugandan, and Tanzanian sequences and seems to originate at the transition between the nineteenth and twentieth century. The third clade (topotype I) seems to have emerged at the end of the eighteenth century and is composed of Zimbabwean and all the South-African sequences. The fourth clade (topotype III) has its TMRCA in the first half of the nineteenth century and is composed of sequences from Botswana, Namibia, and Zambia. The last clade (clade 5, topotype VII) emerged over the last century and is more diverse in the observed locations with sequences coming from Eastern, Western, and Northern Africa (Cameroon, Egypt, Ethiopia, Libya, Nigeria, and Sudan). Similar to the SAT1 serotype, the SAT2 serotype seems to have appeared first in Southern Africa before moving to other parts of the continent; with a separation between Southern countries and the rest of sub-Saharan African. Whilst the different clades of SAT2 viruses currently circulating in Southern Africa have remained confined to this region, the other clades seem to have spread more widely in Eastern, Central, and West Africa.
Bayesian Stochastic Search Variable Selection Analysis
Using a Bayesian stochastic search variable selection (BSSVS) analysis we identified well-supported rates of transition between the sampled countries. The support for the rates was quantified with Bayes factors (BF), and rates with BF ≥3 are shown in Figure 2. Globally, the results for the serotypes A and O look quite similar, with Sudan acting as a link between the Eastern, Northern, and Western part of the continent (see Figures 2A,B). For both serotypes, there is a clear transmission route starting from Ethiopia, passing through Kenya to Tanzania.
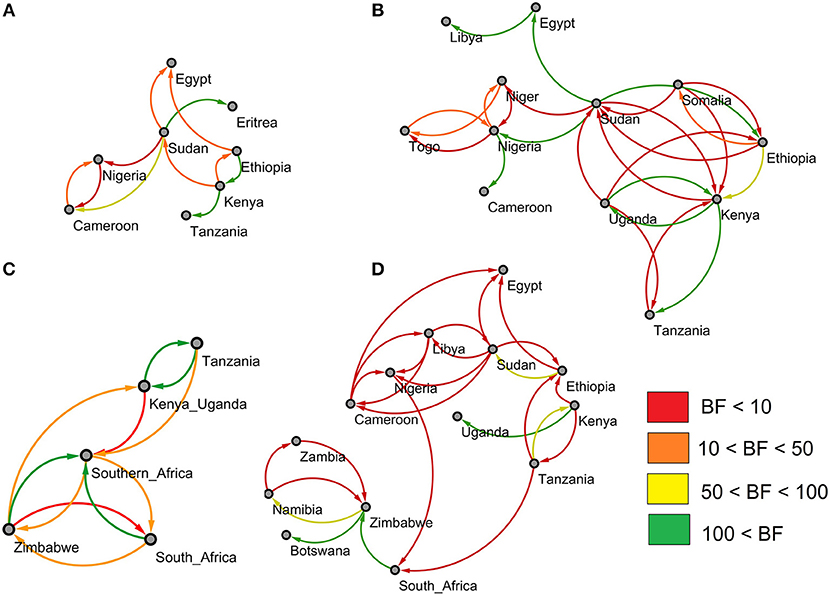
Figure 2. Outputs of the BSSVS analysis for the four studied FMDV serotypes showing the best supported rates of transition between the sampled countries. The edges colors represent the relative strength by which the rates are supported. (A) For FMDV serotype A. (B) For FMDV serotype O. (C) For FMDV serotype SAT1. (D) For FMDV serotype SAT2.
Although the observed pattern for the SAT1 serotype is slightly different due to the lack of data from outside southern Africa, we can still observe strong links between Tanzania and Kenya-Uganda for this serotype. We observe multiple links between South-Africa, Zimbabwe and the other countries in the southern-African region (Zambia, Botswana, Namibia, Mozambique and Swaziland). Additionally, a well-supported transition was observed between the Zimbabwe and the Kenya-Uganda region, however, this should not be interpreted as a direct and contemporary link between these two regions (see section Markov Jumps Analysis).
Although most of the observed transmission routes have lower BF values, the situation for the SAT2 serotype is fairly similar to that observed for the serotypes A and O (see Figure 2C). For SAT2, multiple transitions rates can be observed within Eastern and Western Africa with Sudan acting as link between the two sides. However, with only two rates linking South-Africa to the rest of the continent, in general, southern African countries are quite isolated from the other African countries (see Supplementary Tables 15–18).
Markov Jumps Analysis
To complement the BSSVS analysis, an estimation of the number of transmission events between the different locations using a Markov jump analysis was performed. For both FMDV serotypes A and O, we observed some transmission events from Kenya to other East African countries such as Tanzania, Ethiopia and Uganda. For these two serotypes, we also detected jumps from Sudan in the direction of North-Eastern and Western African countries such as Egypt, Eritrea, Cameroon, and Nigeria. Therefore, it seems that for these two serotypes, Kenya and Sudan act as distributors for the virus, but toward different directions (see Figure 3 and Supplementary Tables 19, 20). For the SAT1 serotype, we observed very few transitions between the Southern-African regions and many transitions between Kenya-Uganda and Tanzania (see Figure 3 and Supplementary Table 21). Only one transition from Zimbabwe to Kenya-Uganda was observed in SAT1 (Figure 3), and this occurred around the 1900s (see Figure 1). For serotype SAT2, most of the observed transitions occurred within Eastern African and Southern Africa with no clear link between them (see Figure 3 and Supplementary Table 22).
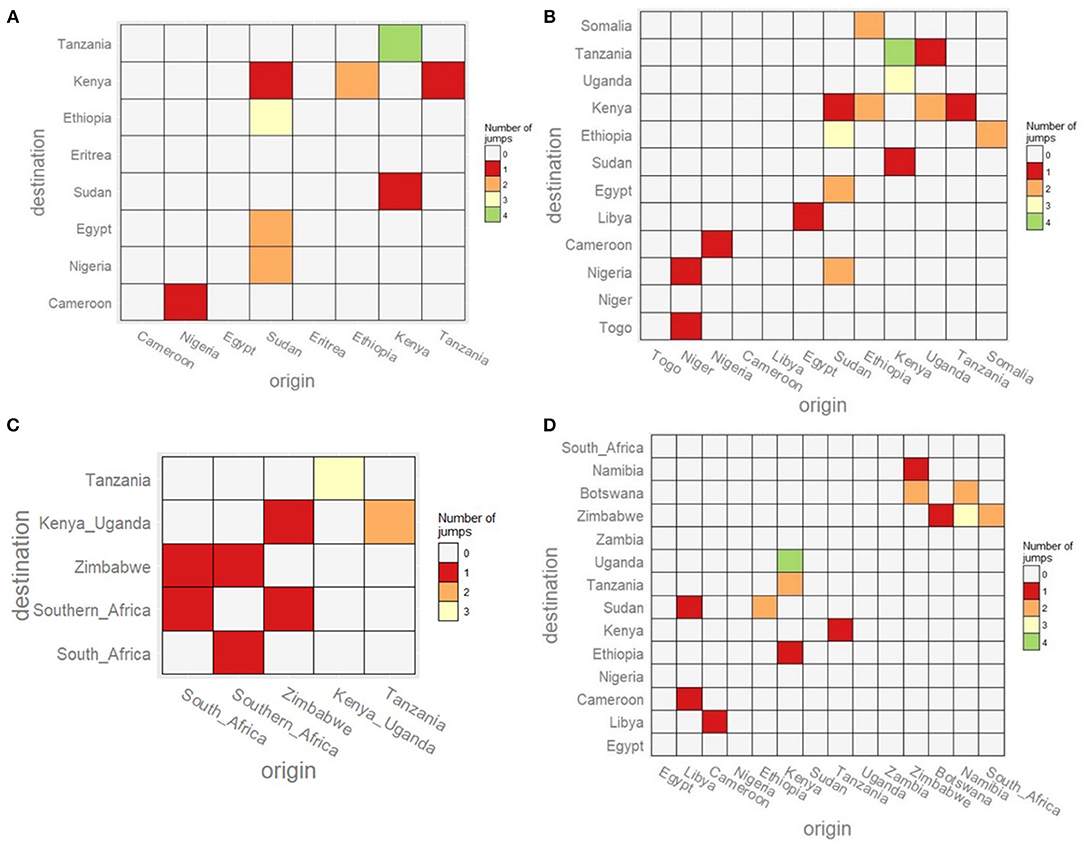
Figure 3. Heatmap showing the number of transitions between the sampled countries for the four studied FMDV serotypes. The heatmaps are colored according to the number of observed transitions between countries. (A) FMDV serotype A. (B) FMDV serotype O. (C) FMDV serotype SAT1. (D) FMDV serotype SAT2.
Environmental and Anthropological Factors Affecting FMDV Diffusion
Using the output from previous discrete phylogeographical analysis, we isolated a FMDV serotype O monophyletic clade with a time to the most recent common ancestor (TMRCA) below 25 years and a high posterior probability on the location for all its nodes. The selected 46 sequences originated from Kenya, Tanzania, and Uganda (See Supplementary Figure 1 and Supplementary Table 23). Using a general linear model (GLM) for the discrete location approach and the recently developed SERAPHIM package (Dellicour et al., 2016b) for the continuous location approach, we tested the impact of 13 different anthropological and environmental factors (predictors) on the FMDV diffusion in Eastern Africa (Table 1).
Predictive Factors for FMDV Diffusion Using a Discrete Location Approach
A generalized linear model (GLM) was used to parametrize the transition rate matrices between the sampled locations as a function of our selected predictors (Lemey et al., 2014) on a posterior set of time-resolved trees. We considered the set of predictors to be “conductors”—i.e., enhancing viral diffusion, or “resistors”—i.e., impeding viral diffusion. The following “conductor” predictor variables were found to be important in the generalized linear model of the diffusion process: the average daily temperature (BF 4), the logarithm of the cattle density (BF 4) and human densities (BF 9) (see Table 2). The important “resistor” predictor variables were: accessibility (BF 8), the distance between sampled locations (BF 8), average amount of precipitation (BF 7) per year and by the average daily temperature (BF 7) (for all the results see Supplementary Tables 24, 25). To gain a better understanding of the impact of the average temperature and precipitation on the viral diffusion, we selected different thresholds of precipitation and temperature to parametrize our GLM analysis (see Supplementary Tables 26, 27). We detected that low precipitation values (<80 mm/year) were associated with an impeding (negative) impact on the viral diffusion processes, whereas high precipitation was associated with an enhancing (positive) effect on the diffusion process. We also observed that, in the case of low temperature (below 22°C), a positive effect on the diffusion could be observed, whereas temperatures around 22°C had a negative effect on virus diffusion. Temperatures above 24°C again seemed to have a positive impact on the virus spread. It was difficult to distinguish between the effects of accessibility and human density because the two were strongly, negatively correlated confounding the analysis (see Supplementary Table 28).
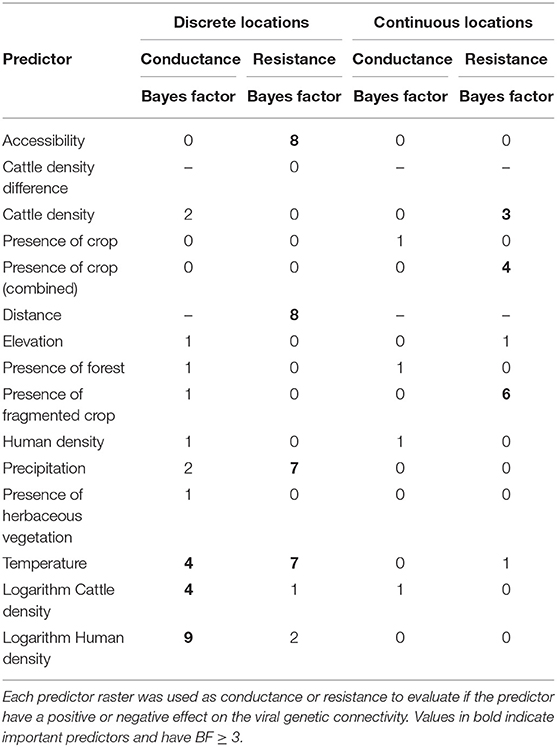
Table 2. Bayes factor values associated with the effect of each predictor on the connectivity between the sampled locations using a discrete or continuous location approach.
Predictive Factors for FMDV Diffusion Using a Continuous Diffusion Approach
Using a random walk model, we were able to reconstruct the virus diffusion in a continuous setting for the isolated FMDV serotype O (depicted in Figure 4). Using the R package SERAPHIM (Dellicour et al., 2016b), we evaluated the impact of the predictors on the virus diffusion and observed an impeding (negative) influence of the cattle density (BF 3), the presence of cropland (fragmented cropland and pure cropland areas combined) (BF 4) and by the presence fragmented cropland (BF 6). We were not able to detect a predictor with an enhancing (positive) influence on the diffusion process (see Table 2).
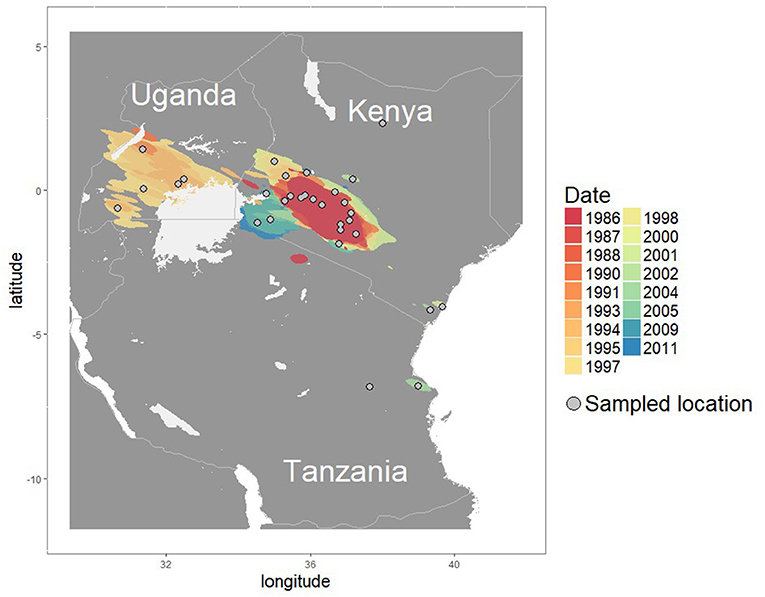
Figure 4. Map showing the continuous diffusion of the isolated clade of FMDV serotype O, with the sampled locations as gray circles. The virus movments were reconstructed using a random walk model with a underlying lognormal distribution.
To gain a better understanding of the role of the fragmented crop and cattle density, we isolated the areas newly covered over the course of the infection and observed how the presence of the two predictors evolved. Overall, we noticed an opposite trend in how their densities evolved with the elapsed time (see Supplementary Figure 2). For the fragmented crop density, high values of crop densities became more common over the course of the epidemic, with the disease moving from areas with low crop densities to areas with high crop densities. For the cattle density, the opposite trend was observed with high values of cattle density more common at the start of the epidemic, and the disease starting in an area where cattle densities were high and moving toward areas with lower densities of cattle. To better understand what effect the cattle density had on virus diffusion, we looked at selected areas above different thresholds of cattle density and used them as inputs in in the SERAPHIM package. In doing so, we were able to observe that densities of cattle above 125 cattle per square km have the biggest negative impact on the virus diffusion (see Supplementary Table 29).
Discussion
In this paper, we have applied state-of-the-art phylogenetic methods to the available African FMDV VP1 sequences for the serotypes A, O, SAT1, and SAT2. Our work has some limitations, especially regarding the limited availability of sequences. Our sampling is obviously unbalanced as it is based on submissions by individual countries or ad hoc research projects and the effect that it has on the results quality is uncertain. On the other hand, we are combining sequence data from many African countries and over as large a time span as possible; we have applied a subsampling scheme to reduce over-representation and bias as much as practical; and have used both discrete and continuous Bayesian phylogeographic methodologies, which are able to infer transmission patterns in sparsely sampled situations. Nevertheless, increasing the number of available FMDV sequences from diverse locations and hosts would help to develop models that better represent the diffusion of FMDV in Africa and lead to better environmental and anthropological effect estimation.
The estimated substitution rates of 4.67 × 10⁻³, 3.69 × 10⁻³, and 1.1 × 10⁻³ substitutions per site per year for the serotypes A, O, and SAT2 from our results are similar to previous estimates of 4.26 × 10⁻³, 3.14 × 10⁻³, and 1.07 × 10⁻³ substitutions per site per year for the same serotypes, as found by Tully and Fares (2008). The observed rate of 1.7 × 10⁻³ for the SAT1 is significantly lower than the rate found by Tully and Fares (2008) but similar to the one found by Sangula et al. (2010) who already pointed out this difference. Overall, we observed similar evolutionary patterns for both FMDV serotypes A and O. Our findings suggest that those serotypes have appeared in Eastern Africa around 1930, which is consistent with previous findings (Casey et al., 2014; Lycett et al., 2019). Our results pointed to the possible role of Kenya as a viral distribution source for East African countries and the role of Sudan as a link between East Africa and North-East Africa. The evolution of the SAT1 and SAT2 serotypes seems to be quite different from that of the serotypes A and O since both SAT serotypes were inferred to be present in southern-Africa up to 400 years prior to the appearance of serotypes A and O in Africa. Interestingly, both SAT serotypes appear to have spread outside of southern-Africa around the start of the twentieth century.
For the FMDV serotypes A and O, the observation of well-supported rates of viral transmission between Eastern Africa and Western Africa can be explained by the existence of commercial routes between those areas. It is, indeed, acknowledged that livestock trades play an important role in FMDV circulation in sub-Saharan Africa, with Sudan acting as an intermediate (Di Nardo et al., 2011). Additionally, the existence of a relatively recent common ancestor for the FMDV serotypes A and O is further support for the idea that these serotypes were imported into Africa at the start of the twentieth century through livestock trade from Asia and Europe (Casey et al., 2014).
The SAT1 and SAT2 serotype analysis shows the signs of the impact that the African rinderpest epidemics [that occurred in the 1890s (Mack, 1970)] had on FMDV circulation in Africa. Although FMDV was first reported in southern Africa in 1795, it had likely coevolved with buffalo over millennia resulting in a large diverse viral pool, but the rinderpest epidemic decimated almost all FMDV potential carriers and probably pushed it through a huge bottleneck (Knowles, 1990). It is thought that FMDV re-emerged from the wild buffalo population that survived the rinderpest epidemic, before being reported again in 1931 in Southern Africa (Casey et al., 2014). We found that, of the clades present in the reconstructed phylogeny for SAT2, only those originating from southern African countries have a TMRCA older than the African rinderpest epidemic (topotypes I, II, III, clade numbers 1, 3, and 4 in Figure 1D). The SAT1 and SAT2 serotypes probably spread outside southern African countries through infected livestock movements, and livestock movements are consistent with the more recent emergence of the virus in eastern and western Africa due to the more common transboundary movements observed in those regions. The BSSVS analysis outputs show similar transmission patterns amongst the serotypes A, O, and SAT2, and suggest that, outside of southern Africa and over the last 100 years, FMDV circulation (of SAT2 A and O) was mainly driven by domestic animal movements. Whereas, the observed relative isolation of southern Africa could be the result of the different livestock trade control measures in place in this region (Perry et al., 2003). However, we cannot exclude with certitude the role that wildlife might play considering the lack of wildlife samples outside southern Africa and the frequent observed interactions between domestic and wild animals in those regions (Maleko et al., 2012) (see Supplementary Figures 11, 12 for the host-species distribution of samples used in the SAT1 and SAT2 datasets).
Using both a discrete and continuous framework, we looked at the effect that diverse environmental and anthropological factors had on the diffusion of an isolated FMDV serotype O clade that circulated in Kenya, Uganda, and Tanzania. The results of the discrete approaches suggest that the FMDV diffusion is facilitated by low average daily temperature (<22°C), high average precipitations (>80 mm/year), as well as high human and cattle densities. We also saw that the virus diffusion was negatively impacted by accessibility i.e., slow viral diffusion was associated with long travel times, as well as high daily temperatures and low average precipitations.
Since lower temperatures and higher humidity values are usually associated with a longer virus survivability in the environment (Bartley et al., 2002), our results raise the possibility of a more important role than what was previously believed of the indirect transmission through viral persistence in the environment for FMV in this region. Additionally, with the viral diffusion being positively affected by high cattle and human densities, and negatively affected by large accessibility values, anthropological activities seem to have an impact on the virus diffusion. These observations could be the consequence of infected herds of cattle moving from smaller rural localities toward nearby larger cities with cattle markets (Robinson and Christley, 2007; Motta et al., 2017).
Regarding the effect of the different selected predictors on virus diffusion in a continuous setting, our results suggest that cattle densities above 125 cattle per km2 (high density) and the presence of cropland (pure cropland or mixed with other types of land) both have a negative impact on virus diffusion. Although, it is difficult to know whether it is the cattle or crop density that had the most impact due to high correlation of the two variables at the time and in the region of origin (see Supplementary Table 28). Our results suggest that the virus had difficulty in spreading beyond the geographic region located at the root of the tree, where high cattle densities and low crop densities were present, and spreading to areas with low cattle densities but high crop densities, presumably due to lack of suitable hosts. The somewhat counter-intuitive effect of high cattle densities, apparently impeding the virus flow, may be due to the endemic persistence of the disease within the high density regions but not in the lower density regions. It is also possible (and obviously desirable) that use of vaccines in a high density cattle region would reduce viral flow, but vaccination rate information is not available at a suitable scale in order to test this potential predictor.
Furthermore, the location uncertainty found at the root of the continuous tree could also explain the differences between the discrete and continuous methods in estimating the effect of the cattle density on virus diffusion. For our analysis, this uncertainty seems to be translated by the SERAPHIM programme as a period where the virus is almost not moving. This uncertainty seems to drive SERAPHIM to the conclusion that the high cattle densities found near the origin of the epidemic are related to this lack of movement and, therefore, estimate that they have a negative influence on the virus diffusion. Although we suspect a link between the cattle density and the location of emergence of the analyzed clade, we think that the continuous analysis does not offer the resolution needed to understand that relation (i.e., the spatial HPD confidence interval is too large). By parameterizing each rate of among-location movement as a function of predictors, the discrete approach, therefore, seems more appropriate to characterize the environmental and anthropological effect of the virus diffusion in this endemic situation.
In conclusion, the reconstructed phylogeographical tree pattern for the FMDV serotypes A, O, SAT1, and SAT2 reflects a situation where the recent FMDV circulation between non-southern-African countries is mainly driven by commercial exchanges, through pastoral herd movements, where wildlife seems to have almost no influence on the circulation of the disease. The observations for A and O suggest that those serotypes were imported in Africa at the start of the twentieth century, while the observed patterns for SAT1 and SAT2 reflect a situation where wildlife constitute the original host of the serotype. We observed that indirect transmission through the environment and direct transmission through anthropological activities had an enhancing effect on the virus diffusion in Eastern Africa for FMDV serotype O.
Although previous studies have suggested similar findings on the origins and natural hosts for FMD in Africa (Hall et al., 2013; Brito et al., 2016) and on the disease circulation being driven by the livestock rather than by the wildlife (Di Nardo et al., 2011; Casey-Bryars et al., 2018) our work represents a quantitative analysis of continental scale in support for different epidemiologies between the serotypes and on the different roles played by wildlife and livestock animal on the virus circulation. The use of such analytical methods is important in developing a modern approach to FMD control where different serotypes and topotypes could be targeted and controlled in different regions, particularly in areas where wildlife may be less important.
Ethics Statement
This study used FMDV sequences from cattle and other species already deposited in public databases (listed in supplementary), and therefore is exempt from additional ethical approval requirements.
Author Contributions
FD, SL, and BB conceived the study. FD analyzed and interpreted the data, and drafted the manuscript. SL and BB provided guidance on the study design and the analysis, and contributed to interpreting the data and scientific discussions. All authors read and approved the final manuscript.
Conflict of Interest
The authors declare that the research was conducted in the absence of any commercial or financial relationships that could be construed as a potential conflict of interest.
Acknowledgments
This study was supported by Roslin Institute Strategic grant funding from the Biotechnology and Biological Sciences Research Council, UK (BBS/E/D/20002173). SL was supported by a Chancellor's Fellowship from the University of Edinburgh, and FD was supported by a Chancellor's Fellowship studentship.
Supplementary Material
The Supplementary Material for this article can be found online at: https://www.frontiersin.org/articles/10.3389/fevo.2019.00371/full#supplementary-material
References
Alexandersen, S., and Mowat, N. (2005). Foot-and-mouth disease: host range and pathogenesis. Curr. Top. Microbiol. Immunol. 288, 9–42. doi: 10.1007/3-540-27109-0_2
Alexandersen, S., Zhang, Z., Donaldson, A. I., and Garland, A. J. (2003). The pathogenesis and diagnosis of foot-and-mouth disease. J. Comp. Pathol. 129, 1–36. doi: 10.1016/S0021-9975(03)00041-0
Allepuz, A., Stevenson, M., Kivaria, F., Berkvens, D., Casal, J., and Picado, A. (2015). Risk factors for foot-and-mouth disease in Tanzania, 2001-2006. Transbound. Emerg. Dis. 62, 127–136. doi: 10.1111/tbed.12087
Bartley, L. M., Donnelly, C. A., and Anderson, R. M. (2002). Review of foot-and-mouth disease virus survival in animal excretions and on fomites. Vet. Rec. 151, 667–669. doi: 10.1136/vr.151.22.667
Bastos, A. D., Boshoff, C. I., Keet, D. F., Bengis, R. G., and Thomson, G. R. (2000). Natural transmission of foot-and-mouth disease virus between African buffalo (Syncerus caffer) and impala (Aepyceros melampus) in the Kruger National Park, South Africa. Epidemiol. Infect. 124, 591–598. doi: 10.1017/S0950268899004008
Belsham, G. J. (1993). Distinctive features of foot-and-mouth disease virus, a member of the picornavirus family; aspects of virus protein synthesis, protein processing and structure. Prog. Biophys. Mol. Biol. 60, 241–260. doi: 10.1016/0079-6107(93)90016-D
Bessell, P. R., Shaw, D. J., Savill, N. J., and Woolhouse, M. E. (2008). Geographic and topographic determinants of local FMD transmission applied to the 2001 UK FMD epidemic. BMC Vet. Res. 4:40. doi: 10.1186/1746-6148-4-40
Bielejec, F., Baele, G., Vrancken, B., Suchard, M. A., Rambaut, A., and Lemey, P. (2016). SpreaD3: interactive visualization of spatiotemporal history and trait evolutionary processes. Mol. Biol. Evol. 33, 2167–2169. doi: 10.1093/molbev/msw082
Bouckaert, R., Heled, J., Kühnert, D., Vaughan, T., Wu, C. H., Xie, D., et al. (2014). BEAST 2: a software platform for Bayesian evolutionary analysis. PLoS Comput. Biol. 10:e1003537. doi: 10.1371/journal.pcbi.1003537
Brito, B. P., Jori, F., Dwarka, R., Maree, F. F., Heath, L., and Perez, A. M. (2016). Transmission of foot-and-mouth disease SAT2 viruses at the wildlife-livestock interface of two major transfrontier conservation areas in Southern Africa. Front. Microbiol. 7:528. doi: 10.3389/fmicb.2016.00528
Bronsvoort, B. M. de C., Anderson, J., Corteyn, A., Hamblin, P., Kitching, R. P., Nfon, C., et al. (2006). Geographical and age-stratified distributions of foot-and-mouth disease virus-seropositive and probang-positive cattle herds in the Adamawa province of Cameroon. Vet. Rec. 159, 299–308. doi: 10.1136/vr.159.10.299
Casey, M. B., Lembo, T., Knowles, N. J., Fyumagwa, R., Kivaria, F., Maliti, H., et al. (2014). “Patterns of foot-and-mouth disease virus distribution in Africa,” in The Role of Animals in Emerging Viral Diseases, ed N. Johnson (Elsevier), 21–38. doi: 10.1016/B978-0-12-405191-1.00002-8
Casey-Bryars, M., Reeve, R., Bastola, U., Knowles, N. J., Auty, H., Bachanek-Bankowska, K., et al. (2018). Waves of endemic foot-and-mouth disease in eastern Africa suggest feasibility of proactive vaccination approaches. Nat. Ecol. Evol. 2, 1449–1457. doi: 10.1038/s41559-018-0636-x
Cottam, E. M., Haydon, D. T., Paton, D. J., Gloster, J., Wilesmith, J. W., Ferris, N. P., et al. (2006). Molecular epidemiology of the foot-and-mouth disease virus outbreak in the United Kingdom in 2001. J. Virol. 80, 11274–11282. doi: 10.1128/JVI.01236-06
Dean, A. S., Fournié, G., Kulo, A. E., Boukaya, G. A., Schelling, E., and Bonfoh, B. (2013). Potential risk of regional disease spread in west africa through cross-border cattle trade. PLoS ONE 8:e75570. doi: 10.1371/journal.pone.0075570
Dellicour, S., Rose, R., Faria, N. R., Lemey, P., and Pybus, O. G. (2016a). SERAPHIM: studying environmental rasters and phylogenetically-informed movements. Bioinformatics 32, 3204–3206. doi: 10.1093/bioinformatics/btw384
Dellicour, S., Rose, R., and Pybus, O. G. (2016b). Explaining the geographic spread of emerging epidemics: a framework for comparing viral phylogenies and environmental landscape data. BMC Bioinformatics 17:82. doi: 10.1186/s12859-016-0924-x
Di Nardo, A., Knowles, N. J., and Paton, D. J. (2011). Combining livestock trade patterns with phylogenetics to help understand the spread of foot and mouth disease in sub-Saharan Africa, the Middle East and Southeast Asia. Rev. Sci. Tech. 30, 63–85. doi: 10.20506/rst.30.1.2022
Dion, E., VanSchalkwyk, L., and Lambin, E. F. (2011). The landscape epidemiology of foot-and-mouth disease in South Africa: a spatially explicit multi-agent simulation. Ecol. Modell. 222, 2059–2072. doi: 10.1016/j.ecolmodel.2011.03.026
Domingo, E., Baranowski, E., Escarmís, C., and Sobrino, F. (2002). Foot-and-mouth disease virus. Comp. Immunol. Microbiol. Infect. Dis. 25, 297–308. doi: 10.1016/S0147-9571(02)00027-9
Donaldson, A. I., Alexandersen, S., Sørensen, J. H., and Mikkelsen, T. (2001). Relative risks of the uncotrollable (airborne) spread of FMD by different species. Vet. Rec. 148, 602–604. doi: 10.1136/vr.148.19.602
Drummond, A., Pybus, O. G., and Rambaut, A. (2003). Inference of viral evolutionary rates from molecular sequences. Adv. Parasitol. 54, 331–358. doi: 10.1016/S0065-308X(03)54008-8
Drummond, A. J., Ho, S. Y., Phillips, M. J., and Rambaut, A. (2006). Relaxed phylogenetics and dating with confidence. PLoS Biol. 4:e88. doi: 10.1371/journal.pbio.0040088
Drummond, A. J., and Rambaut, A. (2007). BEAST: Bayesian evolutionary analysis by sampling trees. BMC Evol. Biol. 7:214. doi: 10.1186/1471-2148-7-214
Flood, J. S., Porphyre, T., Tildesley, M. J., and Woolhouse, M. E. (2013). The performance of approximations of farm contiguity compared to contiguity defined using detailed geographical information in two sample areas in Scotland: implications for foot-and-mouth disease modelling. BMC Vet. Res. 9:198. doi: 10.1186/1746-6148-9-198
Gill, M. S., Lemey, P., Faria, N. R., Rambaut, A., Shapiro, B., and Suchard, M. A. (2013). Improving Bayesian population dynamics inference: a coalescent-based model for multiple loci. Mol. Biol. Evol. 30, 713–724. doi: 10.1093/molbev/mss265
Hall, M. D., Knowles, N. J., Wadsworth, J., Rambaut, A., and Woolhouse, M. E. (2013). Reconstructing geographical movements and host species transitions of foot-and-mouth disease virus serotype SAT 2. MBio 4, e00591–e00513. doi: 10.1128/mBio.00591-13
Hamoonga, R., Stevenson, M. A., Allepuz, A., Carpenter, T. E., and Sinkala, Y. (2014). Risk factors for foot-and-mouth disease in Zambia, 1981-2012. Prev. Vet. Med. 114, 64–71. doi: 10.1016/j.prevetmed.2014.01.014
Kahle, D., and Wickham, H. (2013). ggmap: spatial visualization with ggplot2. R J. 5, 144–161. doi: 10.32614/RJ-2013-014
Katoh, K., Rozewicki, J., and Yamada, K. D. (2017). MAFFT online service: multiple sequence alignment, interactive sequence choice and visualization. Brief. Bioinform. 2017, 1–7. doi: 10.1093/bib/bbx108
Knowles, N. J. (1990). FMD History. Available online at: http://www.picornaviridae.com/aphthovirus/fmdv/fmd_history.htm (accessed May 25, 2018).
Kühnert, D., Wu, C. H., and Drummond, A. J. (2011). Phylogenetic and epidemic modeling of rapidly evolving infectious diseases. Infect. Genet. Evol. 11, 1825–1841. doi: 10.1016/j.meegid.2011.08.005
Lemey, P., Rambaut, A., Bedford, T., Faria, N., Bielejec, F., Baele, G., et al. (2014). Unifying viral genetics and human transportation data to predict the global transmission dynamics of human influenza H3N2. PLoS Pathog. 10:e1003932. doi: 10.1371/journal.ppat.1003932
Lemey, P., Rambaut, A., Drummond, A. J., and Suchard, M. A. (2009). Bayesian phylogeography finds its roots. PLoS Comput. Biol. 5:e1000520. doi: 10.1371/journal.pcbi.1000520
Lemey, P., Rambaut, A., Welch, J. J., and Suchard, M. A. (2010). Phylogeography takes a relaxed random walk in continuous space and time. Mol. Biol. Evol. 27, 1877–1885. doi: 10.1093/molbev/msq067
Lycett, S., Tanya, V. N., Hall, M., King, D. P., Mazeri, S., Mioulet, V., et al. (2019). The evolution and phylodynamics of serotype A and SAT2 foot-and-mouth disease viruses in endemic regions of Africa. Sci. Rep. 9:5614. doi: 10.1038/s41598-019-41995-4
Lyons, N. A., Alexander, N., Stärk, K. D. C., Dulu, T. D., Sumption, K. J., James, A. D., et al. (2015). Impact of foot-and-mouth disease on milk production on a large-scale dairy farm in Kenya. Prev. Vet. Med. 120, 177–186. doi: 10.1016/j.prevetmed.2015.04.004
Mack, R. (1970). The great African cattle plague epidemic of the 1890's. Trop. Anim. Health Prod. 2, 210–219.
Maleko, D. D., Mbassa, G. N., Maanga, W. F., and Sisya, E. (2012). S. Impacts of wildlife-livestock interactions in and around Arusha National Park, Tanzania. Curr. Res. J. Biol. Sci. 4, 471–476. Available online at: https://maxwellsci.com/print/crjbs/v4-471-476.pdf
Martin, D. P., Murrell, B., Golden, M., Khoosal, A., and Muhire, B. (2015). RDP4: detection and analysis of recombination patterns in virus genomes. Virus Evol. 1:vev003. doi: 10.1093/ve/vev003
McRae, B. H. (2006). Isolation By Resistance. Evolution (N. Y). 60, 1551–1561. doi: 10.1554/05-321.1
Miguel, E., Grosbois, V., Caron, A., Boulinier, T., Fritz, H., Cornélis, D., et al. (2013). Contacts and foot and mouth disease transmission from wild to domestic bovines in Africa. Ecosphere 4, 1–32. doi: 10.1890/ES12-00239.1
Motta, P., Porphyre, T., Handel, I., Hamman, S. M., Ngu Ngwa, V., Tanya, V., et al. (2017). Implications of the cattle trade network in Cameroon for regional disease prevention and control. Sci. Rep. 7:43932. doi: 10.1038/srep43932
Perry, B. D., Randolph, T. F., Ashley, S., Chimedza, R., Forman, T., Morrison, J., et al. (2003). The Impact and Poverty Reduction Implications of Foot and Mouth Disease Control in Southern Africa With Special Reference to Zimbabwe. Nairobi: International Livestock Research Institute (ILRI).
Pybus, O. G., and Rambaut, A. (2009). Evolutionary analysis of the dynamics of viral infectious disease. Nat. Rev. Genet. 10, 540–550. doi: 10.1038/nrg2583
Rambaut, A. (2009). FigTree. Available online at: http://tree.bio.ed.ac.uk/software/figtree/ (accessed April 25, 2018).
Robinson, S. E., and Christley, R. M. (2007). Exploring the role of auction markets in cattle movements within Great Britain. Prev. Vet. Med. 81, 21–37. doi: 10.1016/j.prevetmed.2007.04.011
Robinson, T. P., Thornton, P. K, Franceschini, G., Kruska, R. L., Chiozza, F., Notenbaert, A., et al. (2011). Global Livestock Production Systems. Rome: Food and Agriculture Organization of the United Nations (FAO) and International Livestock Research Institute (ILRI), 152.
Sangula, A. K., Belsham, G. J., Muwanika, V. B., Heller, R., Balinda, S. N., Masembe, C., et al. (2010). Evolutionary analysis of foot-and-mouth disease virus serotype SAT 1 isolates from east africa suggests two independent introductions from Southern Africa. BMC Evol. Biol. 10:371. doi: 10.1186/1471-2148-10-371
Schrijver, R. S., and Vosloo, W. (2011). “Diseases of dairy animals - infectious diseases: foot-and-mouth disease,” in Encyclopedia of Dairy Sciences, 2nd Edn. ed J. W. Fuquay (Elsevier), 160–167. doi: 10.1016/B978-0-12-374407-4.00132-1
Tavare, S. (1986). Some probabilistic and statistical problems in the analysis of dna sequences. Lect. Math. Life Sci. 17, 57–86.
Tekleghiorghis, T., Moormann, R. J., Weerdmeester, K., and Dekker, A. (2016). Foot-and-mouth disease transmission in Africa: implications for control, a review. Transbound. Emerg. Dis. 63, 136–151. doi: 10.1111/tbed.12248
Thomson, G. R., Vosloo, W., and Bastos, A. D. (2003). Foot and mouth disease in wildlife. Virus Res. 91, 145–161. doi: 10.1016/S0168-1702(02)00263-0
Trovão, N. S., Baele, G., Vrancken, B., Bielejec, F., Suchard, M. A., Fargette, D., et al. (2015). Host ecology determines the dispersal patterns of a plant virus. Virus Evol. 1:vev016. doi: 10.1093/ve/vev016
Tully, D. C., and Fares, M. A. (2008). The tale of a modern animal plague: tracing the evolutionary history and determining the time-scale for foot and mouth disease virus. Virology 382, 250–256. doi: 10.1016/j.virol.2008.09.011
Vosloo, W., Bastos, A. D., Sangare, O., Hargreaves, S. K., and Thomson, G. R. (2002). Review of the status and control of foot and mouth disease in sub-Saharan Africa. Rev Sci Tech. 21, 437–449. doi: 10.20506/rst.21.3.1349
Vosloo, W., Thompson, P. N., Botha, B., Bengis, R. G., and Thomson, G. R. (2009). Longitudinal study to investigate the role of impala (Aepyceros melampus) in foot-and-mouth disease maintenance in the Kruger National Park, South Africa. Transbound. Emerg. Dis. 56, 18–30. doi: 10.1111/j.1865-1682.2008.01059.x
Weaver, G. V., Domenech, J., Thiermann, A. R., and Karesh, W. B. (2013). Foot and mouth disease: a look from the wild side. J. Wildl. Dis. 49, 759–785. doi: 10.7589/2012-11-276
Keywords: foot-and-mouth disease virus, phylogeography, phylogeny, epidemiology, Bayesian inference, generalized linear models (GLM)
Citation: Duchatel F, Bronsvoort BMdC and Lycett S (2019) Phylogeographic Analysis and Identification of Factors Impacting the Diffusion of Foot-and-Mouth Disease Virus in Africa. Front. Ecol. Evol. 7:371. doi: 10.3389/fevo.2019.00371
Received: 12 November 2018; Accepted: 17 September 2019;
Published: 09 October 2019.
Edited by:
Fulvio Cruciani, Sapienza University of Rome, ItalyReviewed by:
Graham John Belsham, University of Copenhagen, DenmarkDavid Lefebvre, Sciensano, Belgium
Copyright © 2019 Duchatel, Bronsvoort and Lycett. This is an open-access article distributed under the terms of the Creative Commons Attribution License (CC BY). The use, distribution or reproduction in other forums is permitted, provided the original author(s) and the copyright owner(s) are credited and that the original publication in this journal is cited, in accordance with accepted academic practice. No use, distribution or reproduction is permitted which does not comply with these terms.
*Correspondence: Samantha Lycett, c2FtYW50aGEubHljZXR0QGVkLmFjLnVr