 Saul Castañeda1,2
 Francisco Botello
 Víctor Sánchez-Cordero
 Sahotra Sarkar
- 1Departamento de Zoología, Instituto de Biología, Universidad Nacional Autónoma de Mexico, Mexico City, Mexico
- 2Departamento de Monitoreo Biológico y Planeación de Conservación, Conservación Biológica y Desarrollo Social, Mexico City, Mexico
- 3Departament of Integrative Biology and Philosophy, University of Texas at Austin, Austin, TX, United States
Efforts to conserve the migratory phenomenon of monarch butterflies in eastern North America have increased since a 2013–2014 monitoring report documenting a historical population low at the Monarch Butterfly Biosphere Reserve in Mexico. Surprisingly, there have been few systematic attempts to develop predictive models of monarch butterfly distributions along their migratory route between Mexico, the United States and Canada. Here we produced monthly habitat suitability models for monarch butterflies along their migratory route to identify potential areas for resting, feeding, and reproduction of the population. We compiled a point occurrence database of monarch butterflies for Mexico, USA, and Canada, including georeferenced records from GBIF, the Naturalista platform in Mexico, Correo Real initiative, and the Mexican governmental monitoring network for the monarch butterfly. We produced monthly habitat suitability models (HSM), using the R language and environment for statistical computing, abiotic (WorldClim), edaphic, and topographic variables. A total of 95 HSM were produced for each month. June to September, corresponding to the reproduction months in North America showed the highest geographic extent with suitable habitats; April, corresponding to the reproduction of the first post-migration generation, showed the smallest area. September, October, and November, correspond to the movement of the monarch butterfly southward, showed typical recognized distribution of the phenomenon and the overwintering months. December to February showed the smallest geographic extent in habitat suitability. Edaphic variables ranked high in importance in HSM for 11 of 12 months, indicating the relevance of vegetation and floral resources in the monarch butterfly migration route. Identifying such regions contribute to establish concrete conservation programs accordingly, as reduction of the use of pesticides and herbicides, decrease in the speed of cars in roads, and planting species with high nectary value, among other. Our study provides a first predictive spatio-temporal approximation of the monarch butterfly migratory route annual cycle.
Introduction
The eastern North American monarch butterfly (Danaus plexippus) population undertakes the longest documented insect migration in the world (Agrawal, 2017; Sarkar, 2017). The journey from its overwintering habitat in central Mexico to the Midwest and northeast of the United States and southeastern Canada over 3–4 generations each spring, and back to Mexico in one generation each fall, is up to 4,500 km each way. The behavioral complexity of the long and, in one direction multi-generational, migration both makes the phenomenon unique and of conservation interest, but also difficult to protect because of the extent and diversity of habitats used by the monarch butterflies. There is also a western population of monarchs that was believed to winter in southern California and migrate to northern California and further north and east during the summer. While it was assumed that the two populations were geographically isolated, evidence has recently accumulated of moderate gene flow between them (Yang et al., 2016; Agrawal, 2017).
Overwintering monarch populations of the eastern population at the Monarch Butterfly Biosphere Reserve in the State of Michoacan and the State of Mexico, were estimated to be over 400 million individuals in the early 1990s but only about a hundred million since 2010 with a historical low of about 35 million in 2013–2014. Efforts to conserve the migratory phenomenon of monarch butterflies have increased since that monitoring report. Different threats have been proposed to negatively affect monarch butterflies along their migratory route including (a) the lack of availability of milkweed (Asclepias ssp.) in their breeding areas due to pesticide use along their migratory route, contributing to loss of vegetation (the milkweed limitation hypothesis; Brower et al., 2012); (b) individual mortality during the fall migration (the migration survival hypothesis; Agrawal, 2017); (c) decline in the size of the winter habitat for roosting in Mexico (the winter habitat loss hypothesis; Brower et al., 2012); (d) extreme climatic events in their overwintering area (the climate hypothesis; Brower et al., 2012), and the loss of nectar resources (Malcolm, 2018). Multiple causal mechanisms may be responsible for the decline in monarch numbers and no single hypothesis yet suggested can be excluded. The relative role of each of the proposed mechanisms will require further research.
Thus, it is useful to map the areas used by the monarch butterflies at discrete time steps; HSM models built from records at monthly time intervals allows us to examine how habitat selection changes over the course of the monarch butterfly migration (Batalden et al., 2007; Hayes et al., 2015; Coxen et al., 2017). In the case of the eastern monarch butterfly population, HSM models for the reproductive season (March–September) have been produced for the United States and Canada (Batalden et al., 2007; Lemoine, 2015). Those results reported that monarch butterflies prefer similar environmental features throughout the summer but switch to a very different set of environmental features for the winter (Batalden et al., 2007; Lemoine, 2015).
Since the report showing low values of the overwintering population in 2013–2014 (Vidal and Rendón-Salinas, 2014), several initiatives have been launched to improve our knowledge on the migratory route of the monarch butterfly in Mexico. For example, the establishment of the Monarch Butterfly National Monitoring Network in 2015 includes now detailed monitoring programs in 44 protected areas in 29 states that have produced more than 4,000 new records of monarchs butterflies along their migratory route in Mexico (CEC, 2017). New data demonstrate that there are monarch butterflies crossing southward along western of Mexico in the States of Chihuahua, Durango, Nayarit, and Sinaloa (unpublished data). This means that the western population does not overwinter only in California. The extended southern migration could hypothetically also facilitate interbreeding between the eastern and western populations, which would be in closer spatial proximity during the winter compared to the summer. Moreover, a new wintering site in the same geographical region as those previously known was reported during the 2018–2019 season. Given this context, we aimed to produce spatio-temporal HSM for both the eastern and western populations of the monarch butterfly migratory route. Our study intends to provide a first predictive spatio-temporal approximation of both the eastern and western populations of the monarch butterfly at a monthly resolution.
Materials and Methods
Our methodology involves building monthly HSM using a maximum entropy modeling approach. HSM use two sources of data: occurrence (or presence-pseudo-absence) points (longitude and latitude of observation of an individual) and a set of environmental layers. This methodology does not require presence-absence data for species that can only be obtained from systematic surveys. In the case of monarch butterflies, this is particularly important because most occurrence points consist of observations by citizen scientists. The output of the model consists of the relative occurrence rate of the species in every cell located within the geographical study area over which the model is constructed. This distribution of spatial probabilities can form the basis for further analysis or converted into a binary distribution map using a minimum probability threshold for predicted presence of a species or some other similar method (Phillips et al., 2006).
Presence Data
We obtained records of collected specimens and observations of monarch butterflies as follows: Global Biodiversity Information Facility, GBIF (12,806 records of collected specimens and observations, references below; download of records 15 March 2018), the Naturalista platform, CONABIO, Mexico (2,166 records of observations, http://www.naturalista.mx/taxa/43155-Danaus-plexipus, download of records 21 December 2017), Correo Real Initiative, Mexico, CRI (11,199 records of observations, unpublished data), the database of the National Monarch Butterfly Monitoring Network in Mexico, NMMN (4,050 records, unpublished data), published records of overwintering colonies in Mexico (Vidal and Rendón-Salinas, 2014; 96 records) and unpublished data CONANP (6 records). We refined this database selecting: (a) only georeferenced records between 1970 and 2018, (b) records where collectors or observers were specifically mentioned, (c) unique localities, and (d) records with complete dates (day, month, and year), totaling 1,928 records.
Predictor Variables
We used climatic, topographic, and edaphic variables as environmental layers to produce the HSM monarch occurrence. These variables represent direct and indirect gradients (Austin, 2002) that are presumed to be ecologically meaningful for monarch butterflies, as floral resources along the migratory route, or in overwintering grounds (Table 1). The selected climatic variables were minimum and maximum monthly and average values for temperature, precipitation, solar radiation, wind speed, and water vapor pressure from the WorldClim 2.0 database at the 30 arc-second (~1 km2) spatial resolution (Fick and Hijmans, 2017). The 19 bioclimatic variables derived from WorldClim data are extensively used in model construction (Booth et al., 2014; Porfirio et al., 2014; Vega et al., 2017). Since they represent annual trends, extreme values and seasonality calculated from temperature and precipitation of more than 1 month (e.g., BIO5 = Max Temperature of Warmest Month), they may not have spatio-temporal coincidence with all the presence records along the migratory route. Thus, these variables were not all used produce HSM; rather, only the climatic variables that matched the month of observation of the records were selected. A similar monthly approach has been used to model the ecological niche of breeding monarch butterfly populations (Batalden et al., 2007) and the distribution of migratory bat species in North America (Hayes et al., 2015).
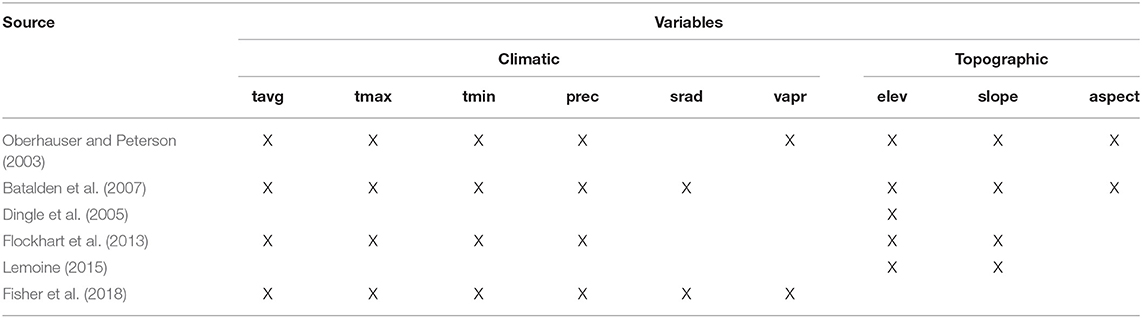
Table 1. List of climatic and topographic variables used in our study and in previous studies to model monarch butterfly distribution; tavg, average temperature; tmax, maximum temperature; tmin, minimum temperature; prec, precipitation; srad, solar radiation; vapr, water vapor pressure; elev, elevation; slope, slope; aspect, aspect.
The topographic variables included were elevation, slope, aspect, and Compound Topographic Index (Moore et al., 1991) from the HYDRO1k Elevation Derivative Database (EROS Center, 2015). These variables represent attributes that are related directly or indirectly to environmental gradients affecting species distributions (Franklin, 2010), they have been used to model plants (Franklin, 1995, 1998) as well as other taxon distributions (Elith et al., 2006; Hasui et al., 2017) and their inclusion can increase the accuracy of the models (Sormunen et al., 2011). Aspect values were transformed from continuous to categorical to reflect the slope direction as cardinal points. The edaphic variables were percent of clay content, bulk density, pH and organic carbon values at 0.05, 0.3, and 2 m soil depth obtained from SoilGrids1km database (Hengl et al., 2014). These are known to affect plant growth and have been used to predict the distribution of shrub species (Hageer et al., 2017). Although they are not very frequently used, edaphic variables could improve the predictive value of distribution models of plant species based solely on climate and topographic predictors (Dubuis et al., 2013; Buri et al., 2017; Hageer et al., 2017; Figueiredo et al., 2018). In sum, we included seven climatic, four topographic and 12 edaphic variables, respectively.
Treatment of Occurrence Data
The occurrence points were treated by removing outliers according to the values of the predictor variables using (a) its position with respect to the interquartile range, and (b) with the reverse Jackknife procedure implemented in the R “Biogeo” package (Robertson, 2016; Robertson et al., 2016). Given that there are resident monarch butterflies and presence data do not provide enough information to discriminate residents from migrant individuals, occurrence points were eliminated on the basis of expert opinion that these records should be considered as residents according to their geographical position and date. For example, all records from April to August of Mexico and records from November to February of northern Mexico and southern USA, were considered to be from non-migratory monarch butterflies and were removed. Table 3 summarizes the results of this process by recording the number of occurrence points that remained in the dataset after outliers were removed (See Acknowledgments for the list of experts).
Habitat Suitability Models
HSM were constructed using a maximum entropy algorithm (Phillips et al., 2006). Records were grouped by month, and each month was modeled separately. For model calibration, the values of the climatic variables for the corresponding month were selected along with the topographic and edaphic variables, and spatially masked to the polygons of the terrestrial ecoregions of the world (Olson and Dinerstein, 2002) that contained occurrence points. We chose the ecoregions as a delimitation criteria (Soberón and Peterson, 2005) to draw pseudo-absences from Di Febbraro et al. (2016), since they reflect the history of the distributions of particular biotas (Soberón, 2010), and represent suitable areas for species that have been presumably available over a relevant time period (Barve et al., 2011). Thus, there were 12 sets of 23 predictive variables, one set for each month.
Multicollinearity can confound the interpretation of variables driving the spatial distributions derived from species HSM (Elith et al., 2010; Dormann et al., 2013). It is recommended to minimize correlation among them through different methods (Merow et al., 2013). Highly correlated variables were identified and removed using the variance inflation factor (VIF) with the R package “usdm” (Naimi et al., 2014). The algorithm identifies a pair of variables with a correlation coefficient greater than a defined threshold (i.e., 0.7), removing the variable with the highest VIF, and repeats the process until no highly correlated variables remains. Further, presence-background data records from collections or citizen science projects are typically biased since they often come from opportunistic surveys or accessible sites (Dennis and Thomas, 2000; Syfert et al., 2013; Bird et al., 2014; Fithian et al., 2015). This sampling bias could affect performance and lead to inaccurate models (Phillips et al., 2009; Fourcade et al., 2014). One approach to reduce the effects of sampling bias is thinning the occurrence records in the geographical space, and removing those located at a distance from the nearest neighbor lesser than a threshold distance (NND) (Aiello-Lammens et al., 2015). Although there is a considerable number of records in our dataset, geographical thinning results in a significant reduction at a small NND (Figure 1). Therefore, we used a target-group background approach (TGB). TGB approach is a method proposed to deal with sampling bias by choosing background or pseudo-absence data with the same bias as occurrence data (Phillips et al., 2009). We constructed a kernel density map as a bias file for each month with records of the Nymphalidae family obtained from GBIF, masked them with the polygons of the terrestrial ecoregions of the world (Olson and Dinerstein, 2002) that contained occurrence points, and used them as sampling probability surface to draw 10,000 random pseudo-absences (Di Febbraro et al., 2016).
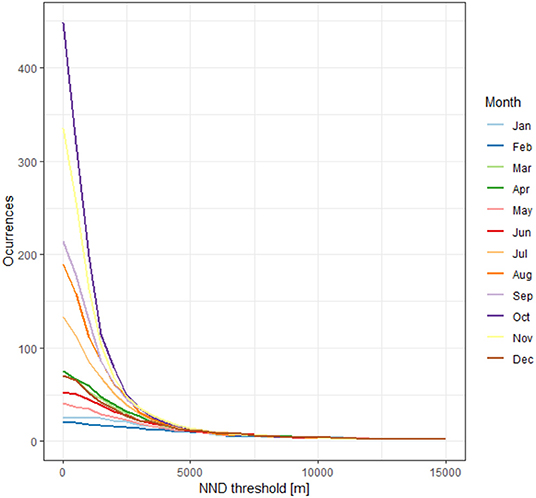
Figure 1. Occurrence records of monarch butterflies remaining after a geographical thinning at different nearest neighbor distances.
For each of the 12 sets of predictive variables, 95 HSM were constructed with MaxEnt Version 3. 3.3K (Phillips et al., 2006). For each model, a unique combination of 19 feature classes (FC) and five regularization multipliers (RM) were used. These two parameters have influence on model accuracy (Phillips and Dudík, 2008; Merow et al., 2013) and it is recommended to “tune” them since the MaxEnt default settings can lead to overly complex models (Radosavljevic and Anderson, 2014). The FC are transformations of the covariates (i.e., predictor variables) that allows the fitting of non-linear and complex response curves (Elith et al., 2011; Merow et al., 2013), while the RM are constant values that prevent model over-fitting (Phillips and Dudík, 2008; Merow et al., 2013). The FC used were: L = linear; Q = quadratic; P = product T = threshold, H = hinge; and 14 combinations of them (i.e., LQ, LP, LH, LT, QP, QH, QT, PH,PT, HT, LQP, LQPH, LQPT, and LQPHT). The RM values went from 1 to 5 by increments of 1. Parameter tuning and model fitting were performed with the R package “ENMEval” (Muscarella et al., 2014). The data were partitioned into training and testing bins by the “checkerboard2” method, which is a masked geographically structured approach (Radosavljevic and Anderson, 2014). This method divides the presences and pseudo-absences into four bins according to two different checkerboard-like grids based on an aggregation factor set to 10 (Figure 2) (Muscarella et al., 2014).
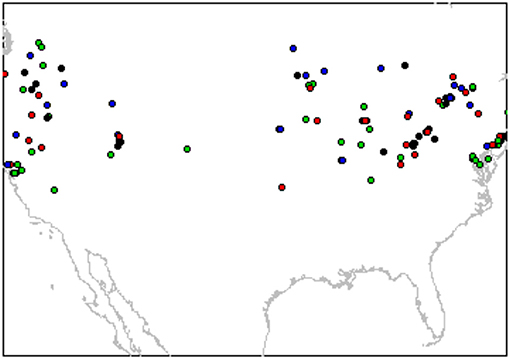
Figure 2. Partition of monarch butterfly localities from compiled records into four bins (different colors) by the “checkerboard2” method to train and test the models (See Methods for details).
Of the 95 models, the HSM with the best performance was selected with a sequential approximation, by first minimizing the difference between the sample-size-adjusted Akaike information criterion value (AICc) (Warren and Seifert, 2011) of the ith model and the model with the lowest AICc value (ΔAICc). We minimized the difference between training and testing AUC, averaged across the four bins (avg.diff.AUC) (Muscarella et al., 2014). This approximation allowed to select the optimal model complexity, avoid overfitting (Wisz and Guisan, 2009; Sarkar et al., 2010; Warren and Seifert, 2011) and to use the second criterion (avg.diff.AUC) in case there were several models with the same ΔAICc value (Shcheglovitova and Anderson, 2013). The selected models were projected to the geographic space to the same extent of the predictors used to train the model. The continuous suitability projections were transformed to discrete presence-absence maps using the equal training sensitivity and specificity threshold, which is adequate for presence-background models (Cao et al., 2013). Its accuracy was assessed by means of the true skill statistic (TSS) (Allouche et al., 2006). TSS values ranges from −1 to 1, where 1 indicates perfect agreement and values < = 0 indicate a performance no better than random.
In order to detect areas of extrapolation due to predictor values non-analogous to those under which the models were calibrated, the extrapolation detection tool (ExDet) (Mesgaran et al., 2014), implemented in the “ecospat” package (Di Cola et al., 2017), was used. This tool measures the similarity between reference and projection domains like the Multivariate Environmental Similarity Surface feature implemented in MaxEnt, but allows to detect novel combinations between covariates, even if these are within the range of univariate variation (Mesgaran et al., 2014). Predictor values corresponding only to the presence and pseudo-absence points were used as reference, while the projection set included all the predictors values. ExDet output consist of continuous values; values below zero indicate novel conditions at the univariate level, values between zero and one indicate analogous conditions and values above one represents new covariable conditions. All analyses were carried out in the R language and environment for statistical computing (R Core Team, 2018).
Results
ΔAICc scores of the selected models were <2, indicating a good fit (Muscarella et al., 2014). Model predictive performance, estimated by the AUC based on the test set (tAUC) and TSS are shown in Table 2. tAUC scores had a range from 0.63 to 0.90 (mean = 0.79) while TSS ranged from 0.40 to 0.69 (mean = 0.57). Model projections to the geographical space are shown in Figure 3. The month with the largest extent of suitable area was September (2,105,545 km2) and it was also the month with predicted suitable habitat for the largest number of ecoregions (38). Conversely, the month with the lowest suitable area was December (28,305 km2). The number of ecoregions intersected by the habitat suitability predictions for this month were six (Table 3).
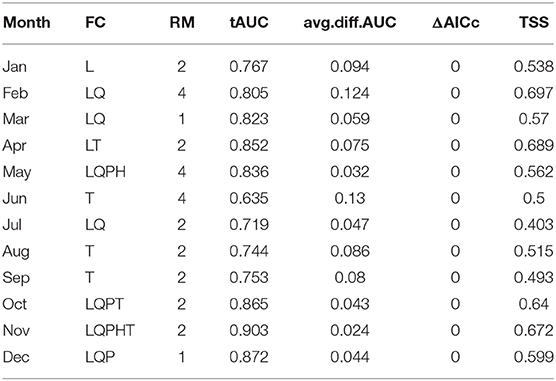
Table 2. Feature classes (FC), regularization multipliers (RM), AUC based on the test set (tAUC), average difference between training and testing AUC (av.diff.AUC), the difference between the sample-size-adjusted Akaike information criterion value (AICc) of the model, and the model with the lowest AICc value (ΔAICc), and true skill statistic (TSS) of the selected models by month for the monarch butterfly migratory route.
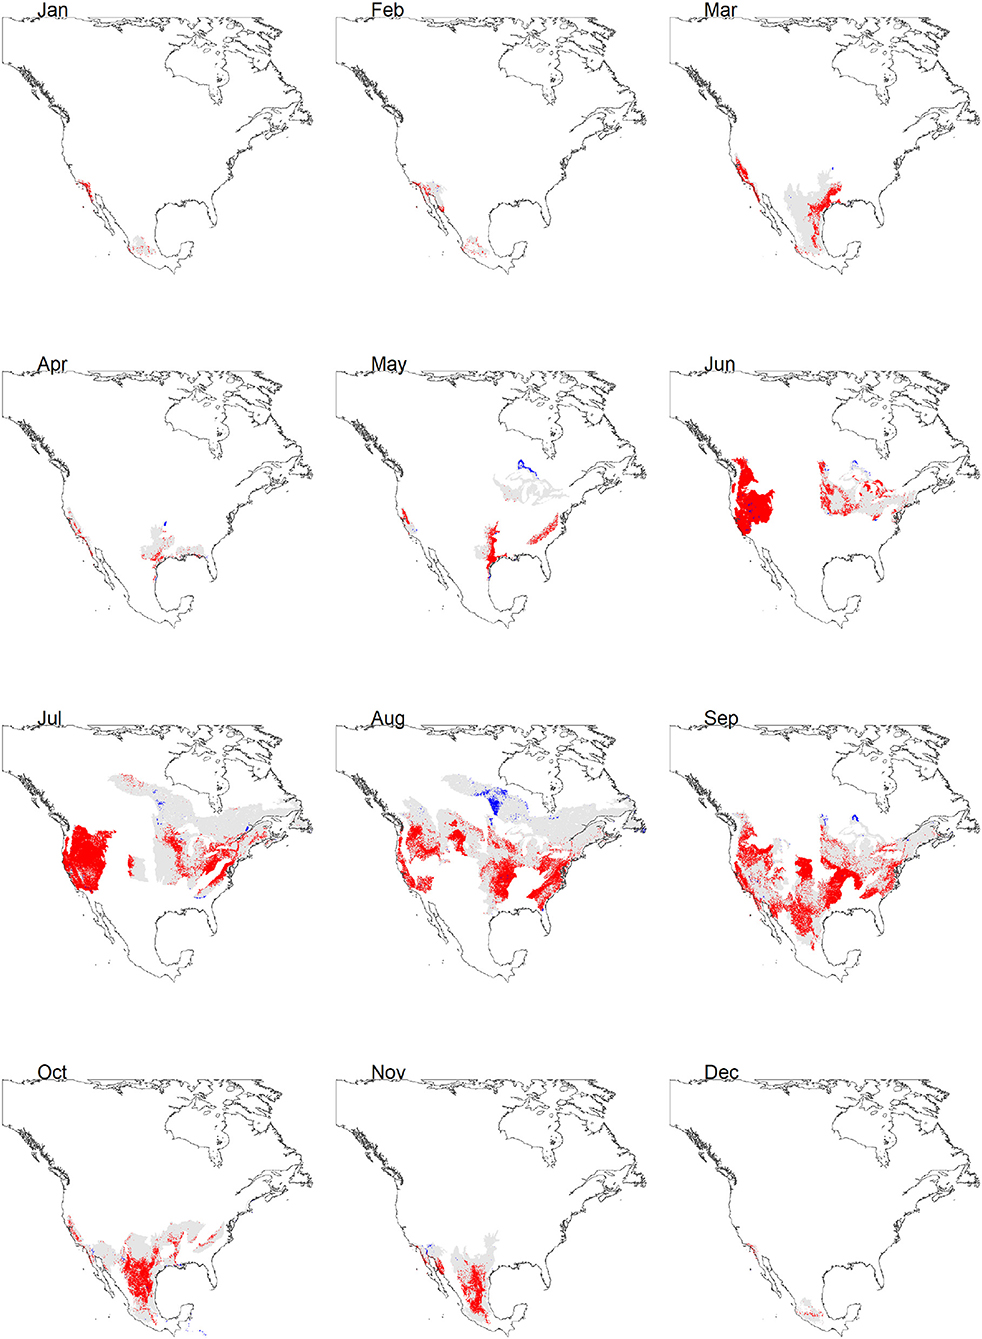
Figure 3. Continuous (gray areas) and discrete (red areas) suitability projections by month of the monarch butterfly migratory route. Blue areas indicate zones where model extrapolation occurs.
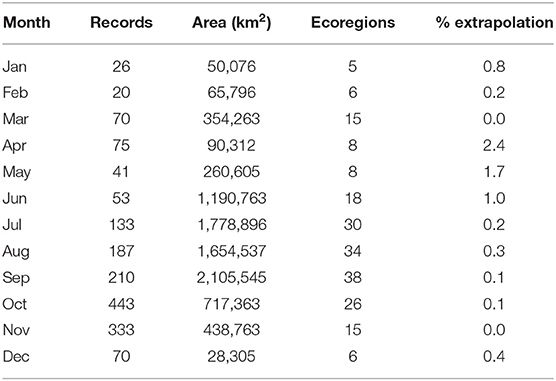
Table 3. Number of records, suitable area, number of ecoregions intersected by predicted suitable area and percentage of predicted suitable area where model extrapolation occurs for the monarch butterfly migratory route.
The differences in the extent of suitable areas between months showed a contraction-expansion pattern when grouped by different coarse defined stages. Southward movement stage (MS), that included September, October and part of November, presented a consistent suitable area reduction, reaching the smallest suitable area at the overwintering stage (OW). The northward movement stage presented an expansion through March and, although there was a contraction for the two first moths of the reproduction stage (REP) (i.e., April and May), the suitable area reached the largest extent at this stage (Figure 4).
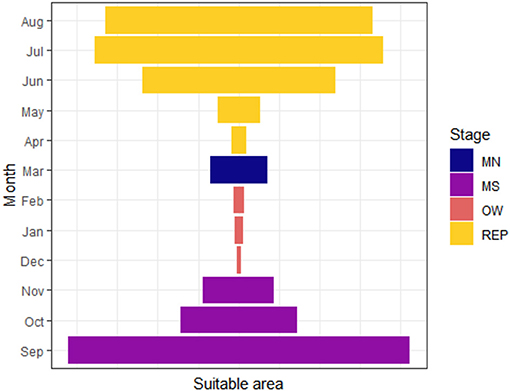
Figure 4. Expansion-contraction pattern of the suitable area extent for month and seasons for the monarch butterfly migratory route. MN, northward movement; MS, southward movement; OW, overwintering; REP, reproduction.
Predictor importance varied across months (Figure 5). According to permutation importance, minimum temperature was the most important for December and it was among the three most important variables for February and August. Precipitation was the first ranked for summer months (June and August), while water vapor pressure was one of the most important variables for January, March, April, July, October, and November. Edaphic variables were the most important for January, April, May, October, and among the three most important for the remaining months except February. The areas of extrapolation in the discrete projections were negligible; according to the performed with ExDet, none of them showed more than 2.5% of their area represented by non-analogous conditions (Figure 3, Table 3). This is not surprising since the calibration and projection extents were the same.
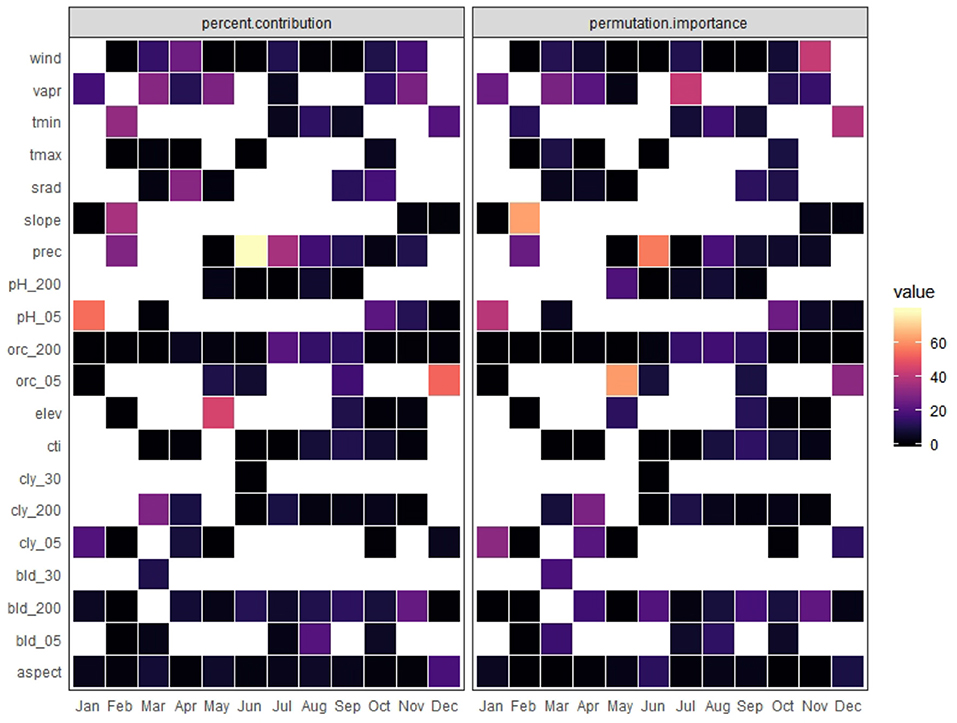
Figure 5. Variables showing percent contribution and permutation importance for each month for the monarch butterfly migratory route; aspect: aspect, bld_05:bulk density at 5 cm, bld_30; bulk density at 30 cm, bld_200: bulk density at 200 cm, cly_05: clay content at 5 cm, cly_30: clay content at 30 cm, cly_200: clay content at 200 cm, cti, compound topographic index; elev, elevation (m); orc_05, organic carbon at 5 cm; org_200, organic carbon at 200 cm; pH_05, pH at 5 cm; pH_200, pH at 200 cm; prec, precipitation (mm), slope; srad, solar radiation (kJ m−2 day−1); tmax, maximum temperature (°C); tmin, minimum temperature (°C); vapr, water vapor pressure (kPa); wind, wind speed (m s−1).
Discussion
Most of the records used in this study were obtained from citizen science. Thousands of individuals across North America participate annually in different initiatives to monitor the presence of monarch butterflies and these efforts allow, year after year, the delineation of a sketch of the movements of monarch butterflies. In the case of Mexico, for more than 25 years there have been several programs such as the Correo Real initiative that facilitate the tracking of the migratory route of the monarch butterfly the east of the country. Since October 2018, with the support of the National Commission of Natural Protected Areas of Mexico, a mobile application was created and has been available to facilitate the use of a monitoring protocol by citizen scientists. This application, which will be operational throughout the year, enables citizen scientists to report a wide suite of potentially relevant variables such as the growth stages of observed individuals and the physical state of the wings of the butterflies by transmitting photographs of the individuals. This application may significantly improve the quality of the data available including an ability to discern whether the recorded individuals are migratory or not. This in turn will allow better modeling and analysis of the migratory phenomenon in the future.
Due to the origin of these records, most of them have only basic information such as locality, date, and time. However, an increasing number of new records include additional relevant information such as measures of visible threats or behavior of monarch butterflies (e.g., perches, in erratic flight, migratory flow, or feeding). Given that there are also resident populations in Mexico, for which adults, caterpillars and eggs have been observed during the same months in which the migration occurs (unpublished data), the construction of monthly HSM for the migratory process may present shortcomings when the locations coincided with resident monarch individuals. Here we tried to minimize this problem by using expert opinions for the data set used for constructing the HSM.
Overall, the models of June to September were those that predicted larger spatial extents with suitable habitats (Figures 3, 4). This result concurs with predictions of the models proposed by Batalden et al. (2007). Conversely, April, corresponding to the reproduction of the first post-migration generation, had the smallest area for that season, with 90,312 km2. This result underscores the importance of monitoring and maintaining the critical habitat to reduce threats, so as to allow the population growth and the movement of the next generations, leading to large areas of suitable habitat in the subsequent months. On September, October, and November, corresponding to the movement of the monarch butterfly southward (CEC, 2017), the HSM showed typical recognized distribution of the migratory phenomenon. During the overwintering season (here considered between December to February due to the presence of multiple individuals following the route during November), our HSM resulted in a larger area than previously known to be occupied by monarch butterflies in central Mexico of <0.18 km2 (CEC, 2017) (Table 3; Figure 3). This overestimation is not surprising since the HSM did not considered some of the variables affecting their distribution (i. e. biotic variables like predation, parasitism, and food availability) (Soberón and Peterson, 2005).
The importance of the minimum temperature on December was consistent with previous findings (Masters et al., 1988), although not for the same month; Oberhauser and Peterson (2003) mentioned the influence of this variable for the overwintering season. On the other hand, the relevance of the edaphic variables is evident, ranking as important in the HSM for 11 of the 12 months. This result is indicative that vegetation and floral resources play an important role in the monarch butterfly migration route. Water availability is considered critical to the butterfly's survival (Bojórquez-Tapia et al., 2003); predictor variables related with this condition, as water vapor pressure and precipitation (Jones, 1987) showed to be relevant for the four stages. These findings demonstrate the pertinence of including other variables in addition to climatic variables for building HSM (Hageer et al., 2017). However, these interpretations should be taken with caution since the removal of highly correlated predictors poses the risk of leaving out those with ecological relevance for the species (Braunisch et al., 2013).
The HSM showed concordance with the identified overwintering zones in the west, both in California (USA) (Fisher et al., 2018) and in Baja California (Mexico). However, the model for March predicted a migratory route from the overwintering sites to the north of Mexico and south of the USA. It is crucial to document the monarch butterfly migration route followed in northwestern Mexico and citizen monitoring should be promoted in these regions during the spring migration. Our HSM corresponding to Abril apparently showed a smaller area than those resulting from other studies conducted for the eastern population (Batalden et al., 2007; Lemoine, 2015). Nonetheless, the HSM for May to August coincided remarkably with these studies, with the peculiarity that our model for September, seemed to adequately describe the migratory movements (Figure 4).
One contribution of our analysis is the urgency to establish collaborative agreements between multiple stakeholders to reduce the possible threats of priority sites of the monarch butterfly migratory route, both for the eastern (where many such sites have long been known), and for the western sites (Figure 3). Advances in the monitoring of autumn and spring migration will be crucial to determine, also, the proportion of individuals that could be moving between the two currently recognized populations. Our analysis has important conservation implications because it identified regions that have a high priority for monarch butterfly migration and, therefore, should be targeted for protection from the use of pesticides or insecticides. One strategy would be to establish dynamic conservation programs over specific months and regions. For example, targeting one set of areas, in March in Mexico for the beginning of the migration; in April, for the first reproduction event in Texas and California, and other areas for October and November for areas in Texas, California, and in Mexico for the fall migration.
Data Availability Statement
The habitat suitability models generated for this study are available on request to the corresponding author.
Author Contributions
SC cleaned and organized the data and modeled the potential distribution. FB made the original research design. SC, FB, VS-C, and SS contributed to the writing.
Funding
This work was partially funded by the Commission for Environmental Cooperation: proyect 241-00360 “Strengthening of the National Monarch Butterfly Monitoring Network along the Northwest migratory route in Mexico”.
Conflict of Interest
The authors declare that the research was conducted in the absence of any commercial or financial relationships that could be construed as a potential conflict of interest.
Acknowledgments
We thank Rocío Treviño (Correo Real Initiative), Marco Castro (CONANP) for sharing unpublished data, and the supervision of the monarch butterfly records. Jay Diffendorfen for revision of the monarch butterfly records. G. Monroy supported in the logistics of this project. The comments and suggestions of two reviewers and the editor greatly improved the presentation of this manuscript. We thank all citizens who, day by day, make an effort to contribute to the monitoring program providing many records of observation of monarch butterflies.
References
Agrawal, A. (2017). Monarchs and Milkweeds: A Migrating Butterfly, a Poisonous Plant, and Their Remarkable Story of Coevolution. Princeton, NJ: Princeton University Press.
Aiello-Lammens, M. E., Boria, R. A., Radosavljevic, A., Vilela, B., and Anderson, R. P. (2015). spThin: an R package for spatial thinning of species occurrence records for use in ecological niche models. Ecography 38, 541–545. doi: 10.1111/ecog.01132
Allouche, O., Tsoar, A., and Kadmon, R. (2006). Assessing the accuracy of species distribution models: prevalence, kappa and the true skill statistic (TSS). J. Appl. Ecol. 43, 1223–1232. doi: 10.1111/j.1365-2664.2006.01214.x
Austin, M. P. (2002). Spatial prediction of species distribution: an interface between ecological theory and statistical modelling. Ecol. Modell. 157, 101–118. doi: 10.1016/S0304-3800(02)00205-3
Barve, N., Barve, V., Jiménez-Valverde, A., Lira-Noriega, A., Maher, S. P., Peterson, A. T., et al. (2011). The crucial role of the accessible area in ecological niche modeling and species distribution modeling. Ecol. Modell. 222, 1810–1819. doi: 10.1016/j.ecolmodel.2011.02.011
Batalden, R. V., Oberhauser, K., and Peterson, A. T. (2007). Ecological niches in sequential generations of eastern North American monarch butterflies (Lepidoptera: Danaidae): the ecology of migration and likely climate change implications. Environ. Entomol. 36, 1365–1373. doi: 10.1603/0046-225X(2007)36<1365:ENISGO>2.0.CO;2
Bird, T. J., Bates, A. E., Lefcheck, J. S., Hill, N. A., Thomson, R. J., Edgar, G. J., et al. (2014). Statistical solutions for error and bias in global citizen science datasets. Biol. Conserv. 173, 144–154. doi: 10.1016/j.biocon.2013.07.037
Bojórquez-Tapia, L. A., Brower, L. P., Castilleja, G., Sánchez-Colón, S., Hernández, M., Calvert, W., et al. (2003). Mapping expert knowledge: redesigning the monarch butterfly biosphere reserve. Conserv. Biol. 17, 367–379. doi: 10.1046/j.1523-1739.2003.01309.x
Booth, T. H., Nix, H. A., Busby, J. R., and Hutchinson, M. F. (2014). BIOCLIM: the first species distribution modelling package, its early applications and relevance to most current MAXENT studies. Divers. Distribut. 20, 1–9. doi: 10.1111/ddi.12144
Braunisch, V., Coppes, J., Arlettaz, R., Suchant, R., Schmid, H., and Bollmann, K. (2013). Selecting from correlated climate variables: a major source of uncertainty for predicting species distributions under climate change. Ecography 36, 971–983. doi: 10.1111/j.1600-0587.2013.00138.x
Brower, L. P., Taylor, O. R., Williams, E. H., Slayback, D. A., Zubieta, R. R., and Ramirez, M. I. (2012). Decline of monarch butterflies overwintering in Mexico: is the migratory phenomenon at risk?. Insect Conserv. Divers. 5, 95–100. doi: 10.1111/j.1752-4598.2011.00142.x
Buri, A., Cianfrani, C., Pinto-Figueroa, E., Yashiro, E., Spangenberg, J. E., Adatte, T., et al. (2017). Soil factors improve predictions of plant species distribution in a mountain environment. Prog. Phys. Geogr. 41, 703–722. doi: 10.1177/0309133317738162
Cao, Y., DeWalt, R. E., Robinson, J. L., Tweddale, T., Hinz, L., and Pessino, M. (2013). Using Maxent to model the historic distributions of stonefly species in Illinois streams: the effects of regularization and threshold selections. Ecol. Modell. 259, 30–39. doi: 10.1016/j.ecolmodel.2013.03.012
CEC (2017). Monitoring Monarch Butteries and their Habitat across North America: Inventory and Monitoring Protocols and Data Standards for Monarch Conservation. Montreal, QC: Commission for Environmental Cooperation.
Coxen, C. L., Frey, J. K., Carleton, S. A., and Collins, D. P. (2017). Species distribution models for a migratory bird based on citizen science and satellite tracking data. Global Ecol. Conserv. 11, 298–311. doi: 10.1016/j.gecco.2017.08.001
Dennis, R. L. H., and Thomas, C. D. (2000). Bias in butterfly distribution maps: the influence of hot spots and recorder's home range. J. Insect Conserv. 4, 73–77. doi: 10.1023/A:1009690919835
Di Cola, V., Broennimann, O., Petitpierre, B., Breiner, F. T., D'amen, M., Randin, C., et al. (2017). ecospat: an R package to support spatial analyses and modeling of species niches and distributions. Ecography 40, 774–787. doi: 10.1111/ecog.02671
Di Febbraro, M., Martinoli, A., Russo, D., Preatoni, D., and Bertolino, S. (2016). Modelling the effects of climate change on the risk of invasion by alien squirrels. Hystrix 27, 1–8. doi: 10.4404/hystrix-27.1-11776
Dingle, H., Zalucki, M. P., Rochester, W. A., and Armijo-Prewitt, T. (2005). Distribution of the monarch butterfly, Danaus plexippus (L.)(Lepidoptera: Nymphalidae), in western North America. Biol. J. Linnean Soc. 85, 491–500. doi: 10.1111/j.1095-8312.2005.00512.x
Dormann, C. F., Elith, J., Bacher, S., Buchmann, C., Carl, G., Carré, G., et al. (2013). Collinearity: a review of methods to deal with it and a simulation study evaluating their performance. Ecography 36, 27–46. doi: 10.1111/j.1600-0587.2012.07348.x
Dubuis, A., Giovanettina, S., Pellissier, L., Pottier, J., Vittoz, P., and Guisan, A. (2013). Improving the prediction of plant species distribution and community composition by adding edaphic to topo-climatic variables. J. Veg. Sci. 24, 593–606. doi: 10.1111/jvs.12002
Elith, J., Graham, C. H., Anderson, R. P., Dudík, M., Ferrier, S., Guisan, A., et al. (2006). Novel methods improve prediction of species' distributions from occurrence data. Ecography 29, 129–151. doi: 10.1111/j.2006.0906-7590.04596.x
Elith, J., Kearney, M., and Phillips, S. (2010). The art of modelling range-shifting species. Methods Ecol. Evol. 1, 330–342. doi: 10.1111/j.2041-210X.2010.00036.x
Elith, J., Phillips, S. J., Hastie, T., Dudík, M., Chee, Y. E., and Yates, C. J. (2011). A statistical explanation of MaxEnt for ecologists. Divers. Distribut. 17,43–57. doi: 10.1111/j.1472-4642.2010.00725.x
EROS Center (2015). HYDRO1k Elevation Derivative Database Sioux Falls, South Dakota. Available online at: https://www.usgs.gov/centers/eros/science/usgs-eros-archive-digital-elevation-hydro1k?qt-science_center_objects=0#qt-science_center_objects
Fick, S. E., and Hijmans, R. J. (2017). WorldClim 2: new 1km spatial resolution climate surfaces for global land areas. Int. J. Climatol. 37, 4302–4315. doi: 10.1002/joc.5086
Figueiredo, F. O., Zuquim, G., Tuomisto, H., Moulatlet, G. M., Balslev, H., and Costa, F. R. (2018). Beyond climate control on species range: the importance of soil data to predict distribution of Amazonian plant species. J. Biogeogr. 45, 190–200. doi: 10.1111/jbi.13104
Fisher, A., Saniee, K., van der Heide, C., Griffiths, J., Meade, D., and Villablanca, F. (2018). Climatic Niche model for overwintering monarch butterflies in a topographically complex region of California. Insects 9:167. doi: 10.3390/insects9040167
Fithian, W., Elith, J., Hastie, T., and Keith, D. A. (2015). Bias correction in species distribution models: pooling survey and collection data for multiple species. Methods Ecol. Evol. 6, 424–438. doi: 10.1111/2041-210X.12242
Flockhart, D. T., Wassenaar, L. I., Martin, T. G., Hobson, K. A., Wunder, M. B., and Norris, D. R. (2013). Tracking multi-generational colonization of the breeding grounds by monarch butterflies in eastern North America. Proc. R. Soc. Lond. B Biol. Sci. 280:20131087. doi: 10.1098/rspb.2013.1087
Fourcade, Y., Engler, J. O., Rödder, D., and Secondi, J. (2014). Mapping species distributions with MAXENT using a geographically biased sample of presence data: a performance assessment of methods for correcting sampling bias. PloS ONE 9:e97122. doi: 10.1371/journal.pone.0097122
Franklin, J. (1995). Predictive vegetation mapping: geographic modelling of biospatial patterns in relation to environmental gradients. Prog. Phys. Geogr. 19, 474–499. doi: 10.1177/030913339501900403
Franklin, J. (1998). Predicting the distribution of shrub species in southern California from climate and terrain-derived variables. J. Veg. Sci. 9, 733–748. doi: 10.2307/3237291
Franklin, J. (2010). Mapping Species Distributions: Spatial Inference and Prediction. New York, NY: Cambridge University Press.
Hageer, Y., Esperón-Rodríguez, M., Baumgartner, J. B., and Beaumont, L. J. (2017). Climate, soil or both? Which variables are better predictors of the distributions of Australian shrub species?. Peer J. 5:e3446. doi: 10.7717/peerj.3446
Hasui, E., Silva, V. X., Cunha, R. G., Ramos, F. N., Ribeiro, M. C., Sacramento, M., et al. (2017). Additions of landscape metrics improve predictions of occurrence of species distribution models. J. For. Res. 28, 963–974. doi: 10.1007/s11676-017-0388-5
Hayes, M. A., Cryan, P. M., and Wunder, M. B. (2015). Seasonally-dynamic presence-only species distribution models for a cryptic migratory bat impacted by wind energy development. PLoS ONE 10:e0132599. doi: 10.1371/journal.pone.0132599
Hengl, T., de Jesus, J. M., MacMillan, R. A., Batjes, N. H., Heuvelink, G. B., Ribeiro, E., et al. (2014). SoilGrids1km—global soil information based on automated mapping. PLoS ONE 9:e105992. doi: 10.1371/journal.pone.0105992
Jones, R. E. (1987). Reproductive strategies for the seasonal tropics. Int. J. Trop. Insect Sci. 8, 515–521. doi: 10.1017/S1742758400022566
Lemoine, N. P. (2015). Climate change may alter breeding ground distributions of eastern migratory monarchs (Danaus plexippus) via range expansion of Asclepias host plants. PLoS ONE 10:e0118614. doi: 10.1371/journal.pone.0118614
Malcolm, S. B. (2018). Anthropogenic impacts on mortality and population viability of the monarch butterfly. Ann. Rev. Entomol. 63, 277–302. doi: 10.1146/annurev-ento-020117-043241
Masters, A. R., Malcolm, S. B., and Brower, L. P. (1988). Monarch butterfly (Danaus plexippus) thermoregulatory behavior and adaptations for overwintering in Mexico. Ecology 69, 458–467. doi: 10.2307/1940444
Merow, C., Smith, M. J., and Silander, J. A. Jr. (2013). A practical guide to MaxEnt for modeling species' distributions: what it does, and why inputs and settings matter. Ecography 36,1058–1069. doi: 10.1111/j.1600-0587.2013.07872.x
Mesgaran, M. B., Cousens, R. D., and Webber, B. L. (2014). Here be dragons: a tool for quantifying novelty due to covariate range and correlation change when projecting species distribution models. Divers. Distribut. 20, 1147–1159. doi: 10.1111/ddi.12209
Moore, I. D., Grayson, R. B., and Ladson, A. R. (1991). Digital terrain modelling: a review of hydrological, geomorphological, and biological applications. Hydrol. Process. 5, 3–30. doi: 10.1002/hyp.3360050103
Muscarella, R., Galante, P. J., Soley-Guardia, M., Boria, R. A., Kass, J. M., Uriarte, M., et al. (2014). ENMeval: an R package for conducting spatially independent evaluations and estimating optimal model complexity for Maxent ecological niche models. Methods Ecol. Evol. 5, 1198–1205. doi: 10.1111/2041-210X.12261
Naimi, B., Hamm, N. A., Groen, T. A., Skidmore, A. K., and Toxopeus, A. G. (2014). Where is positional uncertainty a problem for species distribution modelling? Ecography 37, 191–203. doi: 10.1111/j.1600-0587.2013.00205.x
Oberhauser, K., and Peterson, A. T. (2003). Modeling current and future potential wintering distributions of eastern North American monarch butterflies. Proc. Natl. Acad. Sci. U.S.A. 100, 14063–14068. doi: 10.1073/pnas.2331584100
Olson, D. M., and Dinerstein, E. (2002). The Global 200: priority ecoregions for global conservation. Ann. Missouri Bot. Garden 89, 125–126. doi: 10.2307/3298564
Phillips, S. J., Anderson, R. P., and Schapire, R. E. (2006). Maximum entropy modeling of species geographic distributions. Ecol. Model. 190, 231–259. doi: 10.1016/j.ecolmodel.2005.03.026
Phillips, S. J., and Dudík, M. (2008). Modeling of species distributions with Maxent: new extensions and a comprehensive evaluation. Ecography 31,161–175. doi: 10.1111/j.0906-7590.2008.5203.x
Phillips, S. J., Dudík, M., Elith, J., Graham, C. H., Lehmann, A., Leathwick, J., et al. (2009). Sample selection bias and presence-only distribution models: implications for background and pseudo-absence data. Ecol. Appl. 19, 181–197. doi: 10.1890/07-2153.1
Porfirio, L. L., Harris, R. M., Lefroy, E. C., Hugh, S., Gould, S. F., Lee, G., et al. (2014). Improving the use of species distribution models in conservation planning and management under climate change. PLoS ONE 9:e113749. doi: 10.1371/journal.pone,.0113749
R Core Team (2018). R: A Language and Environment for Statistical Computing. R Foundation for Statistical Computing, Vienna, Austria. Available online at: https://www.R-project.org/
Radosavljevic, A., and Anderson, R. P. (2014). Making better Maxent models of species distributions: complexity, overfitting and evaluation. J. Biogeogr. 41, 629–643. doi: 10.1111/jbi.12227
Robertson, M. P. (2016). Data From: biogeo: Point Data Quality Assessment and Coordinate Conversion. R package version 1.0. Available online at: https://CRAN.R-project.org/package=biogeo
Robertson, M. P., Visser, V., and Hui, C. (2016). Biogeo: an R package for assessing and improving data quality of occurrence record datasets. Ecography 39, 394–401. doi: 10.1111/ecog.02118
Sarkar, S., Strutz, S. E., Frank, D. M., Rivaldi, C. L., Sissel, B., and Sánchez–Cordero, V. (2010). Chagas disease risk in Texas. PLoS Negl. Trop. Dis. 4:e836. doi: 10.1371/journal.pntd.0000836
Shcheglovitova, M., and Anderson, R. P. (2013). Estimating optimal complexity for ecological niche models: a jackknife approach for species with small sample sizes. Ecol. Modell. 269, 9–17. doi: 10.1016/j.ecolmodel.2013.08.011
Soberón, J. (2010). Niche and area of distribution modeling: a population ecology perspective. Ecography 33, 159–167. doi: 10.1111/j.1600-0587.2009.06074.x
Soberón, J., and Peterson, A. T. (2005). Interpretation of models of fundamental ecological niches and species' distributional areas. Biodivers. Inform. 2, 1–10. doi: 10.17161/bi.v2i0.4
Sormunen, H., Virtanen, R., and Luoto, M. (2011). Inclusion of local environmental conditions alters high-latitude vegetation change predictions based on bioclimatic models. Polar Biol. 34, 883–897. doi: 10.1007/s00300-010-0945-2
Syfert, M. M., Smith, M. J., and Coomes, D. A. (2013). The effects of sampling bias and model complexity on the predictive performance of MaxEnt species distribution models. PLoS ONE 8:e55158. doi: 10.1371/annotation/35be5dff-7709-4029-8cfa-f1357e5001f5
Vega, G. C., Pertierra, L. R., and Olalla-Tárraga, M. Á. (2017). MERRAclim, a high-resolution global dataset of remotely sensed bioclimatic variables for ecological modelling. Sci. Data 4:170078. doi: 10.1038/sdata.2017.78
Vidal, O., and Rendón-Salinas, E. (2014). Dynamics and trends of overwintering colonies of the monarch butterfly in Mexico. Biol. Conserv. 180, 165–175. doi: 10.1016/j.biocon.2014.09.041
Warren, D. L., and Seifert, S. N. (2011). Ecological niche modeling in Maxent: the importance of model complexity and the performance of model selection criteria. Ecol. Appl. 21, 335–342. doi: 10.1890/10-1171.1
Wisz, M. S., and Guisan, A. (2009). Do pseudo-absence selection strategies influence species distribution models and their predictions? An information-theoretic approach based on simulated data. BMC Ecol. 9:8. doi: 10.1186/1472-6785-9-8
Keywords: citizen science, habitat suitability models, distribution, conservation areas, habitat suitability, monarch butterflies
Citation: Castañeda S, Botello F, Sánchez-Cordero V and Sarkar S (2019) Spatio-Temporal Distribution of Monarch Butterflies Along Their Migratory Route. Front. Ecol. Evol. 7:400. doi: 10.3389/fevo.2019.00400
Received: 28 February 2019; Accepted: 08 October 2019;
Published: 23 October 2019.
Edited by:
Wayne E. Thogmartin, United States Geological Survey (USGS), United StatesReviewed by:
Thomas Earl Dilts, University of Nevada, Reno, United StatesMirko Di Febbraro, University of Molise, Italy
Copyright © 2019 Castañeda, Botello, Sánchez-Cordero and Sarkar. This is an open-access article distributed under the terms of the Creative Commons Attribution License (CC BY). The use, distribution or reproduction in other forums is permitted, provided the original author(s) and the copyright owner(s) are credited and that the original publication in this journal is cited, in accordance with accepted academic practice. No use, distribution or reproduction is permitted which does not comply with these terms.
*Correspondence: Francisco Botello, ZnJhbmNpc2NvLmJvdGVsbG9AaWIudW5hbS5teA==