 Christine Fischer1,2*
 Christian Damm3
 Francis Foeckler4
 Marion Gelhaus5
 Lars Gerstner3Rebecca M. B. Harris1,6Tim G. Hoffmann7Janette Iwanowski7Hans Kasperidus1
 Dietmar Mehl7
 Simone A. Podschun8Andrea Rumm4
 Barbara Stammel5
 Mathias Scholz1
- 1Department of Conservation Biology, Helmholtz Centre for Environmental Research—UFZ, Leipzig, Germany
- 2Institute for Geosciences, Friedrich-Schiller-University Jena, Jena, Germany
- 3Department of Wetland Ecology, Karlsruhe Institute of Technology, Rastatt, Germany
- 4ÖKON Ltd., Association for Landscape Ecology, Limnology, and Environmental Planning, Kallmünz, Germany
- 5Floodplain Institute Neuburg, Schloss Grünau, Catholic University of Eichstätt-Ingolstadt, Neuburg, Germany
- 6Discipline of Geography and Spatial Science, University of Tasmania, Hobart, TAS, Australia
- 7Biota—Institute for Ecological Research and Planning Ltd., Bützow, Germany
- 8Leibniz-Institute of Freshwater Ecology and Inland Fisheries—IGB, Berlin, Germany
River floodplains provide a large number of ecosystem services (ESSs) for human societies. However, human manipulations of rivers and floodplains have led to the loss of many ESSs, including the provision of habitats for typical floodplain flora and fauna. To quantify such losses, we present a new index, which incorporates the functional and structural quality of riverine and alluvial habitats and their communities. The assessment is based on publicly available biotic and abiotic data at a local scale (e.g., habitat type mapping, species data). The new evaluation method consists of three steps: First, an evaluation at habitat type level is done by using well-established assessment criteria (e.g., groundwater dependence, legal protection status, regenerability). Secondly, the individual habitats are assessed based on specific quality characteristics (e.g., presence of protected birds or backwater influence). Finally, these values are aggregated within 1-km floodplain compartments weighted by their spatial expansion. The index uses a five-step value to describe the importance of a floodplain area for typical species and habitats from “very high” (=5) to “very low” (=1). The aim of this “habitat provision index” is to provide a tool for planners and decision makers to compare and analyze the effects of past or future measures. The methodical approach is tested for two rivers: the Nahe and the Rhine. The performance of the index is analyzed by comparing the current conditions (status quo) against two different scenarios. The index is validated and shown to be sensitive to different water management scenarios (river restoration and technical polder scenario for flood risk enhancement), with both scenarios showing an improvement in the habitat provision value.
Introduction
Floodplains and their rivers offer an enormous variety of habitats (aquatic, semi-aquatic, and terrestrial) and are hotspots of biodiversity (Ward et al., 1999; Robinson et al., 2002; Hughes et al., 2005; Scholz et al., 2005). The spatio-temporal variability of surface and groundwater hydrology, microclimate, geomorphology, and soil determine the allocation of habitats within river–floodplain systems. These characteristics, in combination with inter- and intraspecific competition, result in a distinctive biodiversity. This diversity is closely linked to the floodplain hydrodynamics that determine morphology and water conditions and maintain a highly variable mosaic of habitats from open soil to hardwood forest.
Riverine landscapes provide a wide range of services contributing to human well-being, including the supply of groundwater for drinking and farming, fertile soils for agriculture and forestry, and cultural values. At the same time, rivers and their floodplains have historically been subject to various anthropogenic uses such as navigation and hydropower. For this purpose, rivers in Europe have been extensively channelized and/or impounded, and floodplains are often separated from their rivers by the construction of dykes (Nilsson et al., 2005; Hein et al., 2016). Only 30% of the original floodplains in Germany are still frequently flooded (active floodplain), whereas the others are separated by dykes so that they are no longer flooded (former floodplain) (Brunotte et al., 2009). Impaired river–floodplain corridors are unlikely to provide the same range of functions and services as intact ones (Ward et al., 1999; Kaat and Josten, 2008; Brunotte et al., 2009).
The alarming state of German floodplains (BMU and BfN, 2009) underlines the need for an innovative water resource management integrating the needs of many sectors (flood protection, agriculture, water management/provision, nature conservation, tourism). In this context, the strategic plan of the Convention on Biological Diversity (CBD) refers to the ecosystem service (ESS) concept, which is considered to support the preservation of biodiversity (CBD, 2010). The ESS concept is an increasingly accepted tool in sustainable and integrative resource management as it enables the analysis of complex relationships between ecosystems and human usage. ESSs describe the benefits people obtain from ecosystems (MA, 2005) and thus represent the link between natural and the socio-economic systems (De Groot et al., 2010; Sukhdev et al., 2010).
Habitat provision is an important ESS in rivers and floodplains (Podschun et al., 2018), an indicator of the integrity of the whole ecosystem and therefore the basis for other ESSs (Burkhard et al., 2012). It is also an approved aim of human society, as different legal regulations (e.g., Natura2000) protect natural assets and express the social appreciation and interest in their benefits. Habitat provision covers the functional and structural quality of habitats and their communities as a basis for multiple human uses. In this case, habitats provide a diversity of communities typical for rivers and floodplains both of natural and of cultural landscapes. The “River Ecosystem Service Index” (RESI) project aimed to provide a basis for cross-sectoral decision making and therefore covers a wide range of ESSs relevant to rivers and floodplains (Pusch, 2016; Podschun et al., 2018) including the assessment of habitat provision. In the project RESI provisioning, regulating and cultural ESSs are assessed using an integrated approach, wherein all services are scaled on a five-point scale from 1 (very low) to 5 (very high). The spatial reference for all ESS assessments in the RESI project are 1-km river–floodplain segments, which can be separated into river, active floodplain, and former floodplain components (Brunotte et al., 2009). Evaluation of the ESS in this study is based on existing, publicly available data.
Most evaluations of biological and/or habitat conditions have focused on the rivers themselves, with only very few developed specifically for the characterization of floodplains or riparian habitats (Foeckler et al., 1991, 2006; Dziock et al., 2006a,b; Ilg et al., 2008; Gerisch et al., 2012; Eamus et al., 2016). Indices for riparian assessment often focus on one indicator group, ignoring other important parts of the ecosystem [e.g., based only on vegetation (Kleynhans et al., 2007; Aguiar et al., 2009; Magdaleno and Martínez, 2014) or fauna (Chovanec et al., 2015; Funk et al., 2017)], whereas others do not include biotic data at all (Hall et al., 2002). Most of these studies work with very detailed data collected during field measurements of limited spatial extent (Raven et al., 1998; Munné et al., 2003; González Del Tánago and García De Jalón, 2011). This makes evaluation of the ESS habitat provision on a larger scale, for example, along stretches of several kilometers of riparian zone, very laborious or not practical. Here, we present a habitat provision index using habitats as indicators, based on existing nature conservation and abiotic data at a local scale, mainly habitat mapping data.
Habitat mapping (“Biotoptypenkartierung”) for landscape planning and nature conservation has been well established in Germany since the 1970s and is common in many other European countries (Weiers et al., 2004; Lengyel et al., 2008). However, the German federal states and other countries use slightly different methods, contents, and constraints of surveys. The quality of habitat mapping therefore varies widely, and homogenization and simplification of these habitat types is essential to allow a nationwide or even international evaluation of habitat functions. In the context of the implementation of the European habitats directive, the Corine land cover, and European Nature Information System (EUNIS) habitat type classification (Davies et al., 2004), a lot of further harmonization in the typology across Europe has been done.
The aim of this study was to develop a simple method to evaluate habitat provision in floodplains that (1) represents the value and importance of the ecological status in terms of its typical biodiversity, (2) reveals five levels and an area-wide evaluation on the scale of 1-km segments, (3) is based on publicly available data in the German Federal states (habitat data), and (4) is sensitive to management scenarios and therefore suitable to support decision making processes for conservation and water management. Therefore, the index was validated, firstly by investigating the performance and correlations of the individual criteria, secondly by comparing the results with available proxies of nature conservation values, and finally by testing its sensitivity to scenarios such as restoration and polders for the rivers Nahe and Rhine. While we demonstrate the development of the index for Central European rivers, the method is transferrable to other biogeographical regions with similar data availability.
Materials and Methods
Description of the Habitat Provision Index
The method is based on three consecutive steps. First, the general habitat type level is assessed, then the specific habitat level, and finally the compartment level (Figure 1).
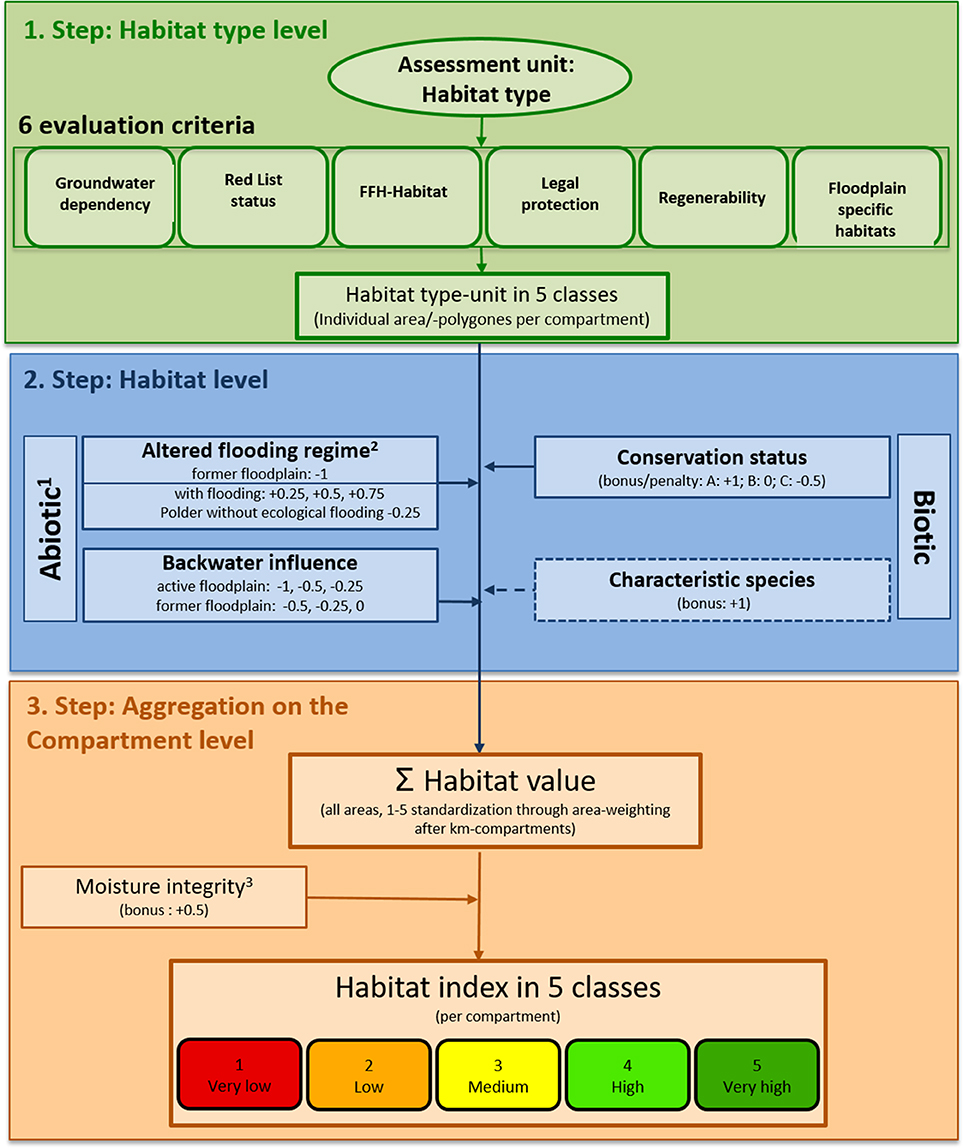
Figure 1. Flow diagram of the assessment method of the habitat provision index. The method is based on three consecutive steps: the first on the general habitat type level on the base of six criteria, the second on the specific habitat level with several bonus points and penalties, and the last on the compartment level as aggregation on definite areas. 1) Penalty/bonus only for exclusive or medium floodplain habitat types [FS (floodplain specific habitats) = 3 or 5]. 2) Summer dykes or other areas protected by dams, flooding areas with controlled inflow structures or inflow swells, controlled polders. 3) Only for habitat types with FS = 5 (exclusive floodplain habitats).
Habitat Type Level
In the first step (Figure 1, green part), all occurring habitat types are assigned to a habitat type value, expressing their value for the study area. Habitat types are being used in order to incorporate abiotic and biotic characteristics and conditions including land use impacts (Ssymank et al., 1993; Wiegleb et al., 2002). Due to the variety of habitat mapping standards in Germany, the standardized hierarchical habitat type list for Germany (Finck et al., 2017) was separated into nine habitat type categories that occur in floodplains. All mapping units in the distinct study area were assigned to these categories. These were water bodies, grasslands, riverbank vegetation, sedge swamps and reed beds on floodplains, shrubs, forest, rocks and other ruderal habitats, arable land, and settlements. They were further divided into habitat type groups (e.g., alluvial forest) and habitat type subgroups (e.g., hardwood forest; Supplemental Table 1).
For each habitat type category, group, and subgroup, a specific “habitat type value” was determined, based on six criteria according to German and European legal obligations or specific floodplain requirements (Table 1): Groundwater dependence (GD), Red List-status Germany (RLG), “Fauna-Flora-Habitat” (FFH), legal protection status (LP), regenerability (RE, regeneration by natural succession or restoration), and floodplain specific habitats (FS). Each habitat type was assigned the value 1 (very low), 3 (medium), or 5 (very high) for each of the six criteria (Table 1), resulting in means between 1 and 5 (see all values for the single criteria and of each habitat type in Supplemental Table 1). The categories and values of the first five criteria were based on the nationwide framework of Finck et al. (2017), which has been successfully applied to nature conservation in recent years. RLG, FFH, and LP are common evaluation criteria in nature conservation, and GD and RE have been shown to be particularly important in floodplains (Rood et al., 2005; Boulton and Hancock, 2006; Shang and Mao, 2010; Eamus et al., 2016; Finck et al., 2017; Ahlmer et al., 2018). In addition, the floodplain-specific value was based on expert knowledge to incorporate special requirements of floodplain ecosystems not fully represented by the other five criteria. The main aspect for this criterion was the dependence on landscape features and floodplain functions (all processes and structures specific to floodplains; Breunig et al., 2000, unpublished). The degree of dependence of habitat types on these processes and structures defines whether a habitat is an exclusive, medium, or no floodplain habitat (Table 2).
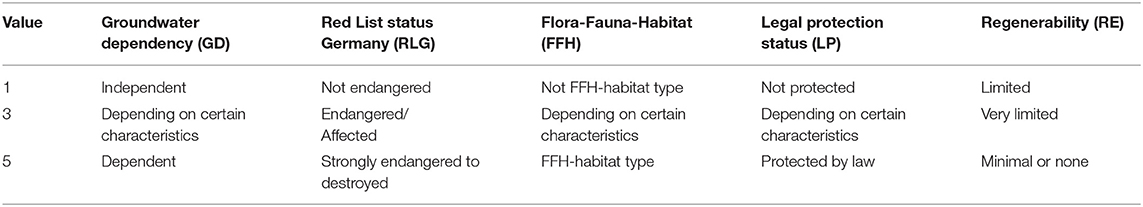
Table 1. Values and categories of the criteria (groundwater dependence (GD), Red List status Germany (RLG), “Fauna-Flora-Habitat” (FFH), legal protection status (LP), and regenerability (RE, regeneration by natural succession or restoration) used to evaluate the habitat type level.
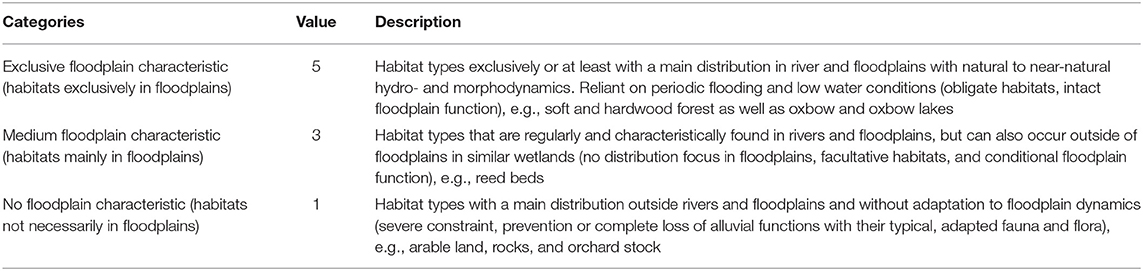
Table 2. Categories and associated values of the floodplain specific habitat value (based on Breunig et al., 2000, unpublished).
The habitat type value (HTV) is calculated as follows:
where n is the number of criteria. As a result, for example, soft- or hardwood alluvial forests have a high habitat type value because of their importance in floodplains, whereas settlement areas have low habitat type values (Supplemental Table 1). These habitat type values provide the basis for the assessment on habitat level.
Habitat Level
The second step (Figure 1, blue part) integrates not only the general habitat type but also site-specific characteristics and detailed information of individual habitats. The assessment is based on abiotic [only for exclusive or medium floodplain habitat types (FS = 3 or 5)] and biotic (all habitat types) parameters able to increase or decrease the general habitat type value. Abiotic parameters are flooding regime (FR) and backwater influence (BI). Biotic parameters are conservation status of habitat types (CSHab) and characteristic species (CS; additional faunistic and floristic information). All these parameters are described in the following sections and combined in the algorithm:
where HV is the habitat value. At this level, either an increase or a decrease of the habitat type value (HTV) of the first step can be added to the habitat type value (of max. +2/−2.25) calculated in the first step.
Altered flooding regime (FR)
The most important ecological factor in floodplains is the flooding regime. Any alteration of it affects floodplain habitats, so it must be considered in a habitat provision index. The flooding regime ranges from unaltered in morphologically intact river landscapes to total exclusion in former floodplains isolated by dykes. Between these extremes, a large range of altered regimes occurs. These are caused by man-made structures, ranging from elevated bank fixations and summer dykes to impoundments such as detention basins (polder). The flooding regime parameter (FR) accounts for manipulation of flooding intensity. Any alteration to flooding frequency receives a penalty of −1 (FF = former floodplain), which can be decreased when flooding is not completely prevented, e.g., by adaptive artificial flooding for ecological purpose (so-called “ecological flooding”) in former floodplains or by summer dykes that retain small floods only. Polder areas without ecological flooding received a polder penalty of −0.25, because the extremely rare flooding might have strong effects on the flora and fauna in the polder area as they are not adapted to aquatic conditions. These measures result in a more natural flooding regime and were assessed by the bonus/penalty “flood.”
If data on local flooding conditions are unavailable, plausible estimations can be used instead.
Backwater influence (BI)
Man-made weirs strongly alter the natural hydrodynamics of river stretches, severely impacting the ESS of habitat provision (e.g., changes within the macrozoobenthos/mollusc fauna within the dammed sectors) (Banning, 1998; Foeckler et al., 2000, 2017). In the habitat provision index, this fact is taken into account by deducting an impoundment penalty. Since the upstream influence of impoundments declines with increasing distance from the weir (A = near weir to C = away from weir), the penalty is assigned based on the compartment's position in relation to the downstream weir by dividing the total backwater stretch into three equal parts (Table 3). The effect of impoundment is lower in former floodplains that are already downgraded by the penalty “flooding regime.”
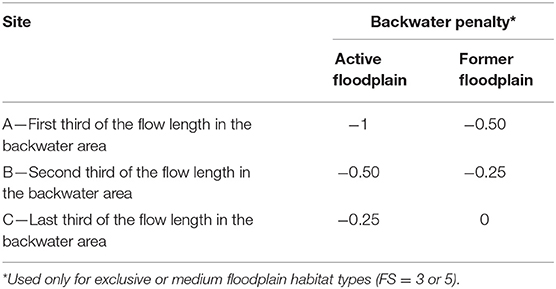
Table 3. Determination of the backwater penalty based on the distance of the compartment to the impoundment's embankment (A, B, and C) and its situation within the morphological floodplain (active and former floodplain).
Conservation status of habitat types (CSHab)
The legally mandated monitoring of specific protected habitat types (listed in the annex of the European habitats directive) regularly offers additional data. The three classes for the local conservation status in Germany are as follows: A (excellent), B (good), and C (medium to bad) (Wippel et al., 2013). These classes can be translated into bonus or penalty weightings where such information is available (Table 4).
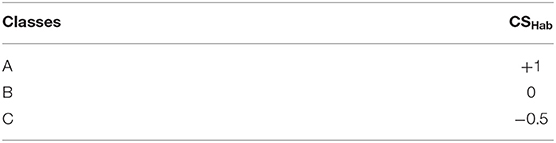
Table 4. Assignment of conservation status of habitat type (CSHab) classes (A, excellent; B, good; C, medium to bad) to bonus/penalty for the RESI habitat types.
Characteristic species (CS)
Fauna and flora can provide valuable additional information on the condition of floodplain habitats, because they are good indicators for seasonal inundation and variable water levels in floodplains (Dziock et al., 2006a; Follner and Henle, 2006; Scholz et al., 2009). If data are available for the whole area, they can be included in the evaluation as a bonus, improving the validity of the index if characteristic species are present. Suitable data types are, for example, occurrences of species relevant to nature conservation or protected grassland bird sites. If no such data are available, this parameter can be skipped. For an informative evaluation, the validation boundaries should be adapted to the respective river or floodplain section. This option can only be used in a limited matter, because the habitat provision index is limited to five classes. Therefore, a maximum of + 1 is possible, regardless of the number of characteristic species groups.
Compartment Level
The third and final step (Figure 1, orange part) in calculating the habitat provision index is done at the “compartment” level for each individual assessment unit (using automated GIS-based routine), so that active and former floodplains can be differentiated within the 1-km floodplain segments:
where HPI is the habitat provision index. The results obtained in the second step are area (A) weighted and aggregated on the compartment level. This final step evaluates not only the single habitats but also the typical composition within natural floodplains. An additional moisture integrity (MI) bonus can be assigned.
Moisture integrity (MI)
Due to the intense hydrological and morphological dynamics in intact floodplains, a large moisture gradient runs from mostly inundated habitats to very dry habitats (for example, on highly elevated sand or gravel banks). This is valuable information in addition to the simple presence of the single habitats because this gradient results in very high biodiversity and provides high habitat quality (Ward et al., 1999). The moisture integrity (i.e., the completeness of all possible moisture types from very wet to very dry) is essential, in addition to the estimation of the unique habitats, for the evaluation of the whole floodplain.
The habitats typical for floodplains were classified by expert opinions of the authors into five moisture classes (Supplemental Table 1, MI). If a compartment contains at least three of these moisture classes in more than 1% of the compartment area, a bonus of 0.5 was added to the habitat provision index.
The final habitat provision index describes the significance of the floodplain compartment for typical species and habitats in five levels (importance for habitat provision; Table 5): 1 (very low), 2 (low), 3 (moderate), 4 (high), and 5 (very high).
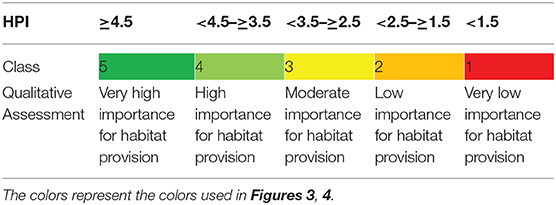
Table 5. Translation of the calculated habitat provision values into the classes.
Case Studies
River Nahe
Status quo
The 125-km-long River Nahe is a tributary of the River Rhine located in the Southwest of Germany (Figure 2A). The catchment area covers ~ 4,060 km2 and the river has a mean discharge of 31.4 m3/s. In the river valley are three large settlement areas (<50,000 inhabitants): Bad Kreuznach, Idar-Oberstein, and Kirn. The case study area is located in the German Federal State Rhineland-Palatinate with a flow length of 59 km and a catchment area of ~3,900 km2. The upland with narrow valleys is dominated by arable land use with a particular emphasis on viticulture. Due to limited discharge and strongly fluctuating discharge levels, the Nahe is not navigable (Lenz and Herzberg, 1996). Nevertheless, the original riverine landscape has been altered by intensive farming, urbanization, and the river itself by channelization.
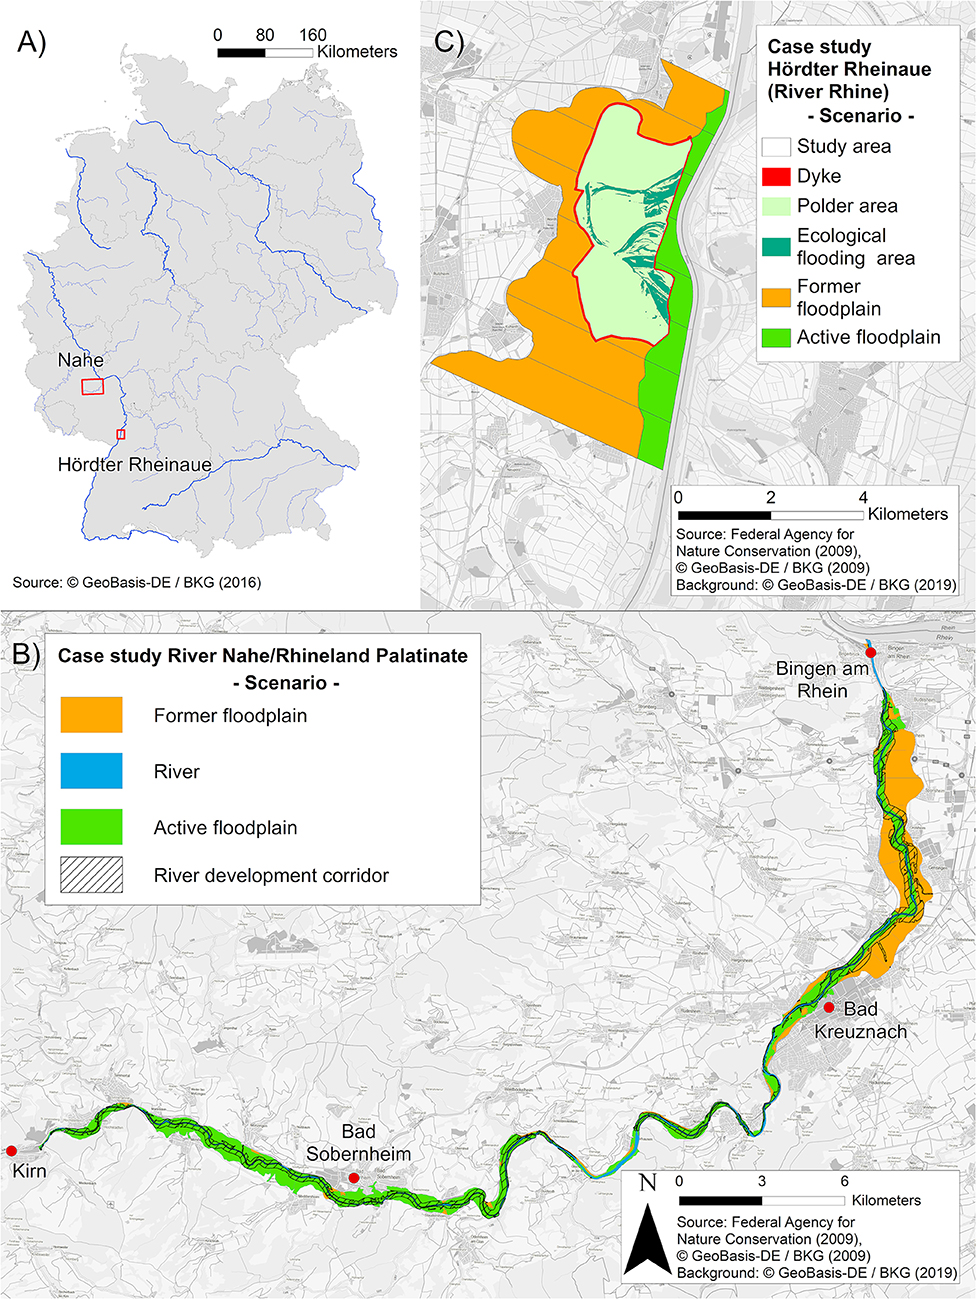
Figure 2. (A) Map of federal states and rivers in Germany. The two case studies are localized by red boxes. (B) Case study River Nahe: floodplain compartments active (light green) and former (orange) floodplain, river (blue), and area for the water development corridor (black striped area) of the scenario. River floodplain corridor = the area potentially available for the restoration of rivers and its floodplains in order to bring them into a good or very good ecological status. Red dots indicate larger towns. (C) Case study Hördther Rheinaue along the River Rhine: floodplain compartments active (light green) and former (orange) floodplain and river (blue). Dyke (red) and polder area (light green area) of the scenario.
The active floodplain covers an area of 14.9 km2, and the former floodplain covers an area of 9.9 km2. The dominant land use type of the floodplain area is pastures and meadows (39%). About 24% of the case study area is arable land use and 30% is urbanized. The active floodplain area consists of 25% arable land use, 50% pastures, 22% settlements, and only 4% forest. The area of settlements and arable land use is much larger in the former floodplain than in the active floodplain (50% vs. 74%).
Scenario
To test the sensitivity of the index, it was also applied to a restoration scenario for comparison with the status quo. The restoration scenario consists of a water development corridor suggested by the Agency for the Environment of Rhineland-Palatinate. It is assumed that the associated area of the river is available for restoration to allow the river to meander as much as possible and bring the river and accompanying floodplain into a good or very good ecological status. The extent of this corridor (black area in Figure 2B) covers parts of the active floodplain but also parts of the current former floodplain. In this scenario, the new water and floodplain development corridor is treated as active floodplain with the potential natural vegetation (pnv) restored after (Koenzen, 2005) (Water = 16%, Wetland = 10%, Forest = 72%, other areas = 2%). Areas with existing settlements and important infrastructure areas are excluded when defining the development corridor.
Hördter Rheinaue (River Rhine)
Status quo
The second study area (Hördter Rheinaue) is located in the German Upper Rhine floodplain, also in the federal State Rhineland-Palatinate (Figure 2A). The River Rhine is the most heavily used and economically most important waterway in Western Europe. It has a total length of 1,239 km, 880 km of which are navigable (Becker et al., 2015). The size of the catchment area is 185,000 km2. The Hördter Rheinaue is situated on the left bank of the upper Rhine between Karlsruhe and Mannheim/Ludwigshafen, where the mean discharge is around 1270 m3/s. The retention area has been reduced by dyke construction considerably, with 80 to 90% of the former floodplains being lost in the southern Upper Rhine (Brunotte et al., 2009).
The case study site is situated downstream from the last Rhine weir in Iffezheim, so the continuity of the river is not affected in the downstream direction. Nevertheless, two centuries of intensive, large-scale engineering have heavily modified the structure and dynamics of the surface waterbody as well as the dynamics of the groundwater (Blackbourn, 2007). The river course has been rectified, the banks have been fixed with riprap and lateral branches have been cut off from the main river. The active floodplain in the case study covers an area of 3.7 km2, and the former floodplain covers an area of 23.4 km2 (Figure 2C). The dominant land use type of the case study floodplain area is forest (40%). About 32% is arable land and 12% are pastures and meadows.
Scenario
The restoration scenario is the construction of a polder with an area of 860 ha (Figure 2C) in the former floodplain. The polder was approved in the 2015 flood risk prevention management plan of Rhineland-Palatinate. The polder is designed to buffer extreme floods with a return period of 200 years-thus it is called an extreme flood event polder. There are no controlled inlet structures other than an overflow weir. So-called “ecological flooding” is intended to minimize ecological damage to unadapted natural habitat caused by rare usage of the polder. These artificial floods are planned to occur at three different levels and cover a maximum of 137 ha of the polder. In the polder area, timber forest will be transformed into soft- and hardwood alluvial forest. The polder area is therefore predominantly covered with forests (59%); about 23% is arable land use and 5% are pastures and meadows.
Data Input
The data needed for calculating the index for the River Nahe/Rhineland Palatinate and Hördter Rheinaue (River Rhine) are listed in Tables 6, 7. As the habitat mapping does not cover the whole study area, the missing information was completed using available land use data (land cover model LBM-DE, 2012). Some data were not available and so were not included in the calculation of the habitat index (e.g., CS, CSHab, and MI for the River Nahe and CS and CSHab for the Hördter Rheinaue).
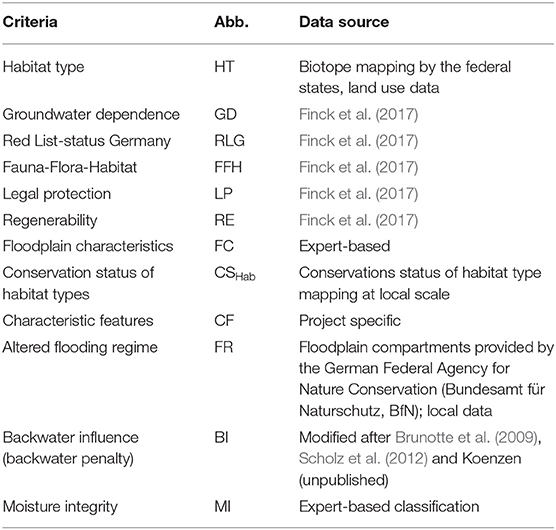
Table 6. Data sources used in calculating the habitat provision index.
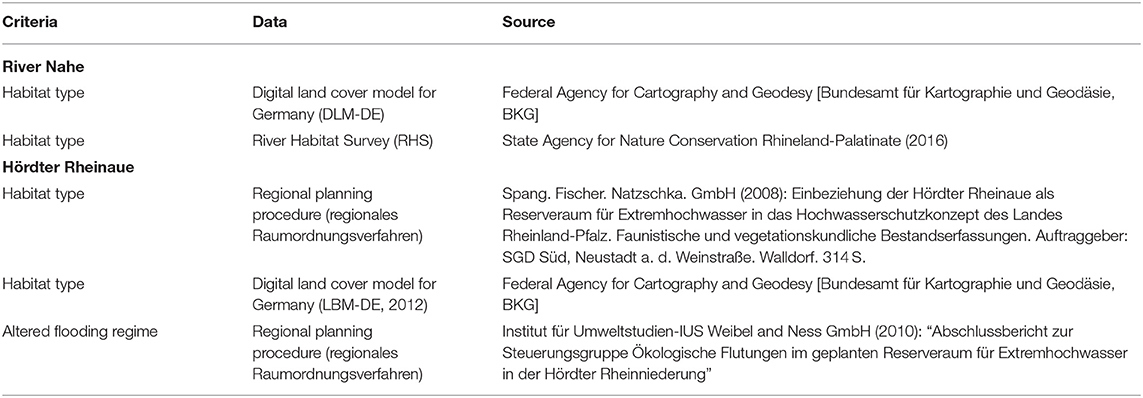
Table 7. Overview of applied spatial data for the habitat provision index and their sources for the River Nahe and Hördther Rheinaue (River Rhine).
Sensitivity Assessment
Several parameters and classifications that were defined using expert knowledge were validated by testing the performance of the index for each active and former compartment against independent spatial data that are approved proxies for ranking biodiversity values (e.g., area of Natura2000/protected areas and floodplain characteristics; cover of wetland/protected areas Scholz et al., 2012). First, the habitat index was calculated for the current condition (status quo) of each river floodplain. Second, the index was applied to the management scenario and compared to the values of the status quo for each of the case studies.
Statistical Analyses
The relationship between the criteria integrated in the calculation for the habitat type value (GD, RLG, FFH, LP, RE, and FS) was analyzed using Spearman's rank correlations for all occurring habitat types. Differences among Natura2000 or wetland/protected areas percentage per 1-km segment across the habitat index classes were tested using a non-parametric Kruskal–Wallis test followed by Dunn's test (post hoc test) for comparison between groups. Replicates below 3 per class were not included in the analysis. To test for differences between the status quo and restoration scenario, a Mann–Whitney U-test was calculated, because assumptions for parametric testing were not met. Statistical analyses were performed using the statistical software R 3.5.1 (R Development Core Team, http://www.R-project.org).
Results
Habitat Type Value Validation
For the habitat type value, all classes were represented [class 1 (n = 6), class 2 (n = 16), class 3 (n = 28), class 4 (n = 21), and class 5 (n = 15)].
All criteria were highly correlated with the habitat type values (Table 8). Red list status, legal protection status, “Fauna-Flora-Habitat,” and floodplain specificity were positively correlated with each other (rho between 0.5 and 0.7). Regenerability did not correlate to legal protection status and groundwater dependence, but correlated with Red List status and “Fauna-Flora-Habitat.” Groundwater dependency did not correlate with the other criteria except with “Fauna-Flora-Habitat.”
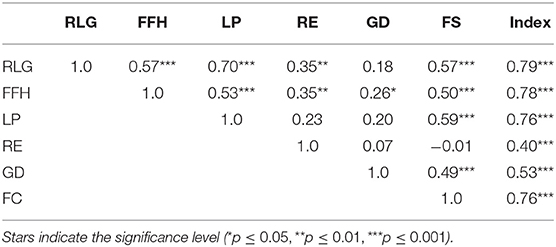
Table 8. Spearman rank correlation coefficients between criteria selected in step one for calculating the habitat index [Red List status Germany (RLG), “Fauna-Flora-Habitat” (FFH), legal protection status (LP), regenerability (RE), Groundwater dependence (GD), floodplain specific habitats (FS), and habitat provision index (Index)].
Status Quo
River Nahe
In general, the status quo of the floodplain of the River Nahe showed a low level of habitat provision, with low spatial heterogeneity. More than 44% of the compartments were allocated to the lowest habitat provision class (class 1), mainly in the wide former floodplain between Bingen and Bad Kreuznach. No compartments were assigned to the higher classes 4 and 5 (Figure 3A). A comparison of the habitat provision index of the active floodplain and the former floodplain areas showed that, on average, the habitat provision index is higher in the active floodplain (mean: 2.3 vs. 1.3). The differentiation between active and former floodplain is particularly visible between Bad Kreuznach and Bingen (Figure 3A).
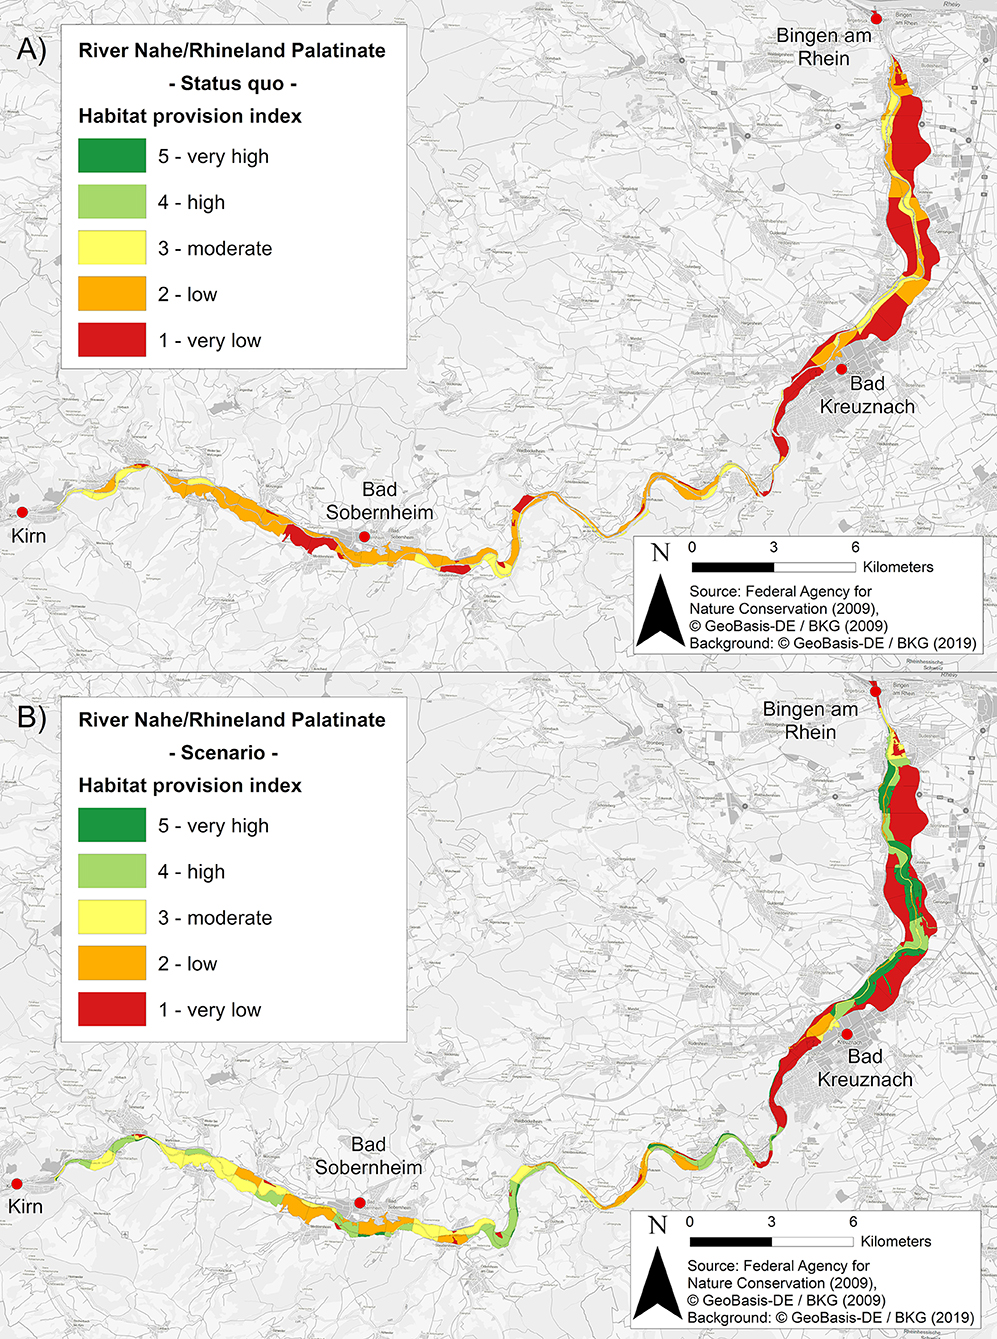
Figure 3. Assessment of the ecosystem service habitat provision according to the developed index showing (A) the status quo and (B) restoration scenario of the River Nahe separated into active and former floodplain compartments (see Figure 1B). Habitat provision index classes: 1, very low; 2, low; 3, medium; 4, high; 5, very high.
Hördter Rheinaue
The status quo showed a mix of four different classes with low spatial heterogeneity (Figure 4A). In general, the habitat provision index was higher in the active floodplain compared to the former floodplain (mean: 3.3 vs. 1.9). No segment was assigned to the class 5, but class 4 occurred only in the active floodplain. The habitat provision value was lower in the former floodplain compared to the active floodplain. The forest areas in the northern parts of the study area have higher habitat provision index by one to two classes, even in the former floodplain.
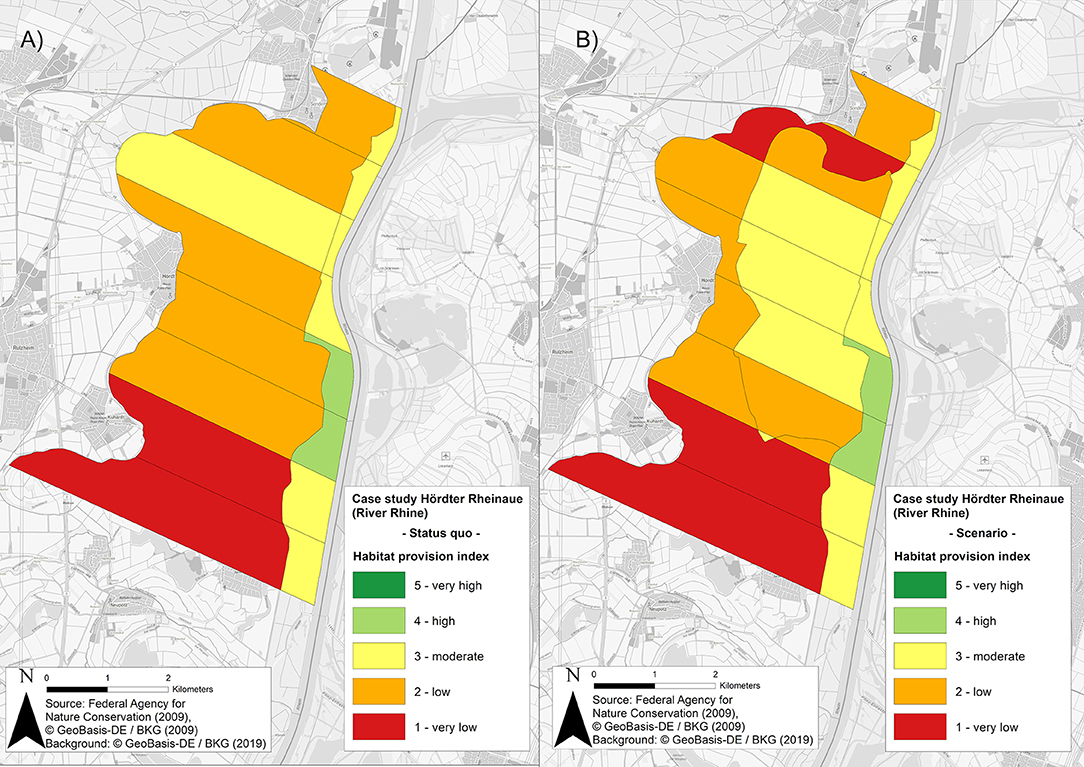
Figure 4. Assessment of the ecosystem service habitat provision according to the developed index showing (A) status quo and (B) polder scenario at the Hördter Rheinaue (River Rhine) separated into active and former floodplain compartments (see Figure 1C). Habitat provision index classes: 1, very low; 2, low; 3, medium; 4, high; 5, very high.
Sensitivity Assessment
Validation With Other Biodiversity Values
The habitat provision index classes calculated for the River Nahe and Hördther Rheinaue (River Rhine) provided reasonably accurate proxies both for biodiversity (as percentage of Natura2000 areas) and for ecological intact floodplains (as percentage of wetland/protected area) (Figure 5). The only two compartments in the Hördther Rheinaue assessed as class 4 were not included in the analysis. The percentage of Natura2000 and wetland/protected areas were significantly different among the habitat index classes (Kruskal–Wallis test, Natura2000: χ2 = 112.1, df = 62, P ≤ 0.001; wetland/protected areas: χ2 = 71.4, df = 48, P = 0.015) with higher values supported at higher habitat provision index values.
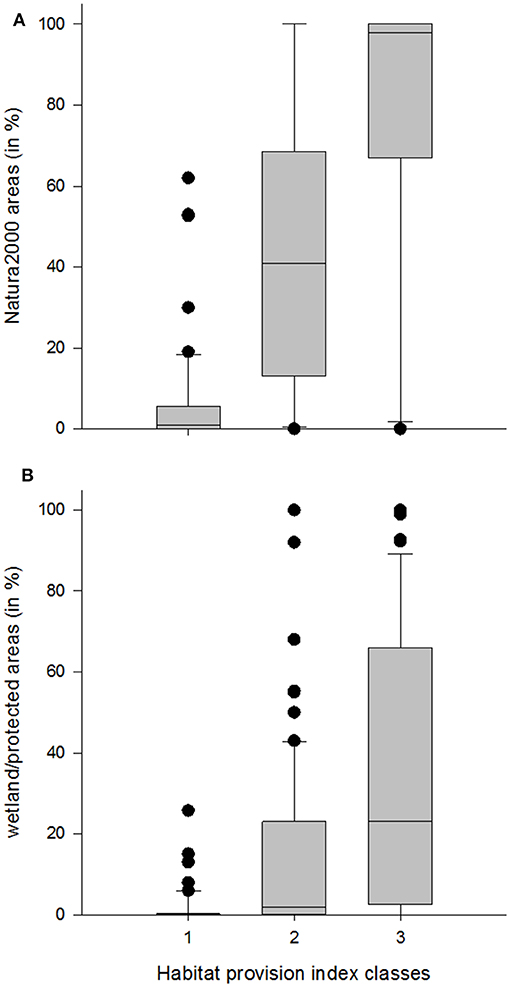
Figure 5. Box and whisker plots of available proxies of high value floodplain habitats for the status quo for the habitat provision index classes (1 to 3) for the River Nahe and Hördter Rheinaue (River Rhine); boxplots showing median, range, and interquartile range of proxies (Natura2000 areas and wetland/protected area in %). (A) Percentage of biodiversity Natura2000 areas as an indicator for biodiversity, and (B) Percentage of wetland/protected area as an indicator of ecological intact floodplains. The only two values from the habitat provision class 4 of the Hördter Rheinaue were not included in the analysis. Superscript letters indicate significant differences among the habitat provision index classes (Dunn's test, p < 0.05).
Scenarios
Habitat provision of the River Nahe was improved in the restoration scenario by one (37%) and two classes (43%) in the active floodplain (mean, status quo: 2.3, restoration: 3.6, U-test: W: 2436, P ≤ 0.001, Figures 3A,B). The extent of active floodplain expanded from 14.9 to 16.8 km2 (13%). The best values were obtained predominantly in the area between Bad Kreuznach and Bingen (classes 4 and 5 by 49% of all active floodplain compartments). Due to the presence of settlement in 22% of the active floodplain area, a large area shows no improvement. The devaluation of few former floodplain areas is due to the higher proportion of arable land in the reduced area of the former floodplain in the scenario (Figure 3B).
In the polder scenario of the Hördter Rheinaue, the habitat provision was improved by one class within the polder area due to land use changes. Areas that benefit from more frequent ecological flooding (5 year flooding probability) are assigned with a flooding bonus of 0.25, which increased the habitat provision index. The devaluation of the northern former floodplain areas (red) is due to the higher proportion of arable land in the reduced section of the former floodplain in the scenario (Figure 4B).
Discussion
Habitat Index
The habitat index was developed to provide a rigorous, cost-effective approach to assess the condition of biodiversity by linking habitat types to biotic and abiotic parameters in floodplains. The approach enables areas with high or low habitat provisioning values to be identified for incorporation into decision-making processes. The common framework of the RESI (index value from 1 to 5, same size of compartments/assessment area) allows one to compare the habitat index with all other equally evaluated ESSs and decision makers can objectively compare different scenarios or measures. The results presented here show that the index for assessing habitat provision is appropriate to carry out assessments when detailed habitat data are publicly available and that changes through anthropogenic activities can be mapped. The advantages of the five-point assessment scale are the standardization of the assessment method, the broad applicability of the results, and the comparability of the data. However, the index cannot reflect all changes. Small-scale measures such as channel connections cannot be captured with the habitat provision index, as the index refers to 1-km floodplain segments. The index provides a new approach for habitat provision assessment on a higher than regional level, which can be modified for use in other regions and for different management scenarios.
Habitat types are particularly suitable for this purpose because they are easily to record and map biotic and abiotic functional processes as well as landscape and anthropogenic impact characteristics (Ssymank et al., 1993; Wiegleb et al., 2002). An advantage of our habitat provision index is that it can map the quality and characteristics of the habitats adapted to floodplain areas. Groundwater dependency and regenerability were not highly correlated to the other criteria and therefore are very important additional parameters for the evaluation. Prior studies noted that groundwater dependency (Boulton and Hancock, 2006; Eamus et al., 2016; Finck et al., 2017; Ahlmer et al., 2018) and regenerability (Rood et al., 2005; Shang and Mao, 2010) in particular play an important role for floodplain ecosystems and are basic criteria for nature conservation environmental planning. In addition to these, the new criterion “floodplain specific value” can weigh the habitat type value according to specific prioritized floodplain habitats. The variety of applied criteria is justified as all habitat type levels from 1 to 5 were assigned in reasonable degrees. Due to the high correlation between the criteria at the habitat type level in the first step of the habitat provision index, we tend to assign higher value to the protection parameters on the basis of nature conservation, rather than to the other criteria. However, the high priority is justified because the main objective is to fulfill the legal mandate of protection. The habitat type values are evenly distributed, and by adding additional bonus or penalty values, it is possible to obtain all classes from low (1) to very high (5).
On the second (specific habitat) level, the major components are the quality and functioning of specific delineated floodplain areas, and it is possible to upgrade or modify the index if more information is available. Using bonus or penalties offers the possibility to include qualitative components in the evaluation. Characteristic species such as faunistic and floristic information (e.g., occurrence of protected bird species, plants or molluscs) can be included in the evaluation as a bonus if the data are available for the whole area. Similarly, the bonus of flooding frequency for the altered flooding regime parameter can be included depending on available data and the actual flooding regime, which can vary from near natural (restricted, but frequently flooded) to polder (only inundated during extreme floods). This option can currently only be used in a limited way (maximum total value in step 2 is +2), because the habitat provision index is limited to five classes. However, at this step, the habitat provision index for floodplains could be extended or modified by the user according to available data. The use of additional features requires an adjustment of the size of the bonus or penalty to obtain a useful result. The ability to up- and downgrade abiotic and biotic parameters even when only qualitative data are available depending on particular conservation needs is an important feature for environmental management, and is also easily applicable for scenario evaluation when these data have to be assumed. In case no habitat type mappings are available, it is possible to calculate the index by using land use data as a proxy. However, assessments of habitat provision can still be obtained, e.g., on a nationwide scale (Scholz et al., 2012).
An advantage of using bonuses and penalties in the valuation for site-specific observations and flood adapted criteria such as “floodplains specific habitats” and “moisture integrity” is that local floodplain situation can be better integrated. However, since these criteria are based on expert knowledge, this could introduce a major source of uncertainty that could influence the outcome of the assessment. For this reason, the general selection of the criteria (flooding regime, occurrence of significant species) was based on existing literature in addition to expert knowledge (Banning, 1998; Foeckler et al., 2000; Aguiar et al., 2009; Scholz et al., 2009; Stammel et al., 2012). The exception to this was the graduation of the bonus (e.g., the effect of ecological flooding), for which there is no recommendation in the literature. The only way to include it in the index is expert knowledge. Indeed, expert-based assessments are strongly influenced by the experience and knowledge of the experts and must therefore be carefully validated. On the other hand, this method offers the opportunity to include more of the regional pressures and characteristics (impoundment, different grades of flood intensity), which have significant effects on the provision of habitats typical for floodplains (Tockner et al., 2010; Schindler et al., 2014; Funk et al., 2017). To determine the extent to which the results are acceptable as description of the data, the validation to biodiversity data and the sensitivity to different scenarios were applied. The evaluation of the index shows plausible results, indicating that including the parameters was reasonable. Without the penalties of altered flood regime and backwater influence, the significant difference between former and active floodplain along both rivers would not have been identified. The penalties, identified as important by experts, are an essential component necessary to acknowledge the negative effects of altered flood frequency and distinguish between the scenarios.
The habitat index allows a first assessment of species and habitat diversity, which are specific for floodplains on a proxy base. Floodplains are complex and dynamic systems with ever-changing abiotic and biotic conditions influenced by the river specific discharge (Ward et al., 1999; Tockner and Stanford, 2002). Therefore, every floodplain is different. Numerous habitat types such as hardwood floodplain forest or oxbow lakes are highly valued. Statements about the ecological status of a floodplain can be made with reference to the occurrence and frequency of such floodplain typical habitats. The fact that the high biodiversity in intact floodplains results from the wide variety of moisture classes from very wet to very dry (Ward et al., 1999) is additionally evaluated by the moisture integrity in step 3, which can upgrade the evaluation of step 2. The habitat index helps to identify areas that are of particular importance for conservation goals. With several changes and if necessary extensions, such as the addition of more habitats, it would be also applicable to other regions of the world.
Status Quo
The low habitat values indicate that the River Nahe and the study site Hördter Rheinaue (River Rhine) are not in a favorable condition for floodplain habitats and species due to heavily changed conditions in arable, traffic, and settlement areas. These extensive anthropogenic changes have resulted in a status quo that is far from any natural condition (Ellwanger et al., 2012; Scholz et al., 2012; Schneider et al., 2018). The compartments are of predominantly “very low” to “low” significance for typical species and habitats of floodplains. Despite the low values, the assessment of the floodplains shows clear difference between active and former floodplain, resulting in higher values for the active floodplain (Figures 3A, 4A).
Sensitivity Assessment
Validation With Other Biodiversity Values
The habitat provision index for the floodplain of both rivers at status quo provides a good representation of the habitat quality that correlates with the cover of Natura2000 sites and wetland areas in the assessed floodplain area, although only the three lowest of the five classes were applicable to the current condition. Several studies have shown that species diversity and Natura2000 area positively correlated (Kallimanis et al., 2008; Maes et al., 2012; Votsi et al., 2013). For high and very high classes (classes 4 and 5), no statement is possible because these classes were not represented in a reasonable amount in both rivers under the status quo. Unfortunately, it was not possible to validate the index against observations of species richness, as such data are not available.
Scenarios
The restoration scenario for the River Nahe showed an improvement of the habitat provision index mediated through the conversion of intensively used agricultural areas into floodplain habitats. The improvement of the habitat provision was higher between Bad Kreuznach and Bingen compared to Bad Kreuznach and Kirn, because here the area for land use change was larger and covers the whole active floodplain (Figure 3B). However, “very low” and “low” values remain in areas with settlements, traffic, and impoundment. Higher habitat values, especially in smaller floodplain areas, could possibly be achieved in another scenario in which the remaining dikes (backwater influence) would be removed. The large loss of active floodplains illustrates the urgent need to restore degraded floodplains back toward more natural conditions and sustain them in the long term. However, while the restoration scenario showed improvements in habitat provision, implementation remains difficult.
The polder scenario for the River Rhine also showed an improvement in habitat provision due to the transformation of timber forest into high value soft- and hardwood alluvial forest within the ecological flooding areas. Compared to the restoration scenario for the River Nahe, habitat provision values 4 and 5 were not reached in the polder area. A possible explanation for this is that the polder due to its intended underuse is defined as belonging to the former floodplain and therefore it receives the polder penalty. Furthermore, intensive agricultural land use is not changed into floodplain-specific habitats. The five class assessment provides a generalizable habitat assessment to be made, enabling comparisons to be made across assessments, as illustrated by the RESI project. The development of the habitat provision index forms the basis of ongoing national and international research projects, and on management decisions. Floodplains are important flood retention areas as well as biodiversity hotspots (Secchi et al., 2012; Schindler et al., 2016). The index is therefore an essential tool for their ongoing management, simplifying the assessment of the ESS habitat provision in managed and protected floodplain areas and enabling the effects of planned or implemented restoration measures or future scenarios to be evaluated.
Data Availability Statement
The datasets on the floodplain compartments and land use are not publicly available, but available on reasonable request by the Federal Agency for Nature Conservation [BfN, BfN floodplain setting (Auenkulisse)] and Federal Agency for Cartography and Geodesy (BKG, LBM-DE2012). All other data are available in the paper or from the corresponding authors on reasonable request.
Author Contributions
CF, CD, FF, MG, LG, AR, BS, and MS developed the method and performed analyses/interpretation/discussion of results. CF, LG, and HK performed the analyses in the pilot area, with input from FF, MG, AR, BS, MS, and RH, who provided critical feedback and helped shape the article. JI, DM, and TH did the data preparation and data contribution of the pilot area. SP developed and supervised the theoretical and practical framework within the RESI project and discussed the results in an integrated manner. All authors contributed to the final version of the manuscript.
Funding
The project River Ecosystem Service Index (RESI) was supported by the German Federal Ministry of Education and Research (BMBF) as part of the funding program Regional Water Resources Management for Sustainable Protection of Waters in Germany (ReWaM) in the BMBF funding priority NaWaM in the program FONA3 [Grant 033W024A-K].
Conflict of Interest
AR and FF are employed by the company ÖKON Ltd. Association for Landscape Ecology, Limnology, and Environmental Planning. DM, JI, and TH are employed by the company biota—Institute for Ecological Research and Planning Ltd.
The remaining authors declare that the research was conducted in the absence of any commercial or financial relationships that could be construed as a potential conflict of interest.
Acknowledgments
The project involves 16 partners with seven scientific institutions, four small- and medium-sized enterprises, and five practitioners coordinated by the Leibniz-Institute of Freshwater Ecology and Inland Fisheries (IGB), Department of Ecosystem Research. It is accompanied by the Federal Agency for Nature Conservation (BfN), Bonn, the German Environment Agency (UBA), Dessau-Roßlau, as well as the Working Group on water issues (LAWA). The authors would like to thank all RESI partners (particularly P. Horchler) for valuable discussions as well as colleagues from Landesamt für Umwelt Rheinland-Pfalz (particularly C. Linnenweber) for the provision of the datasets and fruitful cooperation regarding scenario development. A special gratitude we give to the project initiator manager M. Pusch for his contribution in stimulating discussion and encouragement.
Supplementary Material
The Supplementary Material for this article can be found online at: https://www.frontiersin.org/articles/10.3389/fevo.2019.00483/full#supplementary-material
References
Aguiar, F. C., Ferreira, M. T., Albuquerque, A., Rodríguez-González, P., and Segurado, P. (2009). Structural and functional responses of riparian vegetation to human disturbance: performance and spatial-scale dependence. Fund. App. Lim. 175, 249–267. doi: 10.1127/1863-9135/2009/0175-0249
Ahlmer, W., Foeckler, F., Lang, A., Schmidt, H., and Rumm, A. (2018). Grundwasser in Auen: Bedeutung des Grundwassers und Auswirkungen von Veränderungen dessen Verhältnisse in Auen auf Flora und Fauna. Auenmagazin Heft 14, 22–28.
Banning, M. (1998). Auswirkungen des Aufstaus größerer Flüsse auf das Makrozoobenthos - dargestellt am Beispiel der Donau. Duisburg/Essen: Essener Ökologische Schriften, Band 9, 285S.
Becker, G., Huitema, D., and Aerts, J. C. J. H. (2015). Prescriptions for adaptive comanagement: the case of flood management in the German Rhine basin. Ecol. Soc. 20, 1–19. doi: 10.5751/ES-07562-200301
Blackbourn, D. (2007). The Conquest of Nature: Water, Landscape and the Making of MODERN GERMany. London: WW Norton and Company.
BMU and BfN (2009). Bundesministerium für Umwelt. Naturschutz und Reaktorsicherheit and Bundesamt für Naturschutz. Auenzustandsbericht. Bonn; Berlin: Flussauen in Deutschland.
Boulton, A. J., and Hancock, P. J. (2006). Rivers as groundwater-dependent ecosystems: a review of degrees of dependency, riverine processes and management implications. Aust. J. Bot. 54, 133–144. doi: 10.1071/BT05074
Breunig, T., Riedinger, R., and Vogel, P. (2000). Charakterisierung der Biotoptypen der Oberrheinniederung. Karlsruhe: Gutachten im Auftrag der Gewässerdirektion Südlicher Oberrhein/Hochrhein (Lahr) unter Mitwirkung der Landesanstalt für Umweltschutz Baden-Württemberg Karlsruhe.
Brunotte, E., Dister, E., Günther-Diringer, D., Koenzen, U., and Mehl, D. (2009). Flussauen in Deutschland - Erfassung und Bewertung des Auenzustandes. Naturschutz und Biologische Vielfalt. Bonn; Bad Godesberg, 87.
Burkhard, B., Kroll, F., Nedkov, S., and Müller, F. (2012). Mapping ecosystem service supply, demand and budgets. Ecol. Indicat. 21, 17–29. doi: 10.1016/j.ecolind.2011.06.019
CBD (2010). Convention for Biodiversity. Decision X/2. Strategic Plan for Biodiversity 2011–2020 and the Aichi Biodiversity Targets. Nagoya.
Chovanec, A., Schindler, M., Waringer, J., and Wimmer, R. (2015). The dragonfly association index (Insecta: Odonata) - a tool for the type-specific assessment of lowland rivers. River Res. Appl. 31, 627–638. doi: 10.1002/rra.2760
Davies, C. E., Moss, D., and Hill, M. O. (2004). EUNIS Habitat Classification Revised Report to the European Topic Centre on Nature Conservation, European Environment Agency. Huntingdon: Institute of Terrestrial Ecology.
De Groot, R. S., Alkemade, R., Braat, L., Hein, L., and Willemen, L. (2010). Challenges in integrating the concept of ecosystem services and values in landscape planning, management and decision making. Ecol. Complex. 7, 260–272. doi: 10.1016/j.ecocom.2009.10.006
Dziock, F., Foeckler, F., Scholz, M., Stab, S., and Henle, K., (eds). (2006b). Bioindication and functional response in floodplains systems based on the results of the project RIVA – Preface. Int. Revue. Hydrobiol. 91, 269–270. doi: 10.1002/iroh.200610891
Dziock, F., Klaus, H., Foeckler, F., Follner, K., and Scholz, M. (2006a). Biological indicator systems in floodplains – a review. Int. Rev. Hydrobiol. 91, 271–291. doi: 10.1002/iroh.200510885
Eamus, D., Fu, B., Springer, A. E., and Stevens, L. E. (2016). “Groundwater dependent ecosystems: classification, identification techniques and threats,” in Integrated Groundwater Management, eds A. J. Jakeman, O. Barreteau, R. J. Hunt, J. D. Rinaudo, and A. Ross (Cham: Springer).
Ellwanger, G., Finck, P., Riecken, U., and Schröder, E. (2012). Gefährdungssituation von Lebensräumen und Arten der Gewässer und Auen in Deutschland. Natur und Landschaft 87, 150–155. doi: 10.17433/4.2012.50153152.150-155
Finck, P., Heinze, S., Raths, U., Riecken, U., and Ssymank, A. (2017). Rote Liste der gefährdeten Biotoptypen Deutschlands. Dritte Fortgeschriebene Fassung 2017. Münster (Landwirtschaftsverlag). Bonn: Naturschutz und Biologische Vielfalt Heft, 156.
Foeckler, F., Deichner, O., Schmidt, H., and Castella, E. (2006). Suitability of molluscs as bioindicators for meadow- and flood-channels of the Elbe-Floodplains. - in: Dziock, F., Foeckler, F., Scholz, M., Stab, S. and Henle, K. (eds.): Bioindication and functional response in floodplains systems - based on the results of the Project RIVA. - Special Issue. Int. Revue. Hydrobiol. 91, 314–325. doi: 10.1002/iroh.200610887
Foeckler, F., Deichner, O., Schmidt, H., and Jacob, K. (2000). Weichtiergemeinschaften als Indikatoren für Auenstandorte – Beispiele von Isar und Donau. – Angewandte Landschaftsplanung. Heft 37, 33–47. doi: 10.1007/978-3-642-59744-2_39
Foeckler, F., Diepolder, U., and Deichner, O. (1991). Water mollusc communities and bioindication of lower Salzach flood plain waters. Regulated Riv. Res. Manage. 6, 301–312. doi: 10.1002/rrr.3450060408
Foeckler, F., Schmidt, H., Scholz, M., Deichner, O., Kobialka, H., Meindorfer, K., et al. (2017). “Die Untere Saale – die Biodiversität ungestauter und gestauter Abschnitte,” in E. Schneider, M. Werling, B. Stammel, K. Januschke, G. Ledesma-Krist, M. Scholz, et al., Biodiversität der Flussauen Deutschlands. – Naturschutz und Biologische Vielfalt (Bundesamt für Naturschutz (Hrsg.) Bonn, Bad Godesberg, Heft), 301–312.
Follner, K., and Henle, K. (2006). The Performance of plants, molluscs, and carabid beetles as indicators of hydrological conditions in floodplain grasslands. Int Rev Hydrobiol. 91, 364–379. doi: 10.1002/iroh.200510890
Funk, A., Trauner, D., Reckendorfer, W., and Hein, T. (2017). The benthic invertebrates floodplain index – extending the assessment approach. Ecol. Indicat. 79, 303–309. doi: 10.1016/j.ecolind.2017.04.035
Gerisch, M., Dziock, F., Schanowski, A., Ilg, C., and Henle, K. (2012). Community resilience following extreme disturbances: the response of ground beetles to a severe summer flood in a Central European lowland stream. River. Res. Appl. 28, 81–92. doi: 10.1002/rra.1438
González Del Tánago, M., and García De Jalón, D. (2011). Riparian Quality Index (RQI): a methodology for characterizing and assessing environmental conditions of riparian zones. Limnetica 30, 235–254. doi: 10.23818/limn.30.18
Hall, L. W., Morgan, R. P., Perry, E. S., and Waltz, A. (2002). Development of a provisional physical habitat index for Maryland freshwater streams. Environ. Monit. Assess. 77, 265–291. doi: 10.1023/A:1016084507654
Hein, T., Schwarz, U., Habersack, H., Nichersu, I., Preiner, S., Willby, N., et al. (2016). Current status and restoration options for floodplains along the Danube River. Sci. Total. Environ. 543, 778–790. doi: 10.1016/j.scitotenv.2015.09.073
Hughes, F. M. R., Colston, A., and Mountford, J. O. (2005). Restoring riparian ecosystems: the challenge of accommodating variability and designing restoration trajectories. Ecol Soc. 10:12. doi: 10.5751/ES-01292-100112
Ilg, C., Dziock, F., Foeckler, F., Follner, K., Gerisch, M., Glaeser, J., et al. (2008). Long-term reactions of plants and macroinvertebrates to extreme floods in floodplain grassland. Ecology 89, 2392–2398. doi: 10.1890/08-0528.1
Kaat, A., and Josten, H. (2008). Fact book for UNFCCCC policies on peat carbon emissions. Wageningen: Wetlands International, 26S.
Kallimanis, A. S., Mazaris, A. D., Tzanopoulos, J., Halley, J. M., Pantis, J. D., and Sgardelis, S. P. (2008). How does habitat diversity affect the species–area relationship? Glob. Ecol. Biogeogr. 17, 532–538. doi: 10.1111/j.1466-8238.2008.00393.x
Kleynhans, C. J., Mackenzie, J. A., and Louw, M. D. (2007). Module F: Riparian vegetation response assessment index in river. EcoClassification: Manual for EcoStatus determination (version 2). Joint Water Research Commission and Department of Water Affairs and Forestry Report, Pretoria, South Africa.
Koenzen, U. (2005). Fluss- und Stromauen in Deutschland: Typologie und Leitbilder; Ergebnisse des F+E-Vorhabens “Typologie und Leitbildentwicklung für Flussauen in der Bundesrepublik Deutschland” des Bundesamtes für Naturschutz. FKZ: 803 82 100. Münster: BfN-Schr.-Vertrieb im Landwirtschaftsverl.
Lengyel, S., Déri, E., Varga, Z., Horváth, R., Tóthmérész, B., Henry, P.-Y., et al. (2008). Habitat monitoring in Europe: a description of current practices. Biodivers. Conserv. 17, 3327–3339. doi: 10.1007/s10531-008-9395-3
Lenz, S., and Herzberg, A. (1996). Pflege- und Entwicklungsplan für das Nahetal von der Glanmündung bis Bad Kreuznach. Oppenheim: Landesamt für Umweltschutz und Gewerbeaufsicht.
MA (2005). Millennium Ecosystem Assessment. Ecosystem and well-being. A framework for assessment. Washington, DC: Island Press.
Maes, J. B, Egoh, L., Willemen, C., Liquete, P., Vihervaara, J. P., Schägner, B., et al. (2012). Mapping ecosystem services for policy support and decision making in the European Union. Ecosyst. Serv. 1, 31–39. doi: 10.1016/j.ecoser.2012.06.004
Magdaleno, F., and Martínez, R. (2014). Evaluating the quality of riparian forest vegetation: the Riparian Forest Evaluation (RFV) Index. For. Syst. 23, 259–272. doi: 10.5424/fs/2014232-04488
Munné, A., Prat, N., Sola, C., Bonada, N., and Rieradevell, M. (2003). A simple field method for assessing the ecological quality of riparian habitat in rivers and streams: QBR index. Aquat. Conserv. Mar. Freshwater Ecosyst. 13, 147–163. doi: 10.1002/aqc.529
Nilsson, C., Reidy, C. A., Dynesius, M., and Revenga, C. (2005). Fragmentation and flow regulation of the world's large river systems. Science 308, 405–408. doi: 10.1126/science.1107887
Podschun, S. A., Thiele, J., Dehnhardt, A., Mehl, D., Hoffmann, T. G., Albert, C., et al (2018): Das Konzept der Ökosystemleistungen - eine Chance für integratives Gewässermanagement. Hydrol. Wasserbewirtschaftung 62, 453–468. doi: 10.5675/HyWa_2018,6_7.
Pusch, M. (2016): Auen - Quellen vielfältiger Dienstleistungen für den Menschen. Auenmagazin Heft. 9:4–7.
Raven, P. J., Holmes, N. T. H., Dawson, F. H., and Everard, M. (1998). Quality assessment using River Habitat Survey data. Aquat. Conserv. Mar. Freshwater Ecosyst. 8, 477–99.
Robinson, C. T., Tockner, K., and Ward, J. V. (2002). The fauna of dynamic riverine landscapes. Freshwater Biol. 47, 661–677. doi: 10.1046/j.1365-2427.2002.00921.x
Rood, S. B., Samuelson, G. M., Braatne, J. H., Gourley, C. R., Hughes, F. M., and Mahoney, J. M. (2005). Managing river flows to restore floodplain forests. Front. Ecol. Environ. 3, 193–201. doi: 10.1890/1540-9295(2005)003[0193:MRFTRF]2.0.CO;2
Schindler, S., O'Neill, F. H., Bir,ó, M., Damm, C., Gasso, V., Kanka, R., et al. (2016). Multifunctional floodplain management and biodiversity effects: a knowledge synthesis for six European countries. Biodiver. Conservat. 25, 1349–1382 doi: 10.1007/s10531-016-1129-3
Schindler, S., Sebesvari, Z., Damm, C., Euller, K., Mauerhofer, V., Schneidergruber, A., et al. (2014). Multifunctionality of floodplain landscapes: relating management options to ecosystem services. Landscape Ecol. 29, 229–244. doi: 10.1007/s10980-014-9989-y
Schneider, E., Werling, M., Stammel, B., Januschke, K., Ledesma-Christ, G., Scholz, M., et al. (2018). Biodiversität der Flussauen. - Naturschutz und Biologische Vielfalt 163. Bonn; Bad Godesberg, 498S.
Scholz, M., Henle, K., Dziock, F., Stab, S., and Foeckler, F., (eds.). (2009). Entwicklung von Indikationssystemen am Beispiel der Elbaue. Stuttgart: Ulmer Verlag, 482S
Scholz, M., Mehl, D., Schulz-Zunkel, C., Kasperidus, H. D. W, Born, W., et al. (2012). Ökosystemfunktionen von Flussauen - Analyse und Bewertung von Hochwasserretention, Nährstoffrückhalt, Kohlenstoffvorrat, Treibhausgasemissionen und Habitatfunktion. Naturschutz und Biologische Vielfalt 124:257S.
Scholz, M., Stab, S., Dziock, F., and Henle, K. (2005). Lebensräume der Elbe und ihrer Auen. Konzepte für die nachhaltige Entwicklung einer Flusslandschaft Band 4. Berlin: Weißensee Verlag, 380S.
Secchi, S., Garvey, J., and Whiles, M. (2012). Multifunctional floodplain management: looking ahead from the 2011 Mississippi floods. Natl. Wetl. Newslett. 34, 21–25.
Shang, S. H., and Mao, X. M. (2010). Determination of minimum flood flow for regeneration of floodplain forest from inundated forest width-stage curve. Water Sci. Eng. 3, 257–268. doi: 10.3882/j.issn.1674-2370.2010.03.002
Ssymank, A., Riecken, U., and Ries, U. (1993). Das Problem des Bezugssystems für eine Rote Liste Biotoptypen. Schriftenr. Landschaftspfl. u. Naturschutz 38, 47–58.
Stammel, B., Cyffka, B., Geist, J., Müller, M., Pander, J., Blasch, G., et al. (2012). Floodplain restoration on the Upper Danube (Germany) by re-establishing water and sediment dynamics: a scientific monitoring as part of the implementation. River Syst. 20, 55–70. doi: 10.1127/1868-5749/2011/020-0033
Sukhdev, P., Wittmer, H., Schröter-Schlaack, C., Nesshöver, C., Bishop, J., ten Brink, P., et al. (2010). The Economics of Ecosystems and Biodiversity: Mainstreaming the Economics of Nature: a Synthesis of the Approach, Conclusions and Recommendations of TEEB. The Economics of Ecosystems and Biodiversity (TEEB).
Tockner, K., Pusch, M., Borchardt, D., and Lorang, M. S. (2010). Multiple stressors in coupled river–floodplain ecosystems. Freshwater Biol. 55, 135–151. doi: 10.1111/j.1365-2427.2009.02371.x
Tockner, K., and Stanford, J. A. (2002). Riverine flood plains: present state and future trends. Environ. Conserv. 29, 308–330. doi: 10.1017/S037689290200022X
Votsi, N. E. P., Kallimanis, A. S., Mazaris, A. D., and Pantis, J. D. (2013). Integrating environmental policies towards a network of protected and quiet areas. Environ. Conserv. 41, 321–329. doi: 10.1017/S0376892913000362
Ward, J. V., Tockner, K., and Schiemer, F. (1999). Biodiversity of floodplain river ecosystems: ecotones and connec-tivity1. Regulat. Rivers Res. Manage. 15, 125–139.
Weiers, S., Bock, M., Wissen, M., and Rossner, G. (2004). Mapping and indicator approaches for the assessment of habitats at different scales using remote sensing and GIS methods. Landscape Urban Planning 67, 43–65. doi: 10.1016/S0169-2046(03)00028-8
Wiegleb, G., Bernotat, D., Gruehn, D., Riecken, U., and Vorwald, J. (2002). Gelbdruck„Habitat und Biotoptypen“. – In: Plachter, H., Bernotat, D., Müssner, R. and Riecken, U.: Entwicklung und Festlegung von Methodenstandards im Naturschutz. Schriftenr. Landschaftspfl. u. Naturschutz 70, 281–328.
Wippel, B., Becker, G., Seintsch, B., Rosenkranz, L., Englert, H., Dieter, M., et al. (2013). Project FFH-Impact: Implementing the Habitats Directive in German Forests: Executive Summary of a Case Study on the Economic and Natural Impacts on Forest Enterprises. Hamburg: Johann Heinrich von Thünen-Institut of Forest Based Sector Economics 34p.
Keywords: regulating ecosystem service, species and habitats, habitat types, scenario, assessment
Citation: Fischer C, Damm C, Foeckler F, Gelhaus M, Gerstner L, Harris RMB, Hoffmann TG, Iwanowski J, Kasperidus H, Mehl D, Podschun SA, Rumm A, Stammel B and Scholz M (2019) The “Habitat Provision” Index for Assessing Floodplain Biodiversity and Restoration Potential as an Ecosystem Service—Method and Application. Front. Ecol. Evol. 7:483. doi: 10.3389/fevo.2019.00483
Received: 30 November 2018; Accepted: 26 November 2019;
Published: 20 December 2019.
Edited by:
Peter Convey, British Antarctic Survey (BAS), United KingdomReviewed by:
Jack A. Stanford, University of Montana, United StatesPedro J. Leitão, Technical University of Braunschweig, Germany
Copyright © 2019 Fischer, Damm, Foeckler, Gelhaus, Gerstner, Harris, Hoffmann, Iwanowski, Kasperidus, Mehl, Podschun, Rumm, Stammel and Scholz. This is an open-access article distributed under the terms of the Creative Commons Attribution License (CC BY). The use, distribution or reproduction in other forums is permitted, provided the original author(s) and the copyright owner(s) are credited and that the original publication in this journal is cited, in accordance with accepted academic practice. No use, distribution or reproduction is permitted which does not comply with these terms.
*Correspondence: Christine Fischer, Y2hyaXN0aW5lLmZpc2NoZXJAdWZ6LmRl