 Yolanda E. Morbey
 Anders Hedenström
- 1Department of Biology, Western University, London, ON, Canada
- 2Department of Biology, Lund University, Lund, Sweden
We develop an optimization model with two decision variables to explore optimal migration mechanisms to facilitate optimal breeding timing in migratory songbirds. In the model, fitness is a function of date-dependent mortality, speed-dependent predation risk, and phenological match at arrival. The model determines the optimal combination of departure date for spring migration and migration speed, which can be mediated either by the power requirement for flight (P) or foraging effort at stopover sites (k). Our model predicts that earlier departure for spring migration should be the primary mechanism underlying earlier breeding timing, with a lesser role for faster migration via lower P or higher k. In contrast, longer migration to breeding areas selects for both earlier departure and faster migration. Empirical data on sex-specific migration traits largely conform to model predictions, since males generally migrate earlier than females but not faster than females. In contrast, empirical data on age-specific migration traits show some disagreement with model predictions, thus implicating additional tradeoffs. In partial agreement with the model, a comparative analysis of 25 songbird species showed that populations with longer migrations migrate more quickly, but do not initiate migration earlier. Our model proves to be a useful framework for interpreting migration strategies in animals making costly seasonal migrations.
Introduction
Costly migratory journeys between non-breeding and breeding areas pose a fundamental challenge: how to ensure optimal arrival timing to breeding areas with respect to seasonally-variable biotic and abiotic conditions (i.e., phenological match), while minimizing the costs of migration (e.g., energy expenditure, time, and mortality)? This challenge is particular acute for animals making long, energetically costly, seasonal migrations, such as birds and anadromous salmonid fishes (e.g., Oncorhynchus and Salmo spp.). Intuitively, these selection regimes should influence not only when animals depart for migration, but also how fast to travel. For example, late spawning populations of Oncorhynchus nerka generally migrate later (Hodgson and Quinn, 2002), and anadromous fish populations with longer migration distances migrate faster (Bernatchez and Dodson, 1987). In the bar-tailed godwit (Limosa lapponica baueri), populations that breed later at higher latitudes migrate later (Conklin et al., 2010), and in North American bird species using powered flight, those that migrate longer distances migrate faster through North America (La Sorte et al., 2013). Less is known about the relative importance of departure date vs. travel speed for facilitating optimal arrival timing, and theoretical models are lacking. Here we develop optimization models with two decision variables (departure date and travel speed) to inform optimal migration schedules in migratory songbirds (Order Passeriformes).
Migratory passerines (and near passerines) typically show several patterns of intraspecific co-variation in their breeding timing. These include protandry, which refers to the earlier onset of breeding activities in males than females (Newton, 2008; Morbey et al., 2012), the earlier arrival of adults than first-time breeders to breeding areas (Stewart et al., 2002), and later breeding timing at higher latitudes (Both and te Marvelde, 2007; Gow et al., 2019). Given sex-, age-, and latitude-specific breeding timing, differential migration schedules are expected, because migration is the life history phase immediately preceding breeding. In the context of sex-specific timing in birds, multiple aspects of the spatio-temporal organization of migration have been identified as having the potential to differ between males and females in order to facilitate protandry, with departure timing, migration speed (rate of fueling and rate of travel), and non-breeding latitude receiving the most attention by empiricists (Coppack and Pulido, 2009). Our objective is to provide a theoretical basis to better understand key aspects of differential migration behavior in songbirds.
Our models of the co-evolution of departure time and migration speed are intended to be simple and general. Whenever possible, we aim to use realistic functions and parameters, but recognize there is considerable uncertainty regarding these choices. Moreover, because the models sacrifice realism for generality, the predictions that emerge are intended to be qualitative rather than quantitative. Two related problems are modeled. The first is the daily commute for people traveling to work each day. This is a simpler and more familiar problem than avian migration, and demonstrates the main tradeoffs affecting choice of departure time and travel speed. The second is latitudinal migration of songbirds to their breeding grounds, and is the primary problem of interest. This model is more complex because it must account for the fact that migration comprises stationary fueling and movement phases. Recent studies using advanced tracking technology are now providing an unprecedented amount of individual-based data on migration traits in songbirds (McKinnon et al., 2014; Briedis et al., 2017, 2019; Ouwehand and Both, 2017). Thus, we end by reviewing evidence for differential departure date and migration speed by sex, age, and migration distance.
Models
Model 1 was conceptualized as a daily commute to work, with two decision variables: departure time (t0) and vehicle speed (v). The general problem was to determine the optimal combination of t0 and v {, v*} which maximizes fitness. The model was formulated and solved in R 3.5.1 (R Core Team, 2018) by simulation. Model 2 was an adaptation of this model for a short-hop, overland songbird migrant, with t0 being departure date and v being migration speed, which incorporates flight speed and the fueling rate to cover the power requirements for flight. In both models, we were particularly interested in the effect of varying target arrival time and travel distance on optimal departure time and travel speed. In the context of spring migration of songbirds, we addressed three questions: (1) to achieve a target degree of protandry, should males depart for migration earlier, or migrate faster than females? (2) for adult birds to arrive at breeding areas earlier than first-time breeders, should they depart for migration earlier or migrate faster? (3) should longer-distance migrants depart for migration earlier or migrate faster than shorter-distance migrants?
Model 1—The Daily Commute to Work
Decision Variables and Assumptions
We let the decision variable t0 be the time of departure (in hours) and the decision variable v be travel speed (km·h−1). Both t0 and v were considered to be behavioral decisions. The variable t0 was constrained to be in the range {0, 10}, where 0 is midnight and 10 is 10:00 am. The variable v was constrained to be in the range {30, 150}. Travel conditions were assumed to improve with departure time, which could be due to the combination of higher light levels (better visibility) and higher temperatures (less ice or snow). Commuters were assumed to have a target arrival time of τ, which would permit enough time to park and get to work on time.
Fitness Functions
Our approach closely followed Abrams et al. (1996). We specified fitness (W) to be the product of three fitness components:
so that fitness (W) is the probability of arriving at the destination at the target time τ. In this function, fitness combines the minimization of delay events (i.e., weather-related accidents or speed traps) and the benefits of time matching to τ. Without any delay events, arrival time (t1) depends only on t0 and v. To keep the problem simple, we ignored any effects of traffic congestion or priority effects at arrival.
The functions for the three fitness components were based on previous applications and produce intermediate optima. The first fitness component (S1) is the probability of avoiding weather-related delay events, which depends on the rate of delay events per kilometer traveled (Cs) and commuting distance (d).
Thus, traveling a longer distance was assumed to be more costly (cf. Bell, 1997). We further let Cs be a function of travel conditions at departure time t0. Two formulations of Cs were considered. The first assumes that travel costs decrease linearly with departure time, as in Bell (1997):
where C0 is the maximum travel cost (rate of delay events) when t0 = 0, and α1.1 is the decrease in travel cost for each unit increase in t0 (subject to the constraint α1.1τ < C0). This formulation accounts for the increased probability of a delay event, such as an accident, when departing earlier under poorer conditions. The fact that conditions might improve over the course of an individual's commute was not considered here, but could be considered in more complex formulations.
An alternative formulation assumes that Cs declines exponentially with t0 (see Appendix in Jonzén et al., 2007):
where α1.2 determines the rate of decline in Cs. Functions S1.1 and S1.2 are shown for comparison (Figures 1A,B).
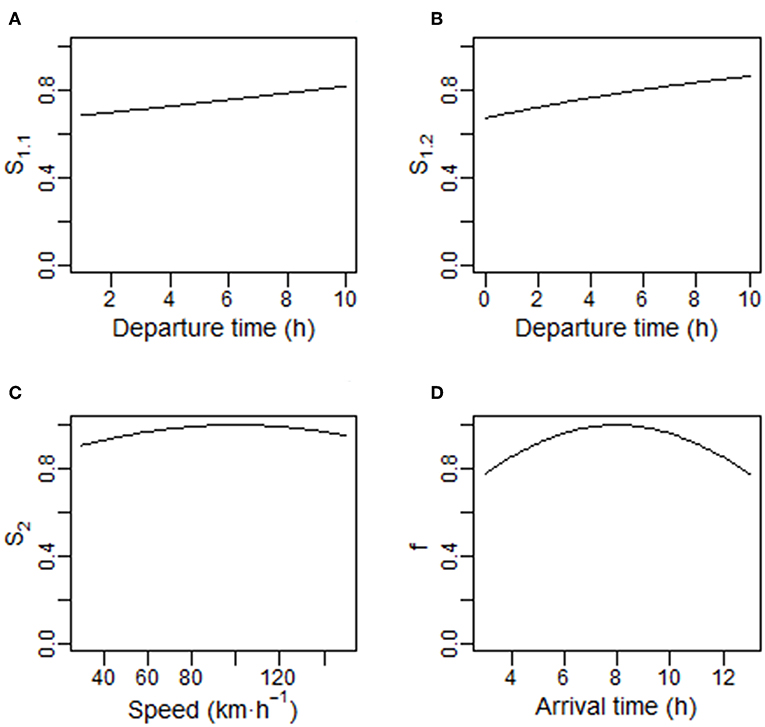
Figure 1. Components of the fitness function used in the commuting model. (A,B) Show the probability of avoiding weather-related delay events (S1.1 or S1.2) as a function of departure time (t0 in hours). In (A), S1.1 = exp(–[C0–α1.1t0]·d); in (B), S1.2 = exp(−[C0·exp(–α1.2t0)]·d); C0 = 0.002, α1.1 = 0.0001, α1.2 = 0.1, and d = 200 km. (C) Shows the probability of avoiding delay events (S2) as a function of speed (km·h−1); S2 = exp(−α2[(v – vlim)2]·d); α2 = 0.0000001, vlim = 100 km·h−1. (D) Shows the fitness benefits accrued at arrival (f ) as a function of arrival time t1; f1 = exp(−α3·([t1−τ]2); α3 = 0.01 and τ = 8 h.
For the second fitness component (S2), we assumed that travel speed deviating from a speed limit of vlim (km·h−1) is costly in terms of a higher rate of speed-related delay events (being pulled over) per km traveled, such that:
where v is travel speed and α2 is a constant which determines how the per km travel costs change as v deviates from vlim (Figure 1C). S2 is essentially the probability of avoiding a delay event across the entire commute.
For the third fitness component, we assumed a penalty for arriving earlier or later than optimal arrival time (τ). For example, arriving too early means a longer wait time until τ, and arriving too late could increase the risk of disciplinary action by an employer. Following Abrams et al. (1996), the equation for this fitness component was assumed to be:
where t1 = t0 + d/v, and α3 determines the cost of mismatched timing (Figure 1D).
Optimal t0 and v
Simulation was used to find the optimal combination of t0 and v {, v*} which maximizes W. A baseline set of parameters was used to model a commute of d = 200 km at a speed limit vlim = 100 km·h−1, with a target arrival time of 8:00 am (τ = 8 h). Other parameters were chosen to impose some costs (Figure 1): C0 = 0.002, α1.1 = 0.0001, α1.2 = 0.1, α2 = 0.0000001, α3 = 0.01. Fitness surfaces were plotted using the filled.contour3 and filled.legend functions in R (http://wiki.cbr.washington.edu/qerm/index.php/R/Contour_Plots). Allowing for either a linear or exponential decrease in delay events and using the baseline set of parameters, the model produced a fitness surface with intermediate optima (Figure 2). This suggests that the chosen functions and parameter values were reasonable. The choice of S1.1 or S1.2 made little difference to {, v*}.
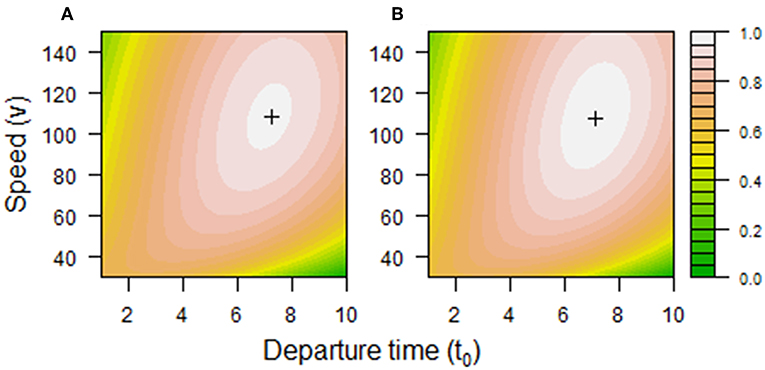
Figure 2. Fitness associated with combinations of departure time (t0) and speed (v) using fitness component (A) S1.1 or (B) S1.2 and baseline parameter values in the commuting model. Optimal combinations {t0*, v*} are shown as crosses. In (A) t0* = 7.2 h, v* = 109 km·h−1, and t1 = 9.0 h. In (B) t0* = 7.1 h, v* = 108 km·h−1, and t1 = 9.0 h. The fitness contours are based on loess fits of model output with span = 0.001, with values indicated in the legend.
Predictions
Simulations were run with randomized parameter combinations to explore the consequences of an earlier target arrival time (τ) and a longer travel distance (d). Following Kokko et al. (2006), we used randomization because of uncertainty in the baseline parameter values, and to allow for a broad range of parameter combinations. In each simulation (n = 1,000), τ and d were drawn from uniform distributions between minimum and maximum values. Each remaining parameter was chosen from a normal truncated distribution, with mean = baseline value, sd = mean/3, and bounding values defined by the 2.5% and 97.5% quantiles. Separate simulations were run using S1.1 or S1.2.
Randomized simulations using S1.2 showed that departure time, but not travel speed, was sensitive to τ (Figures 3A,B). Using the correlation coefficient as an index of model sensitivity, the correlations with τ were r = 0.70 and r = −0.02, respectively. Thus, when aiming to arrive at a destination earlier, it is optimal to leave earlier but not travel faster. In contrast, both departure time and, to a lesser extent, travel speed were sensitive to d (Figures 3C,D). The correlations with d were r = −0.26 for departure time and r = 0.15 for travel speed. Thus, it is optimal to leave earlier and travel faster when commuting a longer distance.
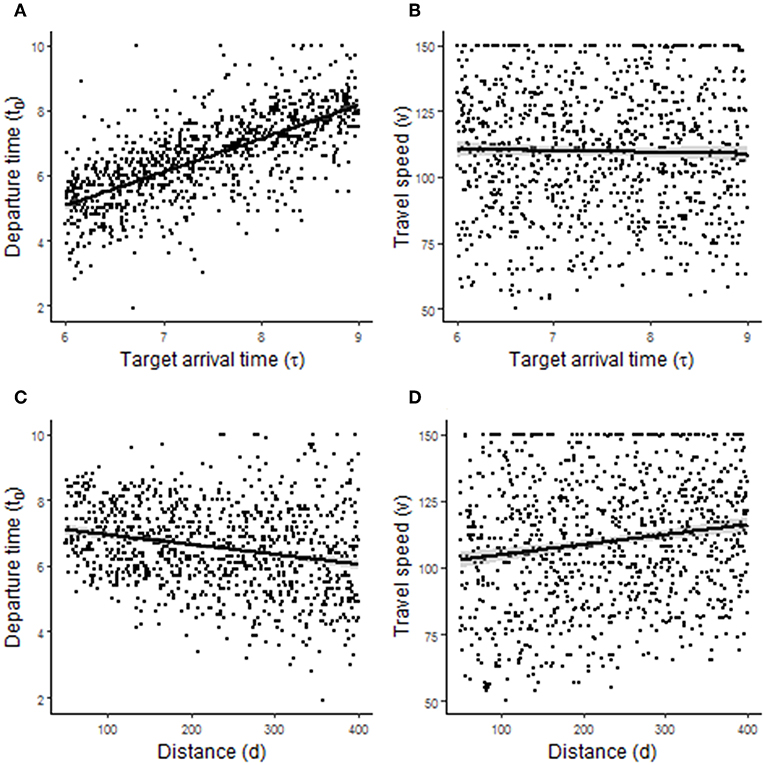
Figure 3. Predictions arising from randomized simulations of the commuting model. (A,B) Show the effect of target arrival time τ on departure time t0 (hours since midnight) and travel speed v (km·h−1), respectively. (C,D) Show the effect of commuting distance d on t0 and v, respectively.
Departure time was also sensitive to the speed limit (r = 0.35), C0 (r = 0.36), and α3 (r = −0.33). Commuters should leave later when the speed limit is higher, the maximum risk of delay is higher (e.g., poorer weather), or the penalty for mismatched arrival timing is lower. The remaining correlations with departure time were <0.07. Travel speed was also sensitive to the speed limit (r = 0.96) and α2 (r = −0.14) but not to the other parameters (r's < 0.10). Commuters should drive faster when the speed limit is higher and when the penalty for mismatched travel speed (i.e., more enforcement) is lower. The majority of the results were similar when these scenarios were modeled under the assumption of a linear decrease in delay events (S1.1). The exception was that departure time was not sensitive to C0 (r = 0.01) but instead was sensitive to α1.1 (r = 0.36), the rate of linear decrease in the travel cost. With a greater decrease in the travel cost (i.e., a more rapid improvement in driving conditions), commuters should leave later.
Model 2—Spring Migration in an Overland, Nocturnal Migrant
This model was parameterized for small songbirds (~20 g) with overland, nocturnal migration with no major ecological barriers for stopover fueling. Functions and parameter values were chosen based on their general shapes, and whenever possible, were informed by empirical data. However, we recognize a general lack of data on mortality and reproductive success in wild songbirds to support our choice of parameters in the fitness functions.
Decision Variables and Assumptions
In the model we determined the optimal departure date (day of year, t0) and migration speed (km·h−1) for a bird leaving its final non-breeding (premigratory) site in the south and traveling north a distance (d) to its breeding site. The variable t0 was considered to be a behavioral decision which determines the onset day of fueling in advance of the first migratory flight (Lindström et al., 2019). We assumed that variation in migration speed is determined either by the power requirement for flight (P), which is partly determined by wing morphology (model 2.1), or k (the fueling rate; model 2.2). In the former case, we considered wing morphology, and therefore P, to be a fixed, developmental decision (i.e., an evolved trait). In the latter case, we considered fueling rate (k) to be a behavioral decision about foraging intensity (cf. Weber et al., 1998). We also assumed a target arrival date (day of year, τ). The variable t0 was constrained to be in the range {0, τ}, where 0 is the earliest possible migration date.
Fitness Functions
We specified fitness (W) as the product of three fitness components:
so that fitness (W) is expected reproductive output. Fitness combines mortality minimization and the reproductive benefits of matching arrival time to τ. Prior theoretical work on optimal migration strategies have considered a variety of decision variables, fitness criteria, and model formulations including analytical models of single decision variables, dynamic optimization models, and optimal annual routine models (review: Alerstam, 2011). Compared to previous models, ours is a deterministic model which considers two decision variables, and fitness criteria that include the minimization of time spent on migration and the minimization of predation risk (Alerstam and Lindström, 1990) and phenological match (Weber et al., 1998; Jonzén et al., 2007).
The first fitness component (S1) is the cumulative probability of surviving extrinsic mortality events, which depends on the instantaneous mortality rate per kilometer traveled (Cs) and travel distance (d).
Thus, migration over a longer distance was assumed to be more costly (cf. Bell, 1997). Extrinsic mortality events may include predation or exposure to severe weather. We further allowed Cs to be a function of departure time, t0, assuming that costs begin to accrue during the first (predeparture) fueling period. In the commuting model, model results were not sensitive to the choice of formulation for S1, thus we only consider the formulation in which extrinsic mortality declines exponentially with t0 (Jonzén et al., 2007):
where C0 is the maximum mortality rate when t0 = 0, and α1 determines the rate of decline in Cs. This formulation accounts for an increased probability of total migration mortality when departing earlier in the year, in presumably harsher environmental conditions. The possibility of variable hazards across the migration route were not considered here. For baseline parameter values, we let d = 5,000 km and assumed C0 = 0.0001 and α1 = 0.03. Thus, S1 = 0.61 when t0 = 0, and S1 = 0.98 when t0 = 100.
The second fitness component (S2) reflects the costs associated with migration speed. In model 2.1, we assumed that these costs are mediated by wing shape, which can be optimized for flight speed or maneuverability, but not both (e.g., Hedenström and Møller, 1992; Vágási et al., 2016). A rounded wing shape that facilitates maneuverability is known to be important for escaping predation (Swaddle and Lockwood, 1998; Fernández-Juricic et al., 2006). Thus, wings adapted for long-distance migratory flights might be traded off against the ability to escape from predators (cf. Lank et al., 2017; Anderson et al., 2019). For comparison, in model 2.2 we assumed that costs associated with migration speed are mediated by foraging effort at stopover sites. Higher effort leads to a higher fueling rate and shorter stopovers, but at a greater risk of predation.
In model 2.1, we assumed birds follow a policy of time-selected migration and maximize their speed of migration, which is migration distance divided by cumulative flight time plus cumulative fueling time to cover flight costs (Norberg, 1981; Alerstam and Lindström, 1990; Hedenström and Alerstam, 1995). Under this fitness criterion, optimal migration speed (Vmigr) can be calculated as a proportion of optimal flight speed (Vflight) given the power requirement for flight (P in Watts) at Vflight and the fueling rate (k in Watts):
P is affected by the overall elevation of the U-shaped power curve for flight. Lowering P, for example due to increased wing pointedness (which is related to aspect ratio), is expected to decrease Vflight, but only to a small degree compared to its effect on the time required for fueling (see Figure 1 in Hedenström et al., 2007). The effect of lowering P is to reduce the time required for fueling, which in turn increases Vmigr. For simplification, we assumed Vflight to be invariant in the model, and let P be the decision variable. We assumed that k is a constant that characterizes the environmental conditions for fueling (note that this assumption was relaxed in model 2.2).
In the model, we constrained the choice of flight power input P to be in the range of 1–4 W. For reference, P was estimated to be 1.6 W for ~12.6 g free-flying yellow-rumped warblers (Setophaga coronata) (Guglielmo et al., 2017), and 4.2 W for ~33 g free-flying Swainson's thrushes (Catharus ustulatus) (Gerson and Guglielmo, 2011).
An estimate of k (rate of fuel gain while activity foraging) was determined from empirical estimates of fat deposition rate (daily gain in fat mass as a proportion of lean body mass), the caloric value of fat (36.3 kJ/g), and the proportion of the day actively foraging (Lindström, 1991). Fat deposition rates of wild songbirds can vary among species and ecological circumstance (Moore and Kerlinger, 1987; Alerstam and Lindström, 1990; Schmaljohann and Eikenaar, 2017); we chose the estimate of 2.4% of lean mass d−1, which was the median value extracted from 31 species- and/or population-specific values (Alerstam and Lindström, 1990). Assuming a model 20 g lean bird, this corresponds to 0.48 g fat gain per day, which is equivalent to 0.202 W. Assuming an active foraging period of 12 h and 0 W fat gain overnight, this translates to 0.404 W fat gain while foraging. Based on empirical studies, Vflight was assumed to be 12 m·s−1 or 43.2 km·h−1 (Bruderer and Boldt, 2001).
Birds with power requirements for flight (P) increasingly below Pmax (due to increased wing pointedness) were assumed to experience a higher predation rate following this functional form: αp1[αp2(Pmax-P)2], where αp1 is a constant which determines the minimum predation rate and αp2 is a parameter which determines how predation rate increases with decreasing P. This cost was intended to reflect a reduced ability to escape predators due to having more pointed wings. Surviving predation is then:
This function was chosen to be similar to one used in the commuting model. Unlike in the commuting model, however, Sp is not a function of d. This is because wing shape is expected to affect predation rate all year, both during migratory and non-migratory periods. We let αp1 = 0.005, αp2 = 10, and Pmax = 4 W. Thus, Sp = 0.64 when P = 1, and Sp = 1 when P = 4.
In model 2.2, we let fueling rate (k) be the decision variable and constrained the choice of k to be in the range {kmin, kmax}. For the minimum value, we let kmin = 0.2 W. We calculated kmax assuming a maximum fat accumulation rate of 5.4% d−1 (Lindström, 1991), the caloric value of fat, and a daily foraging period of 12 h. After conversion, kmax = 0.9 W. In contrast to model 2.1, we assumed P was invariant and let P = 2 W. A higher fueling rate was assumed to carry a predation cost due to increased exposure, such that:
where αk is a parameter which determines how predation rate increases with k. We let αk = 0.2 so that Sk = 0.96 when k = 0.2 W, and Sk = 0.84 when k = 0.9 W.
For the third fitness component (f) in models 2.1 and 2.2, we assumed an optimal arrival date (day of year, τ) with a reproductive penalty (reduction in offspring production) for arriving earlier or later than this time. As in the commuting model, the equation for this fitness component was:
where t1 = t0 + tmigr. Allowing reproductive output to be maximal at τ is similar to assumptions in Weber et al. (1998) and is consistent with the commuting model. For baseline parameters, we let α3 = 0.0001 and τ = 125. Thus, f = 1 when t1 = 125, and f = 0.94 when t1 = 100 or 150.
Total time spent on migration (tmigr in days) depends on time in flight, time spent fueling for those flights, and time spent inactive while at stopover sites. Letting total flight time be d/Vflight and total fueling time be d/Vflight·P/k, the ratio between flight time and fueling time is 1:P/k (Hedenström and Alerstam, 1997). For example, if P = 2 W and k = 0.404, this ratio would be 1:5. If we let hflight be the hours spent in flight per day (because birds fly for only part of the night) and hfuel be the hours spent fueling per day (because birds fuel only during the day), then
Recognizing uncertainty and individual variability, we assumed hfuel = 12 h and hflight = 6 h. As an example, the calculated value of tmigr was 69 days after substituting values of d = 5,000 km, Vflight = 42.3 km·h−1, k = 0.404, W, P = 2 W, hfuel = 12 h, and hflight = 6 h.
Finding {, P*} or {, k*}
Using a baseline set of parameters (d = 5,000 km, τ = 125 d, P = 2 W, k = 0.404 W, C0 = 0.0001, α1 = 0.03, αp1 = 0.005, αp2 = 10, αk = 0.2, α3 = 0.0001, Vflight = 42.3 km·h−1, hflight = 6 h, and hfuel = 12 h), models 2.1 and 2.2 produced fitness surfaces with intermediate optima (Figure 4). This suggests that the chosen functions and baseline parameters were reasonable approximations.
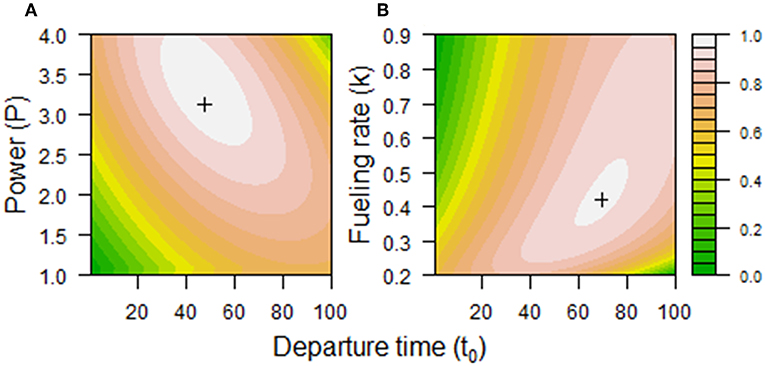
Figure 4. Fitness associated with combinations of (A) departure time (t0) and power (P) or (B) departure time (t0) and fueling rate (k) using baseline parameter values in the migration model. Optimal combinations {, P*} and {, k*} are shown as crosses. In (A), = 48 days, P* = 3.1 W, and = 142 days. In (B), = 69 days, k* = 0.42 W, and = 134 days. The fitness contours are based on a loess fit of model output with span = 0.005, with values indicated in the legend.
Predictions
As we did in model 1, simulations were run with randomized parameter combinations to explore the consequences of an earlier target arrival time (τ) or longer travel distance (d). In each simulation (n = 1,000), τ and d were drawn from uniform distributions between minimum and maximum values. Each remaining parameter was chosen from a normal truncated distribution, with mean = baseline value, sd = mean/3, and bounding values defined by the 2.5 and 97.5% quantiles. Separate simulations were run for models 2.1 and 2.2.
Randomized simulations of model 2.1 showed that departure day t0, and to a lesser extent P, was sensitive to τ (Figures 5A,B). The correlations with τ were r = 0.28 and r = 0.10, respectively (Table 1). Thus, it is advantageous for birds to leave earlier and have a slightly lower power requirement for flight (e.g., greater wing pointedness) when needing to arrive at a destination earlier. Departure day, and to a greater extent, P were also sensitive to d (Figures 5C,D). The correlations with d were r = −0.44 for departure day and r = −0.74 for P (Table 1). Thus, it is advantageous for birds to leave earlier and have a lower power requirement for flight (e.g., greater wing pointedness) when migrating a longer distance. Randomized simulations of model 2.2 gave similar results: it is advantageous to leave earlier and to fuel slightly faster when needing to arrive at a destination earlier, and to leave earlier and fuel faster when migrating a longer distance (Table 1, Figure 6).
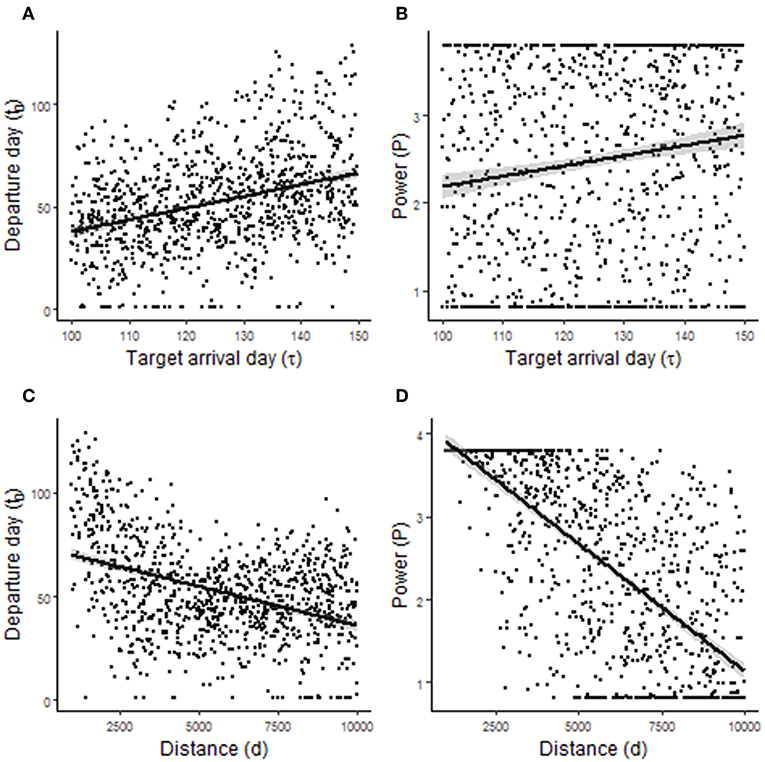
Figure 5. Predictions arising from randomized simulations of migration model 2.1. (A,B) Show the effect of target arrival time τ on departure day of year t0 and the power requirement for flight P (in W), respectively. (C,D) Show the effect of migration distance d on t0 and P, respectively.
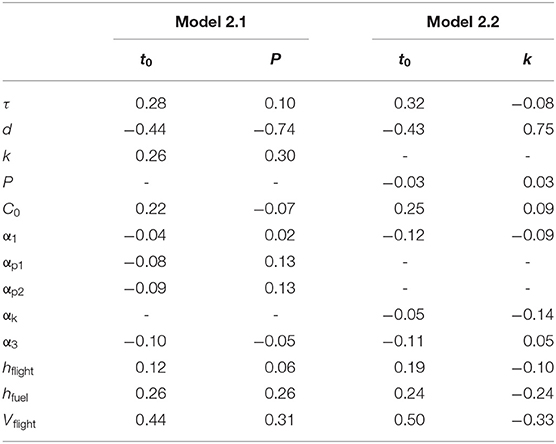
Table 1. Correlations (r) between parameters and decision variables (t0, P, k) in randomized simulations of migration models 2.1 and 2.2.
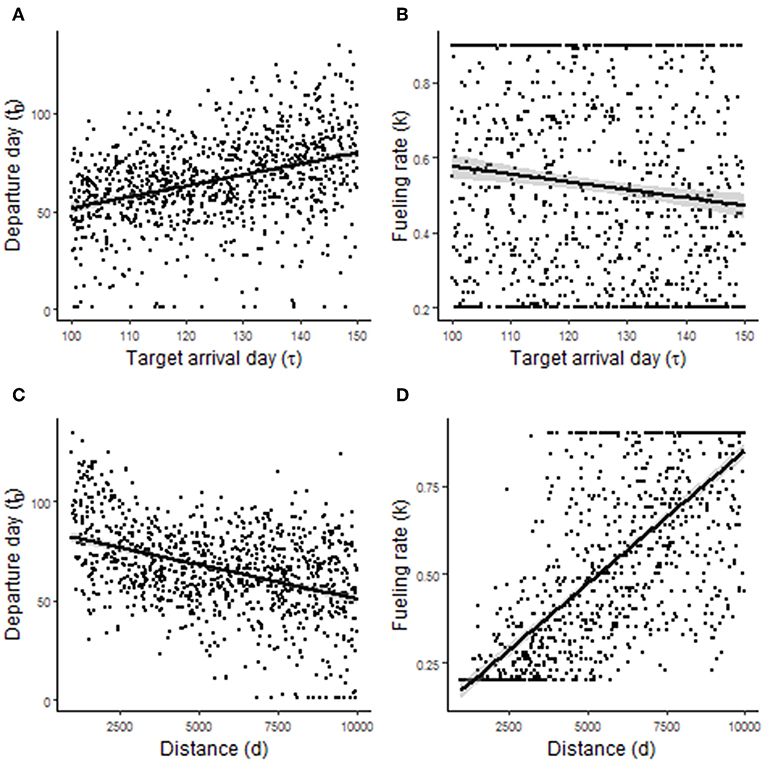
Figure 6. Predictions arising from randomized simulations of migration model 2.2. (A,B) Show the effect of target arrival time τ on departure day of year t0 and fueling rate k (in W), respectively. (C,D) Show the effect of migration distance d on t0, and k, respectively.
Departure day and migration speed were also sensitive to other parameters in models 2.1 and 2.2, and predictions largely recapitulated predictions from the commuting model (Table 1). Higher extrinsic mortality (determined by C0 and α1) and lower predation rates (determined by αp1, αp2, and αk) favored later departure and slower migration via adjustments to P or k. A greater penalty for phenological mismatch (α3) favored earlier departure. Several parameters directly contributing to faster migration (k, hfuel, Vflight) favored later departure and slower migration via adjustments to P (model 2.1) or k (model 2.2). Longer nocturnal flights favored later departure but no adjustment to P or k.
Compared to the commuting model, target arrival time τ had larger effects on optimal P and k in models 2.1 and 2.2, respectively. We also found that the effect of τ on migration speed (P or k) depended on other parameters in the model. For example, in model 2.1, the effect of τ on P was stronger when migration distance d was higher or fueling rate k was higher (Figure 7).
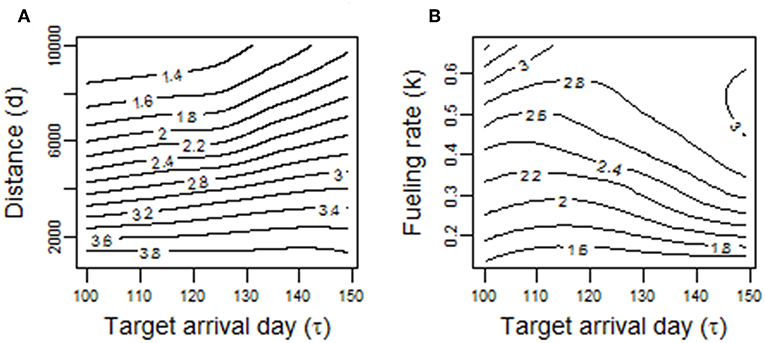
Figure 7. Predictions for the power requirement for flight P arising from randomized simulations of the migration model 2.1. (A) Shows the effect of different combinations of target arrival time τ and migration distance d. (B) Shows the effect of different combinations of target arrival time τ and fueling rate k.
Empirical Evidence
To assess the empirical evidence regarding the alternative mechanisms used to achieve an earlier target arrival date by songbirds, we tested qualitative predictions regarding within-population sex and age effects. In other words, assuming sex and age differences in target arrival time at breeding areas, do males or adult birds depart for migration earlier and/or migrate faster than females or young birds? Within-population comparisons provide a robust evaluation of model predictions, because most ecological covariates are expected to be similar between comparator groups. Published information was compiled on sex and age comparisons in the onset of spring migration and other traits related to spring migration speed in migratory songbirds. An important caveat is that some species may not conform exactly to our modeled songbird, especially with respect to their body size and presence of an ecological barrier for en route fueling. Traits related to migration speed included migration speed (km·d−1) across the whole migratory journey, total migration duration (d), wing shape (usually pointedness), flight speed, fueling rate (based on mass change or plasma metabolite analysis), and stopover duration (d) (Tables S1, S2). For each study, we present the methodology (e.g., radio-telemetry, geolocator, mark-recapture/resighting), species, statistical evidence of significant sex (M < F, M = F, M > F) or age effects (A < J, A = J, A > J; where A refers to adult or after-second-year birds and J refers to juvenile or second-year birds), and reported effect sizes for timing and speed traits. These data were then tabulated by effect direction and study. No formal meta-analysis was done to evaluate overall sex and age effects due to duplication of species across studies, variation in the number of species per study, and inconsistences in how data were analyzed.
We used an among-species, phylogenetically-controlled, comparative approach to assess the effects of migration distance on migration speed and departure day, as migration distance commonly differs among but not within populations. Published information was compiled for spring migration traits for 25 songbird species (Table S3), where the majority of studies used geolocators. One exception was Kirtland's warbler where spring migration duration was estimated from observations of color-banded individuals (Ewert et al., 2012). These species differed in body size, the presence of ecological barriers for en route fueling, and other ecological traits such as trophic guild, and thus did not exactly conform to our modeled songbird.
To test qualitative predictions from the migration model, we extracted or derived information on spring migration distance (km), departure day of year, migration speed (km·d−1), body mass (g), and breeding latitude. We only included one set of data for each species, and in cases where the same species had been studied more than once, we included the one with the biggest sample size. We used lean body mass if available and otherwise used the reported body mass. Only studies of three or more spring tracks were included. In studies where information about migration distance were lacking or not explicitly given, we derived migration distance either from breeding and wintering locations or we extracted approximate locations from published maps. Migration distances were calculated as orthodromes when there were no or only minor detours, or as the sum of migratory distances between consecutive stopovers from wintering to breeding locations when the birds made detours. From these data we derived overall migration speed, Vmigr, which is total migration distance divided by total time of migration, which should include the time for fueling before the first migratory flight (Lindström et al., 2019). We note that we may be underestimating migration distance and therefore underestimating Vmigr. This is partly compensated for by the fact that in most cases the duration of migration excludes the time for fueling before the first migratory flight. This is a notorious problem related to tracking studies, where onset of migration is usually defined based on when the birds start moving. In long distance migrants having many stopovers, the influence of excluding the first fueling episode from the duration of migration will have a relatively small effect. If estimated Vmigr exceeds 300 km·d−1 for songbirds, one should take that as an indication that the duration of migration is likely underestimated, or birds flew with tailwind assistance (cf. Hedenström and Alerstam, 1998). This was the case for two species in our data (Table S3), and therefore our analysis should be considered as provisional. In cases where body mass was missing, we obtained body mass from other sources (Dunning, 1993; Conway and Eddleman, 1994).
To account for relatedness among species, migration speed was analyzed using a phylogenetic generalized least squares model using function pgls in package caper (Orme et al., 2018). The main explanatory variable of interest was migration distance. Body mass and departure day were also included to account for these potentially confounding effects. In the analysis, migration speed, and distance were log-transformed to reduce skew. Phylogenetic information (n = 1,000 trees; Hackett backbone) was obtained from BirdTree.org (Jetz et al., 2014). A consensus tree was built using function consensus.edges in package phytools (Revell, 2012). In the pgls analysis, we optimized branch length transformations in a sequential fashion by fitting the parameters λ, δ, and κ by maximum likelihood. Models with different combinations of the explanatory variables were compared by AIC, where a lower AIC indicates a better fit. Breeding latitude was excluded from the global model because of difficulties in estimating λ when it was included, but we tested for its inclusion by AIC. Ordinary least squares regression was also done on the selected model for visual comparison with the pgls model. Departure day was similarly analyzed using function pgls with log-transformed migration distance and body mass included as explanatory variables.
Sex and Age Effects
An earlier onset of spring migration by males than females was commonly reported in migratory songbirds (14/18 cases). Based on reported effect sizes (n = 13 cases), the sex difference in onset was variable (−38 to 3 days) with a median value of −7 days (i.e., protandry in departure day). In contrast, sex differences in traits related to faster travel speed (greater migration speed, flight speed, or fueling rate; shorter migration duration or stopover duration) were reported in only 5 of 23 cases (Table 2, Table S1). In these five cases, males had traits consistent with faster travel speeds than females. Estimates of sex-specific migration speed, flight speed, migration duration, and stopover duration were sparse. Despite minimal evidence that males migrated faster than female, males usually had more pointed wings than females (6/8 cases).
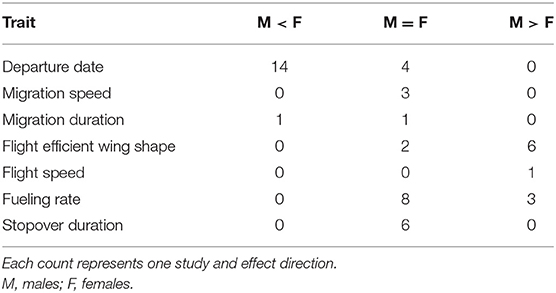
Table 2. Summary of sex effects in departure date and traits related to spring migration speed from published studies of migratory songbirds (see Table S1).
Regarding age effects in spring migration, empirical data was more sparse than for sex effects (Table 3, Table S2). Only three studies examined age differences in the onset of spring migration, and these found inconsistent effects. Age effects were frequently reported for wing shape, with adults having more pointed wings than juveniles in 5/6 cases, and stopover duration, with adults have similar or shorter stopovers than juveniles in 4/7 cases. In 5/5 cases, fueling rates were similar between age classes.
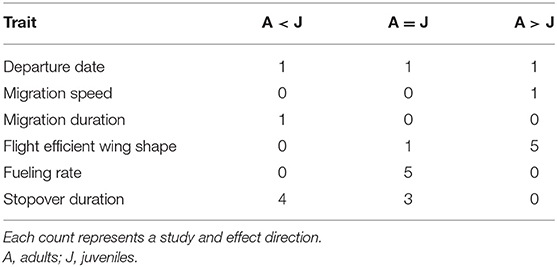
Table 3. Summary of age effects in departure date and traits related to spring migration speed from published studies of migratory songbirds (see Table S2).
Distance Effects
The model of log-migration speed with the lowest AIC included log-migration distance, departure day, and body mass. Birds migrated more quickly when they had longer migration distances (β = 0.318 ± S.E. = 0.123; t21 = 2.6, p = 0.017) and when they departed later (β = 0.003 ± 0.002; t21 = 2.2, p = 0.037; Figure 8). In this model, body mass was not significant (p = 0.756). Optimized branch length transformations were λ = 0.435, δ = 1.952, and κ = 0.942. The model of departure day with the lowest AIC only included the intercept, so none of the explanatory variables were important.
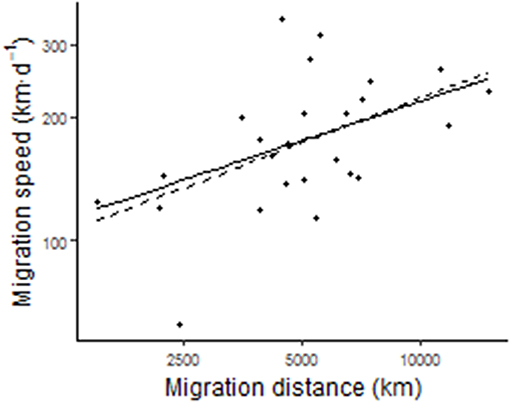
Figure 8. Songbird species with longer migrations have faster migration speeds. The phylogenetically-controlled regression line is shown (solid line) in addition to the least squares regression line (dotted line). Migration speed and distance were log10-transformed in the analysis.
Discussion
To achieve an earlier arrival time at a destination, the commuting and migration models predict adjustments to departure time as the dominant mechanism, with adjustments to migration speed (adaptation of P or plasticity in k) playing a lesser role. Extending these results to avian protandry in arrival timing, our models predict that males should depart non-breeding areas before females, and sex-specific departure timing should be the primary mechanism underlying protandry. Males may also have a lower power requirement for flight or higher fueling rate, but these effects should be more subtle than for departure day. The model predictions largely agree with empirical data (Table 2 and additional citations in Newton, 2008; Coppack and Pulido, 2009). Sex-specific departure from non-breeding areas is commonly observed in migratory songbirds, with males typically departing for migration about 7 days before females (cf. Briedis et al., 2019). In contrast, traits related to travel speed usually do not differ between the sexes. Where sexes do differ, however, they are in the expected direction for facilitating faster migration by males than females.
Variable results regarding sex-specific migration speed may be related to unaccounted for ecological covariates that act as selection agents on migration traits. For example, our model predicts sex differences in migration speed to be greater for longer distance migrants or under better fueling conditions, but such information on these and selection agents are generally unavailable. Moreover, environmental variables such as temperature or weather conditions can serve as cues for, or directly affect, migration traits (Ahola et al., 2004; Both et al., 2005; Marra et al., 2005; Knudsen et al., 2011; Haest et al., 2018). Seasonal carry-over effects can also influence phenology (Marra et al., 1998; Gow et al., 2019). Regarding the empirical evidence, we note that traits underlying migration speed are difficult to measure or may be inherently variable, small differences in these traits may be difficult to detect without large sample sizes, and departure day is not the same as the onset of pre-departure fueling. Also, stopover duration may not be the best indicator of migration speed, because stopover departures can be associated with landscape-level re-locations within a stopover region, rather than directional, migratory flights (Taylor et al., 2011; Schmaljohann and Eikenaar, 2017). Fueling rates represent a better index of migration speed (Lindström et al., 2019), but measuring fueling rates remains a challenge for wild songbirds in natural environments (Schmaljohann and Eikenaar, 2017).
The migration model was less able to recapitulate age differences in spring migration traits of songbirds. Accordingly to a theoretical model, the earlier arrival timing of adult birds than juvenile birds is evolutionarily favored due to within-sex competition for breeding territories, with adults outcompeting juveniles (Kokko et al., 2006). Thus, adults should have an earlier target arrival date τ. In light of our model, we would predict differential departure date from non-breeding areas as the primary driver of differential spring migration by age, but not differential migration speed. However, evidence regarding age-specific departure date is mixed and does not strongly support model predictions. In contrast to the model, adults and juveniles seem to differ more often in migratory speed, not because of slower fueling by juveniles, but perhaps because of longer stopovers and less efficient migratory flight behavior due to their wing shape. Age differences in stopover duration but not k also suggest a decoupling between k and stopover decisions in young birds, for reasons which may be related to the importance of energy rather than time minimization in young birds (Hedenström and Alerstam, 1997).
Slower migration speeds in juveniles than in adult birds suggests additional constraints acting on juveniles, which could limit the evolution of factors controlling migration speed such as P or k. Juveniles are known to differ from adults in many behavioral, morphological, and physiological traits, some of which persist to their first spring migration. For example, juveniles can retain their shorter and generally more rounded wings than adults, owing to the retention of their first primary feathers (Pyle, 1997). Thus, wing shape may be optimized for post-fledging and juvenile survival rather than for migration efficiency (Alatalo et al., 1984). Juveniles also may continue to show inexperience with navigation and orientation during their first spring migration. For example, juveniles show less tailwind selectivity than adults when making departure decisions both in fall (Mitchell et al., 2015) and spring (Morbey et al., 2018). In several species, juveniles in the fall have smaller flight muscles, larger digestive organs, and higher basal metabolic rates than adults (McCabe and Guglielmo, 2019), although it is not known if these effects carry over to their first spring migration. Further research on age effects during spring migration seem warranted. For example, if juvenile wing shape constrains spring migration, such effects should not be apparent for species with two complete molts per year (e.g., willow warbler Phylloscopus trochilus or bobolink Dolichonyx oryzivorus).
The commuting and migration models predict that longer travel distances should be facilitated by adjustments to departure time and travel speed. The prediction that migration distance selects for reduced power required to fly through adaptation of wing shape is generally supported by comparative studies of simple or composite wing shape indices (Kipp, 1958; Marchetti et al., 1995; Mönkkönen, 1995). Aerodynamic models of flight cost include wing span and aspect ratio as descriptors of wing morphology, but simple or composite wing indices are correlated with aspect ratio (Hedenström, 1989). Conforming to the predicted effect of travel distance on travel speed, we found that longer-distance migratory songbirds have faster migration speeds. Similar findings were also reported in a recent analysis of migration speed among and within species of songbirds that used some of the same sources of data as ours, but used a different statistical approach (Schmaljohann, 2019). While these results are encouraging, estimated migration speed does not include the fueling episode before the first migratory flight.
In contrast to the predicted effect of travel distance on departure time, longer-distance migratory songbirds did not depart for migration earlier but in fact departed later. This was the case even though we included the ecological covariates body size and breeding latitude, and accounted for phylogenetic relatedness among species. However, the 25 songbird species differ in many other respects, including their migratory routes, habitat preferences, trophic guilds, mating systems, and molt strategies. These factors likely select for differences in the seasonal phenology of migration and breeding, and possibly swamp any effect of migration distance on the onset of spring migration.
Our migration model has the potential to inform predictions regarding phenological and morphological adaptation to climate change. Climate change at mid- to high latitudes has advanced breeding phenology and extended species ranges. Similar to optimal annual routine models (Hedenström et al., 2007; Jonzén et al., 2007), our model predicts that an earlier optimal breeding date should select strongly for earlier departure from non-breeding areas. To a lesser extent, we also predict faster migration (e.g., a lower power requirement for flight or a faster fueling rate). Desrochers (2010) observed increased wing pointedness in boreal forest songbirds which was attributed to selection for increased mobility due to deforestation. According to our model, this pattern in migratory species could also be explained as an adaptation to climate change, assuming an advancement of optimal breeding date in these northern forests. If breeding populations shift northward in response to climate change, increasing migration distance should strongly select for faster migration, with less clear-cut effects on departure timing. On the one hand, longer migration distances favor earlier departure, but if optimal breeding dates shift to later in the year at higher latitudes, this would select for later departure.
In conclusion, we developed a simple optimization model of the onset day of spring migration and migration speed. Many of the model predictions agreed with empirical data, although age effects presented a challenging problem for future consideration. Although we focused on migratory songbirds, the model could be parameterized or re-formulated for other migratory or commuting systems. For example, a logical next step would be to model and summarize sex differences in the onset of spring migration and migration speed in shorebirds or in anadromous salmonids. As more migration studies are published in the near future, a consistent reporting of migration traits and important ecological covariates will facilitate future meta-analyses and development of theory.
Data Availability Statement
All datasets generated for this study are included in the article/Supplementary Material.
Author Contributions
YM and AH contributed to model formulation and interpretation. YM wrote the code and carried out simulations, collated the data for Tables S1, S2 and drafted the manuscript with input from AH. AH collated the data for Table S3.
Funding
YM was supported by an NSERC Discovery Grant. AH was supported by a project grant (2016-03625) and a Linnaeus grant (349-2007-8690) from the Swedish Research Council.
Conflict of Interest
The authors declare that the research was conducted in the absence of any commercial or financial relationships that could be construed as a potential conflict of interest.
Acknowledgments
We acknowledge helpful advice on source information from C. G. Guglielmo.
Supplementary Material
The Supplementary Material for this article can be found online at: https://www.frontiersin.org/articles/10.3389/fevo.2019.00492/full#supplementary-material
References
Abrams, P. A., Leimar, O., Nylin, S., and Wiklund, C. (1996). The effect of flexible growth rates on optimal sizes and development times in a seasonal environment. Am. Nat. 147, 381–395. doi: 10.1086/285857
Ahola, M., Laaksonen, T., Sippola, K., Eeva, T., Rainio, K., and Lehikoinen, A. (2004). Variation in climate warming along the migration route uncouples arrival and breeding dates. Glob. Chang. Biol. 10, 1610–1617. doi: 10.1111/j.1365-2486.2004.00823.x
Alatalo, R. V., Gustafsson, L., and Lundberg, A. (1984). Why do young passerine birds have shorter wings than older birds? Ibis 126, 410–415. doi: 10.1111/j.1474-919X.1984.tb00264.x
Alerstam, T. (2011). Optimal bird migration revisited. J. Ornithol. 152(Suppl. 1), 5–23. doi: 10.1007/s10336-011-0694-1
Alerstam, T., and Lindström, A. (1990). “Optimal bird migration: the relative importance of time, energy, and safety,” in Bird Migration: Physiology and Ecophysiology, ed E. Gwinner (Berlin: Spring-Verlag), 331–351. doi: 10.1007/978-3-642-74542-3_22
Anderson, A. M., Friis, C., Gratto-Trevor, C. L., Morrison, R. I. G., Smith, P. A., and Nol, E. (2019). Consistent declines in wing lengths of calidridine sandpipers suggest a rapid morphometric response to environmental change. PLoS ONE 14:e0213930. doi: 10.1371/journal.pone.0213930
Bell, C. P. (1997). Leap-frog migration in the fox sparrow: minimizing the cost of spring migration. Condor 99, 470–477. doi: 10.2307/1369953
Bernatchez, L., and Dodson, J. J. (1987). Relationship between bioenergetics and behavior in anadromous fish migration. Can. J. Fish. Aquat. Sci. 44, 399–407. doi: 10.1139/f87-049
Both, C., Bijlsma, R., and Visser, M. E. (2005). Climatic effects on timing of spring migration and breeding in a long-distance migrant, the pied flycatcher Ficedula hypoleuca. J. Avian Biol. 36, 368–373. doi: 10.1111/j.0908-8857.2005.03484.x
Both, C., and te Marvelde, L. (2007). Climate change and timing of avian breeding and migration throughout Europe. Clim. Res. 35, 93–105. doi: 10.3354/cr00716
Briedis, M., Bauer, S., Adamík, P., Alves, J. A., Costa, J. S., Emmenegger, T., et al. (2019). A full annual perspective on sex-biased migration timing in long-distance migratory birds. Proc. Royal Soc. B 286:20182821. doi: 10.1098/rspb.2018.2821
Briedis, M., Hahn, S., and Adamík, P. (2017). Cold spell en route delays spring arrival and decreases apparent survival in a long-distance migratory songbird. BMC Ecol. 17:11. doi: 10.1186/s12898-017-0121-4
Bruderer, B., and Boldt, A. (2001). Flight characteristics of birds: I. radar measurements of speeds. Ibis 143, 178–204. doi: 10.1111/j.1474-919X.2001.tb04475.x
Conklin, J. R., Battley, P. F., Potter, M. A., and Fox, J. W. (2010). Breeding latitude drives individual schedules in a trans-hemispheric migrant bird. Nat. Commun. 1:67. doi: 10.1038/ncomms1072
Conway, C. J., and Eddleman, W. R. (1994). Evaluation of lipid indices of the wood thrush. Condor 96, 783–790. doi: 10.2307/1369481
Coppack, T., and Pulido, F. (2009). Proximate control and adaptive potential of protandrous migration in birds. Integr. Comp. Biol. 49, 493–506. doi: 10.1093/icb/icp029
Desrochers, A. (2010). Morphological response of songbirds to 100 years of landscape change in North America. Ecology 91, 1577–1582. doi: 10.1890/09-2202.1
Ewert, D. N., Hall, K. R., Wunderle, J. M. Jr., Currie, D., Rockwell, S. M., Johnson, S. B., et al. (2012). Duration and rate of spring migration of Kirtland's warblers. Wilson J. Ornithol. 124, 9–14. doi: 10.1676/11-073.1
Fernández-Juricic, E., Blumstein, D. T., Abrica, G., Manriquez, L., Bandy Adams, L., Adams, R., et al. (2006). Relationships of anti-predator escape and post-escape responses with body mass and morphology: a comparative avian study. Evol. Ecol. Res. 8, 731–752.
Gerson, A. R., and Guglielmo, C. G. (2011). Endurance flight at low ambient humidity increases protein catabolism in migratory birds. Science 333, 1434–1436. doi: 10.1126/science.1210449
Gow, E. A., Burke, L., Winkler, D. W., Knight, S. M., Bradley, D. W., Clark, R. G., et al. (2019). A range-wide domino effect and resetting of the annual cycle in a migratory songbird. Proc. Royal Soc. B 286:20181916. doi: 10.1098/rspb.2018.1916
Guglielmo, C. G., Gerson, A. R., Price, E. R., and Hays, Q. R. (2017). The effects of dietary macronutrients on flight ability, energetics, and fuel metabolism of yellow-rumped warblers Setophaga coronata. J. Avian Biol. 48, 133–148. doi: 10.1111/jav.01351
Haest, B., Hüppop, O., and Bairlein, F. (2018). The influence of weather on avian spring migration phenology: what, where and when? Glob. Chang. Biol. 24, 5769–5788. doi: 10.1111/gcb.14450
Hedenström, A. (1989). Which wing-index should be used? Ibis 131:154. doi: 10.1111/j.1474-919X.1989.tb02754.x
Hedenström, A., and Alerstam, T. (1995). Optimal flight speed of birds. Philos. Trans. Royal Soc. Lond. B 348, 471–487. doi: 10.1098/rstb.1995.0082
Hedenström, A., and Alerstam, T. (1997). Optimum fuel loads in migratory birds: distinguishing between time and energy minimization. J. Theor. Biol. 189, 227–234. doi: 10.1006/jtbi.1997.0505
Hedenström, A., and Alerstam, T. (1998). How fast can birds migrate? J. Avian Biol. 29, 424–432. doi: 10.2307/3677161
Hedenström, A., Barta, Z., Helm, B., Houston, A. I., McNamara, J. M., and Jonzén, N. (2007). Migration speed and scheduling of annual events by migrating birds in relation to climate change. Clim. Res. 35, 79–91. doi: 10.3354/cr00715
Hedenström, A., and Møller, A. P. (1992). Morphological adaptations to song flight in passerine birds: a comparative study. Proc. Royal Soc. B 247, 183–187. doi: 10.1098/rspb.1992.0026
Hodgson, S., and Quinn, T. P. (2002). The timing of adult sockeye salmon migration into fresh water: adaptations by populations to prevailing thermal regimes. Can. J. Zool. 80, 542–555. doi: 10.1139/z02-030
Jetz, W., Thomas, G. H., Joy, J. B., Hartmann, K., and Mooers, A. O. (2014). The global diversity of birds in space and time. Nature 491, 444–448. doi: 10.1038/nature11631
Jonzén, N., Hedenström, A., and Lundberg, P. (2007). Climate change and the optimal arrival of migratory birds. Proc. Royal Soc. B 274, 269–274. doi: 10.1098/rspb.2006.3719
Kipp, F. (1958). Zur geschichte des vogelzuges auf der grundlag eder flügelanpassungen. Vogelwarte 19, 233–242.
Knudsen, E., Lindén, A., Both, C., Jonzén, N., Pulido, F., and Saino, N. (2011). Challenging claims in the study of migratory birds and climate change. Biol. Rev. 86, 928–946. doi: 10.1111/j.1469-185X.2011.00179.x
Kokko, H., Gunnarsson, T. G., Morrell, L. J., and Gill, J. A. (2006). Why do female migratory birds arrive later than males? J. Anim. Ecol. 75, 1293–1303. doi: 10.1111/j.1365-2656.2006.01151.x
La Sorte, F. A., Fink, D., Hochachka, W. M., DeLong, J. P., and Kelling, S. (2013). Population-level scaling of avian migration speed with body size and migration distance for powered fliers. Ecology 94, 1839–1847. doi: 10.1890/12-1768.1
Lank, D. B., Xu, C., Harrington, B. A., Morrison, R. I. G., Gratto-Trevor, C. L., Hicklin, P. W., et al. (2017). Long-term continental changes in wing length, but not bill length, of a long-distance migratory shorebird. Ecol. Evol. 7, 3243–3256. doi: 10.1002/ece3.2898
Lindström, Å. (1991). Maximum fat deposition rates in migrating birds. Ornis Scand. 22, 12–19. doi: 10.2307/3676616
Lindström, Å., Alerstam, T., and Hedenström, A. (2019). Faster fuelling is the key to faster migration. Nat. Clim. Chang. 9, 288–289. doi: 10.1038/s41558-019-0443-7
Marchetti, K., Price, T., and Richman, A. (1995). Correlates of wing morphology with foraging behaviour and migration distance in the genus Phylloscopus. J. Avian Biol. 26, 177–181. doi: 10.2307/3677316
Marra, P. P., Francis, C. M., Mulvihill, R. S., and Moore, F. R. (2005). The influence of climate on the timing and rate of spring bird migration. Oecologia 142, 307–315. doi: 10.1007/s00442-004-1725-x
Marra, P. P., Hobson, K. A., and Holmes, R. T. (1998). Linking winter and summer events in a migratory bird by using stable-carbon isotopes. Science 282, 1884–1886. doi: 10.1126/science.282.5395.1884
McCabe, B. J., and Guglielmo, C. G. (2019). Migration takes extra guts for juvenile songbirds: energetics and digestive physiology during the first journey. Front. Ecol. Evol. 7:381. doi: 10.3389/fevo.2019.00381
McKinnon, E. A., Fraser, K. C., Stanley, C. Q., and Stutchbury, B. J. (2014). Tracking from the tropics reveals behaviour of juvenile songbirds on their first spring migration. PLoS ONE 9:e105605. doi: 10.1371/journal.pone.0105605
Mitchell, G. W., Woodworth, B. K., Taylor, P. D., and Norris, D. R. (2015). Automated telemetry reveals age specific differences in flight duration and speed are driven by wind conditions in a migratory songbird. Mov. Ecol. 3:19. doi: 10.1186/s40462-015-0046-5
Mönkkönen, M. (1995). Do migrant birds have more pointed wings?: a comparative study. Evol. Ecol. 9, 520–528. doi: 10.1007/BF01237833
Moore, F. R., and Kerlinger, P. (1987). Stopover and fat deposition by North American wood-warblers (Parulinae) following spring migration over the Gulf of Mexico. Oecologia 74, 47–54. doi: 10.1007/BF00377344
Morbey, Y. E., Coppack, T., and Pulido, F. (2012). Adaptive hypotheses for protandry in arrival to breeding areas: a review of models and empirical tests. J. Ornithol. 153(Suppl. 1), 207–215. doi: 10.1007/s10336-012-0854-y
Morbey, Y. E., Guglielmo, C. G., Taylor, P., Maggini, I., Deakin, J., Mackenzie, S. A., et al. (2018). Evaluation of sex differences in the stopover behavior and postdeparture movements of wood-warblers. Behav. Ecol. 29, 117–127. doi: 10.1093/beheco/arx123
Norberg, R. Å. (1981). Optimal flight speed in birds when feeding young. J. Anim. Ecol. 50, 473–477. doi: 10.2307/4068
Orme, D., Freckleton, R., Thomas, G., Petzoldt, T., Fritz, S., Isaac, N., et al. (2018). Caper: Comparative Analyses Of Phylogenetics and Evolution in R. R package version 1.0.1. Available online at: https://CRAN.R-project.org/package=caper
Ouwehand, J., and Both, C. (2017). African departure rather than migration speed determines variation in spring arrival in pied flycatchers. J. Anim. Ecol. 86, 88–97. doi: 10.1111/1365-2656.12599
Pyle, P. (1997). Identification Guide to North American Birds, Part 1. Bolinas, CA: Slate Creek Press.
R Core Team (2018). R: A Language and Environment for Statistical Computing. Vienna: R Foundation for Statistical Computing.
Revell, L. J. (2012). phytools: an R package for phylogenetic comparative biology (and other things). Methods Ecol. Evol. 3, 217–223. doi: 10.1111/j.2041-210X.2011.00169.x
Schmaljohann, H. (2019). The start of migration correlates with arrival timing, and the total speed of migration increases with migration distance in migratory songbirds: a cross-continental analysis. Mov. Ecol. 7:25. doi: 10.1186/s40462-019-0169-1
Schmaljohann, H., and Eikenaar, C. (2017). How do energy stores and changes in these affect departure decisions by migratory birds? A critical view on stopover ecology studies and some future perspectives. J. Comp. Physiol. A 203, 411–429. doi: 10.1007/s00359-017-1166-8
Stewart, R. L. M., Francis, C. M., and Massey, C. (2002). Age-related differential timing of spring migration within sexes in passerines. Wilson Bull. 114, 264–271. doi: 10.1676/0043-5643(2002)114[0264:ARDTOS]2.0.CO;2
Swaddle, J. P., and Lockwood, R. (1998). Morphological adaptations to predation risk in passerines. J. Avian Biol. 29, 172–176. doi: 10.2307/3677195
Taylor, P. D., Mackenzie, S. A., Thurber, B. G., Calvert, A. M., Mills, A. M., McGuire, L. P., et al. (2011). Landscape movements of migratory birds and bats reveal an expanded scale of stopover. PLoS ONE 6:E27054. doi: 10.1371/journal.pone.0027054
Vágási, C. I., Pap, P. L., Vincze, O., Osváth, G., Erritzøe, J., and Møller, A. P. (2016). Morphological adaptations to migration in birds. Evol. Biol. 43, 48–59. doi: 10.1007/s11692-015-9349-0
Keywords: optimization model, migration timing, migration speed, phenological adaptation, Passeriformes
Citation: Morbey YE and Hedenström A (2020) Leave Earlier or Travel Faster? Optimal Mechanisms for Managing Arrival Time in Migratory Songbirds. Front. Ecol. Evol. 7:492. doi: 10.3389/fevo.2019.00492
Received: 05 September 2019; Accepted: 03 December 2019;
Published: 08 January 2020.
Edited by:
Alexei B. Ryabov, University of Oldenburg, GermanyReviewed by:
José F. Fontanari, University of São Paulo, BrazilHeiko Schmaljohann, University of Oldenburg, Germany
Copyright © 2020 Morbey and Hedenström. This is an open-access article distributed under the terms of the Creative Commons Attribution License (CC BY). The use, distribution or reproduction in other forums is permitted, provided the original author(s) and the copyright owner(s) are credited and that the original publication in this journal is cited, in accordance with accepted academic practice. No use, distribution or reproduction is permitted which does not comply with these terms.
*Correspondence: Yolanda E. Morbey, eW1vcmJleUB1d28uY2E=