 Lucas Sire1*
 Delphine Gey2Régis Debruyne2Thierry Noblecourt3Fabien Soldati3Thomas Barnouin3Guilhem Parmain4Christophe Bouget4Carlos Lopez-Vaamonde1,5
 Rodolphe Rougerie6
- 1Institut de Recherche sur la Biologie de l'Insecte, UMR 7261, CNRS Université de Tours, Tours, France
- 2Service de Systématique Moléculaire, UMS 2700 2AD, Muséum national d'Histoire naturelle, Paris, France
- 3Office National des Forêts, Laboratoire National d'Entomologie Forestière, Quillan, France
- 4IRSTEA, Nogent-sur-Vernisson, France
- 5INRA, UR0633 Zoologie Forestière, Orléans, France
- 6Institut de Systématique, Evolution, Biodiversité (ISYEB), Muséum national d'Histoire naturelle, CNRS, Sorbonne Université, EPHE, Université des Antilles, Paris, France
Saproxylic beetles are important bioindicators of forest health but their enormous diversity makes their identification challenging. As an example, the French fauna of saproxylic beetles alone contains 2,663 species in 72 families. Recently, DNA barcoding was proposed as a promising tool for the identification and monitoring of saproxylic beetle species. However, the rate of DNA barcode recovery from specimens of natural history collections using standard Sanger sequencing protocols remains low and challenges the construction of reference libraries. In this study, we test the potential of high-throughput sequencing (HTS) technology to reduce this shortfall by increasing sequencing success rate and lowering processing cost per specimen. Using a dual-indexing strategy for library construction and sequencing on the Illumina MiSeq platform, we successfully sequenced the DNA barcodes of 286 dry-pinned saproxylic beetles out of 521 specimens aged from 1 to 17 years and sampled in natural history collections. Age at sequencing did not affect sequence recovery and the success rate (54.9%) of our approach is comparable to that obtained using Sanger sequencing technology in another study targeting beetle specimens from natural history collections, but the cost per specimen is significantly reduced when using HTS. Finally, we shortly discuss how the newly produced DNA barcodes contribute to the existing library and we highlight a few interesting cases in which the new sequences question current species boundaries.
Introduction
The assessment and monitoring of biodiversity are fundamental tasks for conservation management and ecosystem preservation. Both suffer heavily from their strong reliance on a too scarce taxonomic knowledge (Giangrande, 2003) and on the general absence of comprehensive, inexpensive, and user-friendly tools for species identification. This is especially critical for insects (Green, 1998; Stork et al., 2015), which are massively impacted by environmental changes, with cascade effects on the functioning of ecosystems (Hallmann et al., 2017).
One recent methodological development that can reduce this shortfall in insect species identification is the use of a short and standardized DNA fragment, termed “DNA barcode” (Hebert et al., 2003a). This approach relies on the use of a 658 base pair (bp) fragment of the mitochondrial gene cytochrome c oxidase subunit 1 (COI) and on an online centralized database and workbench, the Barcode of Life Datasystems (BOLD) (Ratnasingham and Hebert, 2007, www.boldsystems.org) as a reference library ensuring the link between reference specimens identified by experts and these DNA barcode sequences. DNA barcoding is now a widely adopted tool for species delimitation and identification. As of today (10/09/2019) BOLD holds as many as 7480K DNA barcodes for 210K named species, and 645K BINs (Barcode Index Numbers, an automatic classification system of DNA barcode sequences that can be used as a proxy to species when records are unnamed; see Ratnasingham and Hebert, 2013). Such rapid—and ongoing—development has created a completely new and efficient access to taxonomic expertise for whoever can retrieve this short DNA snippet from specimens or their parts. Furthermore, it is now the ground for developing high-throughput approaches such as environmental sequencing or DNA metabarcoding (Deiner et al., 2017) that use new sequencing technologies to analyse tens to thousands of individuals and species simultaneously, thus opening new avenues in biodiversity assessments and monitoring (Yu et al., 2012; Ji et al., 2013).
Saproxylic beetles (i.e., “any beetle that depends, during some parts of its life cycle, upon wounded or decaying woody material from living, weakened, or dead trees”) (Stokland et al., 2012) are of major importance in forest ecosystem functioning. Indeed, they are prime actors in the early process of wood decay (Stokland et al., 2012). Furthermore, their response to changes in environmental variables make them suitable bio-indicators for shaping conservation and economic managements as well as monitoring health of forest environments (Janssen et al., 2017). In France, saproxylic beetles are highly diversified but well-studied and 2,663 species from 72 families are currently recorded (Bouget et al., 2019). Yet, their identification requires a high level of expertise, which is scarce or possibly missing for many families. DNA barcode reference libraries using traditional Sanger sequencing have been developed for European Coleoptera (Pentinsaari et al., 2014; Hendrich et al., 2015; Rougerie et al., 2015), covering more than 2,100 European saproxylic beetle species so far. These libraries revealed the general consistency between morphologically characterized species and DNA barcode clusters, as in other insect orders, and thus supported the relevance of this genetic marker for delimitating and identifying beetle species.
Access to natural history collection is critical for the assembly of DNA barcode libraries, because it allows processing specimens of species that are very difficult to re-collect (e.g., rare or extinct species or populations), and access to specimens that have been authoritatively identified and/or type material that can facilitate stronger links between barcodes and species names (Hausmann et al., 2016). However, for many collection samples nothing is known about the way insects were collected, killed and preserved, which can in turn have a significant negative effect on the generation of a DNA barcode sequence (Prosser et al., 2015). Indeed, success rate of DNA barcoding of saproxylic beetles from natural history collections is reportedly low (61%, see Rougerie et al., 2015) in spite of the use of failure tracking technique, targeting shorter DNA fragments to improve the rate of PCR amplification success. This relatively low success of sequence recovery represents a major hurdle to the use of DNA barcoding for identifying beetles and challenges the very construction of reference libraries. Nevertheless, the majority of failed amplified samples were either old collection individuals or belonging to specific families (Rougerie et al., 2015; see also Pentinsaari et al., 2014). These observations are in accordance with studies showing that some taxa may be hard to sequence due to primer mismatches (Piñol et al., 2015) or when sampled in natural history collections (Van Houdt et al., 2010). High-throughput sequencing (HTS) has been shown to be an alternative to improve the DNA barcoding success of such taxa (Shokralla et al., 2014). HTS technologies have emerged and considerably developed over the past two decades and their sequencing power and quality has increased inversely to sequencing cost (Liu et al., 2012; van Dijk et al., 2014). Yet, one major issue when targeting the full-length DNA barcode is the relatively short reads produced by most of the HTS technologies. This usually requires the need to amplify multiple overlapping fragments and to use dual-indexing approaches in the lab to multiplex different samples or amplicons per samples, as well as bioinformatic expertise to separate samples and assemble the produced reads into a single consensus (Fadrosh et al., 2014; Bourlat et al., 2016; Leray et al., 2016). On the other hand, because sequencing of degraded DNA requires the amplification of shorter amplicons, it seems appropriate to adapt and use HTS to process collection specimens toward sequencing of DNA barcodes.
Nevertheless, while HTS technologies are widely used in environmental genomic approaches like metabarcoding with complex samples (Oliverio et al., 2018; Barsoum et al., 2019; Thomsen and Sigsgaard, 2019), their implementation in conventional DNA barcoding of single individuals still lags behind, despite evidence of their potential at multiple levels (Shokralla et al., 2014, 2015; Cruaud et al., 2017; Fagan-jeffries et al., 2018; Wang et al., 2018).
Overall, the reference library for French saproxylic beetle fauna is still largely incomplete, with 1,535 species barcoded out of 2,663 species (58%) (Rougerie et al., 2015). The application of HTS could potentially accelerate the pace of assembly of this library at reduced cost. Here we use a slightly modified version of the approach proposed by Shokralla et al. (2015) targeting two short amplicons on Illumina MiSeq sequencing to generate DNA barcodes for individual collection specimens of saproxylic beetles. Our main aim was to extend the taxonomic and geographical coverage of the French saproxylic beetle DNA barcode library, while testing the benefits of using HTS technology when processing specimens whose DNA is expected to be degraded.
Materials and Methods
Specimen Sampling in Collections
We sampled dry-pinned specimens deposited at the national collection of forest insects held at the National Forest Office (ONF) in Quillan (Aude, France). Most samples lacked information on collecting methods and reagents used for preservation. We therefore selected specimens based only on their collection date, favoring those samples collected as recently as possible. Specimens belonged to species known to occur in France (http://saprox.mnhn.fr/) but not yet barcoded (Pentinsaari et al., 2014; Hendrich et al., 2015; Rougerie et al., 2015). We focused our sampling on species from the French Pyrenees where we are carrying out a metabarcoding analysis of forest biodiversity (CLIMTREE project). Tissue samples were placed in 96-well plates. For each individual, a midleg was sampled, except for Dorcatoma and Stagetus spp. for which an abdomen was taken after genitalia removal, due to the lack of significant diagnostic characters for taxonomic identification and the higher amount of tissue it provides. Sampling was done using sterilized forceps. Collecting data were compiled into a standard Darwin Code spreadsheet and vouchers were photographed using either a 14MP 1/2.3″ APTINA CMOS Sensor U3CMOS mounted on a stereomicroscope, or a Nikon D7200 with an AF-S DX NIKKOR 18-300MM F/3.5-5.6G ED VR Lens for the biggest individuals.
DNA Extraction and Illumina Library Preparation
DNA extraction of 521 individuals belonging to 343 species and 42 families sampled in six 96-well plates was carried out at the Service de Systématique Moléculaire (SSM) at the MNHN in Paris, using Macherey-Nagel NucleoSpin® 96 tissue kit following manufacturers protocol using either a semi-automated procedure with an Eppendorf Liquid Handling Workstation epMotion® 7075 VAC, or a manual approach through successive centrifugations.
To accommodate for the 658 bp length of the targeted DNA fragment and the limit in read length when using Illumina sequencing technology, we used internal primers to amplify two shorter amplicons here named B_R and C_F, of 325 and 418 bp in length, respectively; they encompass together the entire DNA barcode region with an 85 bp overlap (Figure 1). We carried out a dual indexing method similar to the one used in Shokralla et al. (2015) to permit de-multiplexing and assembly of the reads produced (Figure 1). Thus, 20 primer tags of 5 nucleotides were re-designed to remain unique after two potential nucleotide degenerations, containing all four nucleotides without more than two repetitions, and avoiding more than 3 identical successive nucleotides once added to the 5′ end of our primers. These primer tags were split in 2 sets of 10 each: AGTCT, ATTGC, ACGTC, ATGCG, AGATC, ATCTG, CATTG, CTAGG, CGGAT, CGTGA for forward primers and CTGTA, CGATT, TTGAC, TGGCA, TACAG, TGACG, TTCGA, TAGCC, TCGGA, TCTAG for reverse primers, respectively. Tagged-primers were synthetized in NGS grade with HPLC purification by Eurofins Genomics, 85560 Ebersberg, Germany.
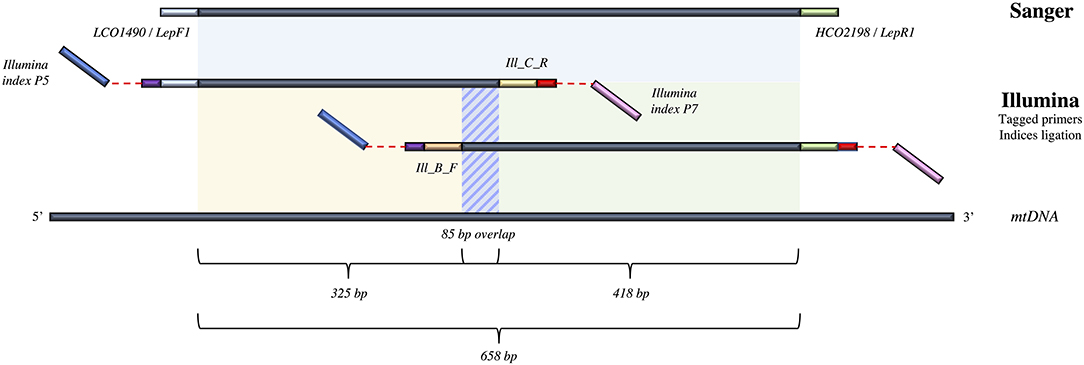
Figure 1. Details of the different COI amplicons targeted in the present study and their associated lengths and overlaps, as well as the primers and sequencing technologies used for each fragment. For the Illumina MiSeq approach, the dual-tagging process and ligation of the Illumina indices are represented.
The internal primers Ill_C_R (5′–GGIGGRTAIACIGTTCAICC–3′), and Ill_B_F (5′–CCIGAYATRGCITTYCCICG–3′) (Shokralla et al., 2015) were used in combination with Folmer et al. (1994) primers LCO1490 and HCO2198, respectively, to amplify the fragments B_R and C_F mentioned above independently. The use of Inosin nucleotide (I) allows a match with all four nucleotides more efficiently than with a four-fold degeneracy because of the reduction in concentration of each primer combination when using the latter option. Yet, due to (I) in our primers, we did not used a proof-reading polymerase to ensure avoiding synthesis bias (Knittel and Picard, 1993). PCR reactions were conducted separately in two plates (one for each amplicon) in 25 μL with 2.5 μL of 10X CoralLoad PCR buffer, 1 μL of 50X MgCl2 (50 mM), 0.5 μL of dNTPs (6.6 mM), 1 μL of each primer (10 mM), 0.5 μL of DNA Taq Polymerase (5 U/μL) from Qiagen, 2 μL of DNA template and the final 17.5 μL in extra pure water. PCR started with initial denaturation at 95°C for 5 min, 35 cycles of 94°C for 40 s, 51°C for 1 min, 72°C for 30 s, and final elongation at 72°C for 5 min.
For each sample plate, the two independent plates of PCR products obtained, corresponding, respectively, to amplicons B_R and F_C, were pooled in 5 mL tubes before being processed through a second indexing step based on the protocol of Meyer and Kircher (2010). This started by a purification step of 400 μL of each pool of amplicons using NucleoMag 0.85X, then eluted in 50 μL TET buffer (0.1X), and followed by DNA quantification using Qubit® Broad Range. In contrast to Meyer and Kircher (2010), we performed a blunt-end repair using NEBNext End Repair Module before proceeding with a ligation step to attach Illumina adapters to our libraries and thus avoid an additional PCR step that may increase replication errors, especially when using a non-proofreading high-fidelity polymerase enzyme (Meyer et al., 2012; Leray et al., 2016; Chimeno et al., 2018). Approximately 500 ng of DNA were used with 5 μL of NEBNext Repair Reaction Buffer (10X) and 2.5 μL of NEBNext End Repair Enzyme Mix. Additional extra pure water was added to reach a 50 μL reaction volume, and the mix was incubated at 20°C for 30 min. A second purification step was carried out with NucleoMag 1X and an elution volume of 20 μL of TET buffer (0.1X). Adapter ligation was therefore performed in 40 μL by adding 10 μL extra pure water, 4 μL T' DNA ligase buffer (10X), 4 μL PEG-4000 (50%), 1 μL adapter mix (100 μM each), and T4 DNA ligase (5 U/μL) to the eluate, which was then incubated at 22°C for 30 min. A third purification with NucleoMag 1X was then performed in 20 μL of EBT buffer. To assess the success of the library preparation, we performed quantification using Qubit® High-Sensitivity kit and controlled products using migration on agarose gel of positive controls. The final PCR indexing enrichment was undertaken after different PCR trials to define the best number of cycles for each sample and starting DNA quantity. This final step was done in a 25 μL volume reaction, comprising 0.5 μL Qiagen Taq (5 U/μL), 2.5 μL of buffer Qiagen 10X, 0.2 μL of dNTPs (25 mM), 0.5 μL of IS4 primer (10 μM) and 50 ng of DNA template as well as 0.5 μL of indexing primer (10 μM) respective to each sample. PCR cycle was as follow: 94°C for 3 min, 7 cycles of 94°C for 30 s, 60°C for 30 s, and 72°C for 40 s, and final elongation at 72°C for 10 min. Final purification using NucleoMag 0.85X and eluted in 25 μL of EBT buffer was followed by quantification on Qubit® with High-Sensitivity well plate kit.
The six sample plates analyzed for the present study were processed along with 35 other plates from other projects and while our first indexing procedure (using dual tagged-primers) aims at demultiplexing reads per sample within each plate, the second step (by Illumina indices ligation) allows for demultiplexing reads by plate (Bourlat et al., 2016). The concentrations of the libraries corresponding to each plate were homogenized before pooling to obtain a fair balance of sequencing reads between the plates processed and according to their contents. Altogether, the six plates analyzed represented 5.6% in concentration of our pooled library, which was sequenced using a 600 cycles v3 kit (2 × 300 bp, paired-end sequencing) on an Illumina MiSeq at the CIRAD-AGAP sequencing platform in Montpellier, France.
Sanger Sequencing
We tried to amplify all 521 samples targeting the full-length DNA barcode for Sanger sequencing to compare with sequence quality of Illumina MiSeq reads. PCR amplifications were done in 20 μL with 2 μL of 10X CoralLoad PCR buffer, 2 μL of dNTP (6.6 mM), 0.6 μL of each primer (10 mM), 0.2 μL of DNA Taq Polymerase (5 U/μL) from Qiagen, 3 μL of DNA template and 12.2 μL of extra pure water. A primer cocktail named C_LepFol (Hernández-Triana et al., 2014) containing Folmer primers (Folmer et al., 1994) LCO1490 (5′–GGTCAACAAATCATAAAGATATTGG–3′)/HCO2198 (5′–TAAACTTCAGGGTGACCAAAAAATCA–3′) and primers LepF1 (5′–ATTCAACCAATCATAAAGATATTGG–3′)/LepR1 (5′–TAAACTTCTGGATGTCCAAAAAATCA–3′) (Hebert et al., 2004) was used to target and amplify a 658 bp part of the mitochondrial gene cytochrome oxidase subunit 1 (COI) (Figure 1). PCR conditions were 94°C during 5 min, followed by 35 cycles of 94°C during 30 s, 54°C for 40 s, and 72°C for 1 min, with a final 10 min extension at 72°C. PCR products were deposited on 2% agarose gel and only successfully amplified DNA templates where sent for Sanger sequencing on ABI 3730XL sequencer at Eurofins MWG Operon sequencing facilities (Ebersberg, Germany).
Demultiplexing and Sequence Analyses
Demultiplexing was done using customized workflows in Geneious V11.0.4 (Kearse et al., 2012). Reads were separated by primer tags with a maximum of one mismatch and a minimum of 2 reads per tag. Primers were trimmed and reads were aligned together with MUSCLE 3.8.425 using eight iterations. The two amplicons B_R and C_F were merged together by De Novo Assembly with four maximum ambiguities and two base pairs gap sizes over the 85 bp overlapping region, and the consensus was then saved in separate folders mirroring wells of sample plates for further curation of the sequences. To do so, we blasted each consensus against all barcode records on BOLD and NCBI. Prior morphological identification established by experts in the collection was used to control the blast results to species or to genus level, depending on the availability of DNA barcodes for closely related species. In case of multiple plausible consensus, the potential presence of identical sequences was checked in other samples from the same plate with particular focus on adjacent wells to assess for potential widespread cross-contaminations. In these cases, we also excluded potential pseudogenes by searching for STOP codons or indels, and we investigated possible chimeric sequences (from tag-jumping or incorrect amplicon assembly) through independent identification of both B_R and C_F fragments. The identification was also critically revised by experts through reexamination of voucher specimens, considering the different potential molecular identifications and taking into account existing synonymy, biogeography of sister taxa as well as intra- and interspecific genetic distances to establish the genuine consensus. When discrimination of this genuine sequence was impossible, sequences were discarded.
Sanger electropherograms for both directions and fragments were assembled to form contigs using Geneious V11.0.4 (Kearse et al., 2012), then aligned and visually checked for quality and noise to resolve some of the ambiguities. For each sample, we ensured no pseudogene presence similarly than with HTS sequences, and we checked for potential cross-contamination by blasting sequences on BOLD to test similarity with conspecific and congeneric existing records. Low quality electropherograms (potentially due to low DNA concentration, DNA degradation or contaminants) were discarded.
Sequence analyses across individuals were performed with analytical tools integrated in BOLD's workbench (Ratnasingham and Hebert, 2007) using BOLD aligner and Kimura-2 Parameter (K2P) (Kimura, 1980) correction method to compute genetic distances and Neighbor Joining (NJ) trees (Saitou and Nei, 1987). The complete workflow of the study is pictured in Figure 2. To compare DNA barcodes produced with Illumina and with Sanger, we built a NJ tree combining the consensus sequences recovered from both technologies using Geneious V11.0.4 (Kearse et al., 2012) following Tamura-Nei genetic distance model (Tamura and Nei, 1993), with 1,000 non-parametric bootstrap replications (Supplementary Material 2).
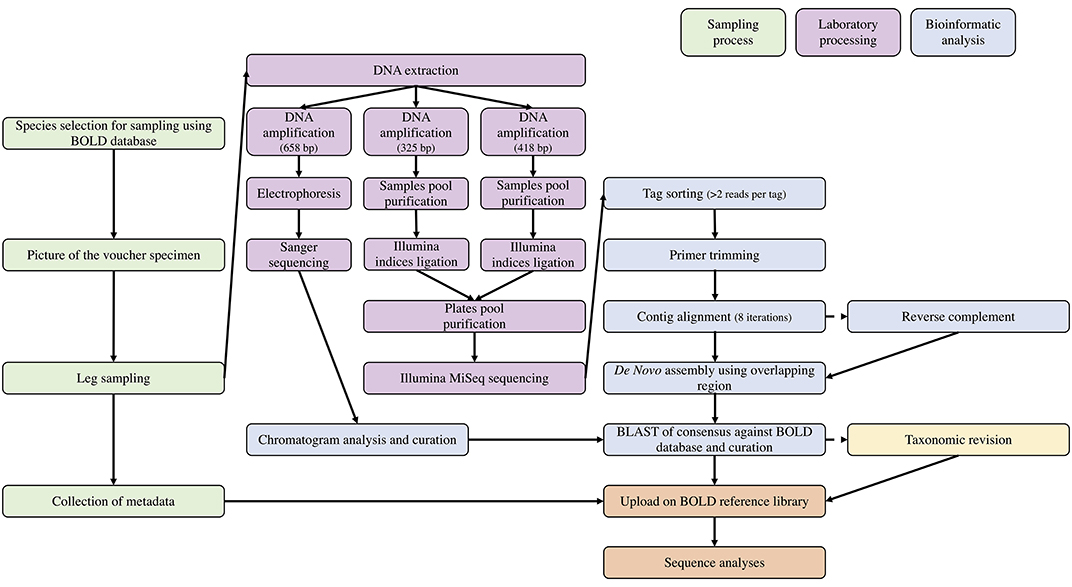
Figure 2. Workflow used in this study for sampling preparation, laboratory processing, and bio-informatic analyses.
Specimens were grouped in different categories according to their age at sequencing to test its effect on sequencing success. Ratio of sequencing success (successfully sequenced individuals divided by the total number of individuals sequenced) was plotted against age at sequencing for the following age categories: 1 year (N = 86), 2 years (N = 61), 3 years (N = 39), 4 years (N = 41), 5 years (N = 61), 6 years (N = 49), 7 years (N = 72), 8 years (N = 60), 9 years (N = 30), 10 years, and more (N = 22). We used R V3.6.1 (R Core Team, 2017) to run a non-parametric Spearman correlation analysis as outcome variables do not follow a normal distribution (cor.test, method = “spearman”).
Genetic Analyses
To analyse the genetic distances between our newly generated sequences, we mined data of matching species or genus from existing French, German, and Finnish reference libraries (Pentinsaari et al., 2014; Hendrich et al., 2015; Rougerie et al., 2015). This joined dataset of 1,920 sequences and 490 species is available at dx.doi.org/10.5883/DS-COLSAPRO. The taxonomic tree for the total dataset is provided in Supplementary Material 3.
Results
DNA Barcoding of Saproxylic Beetles With MiSeq
The HTS library we constructed for our 521 sampled individuals representing 343 different species in 39 different families produced an average of 173,664 paired-end reads per pooled plates (sd = 50 083; min. = 97 706 reads; max. = 248 324 reads) with a sequencing depth of around 450X per sample. We recovered 286 partial or complete DNA barcodes (i.e., 54.9% of all samples) representing 193 species (56.3% of all species analyzed). The consensus sequences produced were of high-quality with very few ambiguous base-calls (<1% N, except one sequence with <2% N). Sequence length varied with the amplification success of both or either one of the two fragments amplified: we recovered 147 full length DNA barcodes (658 bp), as well as 140 and 19 partial DNA barcodes from the C_F (418 bp) and B_R (325 bp) fragments, respectively.
All records (including failed samples) are publicly available in project PSFOR on BOLD, and all sequenced individuals can be found in dataset dx.doi.org/10.5883/DS-NEWCOLEO and in the Table in Supplementary Material 1.
Using the C_LepFol primers targeting the full-length DNA barcode, 170 (32.63%) samples produced visible PCR products on agarose gels and were sent for sequencing with Sanger technology. Eventually, 115 specimens (22.1% of the 521 samples) yielded long and high-quality sequences (mean length = 655.5; sd = 12.7; <1% N), of which 104 (90%) had also been successfully sequenced using the HTS approach. Overall, the quality of Sanger sequences is higher with only 3 ambiguous bases over 115 sequences (0.026 N per sequence), while consensus sequences from Illumina MiSeq reads include a total of 61 ambiguities distributed among the 286 DNA barcodes recovered (0.213 N per sequence) (Table 1). However, a neighbor-joining analysis (Supplementary Material 2) showed a near perfect match between DNA barcode sequences obtained using both sequencing technologies for the same individuals.
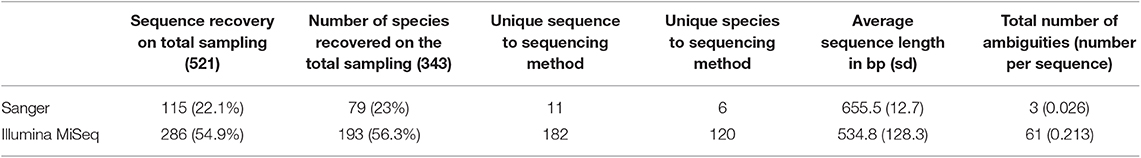
Table 1. Summary of the sequencing results for the two sequencing technologies.
For the 286 sequences recovered, the correlation test indicates no significant effect of specimen age on the sequencing ratio success (S = 264, p = 0.07312, rho = −0.6); age of specimens at time of sequencing seems not to influence sequencing success.
Reliability and By-Products of Illumina MiSeq DNA Barcodes
Multiple contigs were often retrieved from Illumina sequencing. Across all the samples processed, the mean number of contigs per sample after demultiplexing in Geneious was 9, ranging from no sequence recovery to a maximum of 196 contigs for one sample. High discrepancies in sequence number were also observed varying from 1 read per contig to thousands, but generally tended to be in low proportion for by-products compared to the barcode of interest. These different contigs were either lower quality reads clustered apart, chimeras, contaminations, potential heteroplasmy, or bacterial sequences. Our samples being degraded and collected within working collections, where specimens are handled on a regular basis, many co-amplified human DNA or other contaminants from fresh organisms processed in the lab at the same time were found. We took care that no other insect experiment was being conducted during our wet-lab processing to avoid potential misleading contamination. Overall, we identified what we considered to be the genuine consensus sequence by first looking into the ones with the greater number of reads and by blasting these against BOLD or NCBI. In addition to the recovered DNA barcodes, we also recovered consensus sequences of by-products potentially interesting for other studies. Indeed, out of 286 specimens successfully yielding a DNA barcode, we identified sequences of Rickettsia sp. and Wolbachia sp. in 11 and 5 samples, respectively (with one specimen showing co-occurrence of both; see Table in Supplementary Material 4).
Genetic Distance Analyses
Overall, we produced 297 new DNA barcodes, of which 180 are full-length (658 bp). From this, 286 were sequenced using our HTS approach, 104 with both HTS and Sanger sequencing, and 11 only with Sanger sequencing after amplification of the full-length DNA barcode fragment. These DNA barcodes represent 199 different species (58% of the species processed), of which 103 are new additions to the reference library for French saproxylic beetles; these new sequences also represent 82 new BINS for BOLD.
The genetic analysis of these 297 newly generated barcodes along with the 1,623 sequences mined from BOLD shows that the means of within-species and within-genus distances are 1.11 and 13.62%, respectively. Within species, genetic distance ranges from 0 to 18.70% whereas we observed 0% to >30.41% within genus (Table 2). The frequency distributions of within-species and within-genus distances we observed are consistent with previous results reported in beetles (Hebert et al., 2003b), showing a clear discontinuity in these distributions that form a “barcode gap” near 2% and showing an overall interspecific divergence comprised between 8 and 32% within genera. Our results also highlighted the overall reliability of shorter DNA barcodes to discriminate genera and species (Hajibabaei et al., 2006; Zuccon et al., 2012; Lanner et al., 2019).
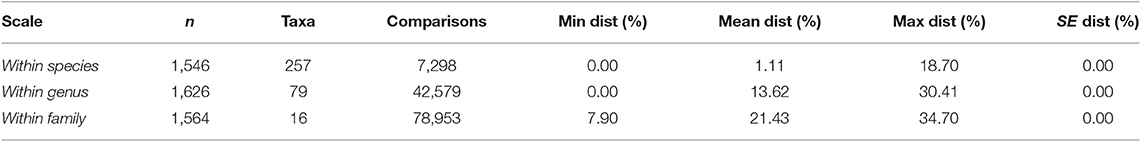
Table 2. Summary of the genetic distances calculated for sequences with length >400 bp on BOLD with Kimura-2 Parameter and BOLD Aligner for the 297 newly sequenced individuals within the 1,920 sequences of the complete DNA barcode dataset combining our newly generated sequences and preexisting conspecific and congeneric records.
As a preliminary investigation of our results of genetic distance analyses, we sought for possible conflicts between current taxonomic identification and DNA barcoding by applying an arbitrary 2% threshold (Hebert et al., 2003b) to highlight cases, in newly sequenced species, of high intra-specific or low inter-specific divergence. Overall, 14 species displayed a maximum intra-specific distance >2% (Table 3) and 18 species had a minimum inter-specific distance <2% (Table 4).
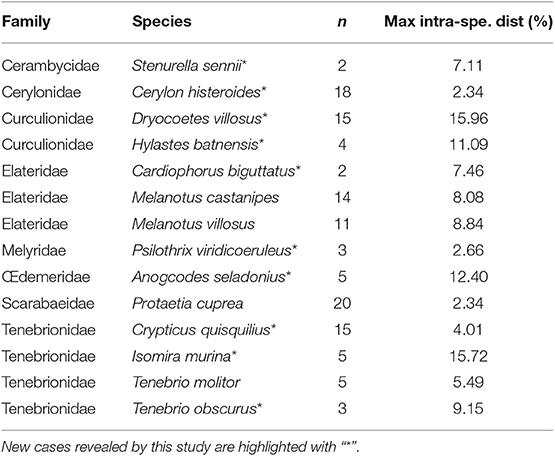
Table 3. List of newly sequenced species revealing a maximum intra-specific distance >2% using Kimura-2 Parameter, with n being the number of individuals (sequence length >400 bp, Bold Aligner alignment).
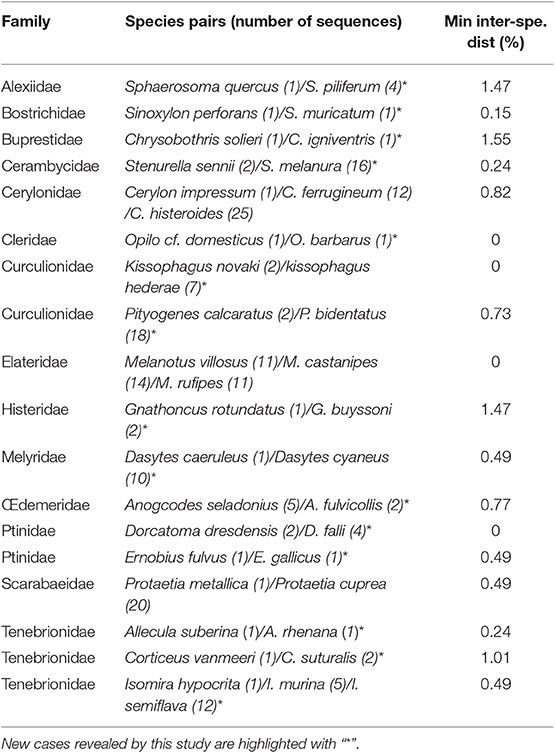
Table 4. List of newly sequenced species with a minimum inter-specific distance <2% using Kimura-2 Parameter, with (n) being the number of individuals (sequence length >400, Bold Aligner alignment).
Discussion
HTS Sequencing of DNA Barcodes From Collection Specimens of Saproxylic Beetles
Our recovery of DNA barcode sequences with Illumina MiSeq is relatively low (55%) though comparable to that reported in Rougerie et al. (2015) using Sanger sequencing and a similar PCR strategy including failure tracking with internal primers (61%). Other studies showed higher sequencing success but used fresh specimens collected specifically for DNA barcoding (Hendrich et al., 2015: 67%; Pentinsaari et al., 2014: 90%).
Sequencing results could vary with preservation, collection methods and age, as well as taxonomically biased primer amplification (Elbrecht and Leese, 2015). Although information about collecting methods was missing for most of our samples, these are known to result mostly from the use of traps that are not adequate for the preservation of DNA. These stay in place in the field for weeks and use non-toxic chemicals such as monopropylene glycol or soap to prevent evaporation and ensure the preservation of specimens. Our analyses show that specimen age at sequencing has no effect on sequence recovery, as opposed to the results reported in collections of Lepidoptera (Hebert et al., 2013) where age appears to be the main determinant of sequencing success. Here, although age certainly remains important, confounding factors linked to collecting and preservation methods might also strongly affect the success of our amplification attempts, despite the use of internal primers. Although we cannot directly measure from our results the possible difference in sequencing success rate using HTS and Sanger technology, as we did not attempt to amplify and sequence the B_F anc C_R fragments with Sanger, there seem to be no significant difference between the two approaches. In particular, we did not observe the increase in success that we had expected considering the high sensitivity of Illumina sequencing and the ability to handle co-amplifications when analyzing HTS reads, whereas these jeopardize the use of the electropherograms produced with Sanger. Nonetheless, it is interesting that HTS produces multiple products, even in low abundance, that can permit detection and documentation of potential heteroplasmy, pseudogenes or, as exemplified in our dataset, of Rickettsia and Wolbachia infections (Shokralla et al., 2014; Lanner et al., 2019). Our sequencing depth and read quality did not allow us to have enough information to confirm the occurrence of heteroplasmy in our samples. Nevertheless, these non-targeted co-amplifications allowed us to confirm the presence of endosymbionts in some species (see Table in Supplementary Material 4) and suspect potential heteroplasmy.
Applicability and Laboratory Costs
Our recovery rate with HTS is not higher than Rougerie et al. (2015) but the costs are lower. Indeed, our current cost per sample of the Illumina approach we used here—in the molecular facilities at MNHN, from DNA extraction to sequencing, excluding labor—is 4 € per sample, of which we estimate sequencing cost to represent 0.5 € per sample. In comparison, the current cost of bidirectional sequencing using Sanger on a 96-well plate is 4.5 € per sample, meaning that the cost per sample would be 8 € if targeting a single amplicon, or 12.5 € if targeting two shorter, overlapping amplicons as was the case here when processing degraded DNA from collection specimens.
Here, we used a dual-tagging approach instead of a twin-tagging approach as it is advantageous in terms of costs (10-fold less in primers' synthesis costs) but can artificially increase the number of chimeras by tag-jumping during sequencing (Schnell et al., 2015), hence reducing the success of true barcode sequence recovery and increasing the time needed to demultiplex reads. However, both technological developments (e.g., all-in-one library preparation kits) and development of user-friendly bioinformatics tools (Blankenberg et al., 2010; Kearse et al., 2012; Dufresne, 2017) are expected to streamline this process in the future, thus empowering the potential for high-throughput, fast and affordable sequencing of DNA barcodes (Porter and Hajibabaei, 2018). Whereas, the sequencing cost of our approach itself will remain constant while increasing the number of samples processed, the overall cost of the Illumina library preparation could significantly be reduced by optimizing the cost of its multiple steps (e.g., home-made protocols and reagents instead of commercial kits, reduction of PCR volumes through the shift to 384-well plates, automation of purification steps, etc.) (Shokralla et al., 2015; Meier et al., 2016; Wang et al., 2018). Furthermore, this methodology can be applied to various taxa, from both newly collected samples and collection specimens, and allows processing of a large number of samples for a reduced cost.
Quality of HTS Sequences
From a sequence quality point of view, Sanger sequencing is still considered the gold-standard. Hebert et al. (2018) recently emphasized the high-throughput potential of the Sequel sequencing platform from Pacific Biosciences that can generate tens of thousands of full-length DNA barcodes per run from freshly collected samples with low levels of sequencing errors. They showed that sequences resulting from Sequel where largely identical to the ones retrieved with Sanger. Here, we show similar results with our Illumina MiSeq approach (Supplementary Material 2). Our recovered DNA barcodes were sometimes shorter than the standard DNA barcode (658 bp length), yet were still consistently useful for species discrimination (Hajibabaei et al., 2006; Lanner et al., 2019). One pitfall of sequencing DNA barcodes with Illumina MiSeq is dealing with multiple amplifications and the possibly resulting ambiguities in assembled consensus sequences. Yet, even though the overall quality of our Illumina produced sequences seems lower than with Sanger sequencing, the quality of each sequence independently remains similar and high (with <1% N) for all but one sequence. Furthermore, it has recently been shown by Lanner et al. (2019) that read quality from Illumina MiSeq sequencing was in fact equivalent to Sanger, and that drops in quality were mostly due to contamination and co-amplification, detectable with Illumina but less with Sanger. This is consistent with our results where we sometimes had very low number of different reads, artificially increasing the number of ambiguities. We explain it in two ways: first, we sampled specimens in daily-handled collections and captured with unknown killing and preservative reagents, making them more prone to both DNA degradation and environmental contaminations. Second, the use of dual-tagging approach can potentially increase the number of contigs by tag-jumping (Schnell et al., 2015) and therefore reduce the sequencing depth available for the true sequence of our samples. Both issues can blur the genuine signal of consensus sequences, resulting in a higher frequency of ambiguities.
DNA Barcode Reference Libraries of Saproxylic Beetles and Integrative Taxonomy
French Fauna of saproxylic beetles is already relatively well-known and described (Bouget et al., 2019). Overall, our results support previous findings that intra-/interspecific genetic distances derived from DNA barcode analyses do fit species defined on the basis of morphological expertise in most cases. However, we still have identified 14 cases of deep splits (species with high intraspecific divergence) and 18 species pairs that share DNA barcodes (see Tables 3, 4, respectively). As erroneous identifications and synonymies can explain discrepancies between DNA barcoding results and proposed taxonomic names (Mutanen et al., 2016), we reviewed potential synonymies and TN, FS, TB, and GP re-validated together taxonomical identifications from original vouchered specimens for each conflicting result to correct potential errors. The cases mentioned in Tables 3, 4 are the result of this integrative dialogue that helped reducing and understand observed discrepancies.
In cases of high intra-specific divergence (Table 3), our data reinforce the taxonomic uncertainty already highlighted by Rougerie et al. (2015) in the Melanotus villosus/M. villosus var. aspericollis pair, where the morphological “variety” aspericollis consistently and greatly (ca. 5%) differ genetically from M. villosus. These results suggest a potential need for revising the status of M. villosus var. aspericollis as a distinct species. Regarding Cardiophorus biguttatus, this taxon is known to be highly polymorphic and the observed genetic divergences may match different recognized “varieties” of the species that could also deserve distinct specific status. This divergence may also represent geographical structure among populations as the only two specimens sequenced so far come from different areas in France [Pyrénées-Orientales (66) and Var (83) administrative departments] with potential geographical barriers and thus low gene flow between populations. Cases where geographical structure might be driving intraspecific variability may occur within other species, as in the Psilothrix viridicoeruleus cluster, or within the newly sequenced group of Tenebrio obscurus, as one specimen comes from Romania, another from the Provence region in France and the last one from Corsica island. A case of high intra-specific divergence involving island context is also reported within the Dryocoetes villosus complex. Interestingly, we can see that the three newly sequenced individuals from Sainte Marguerite Island in France are highly divergent (over 15%) from their continental counterparts that themselves display low divergence among them (maximum divergence of 0.93%) and are represented by 12 individuals from Germany, Finland and France. Overall, we reveal here several new cases of high genetic divergences within species that may result from incomplete lineage sorting, phylogeographical structure, or represent cases of overlooked cryptic species. Thus, further sampling and analyses are desirable to shed light on these deep split cases. Presence of Wolbachia is also known to affect reproductive success and mitochondrial inheritance within the host. Even though Wolbachia infection seems not to affect DNA barcoding identification in insects in general (Smith et al., 2012), its potentiality to inflate mitochondrial divergence across populations should be kept in mind (Smith and Fisher, 2009). Nevertheless, our primers were not designed for this purpose, preventing us to shed further light on potential infections.
With respect to cases of low interspecific divergence (Table 4), the higher number of reported cases is actually an artifact of discrepancies in the curation of taxon names in databases. For instance, the absence of divergence between the two specimens of Dorcatoma dresdensis from France and the four specimens of Dorcatoma falli from Germany results from misidentification of the later specimens. Indeed, D. falli is a North American species absent in Europe. Careful examination of the available pictures of voucher specimens of the German D. falli, confirmed that they indeed are misidentified individuals of D. dresdensis. The species complex Isomira murina, I. thoracica, I. hypocrita, and I. semiflava (see Supplementary Material 3) is another example where different species apparently share similar or highly similar DNA barcodes. Further investigation revealed that I. semiflava is in fact a recognized synonym of I. murina, but also that the German I. murina has been erroneously identified. After verification of the specimen habitus from the voucher picture (BOLD sample ID: GBOL02228), it actually appears to be I. thoracica, therefore explaining the high intraspecific variability among I. murina. Nonetheless, we could not explain the low divergence between I. murina and I. hypocrita, two species that are quite distinct both morphologically and geographically, and further studies must be undertaken to understand this result. In the complex of Protaetia cuprea—a well-studied European flower beetle taxon—P. metallica is a morphologically, geographically and biologically recognized distinct species (Tauzin, 2015). Here, we found however a low genetic divergence between P. metallica and other representatives of P. cuprea (different subspecies were sampled in this study: P. cuprea cuprea, P. cuprea olivacea, P cuprea bourgini), which is consistent with what was previously highlighted in Rougerie et al. (2015) and more recently in Vondráček et al. (2018) from both COI and CytB markers. The later authors actually questioned the specific status of P. metallica. These results may suggest a recent origin of these taxa, or ongoing hybridization and introgression, although experimental crossing attempts in captivity failed, suggesting the later to be unlikely (Tauzin, 2015).
Overall, our study expands the current coverage of the DNA barcode reference library for European saproxylic beetles by adding 297 newly sequenced records representing 199 species in 31 families, of which 103 species (82 new BINs) are new additions to the Barcode of Life Datasystems, 26 of which represent genera yet unrepresented in the libraries.
This generated DNA barcode dataset of well-curated and identified collection specimens will be helpful for fast and reliable taxonomical identification for potential mass-trapping and broad biomonitoring studies using genetic approaches. Saproxylic beetles are of major interest with respect to forest health concerns and the need for identification at species level is of great importance to link functional traits and ecological patterns (Gossner et al., 2013).
In total, adding these new sequences to the PASSIFOR dataset (Rougerie et al., 2015) (656 barcodes of 410 species), DNA barcodes reference library now covers 22.4% (598 species out of 2,663 species) of the French fauna of saproxylic beetles (Bouget et al., 2019). When considering records available in BOLD from other European countries, only 1,128 species remain to be barcoded. We created a checklist in BOLD that can be used both for taxonomical curation and tracking of the completeness of the reference library for French saproxylic beetle's fauna. Presently, the completeness of the DNA barcode reference library for the French saproxylic beetle fauna is of 57.6%.
Conclusion
Our results emphasize the interest and potential of using HTS technologies—here Illumina MiSeq—as a fast, reliable, and affordable approach to barcode collection specimens that may be challenging or costly to process. The Illumina MiSeq approach used here, despite a relatively low sequencing success, allowed to recover good quality sequences from collection specimens at a reasonable cost.
By adding new sequences of specimens from southern Europe, our study also helps to better assess the intra- and interspecific variability of saproxylic beetles. It also promotes collaboration between specialists to gather enough specimens for sequencing at reasonable costs, and integrative taxonomy to resolve taxonomic uncertainties, correct wet-lab errors and curate public DNA barcode reference libraries. With ongoing development of amplicon-assembly pipelines as well as long-reads HTS, associated to plummeting sequencing costs, we expect further development of HTS for DNA barcoding and for the sequencing of complete organelle genome. This will accelerate the assembly of DNA barcode reference libraries and reinforce studies relying on DNA-based species identification or delimitation (Tang et al., 2019).
Data Availability Statement
All datasets generated for this study are included in the article/Supplementary Material.
Author Contributions
RR, CL-V, CB, LS, DG, and RD designed the presented experiment. CB and GP listed the targeted organisms. LS carried out the sampling in natural history collections with the help of TN, TB, FS, GP, and RR. LS, DG, and RR carried out the wet-lab experiments. TN, TB, FS, and GP helped in taxonomic identifications. LS carried out the analyses and wrote the first draft. All authors provided critical feedbacks on the manuscript.
Funding
Experiments were funded both by ANR—Belmont Forum to CLIMTREE project: ANR-15-MASC-0002 (PI: CL-V) and by ANR to project SPHINX: anr-16-ce02-0011-05 (PI: RR).
Conflict of Interest
The authors declare that the research was conducted in the absence of any commercial or financial relationships that could be construed as a potential conflict of interest.
Acknowledgments
We would like to thank Elisabeth A. Herniou for helpful comments on the manuscript. We are thankful to the three reviewers and to the editor Prof. Rodney L. Honeycutt for their helpful comments on the manuscript. Laboratory work was carried out at the Service de Systématique Moléculaire (SSM), part of the Service Unit Acquisition et Analyse de Données pour l'Histoire Naturelle (2AD) (UMS2700) at the Muséum national d'Histoire naturelle in Paris.
Supplementary Material
The Supplementary Material for this article can be found online at: https://www.frontiersin.org/articles/10.3389/fevo.2019.00495/full#supplementary-material
References
Barsoum, N., Bruce, C., Forster, J., Ji, Y., and Yu, D. W. (2019). The devil is in the detail: metabarcoding of arthropods provides a sensitive measure of biodiversity response to forest stand composition compared with surrogate measures of biodiversity. Ecol. Indic. 101, 313–323. doi: 10.1016/j.ecolind.2019.01.023
Blankenberg, D., Von Kuster, G., Coraor, N., Ananda, G., Lazarus, R., Mangan, M., et al. (2010). “Galaxy: a web-based genome analysis tool for experimentalists,” in Current Protocols in Molecular Biology, eds F. M. Ausubel, R. Brent, R. E. Kingston, D. D. Moore, J. G. Seidman, J. A. Smith, and K. Struhl (Hoboken, NJ: John Wiley & Sons, Inc), 19.10.1–19.10.21. doi: 10.1002/0471142727.mb1910s89
Bouget, C., Brustel, H., Noblecourt, T., and Zagatti, P. (2019). Les Coléoptères Saproxyliques de France: Catalogue Écologique Illustré. Paris: Muséum National D'Histoire Naturelle, 744. (Patrimoines naturels; 79).
Bourlat, S. J., Haenel, Q., Finnman, J., and Leray, M. (2016). “Preparation of amplicon libraries for metabarcoding of Marine eukrayotes using illumina miseq: the dual-PCR method,” in Methods in Molecular Biology, Vol. 1452, ed S. J. Bourlat (New York, NY: Springer Science+Business Media), 197–207. doi: 10.1007/978-1-4939-3774-5_13
Chimeno, C., Morinière, J., Podhorna, J., Hardulak, L., Hausmann, A., Reckel, F., et al. (2018). DNA barcoding in forensic entomology - establishing a DNA reference library of potentially forensic relevant arthropod species. J. Forensic Sci. 64, 593–601. doi: 10.1111/1556-4029.13869
Cruaud, P., Rasplus, J. Y., Rodriguez, L. J., and Cruaud, A. (2017). High-throughput sequencing of multiple amplicons for barcoding and integrative taxonomy. Sci. Rep. 7:41948. doi: 10.1038/srep41948
Deiner, K., Bik, H. M., Mächler, E., Seymour, M., Lacoursière-Roussel, A., Altermatt, F., et al. (2017). Environmental DNA metabarcoding: transforming how we survey animal and plant communities. Mol. Ecol. 26, 5872–5895. doi: 10.1111/mec.14350
Dufresne, Y. (2017). Double Tagged Amplicon Demultiplexing, GitHub Repository. Available online at: https://github.com/yoann-dufresne/DoubleTagDemultiplexer
Elbrecht, V., and Leese, F. (2015). Can DNA-Based ecosystem assessments quantify species abundance? Testing primer bias and biomass—sequence relationships with an innovative metabarcoding protocol. PLoS ONE 10:e0130324. doi: 10.1371/journal.pone.0130324
Fadrosh, D. W., Ma, B., Gajer, P., Sengamalay, N., Ott, S., Brotman, R. M., et al. (2014). An improved dual-indexing approach for multiplexed 16S rRNA gene sequencing on the illumina MiSeq platform. Microbiome 2:6. doi: 10.1186/2049-2618-2-6
Fagan-jeffries, E. P., Cooper, S. J. B., Bertozzi, T., Bradford, T. M., and Austin, A. D. (2018). DNA barcoding of microgastrine parasitoid wasps (Hymenoptera: Braconidae) using high-throughput methods more than doubles the number of species known for Australia. Mol. Ecol. Resour. 18, 1132–1143. doi: 10.1111/1755-0998.12904
Folmer, O., Black, M., Hoeh, W., Lutz, R., and Vrijenhoek, R. (1994). DNA primers for amplification of mitochondrial cytochrome c oxidase subunit I from diverse metazoan invertebrates. Mol. Mar. Biol. Biotechnol. 3, 294–299.
Giangrande, A. (2003). Biodiversity, conservation, and the “Taxonomic impediment”. Aquat. Conserv. 13, 451–459. doi: 10.1002/aqc.584
Gossner, M. M., Lachat, T., Brunet, J., Isacsson, G., Bouget, C., Brustel, H., et al. (2013). Current near-to-nature forest management effects on functional trait composition of saproxylic beetles in beech forests: functional diversity of beetles. Conserv. Biol. 27, 605–614. doi: 10.1111/cobi.12023
Green, S. V. (1998). The taxonomic impediment in orthopteran research and conservation. J. Insect Conserv. 2, 151–159. doi: 10.1023/A:1009633811789
Hajibabaei, M., Smith, M. A., Janzen, D. H., Rodriguez, J. J., Whitfield, J. B., and Hebert, P. D. N. (2006). A minimalist barcode can identify a specimen whose DNA is degraded. Mol. Ecol. Notes 6, 959–964. doi: 10.1111/j.1471-8286.2006.01470.x
Hallmann, C. A., Sorg, M., Jongejans, E., Siepel, H., Hofland, N., Schwan, H., et al. (2017). More than 75 percent decline over 27 years in total flying insect biomass in protected areas. PLoS ONE 12:e0185809. doi: 10.1371/journal.pone.0185809
Hausmann, A., Miller, S. E., Holloway, J. D., deWaard, J. R., Pollock, D., Prosser, S. W. J., et al. (2016). Calibrating the taxonomy of a megadiverse insect family: 3000 DNA barcodes from geometrid type specimens (Lepidoptera, Geometridae). Genome 59, 671–684. doi: 10.1139/gen-2015-0197
Hebert, P. D. N., Braukmann, T. W. A., Prosser, S. W. J., Ratnasingham, S., deWaard, J. R., Ivanova, N. V., et al. (2018). A sequel to sanger: amplicon sequencing that scales. BMC Genomics 19:219. doi: 10.1186/s12864-018-4611-3
Hebert, P. D. N., Cywinska, A., Ball, S. L., and deWaard, J. R. (2003a). Biological Identifications through DNA Barcodes. Proc. Biol. Sci. 270, 313–321. doi: 10.1098/rspb.2002.2218
Hebert, P. D. N., deWaard, J. R., Zakharov, E. V., Prosser, S. W. J., Sones, J. E., McKeown, J. T. A., et al. (2013). A DNA ‘barcode blitz’: rapid digitization and sequencing of a natural history collection. PLoS ONE. 8:e68535. doi: 10.1371/journal.pone.0068535
Hebert, P. D. N., Penton, E. H., Burns, J. M., Janzen, D. H., and Hallwachs, W. (2004). Ten species in one: DNA barcoding reveals cryptic species in the neotropical skipper butterfly astraptes fulgerator. Proc. Natl. Acad. Sci. U.S.A. 101, 14812–14817. doi: 10.1073/pnas.0406166101
Hebert, P. D. N., Ratnasingham, S., and deWaard, J. R. (2003b). Barcoding animal life: cytochrome c oxidase subunit 1 divergences among closely related species. Proc. Biol. Sci. 270(Suppl. 1), S96–S99. doi: 10.1098/rsbl.2003.0025
Hendrich, L., Moriniere, J., Haszprunar, G., Hebert, P. D. N., Hausmann, A., Köhler, F., et al. (2015). A comprehensive DNA barcode database for Central European beetles with a focus on Germany: adding more than 3500 identified species to BOLD. Mol. Ecol. Resour. 15, 795–818. doi: 10.1111/1755-0998.12354
Hernández-Triana, L. M., Prosser, S. W., Rodríguez-Perez, M. A., Chaverri, L. G., Hebert, P. D. N., and Gregory, T. R. (2014). Recovery of DNA barcodes from blackfly museum specimens (Diptera: Simuliidae) using primer sets that target a variety of sequence lengths. Mol. Ecol. Resour. 14, 508–518. doi: 10.1111/1755-0998.12208
Janssen, P., Fuhr, M., Cateau, E., Nusillard, B., and Bouget, C. (2017). Forest continuity acts congruently with stand maturity in structuring the functional composition of saproxylic beetles. Biol. Conserv. 205, 1–10. doi: 10.1016/j.biocon.2016.11.021
Ji, Y., Ashton, L., Pedley, S. M., Edwards, D. P., Tang, Y., Nakamura, A., et al. (2013). Reliable, verifiable and efficient monitoring of biodiversity via metabarcoding. Ecol. Lett. 16, 1245–1257. doi: 10.1111/ele.12162
Kearse, M., Moir, R., Wilson, A., Stones-Havas, S., Cheung, M., Sturrock, S., et al. (2012). Geneious basic: an integrated and extendable desktop software platform for the organization and analysis of sequence data. Bioinformatics 28, 1647–1649. doi: 10.1093/bioinformatics/bts199
Kimura, M. (1980). A simple method for estimating evolutionary rates of base substitutions through comparative studies of nucleotide sequences. J. Mol. Evol. 16, 111–120. doi: 10.1007/BF01731581
Knittel, T., and Picard, D. (1993). PCR with degenerate primers 9 containing deoxyinosine fails with PFU DNA polymerase. Genome Res. 2, 346–347. doi: 10.1101/gr.2.4.346
Lanner, J., Curto, M., Pachinger, B., Neumüller, U., and Harald Meimberg, H. (2019). Illumina midi-barcodes: quality proof and applications. Mitochondrial DNA A DNA Mapp. Seq. Anal. 30, 490–499. doi: 10.1080/24701394.2018.1551386
Leray, M., Haenel, Q., and Bourlat, S. J. (2016). “Preparation of amplicon libraries for metabarcoding of marine eukaryotes using illumina miseq: the adapter ligation method,” in Marine Genomics, ed S. J. Bourlat (New York, NY: Springer), 209–218. doi: 10.1007/978-1-4939-3774-5_14
Liu, L., Li, Y., Li, S., Hu, N., He, Y., Pong, R., et al. (2012). Comparison of next-generation sequencing systems. J. Biomed. Biotechnol. 2012, 1–11. doi: 10.1155/2012/251364
Meier, R., Wong, W., Srivathsan, A., and Foo, M. (2016). $1 DNA barcodes for reconstructing complex phenomes and finding rare species in specimen-rich samples. Cladistics 32, 100–110. doi: 10.1111/cla.12115
Meyer, M., and Kircher, M. (2010). Illumina sequencing library preparation for highly multiplexed target capture and sequencing. Cold Spring Harb. Protoc. 5, 1–10. doi: 10.1101/pdb.prot5448
Meyer, M., Kircher, M., Gansauge, M.-T., Li, H., Racimo, F., Mallick, S., et al. (2012). A high-coverage genome sequence from an archaic Denisovan individual. Science 338, 222–226. doi: 10.1126/science.1224344
Mutanen, M., Kivelä, S. M., Vos, R. A., Doorenweerd, C., Ratnasingham, S., Hausmann, A., et al. (2016). Species-level para- and polyphyly in DNA barcode gene trees: strong operational bias in European Lepidoptera. Syst. Biol. 65, 1024–1040. doi: 10.1093/sysbio/syw044
Oliverio, A. M., Gan, H., Wickings, K., and Fierer, N. (2018). A DNA metabarcoding approach to characterize soil arthropod communities. Soil Biol. Biochem. 125, 37–43. doi: 10.1016/j.soilbio.2018.06.026
Pentinsaari, M., Hebert, P. D. N., and Mutanen, M. (2014). Barcoding beetles: a regional survey of 1872 species reveals high identification success and unusually deep interspecific divergences. PLoS ONE 9:e108651. doi: 10.1371/journal.pone.0108651
Piñol, J., Mir, G., Gomez-Polo, P., and Agustí, N. (2015). Universal and blocking primer mismatches limit the use of high-throughput dna sequencing for the quantitative metabarcoding of arthropods. Mol. Ecol. Resour. 15, 819–830. doi: 10.1111/1755-0998.12355
Porter, T. M., and Hajibabaei, M. (2018). Automated high throughput animal co1 metabarcode classification. Sci. Rep. 8, 1–10. doi: 10.1038/s41598-018-22505-4
Prosser, S. W. J., deWaard, J. R., Miller, S. E., and Hebert, P. D. N. (2015). DNA barcodes from century-old type specimens using next-generation sequencing. Mol. Ecol. Resour. 16, 487–497. doi: 10.1111/1755-0998.12474
R Core Team (2017). R: A Language and Environment for Statistical Computing (version 3.4.3). Vienna: R Foundation for Statistical Computing. Available online at: https://www.R-project.org/
Ratnasingham, S., and Hebert, P. D. N. (2007). BARCODING, BOLD: the barcode of life data system. Mol. Ecol. Notes 7, 355–364. doi: 10.1111/j.1471-8286.2007.01678.x
Ratnasingham, S., and Hebert, P. D. N. (2013). A DNA-based registry for all animal species: the Barcode Index Number (BIN) system. PLoS ONE 8:e66213. doi: 10.1371/journal.pone.0066213
Rougerie, R., Lopez-Vaamonde, C., Barnouin, T., Delnatte, J., Moulin, N., Noblecourt, T., et al. (2015). PASSIFOR: a reference library of DNA barcodes for french saproxylic beetles (Insecta, Coleoptera). Biodivers. Data J. 3:e4078. doi: 10.3897/BDJ.3.e4078
Saitou, N., and Nei, M. (1987). The neighbor-joining method: a new method for reconstructing phylogenetic trees. Mol. Biol. Evol. 4, 406–425.
Schnell, I. B., Bohmann, K., and Gilbert, M. T. P. (2015). Tag jumps illuminated - reducing sequence-to-sample misidentifications in metabarcoding studies. Mol. Ecol. Resour. 15, 1289–1303. doi: 10.1111/1755-0998.12402
Shokralla, S., Gibson, J. F., Nikbakht, H., Janzen, D. H., Hallwachs, W., and Hajibabaei, M. (2014). Next-generation DNA barcoding: using next-generation sequencing to enhance and accelerate dna barcode capture from single specimens. Mol. Ecol. Resour. 14, 892–901. doi: 10.1111/1755-0998.12236
Shokralla, S., Porter, T. M., Gibson, J. F., Dobosz, R., Janzen, D. H., Hallwachs, W., et al. (2015). Massively parallel multiplex DNA sequencing for specimen identification using an illumina miseq platform. Sci. Rep. 5:9687. doi: 10.1038/srep09687
Smith, M. A., Bertrand, C., Crosby, K., Eveleigh, E. S., Fernandez-Triana, J., Fisher, B. L., et al. (2012). Wolbachia and DNA barcoding insects: patterns, potential, and problems. PLoS ONE 7:e36514. doi: 10.1371/journal.pone.0036514
Smith, M. A., and Fisher, B. L. (2009). Invasions, DNA barcodes, and rapid biodiversity assessment using ants of Mauritius. Front. Zool. 6:31. doi: 10.1186/1742-9994-6-31
Stokland, J. N., Siitonen, J., and Jonsson, B.-G. (2012). Biodiversity in Dead Wood. Cambridge; Edimburgh: Cambridge University Press. doi: 10.1017/CBO9781139025843
Stork, N. E., McBroom, J., Gely, C., and Hamilton, A. J. (2015). New approaches narrow global species estimates for beetles, insects, and terrestrial arthropods. Proc. Natl. Acad. Sci. U.S.A. 112, 7519–7523. doi: 10.1073/pnas.1502408112
Tamura, K., and Nei, M. (1993). Estimation of the number of nucleotide substitutions in the control region of mitochondrial DNA in human and chimpanzees. Mol Biol Evol 10, 512–526.
Tang, P., Zhu, J.-C., Zheng, B.-Y., Wei, S.-J., Sharkey, M., Chen, X.-X., et al. (2019). Mitochondrial phylogenomics of the hymenoptera. Mol. Phylogenet. Evol 131, 8–18. doi: 10.1016/j.ympev.2018.10.040
Tauzin, P.-H. (2015). Chorologie du complexe spécifique Protaetia (Potosia) Cuprea Fabricius, 1775 En France (Coleoptera, Cetoniinae, Cetoniini). Lambillionea 115, 99–174.
Thomsen, P. F., and Sigsgaard, E. E. (2019). Environmental DNA metabarcoding of wild flowers reveals diverse communities of terrestrial arthropods. Ecol. Evol. 9, 1665–1679. doi: 10.1002/ece3.4809
van Dijk, E. L., Auger, H., Jaszczyszyn, Y., and Claude Thermes, C. (2014). Ten years of next-generation sequencing technology. Trends Genet. 30, 418–426. doi: 10.1016/j.tig.2014.07.001
Van Houdt, J. K. J., Breman, F. C., Virgilio, M., and De Meyer, M. (2010). Recovering full DNA barcodes from natural history collections of tephritid fruitflies (Tephritidae, Diptera) using mini barcodes. Mol. Ecol. Resour. 10, 459–465. doi: 10.1111/j.1755-0998.2009.02800.x
Vondráček, D., Fuchsová, A., Ahrens, D., Král, D., and Šípek, P. (2018). Phylogeography and DNA-based species delimitation provide insight into the taxonomy of the polymorphic rose chafer protaetia (Potosia) cuprea species complex (Coleoptera: Scarabaeidae: Cetoniinae) in the Western Palearctic. PLoS ONE 13: e0192349. doi: 10.1371/journal.pone.0192349
Wang, W. Y., Srivathsan, A., Foo, M., Yamane, S. K., and Meier, R. (2018). Sorting specimen-rich invertebrate samples with cost-effective ngs barcodes: validating a reverse workflow for specimen processing. Mol. Ecol. Resour. 18, 490–501. doi: 10.1111/1755-0998.12751
Yu, D. W., Ji, Y., Emerson, B. C., Wang, X., Ye, C., Yang, C., et al. (2012). Biodiversity soup: metabarcoding of arthropods for rapid biodiversity assessment and biomonitoring: biodiversity soup. Methods Ecol. Evol. 3, 613–623. doi: 10.1111/j.2041-210X.2012.00198.x
Keywords: COI, coleoptera, high-throughput sequencing, degraded DNA, Sanger sequencing
Citation: Sire L, Gey D, Debruyne R, Noblecourt T, Soldati F, Barnouin T, Parmain G, Bouget C, Lopez-Vaamonde C and Rougerie R (2019) The Challenge of DNA Barcoding Saproxylic Beetles in Natural History Collections—Exploring the Potential of Parallel Multiplex Sequencing With Illumina MiSeq. Front. Ecol. Evol. 7:495. doi: 10.3389/fevo.2019.00495
Received: 01 July 2019; Accepted: 03 December 2019;
Published: 19 December 2019.
Edited by:
Rodney L. Honeycutt, Pepperdine University, United StatesReviewed by:
Anthony I. Cognato, Michigan State University, United StatesTrevor Bringloe, The University of Melbourne, Australia
Michael J. Raupach, Bavarian State Collection of Zoology, Germany
Copyright © 2019 Sire, Gey, Debruyne, Noblecourt, Soldati, Barnouin, Parmain, Bouget, Lopez-Vaamonde and Rougerie. This is an open-access article distributed under the terms of the Creative Commons Attribution License (CC BY). The use, distribution or reproduction in other forums is permitted, provided the original author(s) and the copyright owner(s) are credited and that the original publication in this journal is cited, in accordance with accepted academic practice. No use, distribution or reproduction is permitted which does not comply with these terms.
*Correspondence: Lucas Sire, bHVjYXMuc2lyZUB1bml2LXRvdXJzLmZy