 Wayne E. Thogmartin
 Jennifer A. Szymanski
 Emily L. Weiser
- 1U.S. Geological Survey, Upper Midwest Environmental Sciences Center, La Crosse, WI, United States
- 2U.S. Fish and Wildlife Service, Endangered Species Program, La Crosse, WI, United States
The eastern migratory population of monarch butterflies has experienced a multi-decadal decline, but a recent increase in abundance (to 6.05 ha in winter 2018) has led some observers to question whether the population has reversed its long-standing decline and embarked on a trajectory of increasing abundance. We examined this possibility through changepoint analyses, assessing whether a change in trajectory existed over a 25-year times series. We found evidence of a change in trajectory in 2014, but insufficient statistical support for a significantly increasing population since that time (β = 0.285, 95% CI = −0.127, 0.697). If the population estimate for winter 2019 is ≥4.0 ha, we will then be able to credibly assert the population has been increasing since 2014. However, given estimated levels of time series variability, presumed habitat capacity and no recent change in status or trend, there was a 13.5% probability of observing a population estimate as large or larger than was reported for winter 2018. Our analyses highlight the incredible difficulty in drawing robust conclusions from annual changes in abundance over a short time series, especially for an insect that commonly exhibits considerable year-to-year variation. Thus, we urge caution when drawing conclusions regarding species status and trends for any species for which limited data are available.
Introduction
“Short-Term Fluctuations May or May Not Contain Messages About Longer-Term Trends”
– Art Shapiro
Populations vary over time in their abundance, and this variability can impart uncertainty to the status and trend of a species. As population dynamics approach extinction, dynamics become more variable (Fagan and Holmes, 2006), which means short-term highs might become higher, even while abundance is declining on average. In addition to the stochastic variation in abundance imposed by the environment, uncertainty in species status and trend arises from population sizes most often being estimated rather than counted; trends being inferred from limited duration time series; and latent characteristics of a population, such as its relation to carrying capacity or quasi-extinction thresholds, generally being inferred properties rather than an observable quantity. Thus, given these various sources of uncertainty, it is difficult enough to determine the trajectory for a population, let alone any change that may occur in that trajectory, especially one that may occur near the terminus of a time series based on limited data.
Estimates of the population size of the eastern North American migratory population of monarch butterflies (Danaus plexippus, hereafter monarchs) in their overwintering locations in high-elevation oyamel fir (Abies religiosa) forests of central Mexico suggest a long-term decline in abundance. Using a model allowing separation of observation-induced error from natural process variability, Semmens et al. (2016) estimated monarchs declined by 84% between the winters beginning in 1996 (18.19 ha) and 2014 (0.67 ha), with an estimated annual population rate of change of 0.94. This rapid decline in monarch abundance led to widespread concern regarding the imperilment of the species (Brower et al., 2011), including a petitioning of the U.S. Fish and Wildlife Service (USFWS) to consider listing the species under the U.S. Endangered Species Act (ESA) of 1973 (Center for Biological Diversity and Brower, 2014).
The estimated rate of decline (λ = 0.94) in monarchs was, however, considerably uncertain, with credible intervals spanning from as low as 0.69 to as high as 1.30. This uncertainty, in turn, led to considerable uncertainty in the estimates of risk faced by the population; for instance, depending on the quasi-extinction threshold chosen, the range of uncertainty in the risk was as much as one or two orders of magnitude wide (i.e., 0–34% at a 0.01 ha quasi-extinction threshold and 7–88% at 0.25 ha). The principal reasons for this large uncertainty in the trajectory of monarchs and their subsequent risk of further decline are the environmental and biological variability this insect faces over its annual cycle and our ability to intuit the species response to this variability with the limited data available from monitoring programs. Density-independent mortality, caused by a wide array of annually variable environmental stressors, is offset against density-dependent reproduction (Yakubu et al., 2004; Drury and Dwyer, 2006; Flockhart et al., 2012; Marini and Zalucki, 2017), and this tension between birth and death processes plays out over multiple generations and across the vastness of eastern North America (Flockhart et al., 2015; Oberhauser et al., 2017). In some years, these processes complement one another, leading to booms or busts in the population (Himes Boor et al., 2018). In other years, increases in one are offset by the other, mitigating any sizeable year-to-year change in population size.
In winter 2018, estimates of monarch abundance in their overwintering areas indicated monarchs increased by 144% over their previous year’s abundance, to an index of population size of 6.05 ha (Conanp and World Wildlife Fund-Mexico, 2019). This estimate has led some observers to question whether the population has grown in recent years to the point at which it is no longer at risk. This seemingly simple question is manifold in nature. The question suggests that there may have been a change in the trajectory of the species in recent years, from a population in decline to one of increase, that in turn begs whether the evidence of this change in trajectory supports a reduced risk of quasi-extinction. An alternative possibility could be that the underlying status and trajectory of the population had not changed but instead the species demonstrated the extreme variability in year-to-year abundance that is not uncommon for insects.
To address this question, we conducted a time-series analysis examining whether the observed series of population sizes experienced changes in mean or trajectory anywhere over the 25-year period of record. The population as measured in Mexico reached its nadir in abundance in winter 2013 (Rendón-Salinas and Tavera-Olonso, 2014); we hypothesized that any change in status and any reversal of trend should occur at this point in the time series.
Methods
The overwinter index of population size (in hectares) we used in our models was that used by the USFWS in its Species Status Assessment for informing considerations of whether listing under the ESA is warranted. These data ranged from 1984–2018. With these data, we evaluated two models, a step model ( ) evaluating whether there was a demonstrable change in status (i.e., mean abundance) during the time period and a segmented model (
 ) examining whether there was a change in the trend; we specifically tested for a reversal of trend from a period of decline to one of growth. We fit these models in R (R Core Team, 2018) with both the changepoint (Killick et al., 2016) and chngpt (Fong and Gilbert, 2017) packages to ensure correct model outputs (see Supplementary Datasheet S1). Assumptions of independent, normally distributed data (on a loge scale) with constant variance pre- and post-change were evaluated with Shapiro and Kolmogorov–Smirnov tests and inspection of quantile-quantile and autocorrelation plots. We used an information-theoretic approach (with Akaike’s Information Criterion) for selecting the best model among step, segmented, linear (no change in slope), and intercept-only formulations.
Pleasants (2017) suggested there was sufficient milkweed in the upper midwestern United States to support a mean population size overwintering in Mexico of 3.2 ha. He also asserted that in some years, the reported abundance is likely to be lower because of the accumulation of poor conditions faced by the population during its annual cycle, whereas in some years favorable conditions will lead to a population increase higher than 3.2 ha. We calculated the probability from a log-normal distribution of observing a 6.05-ha population relative to the 3.2-ha expected population size. We calculated the variance for this log-normal distribution from the variance of the post-2013 period.
Given that a changepoint was identified and the post-changepoint period was non-significantly increasing (95% confidence interval of the slope parameter overlapping 0) (see Results), we asked the question: How many more years of positive increase would be necessary to provide statistically robust evidence that the population was growing? To evaluate this question, we extrapolated the post-changepoint period abundance given the estimated post-changepoint slope and refit the changepoint model with additional years of extrapolated abundance.
Results
When examining the time series of overwinter abundance of the eastern migratory population of monarch butterflies for a change in mean abundance (i.e., step change), we identified a single credible changepoint in winter 2009. For the period preceding this year, mean abundance was 6.69 ha (95% CI = 4.43, 8.94). For the period after winter 2009, mean abundance was 1.52 ha (95% CI ≥ 0.001, 4.68). The population variance was 15% higher in this latter period (1.321.52), exhibiting greater variability at lower population sizes. If the underlying milkweed is currently sufficient to support a winter population of 3.2 ha (Pleasants, 2017), then a population as large or larger than 6.05 ha is expected to occur 13.5% of the time.
Fitting a segmented model, rather than a step model, suggested the best-supported year for the changepoint threshold was 2014 (likelihood ratio test of segmented model with and without changepoint, λ = 8.167, p = 0.0221; bootstrapped 95% CI = 2002, 2026), with 2013 close behind. The slope describing the decline of monarchs in the period before winter 2014 was negative (β = −0.103, Table 1), whereas after this winter the population exhibited a non-significant increase, though with confidence intervals >5:1 in favor of an increase (β = 0.285, 95% CI = −0.127, 0.697) (Figure 1).
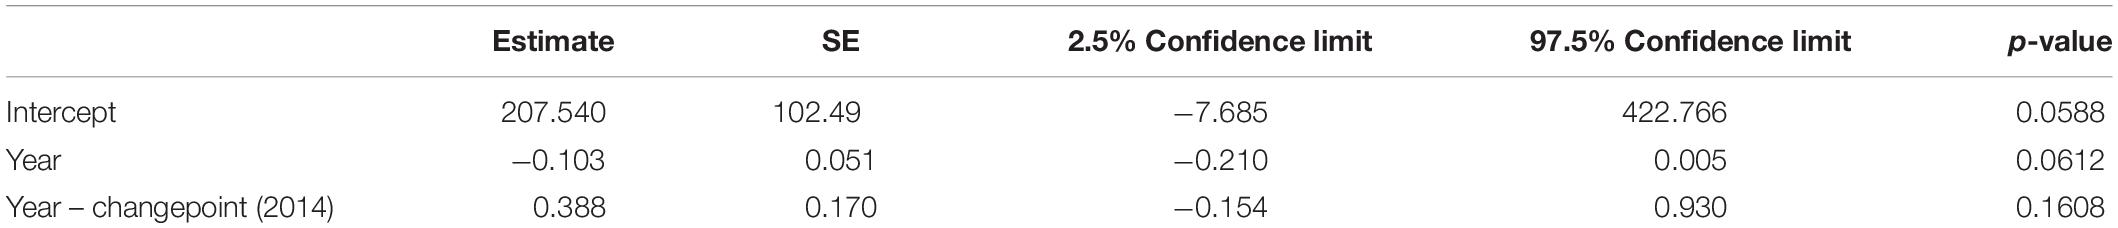
Table 1. Parameter estimates for the best-supported linear segmented changepoint model for 1994–2018 estimates of overwinter abundance of the eastern migratory monarch butterfly population.
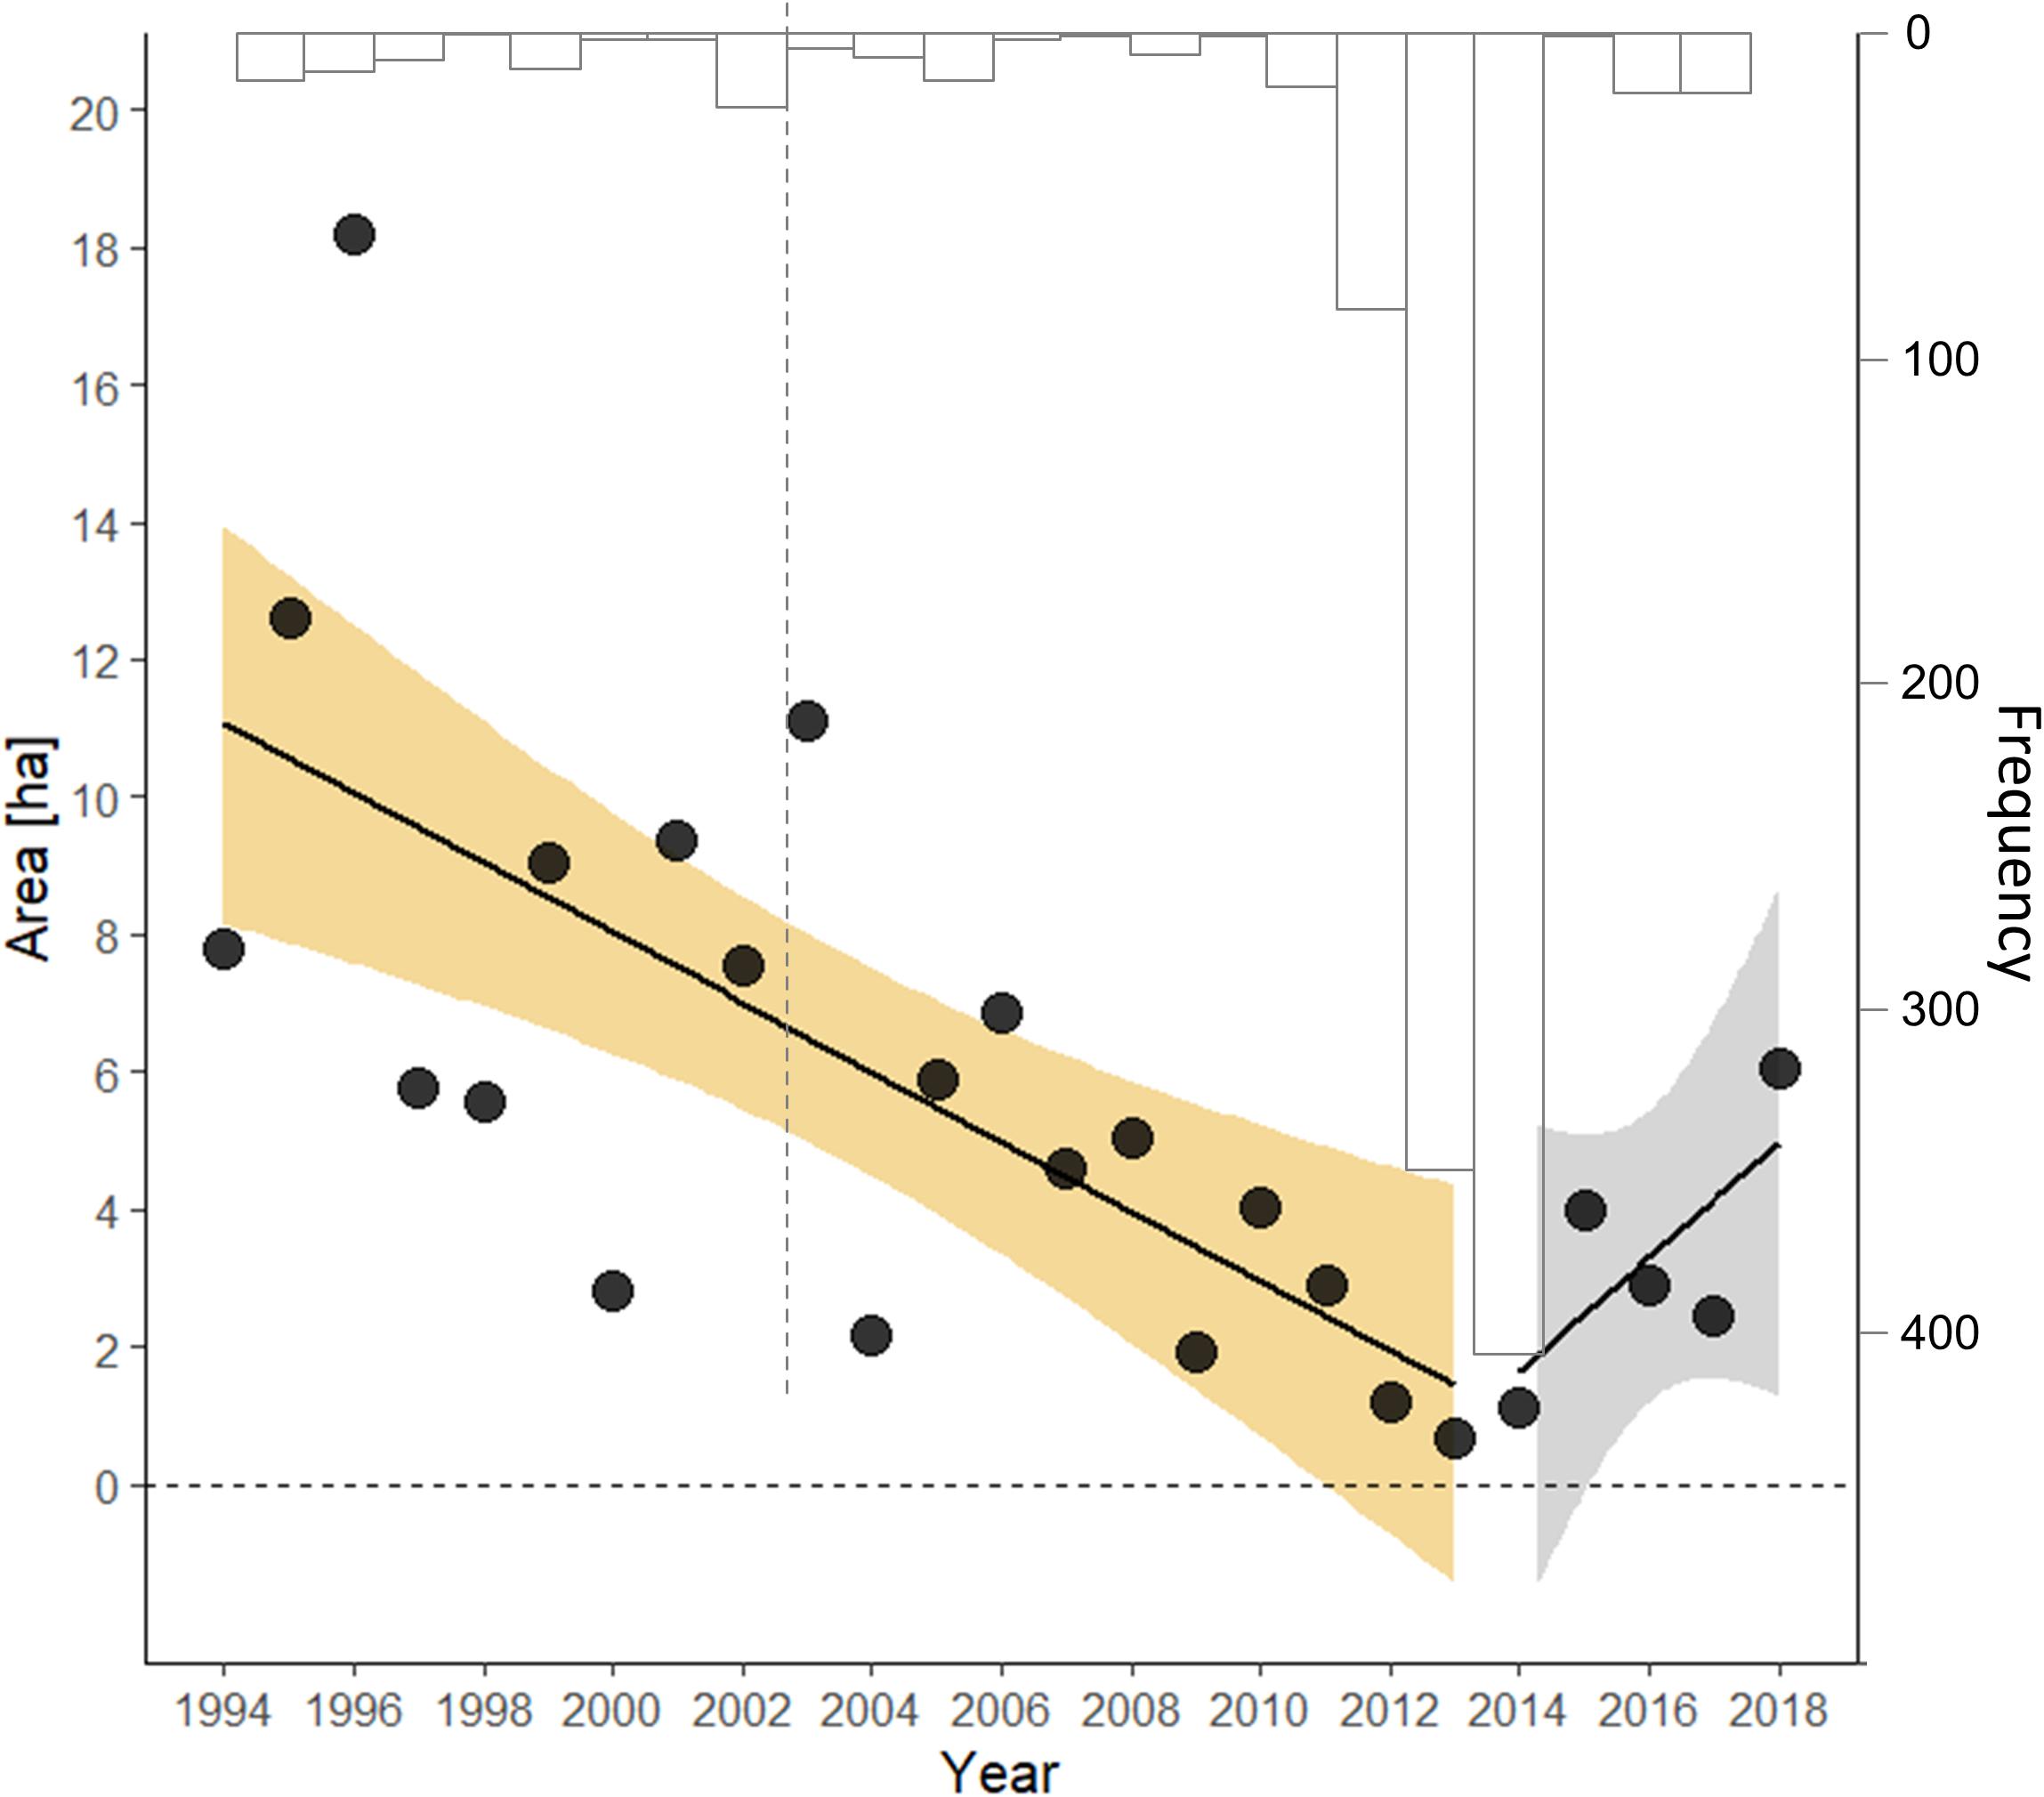
Figure 1. Segmented time series of the index of overwinter abundance [in area occupied (ha)] of eastern migratory monarch butterflies. The bootstrapped frequency of the changepoint estimate from 103 replicates is provided (inverted, in gray); the gray line represents the lower 2.5% symmetric bootstrap confidence limit.
Residuals from these step and segmented models before and after their changepoints were independent, normally distributed about their respective mean, and had constant variance. Comparing the segmented model (AIC = 45.3) with the step model (AIC = 49.5) suggested an 88% probability (odds 7.2:1) that the segmented model served as a better description of the data. Both models were appreciably better than an intercept-only model (AIC = 62.8) and a linear model regressing the loge (overwinter estimate) against year (AIC = 51.5).
If the winter 2019 population continues the mean rate of increase observed since 2014, then with this single additional year of data, we would have sufficient information statistically to conclude the population was growing (β = 0.399, 95% CI = 0.072, 0.727). Further, if the index of abundance was any value ≥4.00 ha, this amount too would be statistically sufficient (p < 0.05) to support a conclusion that the population was growing. Any value <4.00 ha, however, would cast doubt on a growing population.
Discussion
At this time, there is insufficient statistical evidence to confidently assert that the eastern migratory monarch population has significantly grown since winter 2014. If the dynamic of population growth for the few years post-winter 2014 holds, then winter 2019–2020’s population size estimate should provide evidence as to whether the trend has credibly changed from one of decline to one of increase.
In a noisy time series, stochastic fluctuations may lead to observed increases over relatively long periods, even when populations have an average negative growth rate. Similarly, stochastic fluctuations may cause a population to decrease, even when the long-term average growth rate is positive. Our analysis and the uncertainty it reveals highlights the difficulty in assessing species status and trend with even a 25-year dataset, especially when interannual variation is high. Semmens et al. (2016) reported a mean declining dynamic through 2014, but one with a non-negligible probability of a possible underlying growth rate that was positive. Their findings showed that two-thirds of the credible interval distribution about their estimate of the population growth rate was <1, indicating that the odds were 2:1 in favor of a declining population. Nevertheless, one-third of the distribution suggested a stable or growing population. With the full set of data through winter 2018 but with different methods, we find that the population prior to the estimated changepoint was similarly in decline (Table 1). Conversely, based on the interval width we calculated for the post-2014 trajectory, the odds are roughly 5:1 in favor of an increasing population. Unfortunately, the post-2014 period is too short to confidently conclude, at this time, a reversal in trajectory.
In any time series, the sample size is the number of years, and 10–30 years are often necessary to detect a significant trend even for species with average interannual variation (Urquhart, 2012; White, 2018). Despite the challenge of high interannual variation, the monarch butterfly is an iconic and highly visible species that benefits from strong public interest (Diffendorfer et al., 2014) and a corresponding availability of data (Ries and Oberhauser, 2015). For many species considered for listing under the ESA, even less information is available for evaluating the statistical support for any apparent decline. Thus, the challenge of assessing trend becomes even greater as one examines short-term time series or smaller periods of time within long-running time series; what may initially appear to be a short-term trend may have no statistical support in the context of the population’s history. While assessing subsets of a time series could be a useful way to evaluate whether a species is moving toward recovery, caution is warranted when making conclusions based on limited data. Aside from the estimate of trend, other metrics can be useful in such cases, such as whether mean abundance falls below the estimated threshold for a secure population. In the case of the monarch butterfly, the recent mean of 1.52 ha falls well below the threshold of 6.0 ha estimated by Semmens et al. (2016) and established by the three nations of Canada, United States and Mexico as the near-term population goal for the eastern population of migratory monarch butterflies. If we take this 6.0 ha threshold as a recovery criterion and assume a 1.52, then the population is likely to need to reach a mean of 6.85 ha for 3 years to confidently assert the population has crossed this threshold (analysis not shown). Thus, this mean population size warrants continuing concern given the uncertain growth in recent years and the high year-to-year variability exhibited by this insect species.
Data Availability Statement
Publicly available datasets were analyzed in this study. This data can be found here: http://d2ouvy59p0dg6k.cloudfront.net/img/original/grafica_ocupacion_de_colonias_monarca.png.
Author Contributions
WT and JS conceived the study. WT conducted the analyses. WT, JS, and EW wrote the manuscript.
Disclaimer
Any use of trade, firm, or product names is for descriptive purposes and does not imply endorsement by the U.S. Government. The findings and conclusions in this article are those of the authors and do not necessarily represent the views of the U.S. Fish and Wildlife Service.
Funding
This research was conducted in accordance with official duties as employees of the United States federal government.
Conflict of Interest
The authors declare that the research was conducted in the absence of any commercial or financial relationships that could be construed as a potential conflict of interest.
Acknowledgments
We appreciate M. Post Ven Der Burg and the two reviewers for comments made on an earlier version of this manuscript.
Supplementary Material
The Supplementary Material for this article can be found online at: https://www.frontiersin.org/articles/10.3389/fevo.2020.00043/full#supplementary-material
References
Brower, L. P., Taylor, O. R., Williams, E. H., Slayback, D. A., Zubieta, R. R., and Ramírez, M. I. (2011). Decline of monarch butterflies overwintering in Mexico: is the migratory phenomenon at risk? Insect Conserv. Divers. 5, 95–100. doi: 10.1111/j.1752-4598.2011.00142.x
Center for Biological Diversity, Center for Food Safety, Xerces Society Brower, L. (2014). Petition to protect the monarch butterfly (Danaus plexippus plexippus) under the endangered species act. News J. Lepid. Soc. 56:4.
Conanp and World Wildlife Fund-Mexico (2019). Monarch Butterfly’s Presence in Mexican Hibernation Forests Increased by 144%. Available at: https://www.gob.mx/conanp/prensa/aumento-144-la-presencia-de-la-mariposa-monarca-en-los-bosques-mexicanos-de-hibernacion (accessed January 30, 2019).
Diffendorfer, J. E., Loomis, J. B., Ries, L., Oberhauser, K., Lopez-Hoffman, L., Semmens, D., et al. (2014). National valuation of monarch butterflies indicates an untapped potential for incentive-based conservation. Conserv. Lett. 7, 253–262. doi: 10.1111/conl.12065
Drury, K., and Dwyer, G. (2006). Combining stochastic models with experiments to understand the dynamics of monarch butterfly colonization. Am. Nat. 166, 731–750. doi: 10.1086/497542
HolmesFagan, W. F., and Holmes, E. E. (2006). Quantifying the extinction vortex. Ecol. Lett. 9, 51–60. doi: 10.1111/j.1461-0248.2005.00845.x
Flockhart, D. T., Pichancourt, J. B., Norris, D. R., and Martin, T. G. (2015). Unravelling the annual cycle in a migratory animal: breeding-season habitat loss drives population declines of monarch butterflies. J. Anim. Ecol. 84, 155–165. doi: 10.1111/1365-2656.12253
Flockhart, D. T. T., Martin, T. G., and Norris, D. R. (2012). Experimental examination of intraspecific density-dependent competition during the breeding period in monarch butterflies (Danaus plexippus). PLoS One 7:e45080. doi: 10.1371/journal.pone.0045080
Fong, H., and Gilbert, P. (2017). chngpt: threshold regression model estimation and inference. BMC Bioinform. 18:454. doi: 10.1186/s12859-017-1863-x
Himes Boor, G. K., Schultz, C. B., Crone, E. E., and Morris, W. F. (2018). Mechanism matters: the cause of fluctuations in boom-bust populations governs optimal habitat restoration strategy. Ecol. Appl. 28, 356–372. doi: 10.1002/eap.1652
Killick, R., Haynes, K., and Eckley, I. A. (2016). Changepoint: An R Package for Changepoint Analysis. R Package Version 2.2.2.
Marini, L., and Zalucki, M. P. (2017). Density-dependence in the declining population of the monarch butterfly. Sci. Rep. 7:13957. doi: 10.1038/s41598-017-14510-w
Oberhauser, K., Wiederholt, R., Diffendorfer, J. E., Semmens, D., Ries, L., Thogmartin, W. E., et al. (2017). A trans-national monarch butterfly population model and implications for regional conservation priorities. Ecol. Entomol. 42, 51–60. doi: 10.1111/een.12351
Pleasants, J. (2017). Milkweed restoration in the Midwest for monarch butterfly recovery: estimates of milkweeds lost, milkweeds remaining and milkweeds that must be added to increase the monarch population. Insect Conserv. Divers. 10, 42–53. doi: 10.1111/icad.12198
R Core Team (2018). R: A Language and Environment for Statistical Computing. Vienna: R Foundation for Statistical Computing.
Rendón-Salinas, E., and Tavera-Olonso, G. (2014). Forest surface occupied by monarch butterfly hibernation colonies in December 2013. World Wildlife Fund-Mexico. Available online at: www.worldwildlife.org/publications/forest-surface-occupied-by-monarch-butterfly-hibernation-colonies-in-december-2013 (accessed February 18, 2020).
Ries, L., and Oberhauser, K. (2015). A citizen army for science: quantifying the contributions of citizen scientists to our understanding of monarch butterfly biology. Bioscience 65, 419–430. doi: 10.1093/biosci/biv011
Semmens, B. X., Semmens, D. J., Thogmartin, W. E., Wiederholt, R., López-Hoffman, L., Diffendorfer, J. E., et al. (2016). Quasi-extinction risk and population targets for the eastern, migratory population of monarch butterflies (Danaus plexippus). Sci. Rep. 6:23265. doi: 10.1038/srep23265
Urquhart, N. S. (2012). “The role of monitoring design in detecting trend in long-term ecological monitoring studies,” in Design and Analysis of Long-term Ecological Monitoring Studies, eds R. A. Gitzen, J. J. Millspaugh, A. B. Cooper, and D. S. Licht, (Cambridge: Cambridge University Press), 151–173. doi: 10.1017/cbo9781139022422.011
White, E. R. (2018). Minimum time required to detect population trends: the need for long-term monitoring programs. Bioscience 69, 40–46. doi: 10.1093/biosci/biy144
Keywords: changepoint, Danaus plexippus, extinction risk, small data, population ecology, time series analyses
Citation: Thogmartin WE, Szymanski JA and Weiser EL (2020) Evidence for a Growing Population of Eastern Migratory Monarch Butterflies Is Currently Insufficient. Front. Ecol. Evol. 8:43. doi: 10.3389/fevo.2020.00043
Received: 29 March 2019; Accepted: 11 February 2020;
Published: 26 February 2020.
Edited by:
Cheryl Schultz, Washington State University Vancouver, United StatesReviewed by:
Stephen Baillie Malcolm, Western Michigan University, United StatesNatalie Kerr, Duke University, United States
Copyright © 2020 Thogmartin, Szymanski and Weiser. This is an open-access article distributed under the terms of the Creative Commons Attribution License (CC BY). The use, distribution or reproduction in other forums is permitted, provided the original author(s) and the copyright owner(s) are credited and that the original publication in this journal is cited, in accordance with accepted academic practice. No use, distribution or reproduction is permitted which does not comply with these terms.
*Correspondence: Wayne E. Thogmartin, d3Rob2dtYXJ0aW5AdXNncy5nb3Y=