 Schuyler B. Pearman-Gillman
 Matthew J. Duveneck
 James D. Murdoch
 Therese M. Donovan
- 1Vermont Cooperative Fish and Wildlife Research Unit, Rubenstein School of Environment and Natural Resources, University of Vermont, Burlington, VT, United States
- 2Harvard Forest, Harvard University, Petersham, MA, United States
- 3Wildlife and Fisheries Biology Program, Rubenstein School of Environment and Natural Resources, University of Vermont, Burlington, VT, United States
- 4U.S. Geological Survey, Vermont Cooperative Fish and Wildlife Research Unit, Rubenstein School of Environment and Natural Resources, University of Vermont, Burlington, VT, United States
In an era of rapid climate and land transformation, it is increasingly important to understand how future changes impact natural systems. Scenario studies can offer the structure and perspective needed to understand the impacts of change and help inform management and conservation decisions. We implemented a scenario-based approach to assess how two high impact drivers of landscape change influence the distributions of managed wildlife species (n = 10) in the New England region of the northeastern United States. We used expert derived species distribution models (SDMs) and scenarios developed by the New England Landscape Futures Project (NELFP) to estimate how species distributions change under various trajectories (n = 5) of landscape change. The NELFP scenarios were built around two primary drivers – Socio-Economic Connectedness (SEC) and Natural Resource Planning and Innovation (NRPI) – and provide plausible alternatives for how the New England region may change over 50 years (2010–2060). Our models generally resulted in species occurrence and richness declines by 2060. The majority of species (7 of 10) experienced declines in regional occurrence for all NELFP scenarios, and one species experienced a projected increase in mean regional occurrence for all scenarios. Our results indicate that the NRPI and SEC drivers strongly influenced projected distribution changes compared to baseline projections. NRPI had a greater impact on distribution change for five species (coyote, moose, striped skunk, white-tailed deer, and wild turkey), while SEC had a greater impact on four species (American black bear, bobcat, raccoon, and red fox); one species (gray fox) was equally influenced by both NRPI and SEC. These results emphasize the importance of integrating both natural resource planning and socio-economic factors when addressing issues of distribution change and offer insights that can inform proactive management and conservation planning.
Introduction
Humans are a dominant driver of landscape change (Vitousek et al., 1997; Díaz et al., 2019). Historical alterations in land use, primarily the conversion of undisturbed forest to other forms of land use like agriculture and urban development, have resulted in the modification of landscapes at a global scale (Foley et al., 2005; Díaz et al., 2019). The rate of landscape modification is accelerating as human-dominated land use continues to expand worldwide (Klein Goldewijk et al., 2011; Seto et al., 2012). More than 30% of the world’s land area is already under some degree of development and over 70% of the all forests are in close proximity (<1 km) to a non-forest edge (Foley et al., 2005; Haddad et al., 2015). With less than 15% of the world’s terrestrial land under protection, natural ecosystems are highly susceptible to modification (UNEP-WCMC and IUCN, 2016).
Natural ecosystems are also exposed to the escalating pressures of shifting climatic conditions due to human activities (Walther et al., 2002; IPCC, 2014). With a global temperature increase of ca. 1°C over the past century and rates of warming nearly doubling over the latter quarter of the century, natural landscapes are subject to climate-induced changes at accelerating rates (IPCC, 2014; Hayhoe et al., 2018). The last three decades alone experienced global surface temperatures that were warmer than any preceding decade since 1850 and collectively represent the warmest 30-year period in the past 1,500 years (IPCC, 2014; Hayhoe et al., 2018).
Land use and climatic shifts can have substantial impacts on wildlife globally (Root et al., 2003; Thomas et al., 2004; Chen et al., 2011; Díaz et al., 2019). Changes in land use and climate can alter the quality and distribution of habitat (e.g., shifting the composition, structure, and configuration of plant communities), availability of food, prevalence of parasites and diseases, and frequency and intensity of physiological stress from heat or drought (Rustad et al., 2012; Díaz et al., 2019). While these changes can have considerable consequences for wildlife, information gaps and uncertainty around climate and land use trajectories currently limit our understanding of how future changes may impact wildlife species.
In the New England region of the northeastern United States (US), which covers six states and nearly 200,000 km2, the recent and historic effects of climatic change and land use are evident for some species. For example, Canada lynx (Lynx canadensis) has experienced a distribution shift toward higher latitude and elevation in response to landscape change and warming conditions (Laliberte and Ripple, 2004; Koen et al., 2014). Similarly, warming climate conditions have benefited parasites like winter tick (Dermacentor albipictus) that have impacted moose (Alces alces) populations by reducing fitness and causing periodic epizootics (>50% die-offs) in some regions (Murray et al., 2006; Jones et al., 2019). With the continued pressures of human population expansion, urban development and sprawl, and warming climate trends, New England’s natural landscapes are expected to experience rapid modification over the next half-century (White et al., 2009; Olofsson et al., 2016; Thompson et al., 2017; Dupigny-Giroux et al., 2018; Duveneck and Thompson, 2019).
Rapidly changing environments present considerable management challenges for federal and state agencies charged with maintaining viable wildlife populations. Across the New England region, wildlife management largely occurs at the state-level, and is characterized by different strategies for different species, which creates challenges for broader-scale conservation planning (Aycrigg et al., 2016; McBride et al., 2017). Scenario-based planning offers an approach to better understand the larger-scale impacts of change that can lead to more effective and proactive decision-making for species (Carpenter and Folke, 2006; Thompson et al., 2016). In New England, studies have been initiated to improve understanding and anticipate future trajectories of land-use and natural infrastructure (McBride et al., 2017; McGarigal et al., 2017; Thompson et al., 2017; Duveneck and Thompson, 2019). For example, the Designing Sustainable Landscapes project developed a Landscape Change, Assessment and Design model to simulate current trends scenarios for landscape change in the northeastern US and assess the associated ecological impacts (McGarigal et al., 2017).
Another study, the New England Landscape Futures Project (NELFP), developed five scenarios that simulate different landscape futures for the New England region. Led by the Harvard Forest Long-Term Ecological Research program and the Scenarios, Services, and Society Research Coordination Network, this study simulated future conditions based on recent trends (Thompson et al., 2017; Duveneck and Thompson, 2019), and four alternative scenarios of landscape change (Thompson et al., 2019). The alternative scenarios were built around two uncertain, yet highly influential drivers of landscape change: Natural Resource Planning and Innovation (NRPI) and Socio-Economic Connectedness (SEC; McBride et al., 2017; Thompson et al., 2019). The NRPI driver provides the extent to which the government and private sector invest in proactive land-use planning, ecosystem services, and technological advances for resource use, primarily land, energy, and water. The SEC driver provides the extent of local or global connectivity in population migration, culture, economic markets, trade policy, goods and services, and climate policy. These drivers form the basis for the four alternative scenarios to the continuation of recent trends (i.e., the “Business-As-Usual” scenario): “Connected Communities,” “Yankee Cosmopolitan,” “Go It Alone,” and “Growing Global.” The NELFP scenarios were collaboratively designed by stakeholders, simulation modelers, and researchers throughout New England and provide plausible trajectories of landscape change that incorporate informed simulations of climate, development, and agriculture, as well as forest structure and composition. However, wildlife species have not been assessed in the context of these scenarios.
Given the recent rates of landscape change in the New England region, combined with extensive evidence that changing climate, human expansion, and land transformation can have negative consequences for many wildlife species, decision-makers are faced with two crucial and unresolved questions: (1) How will changing climate and landscape conditions impact the future viability and distribution of the region’s wildlife species? (2) How do social drivers, such as NRPI or SEC, influence species distribution change in a future New England landscape? With uncertainty around natural resource planning, innovation and socio-economic factors, we need a systematic approach that addresses these questions and advances our understanding of the complex, dynamic systems that affect wildlife. Approaching these questions proactively may (1) lead to more efficient, cost effective and sustainable conservation and management practices, (2) improve the state of biodiversity and natural systems, and (3) help protect iconic species and the benefits they offer to humans and society (Güneralp et al., 2013). By considering forecasted shifts in species distributions, wildlife agencies can plan for long-term conservation at multiple spatial and temporal scales.
We addressed these questions by evaluating how climate change and different trajectories of land-use may influence a group of commonly managed wildlife species in the New England region. We used expert-derived species distribution models (SDMs) developed by Pearman-Gillman et al. (2020) and the NELFP scenarios to: (1) estimate and map the future distributions of 10 focal wildlife species under five alternative scenarios, and assess regional species richness patterns, (2) quantify changes in species distributions under each scenario, and (3) compare distribution change across scenarios to quantify the impacts of SEC and NRPI, and identify the drivers with the greatest potential influence on individual and multi-species change.
Materials and Methods
Study Area
The study area encompassed the six New England states (Connecticut, Rhode Island, Massachusetts, Vermont, New Hampshire, and Maine) in the northeastern US (Figure 1). The region spans 186,458 km2 with topography ranging from coastal plains to mountain peaks reaching nearly 2,000 m above sea level. Climatic conditions vary by season and geographic location throughout the region. Long-term climate records indicate an average annual precipitation of 104 cm (range: 79–255 cm) and a mean regional temperature ranging from 6°C (January) to 19°C (July) (Huntington et al., 2009).
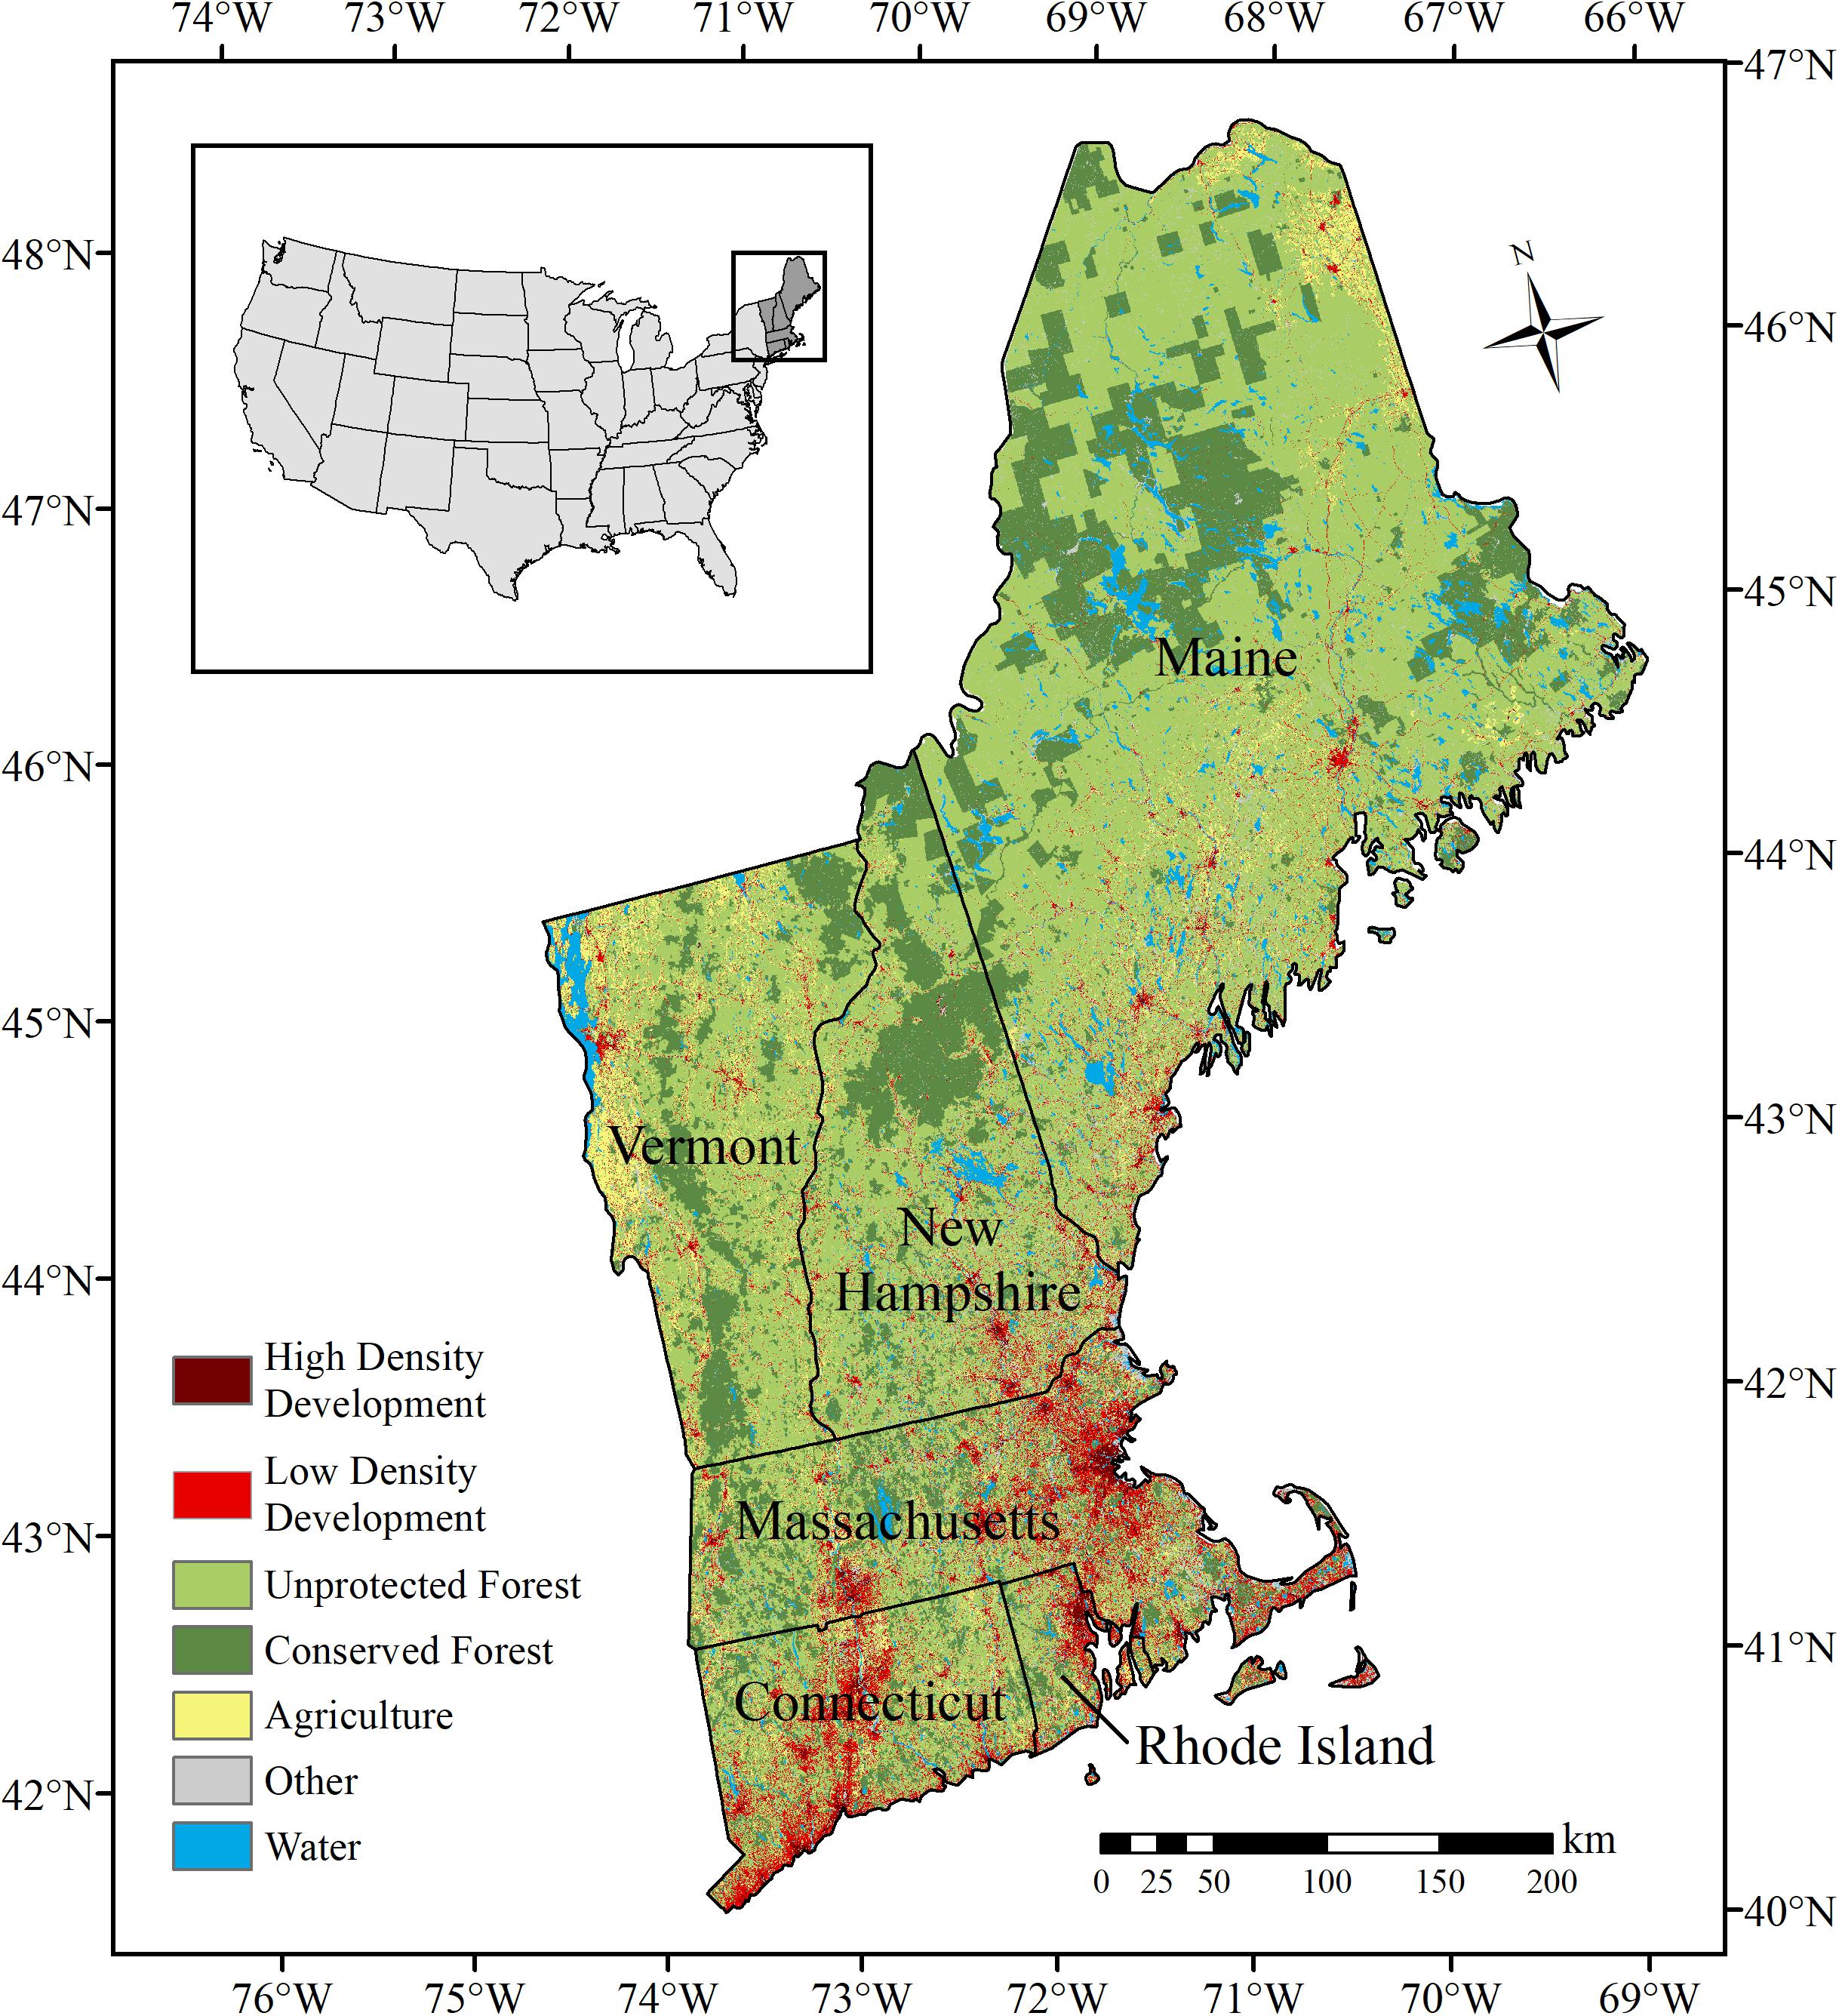
Figure 1. Map of the study region located in the northeastern United States. The study region included the six New England states: Connecticut, Maine, Massachusetts, New Hampshire, Rhode Island, and Vermont.
The New England region supports a growing human population (14,845,063 in 2019) with three-quarters of the population concentrated in the regions major metropolitan areas (U.S. Census Bureau, 2019). The uneven distribution of people contributes to regional variability in land use patterns and intensities with large population centers in the south and more rural undeveloped landscapes in the north. Currently, approximately 80% of the region is covered by forest (Foster et al., 2010). Forested regions are ecologically diverse with areas dominated by northern hardwood, spruce-fir, oak-hickory, and pitch pine forest types (Brooks et al., 1992; Duveneck et al., 2015). Development (9.3%), agriculture (5.9%), and water (12.3%) also cover large portions of the New England landscape (Homer et al., 2015).
Focal Species
We focused our analysis on harvested wildlife species (n = 10) that occur widely throughout the region. This group includes nine mammals: American black bear (Ursus americanus), Bobcat (Lynx rufus), Coyote (Canis latrans), Gray fox (Urocyon cinereoargenteus), Moose (Alces alces), Raccoon (Procyon lotor), Red fox (Vulpes vulpes), Striped skunk (Mephitis mephitis), and White-tailed deer (Odocoileus virginianus); and one bird species: Wild turkey (Meleagris gallopavo). We selected these species because they are largely the emphasis of wildlife management at the state-level. Game species are important economically and culturally as they are harvested and often sought by wildlife watchers. Several of these species also exert large ecological effects on ecosystems, such as moose and deer (Jones et al., 1994; Pastor et al., 1998; Horsley et al., 2003).
Objective 1 – Map Species Future Distributions
Distribution Models
We used SDMs developed by Pearman-Gillman et al. (2020) to estimate and map distributions of the focal species. SDMs are often developed using presence-only data (e.g., animal locations) and relate environmental conditions to a measure of occurrence. For example, programs such as Maxent and BIOCLIM use presence-only data to model occurrence and map distribution across a landscape (Phillips et al., 2006; Franklin, 2010; Booth et al., 2014). Here, we used an alternative method that developed models from probability of occurrence data obtained through expert elicitation techniques, as outlined by James et al. (2010). Expert opinion based models have been used to estimate occupancy and map distribution for a variety of species and contexts (e.g., Pearce et al., 2001; Yamada et al., 2003; Mouton et al., 2009; Murray et al., 2009; Aylward et al., 2018). Developing SDMs from expert opinion data (occurrence estimates) can help overcome some of the limitations of presence-only modeling approaches, and yield models that capture the influence of climate and land use on regional wildlife dynamics (e.g., Pearce et al., 2001; Murray et al., 2008). For details about the expert elicitation model development for this study, see Pearman-Gillman et al. (2020). Briefly, we used the online survey tool, AMSurvey1, to elicit expert opinion data on the probability of occurrence of each focal species throughout the New England region. We then used mixed-model methods and stepwise model selection (Zar, 1999; Burnham and Anderson, 2002; Bates et al., 2014) to develop a model for each species that predicted probability of occurrence as a function of landscape and climate variables (Table 1). Models included random effects that accounted for expert-to-expert variation in responses, and fixed effects that were identified in the literature, selected by experts, or were highly correlated with perceived occurrence (Tables 2, 3). Validation tests using independent data indicated that the models performed well at predicting species occurrence across the New England region (Pearman-Gillman et al., 2020).
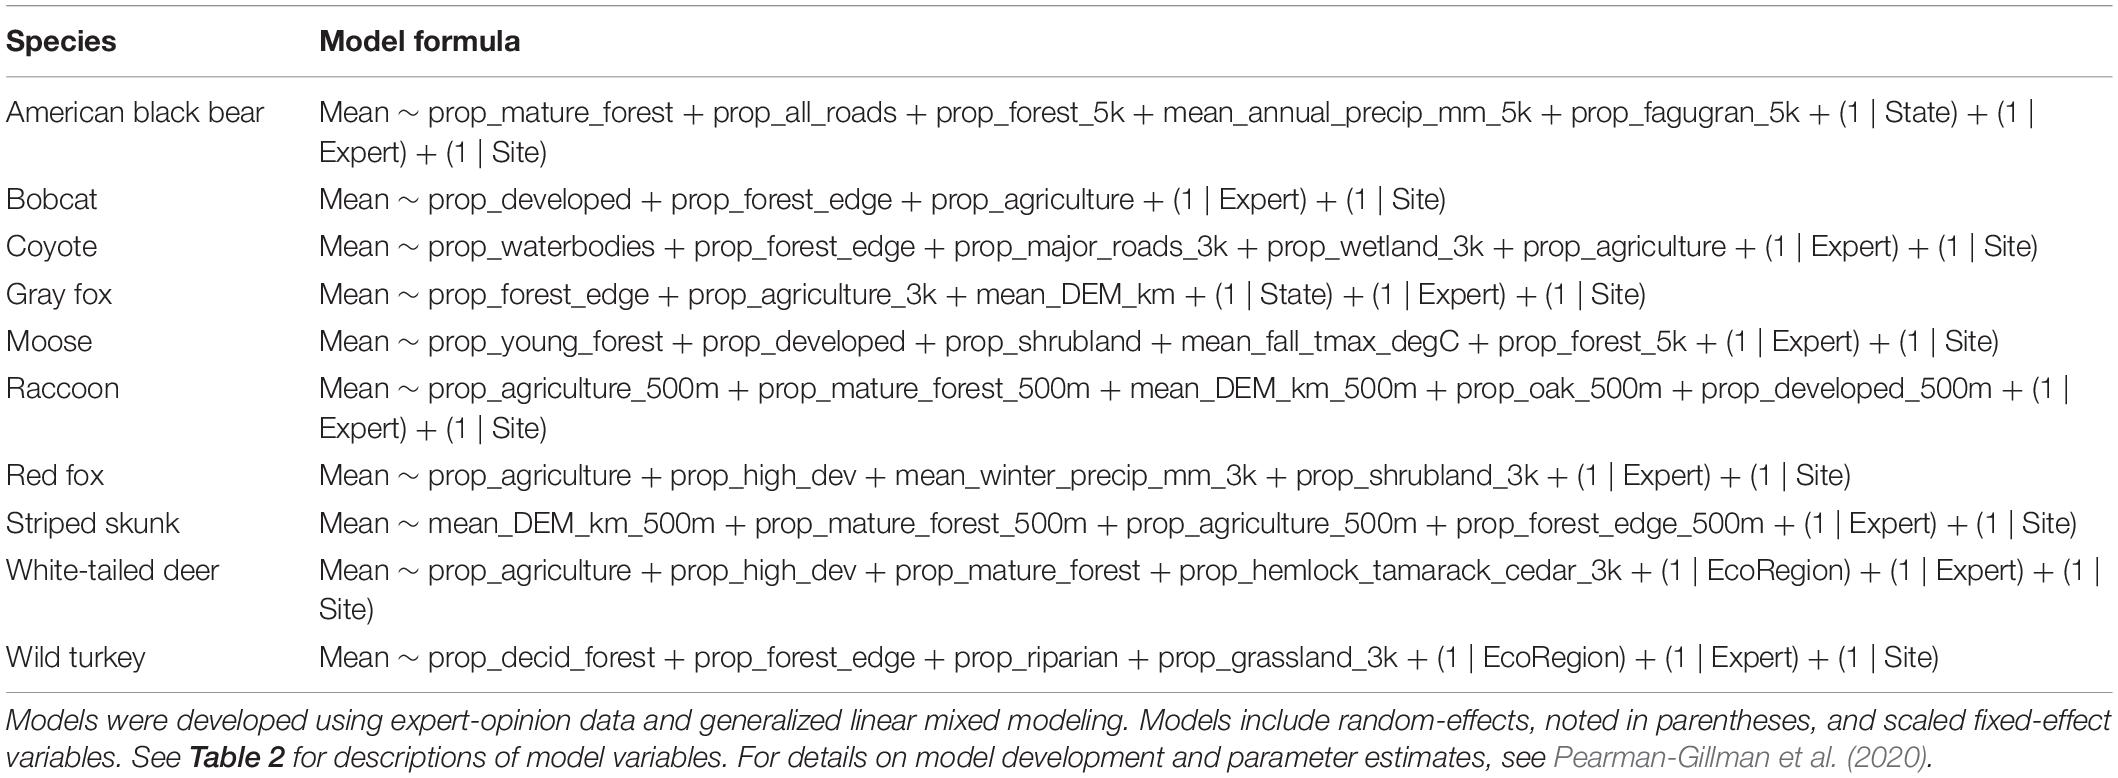
Table 1. Species distribution models (SDMs) used to map distributions for 10 wildlife species and estimate changes in distribution across the New England region of the northeastern United States.
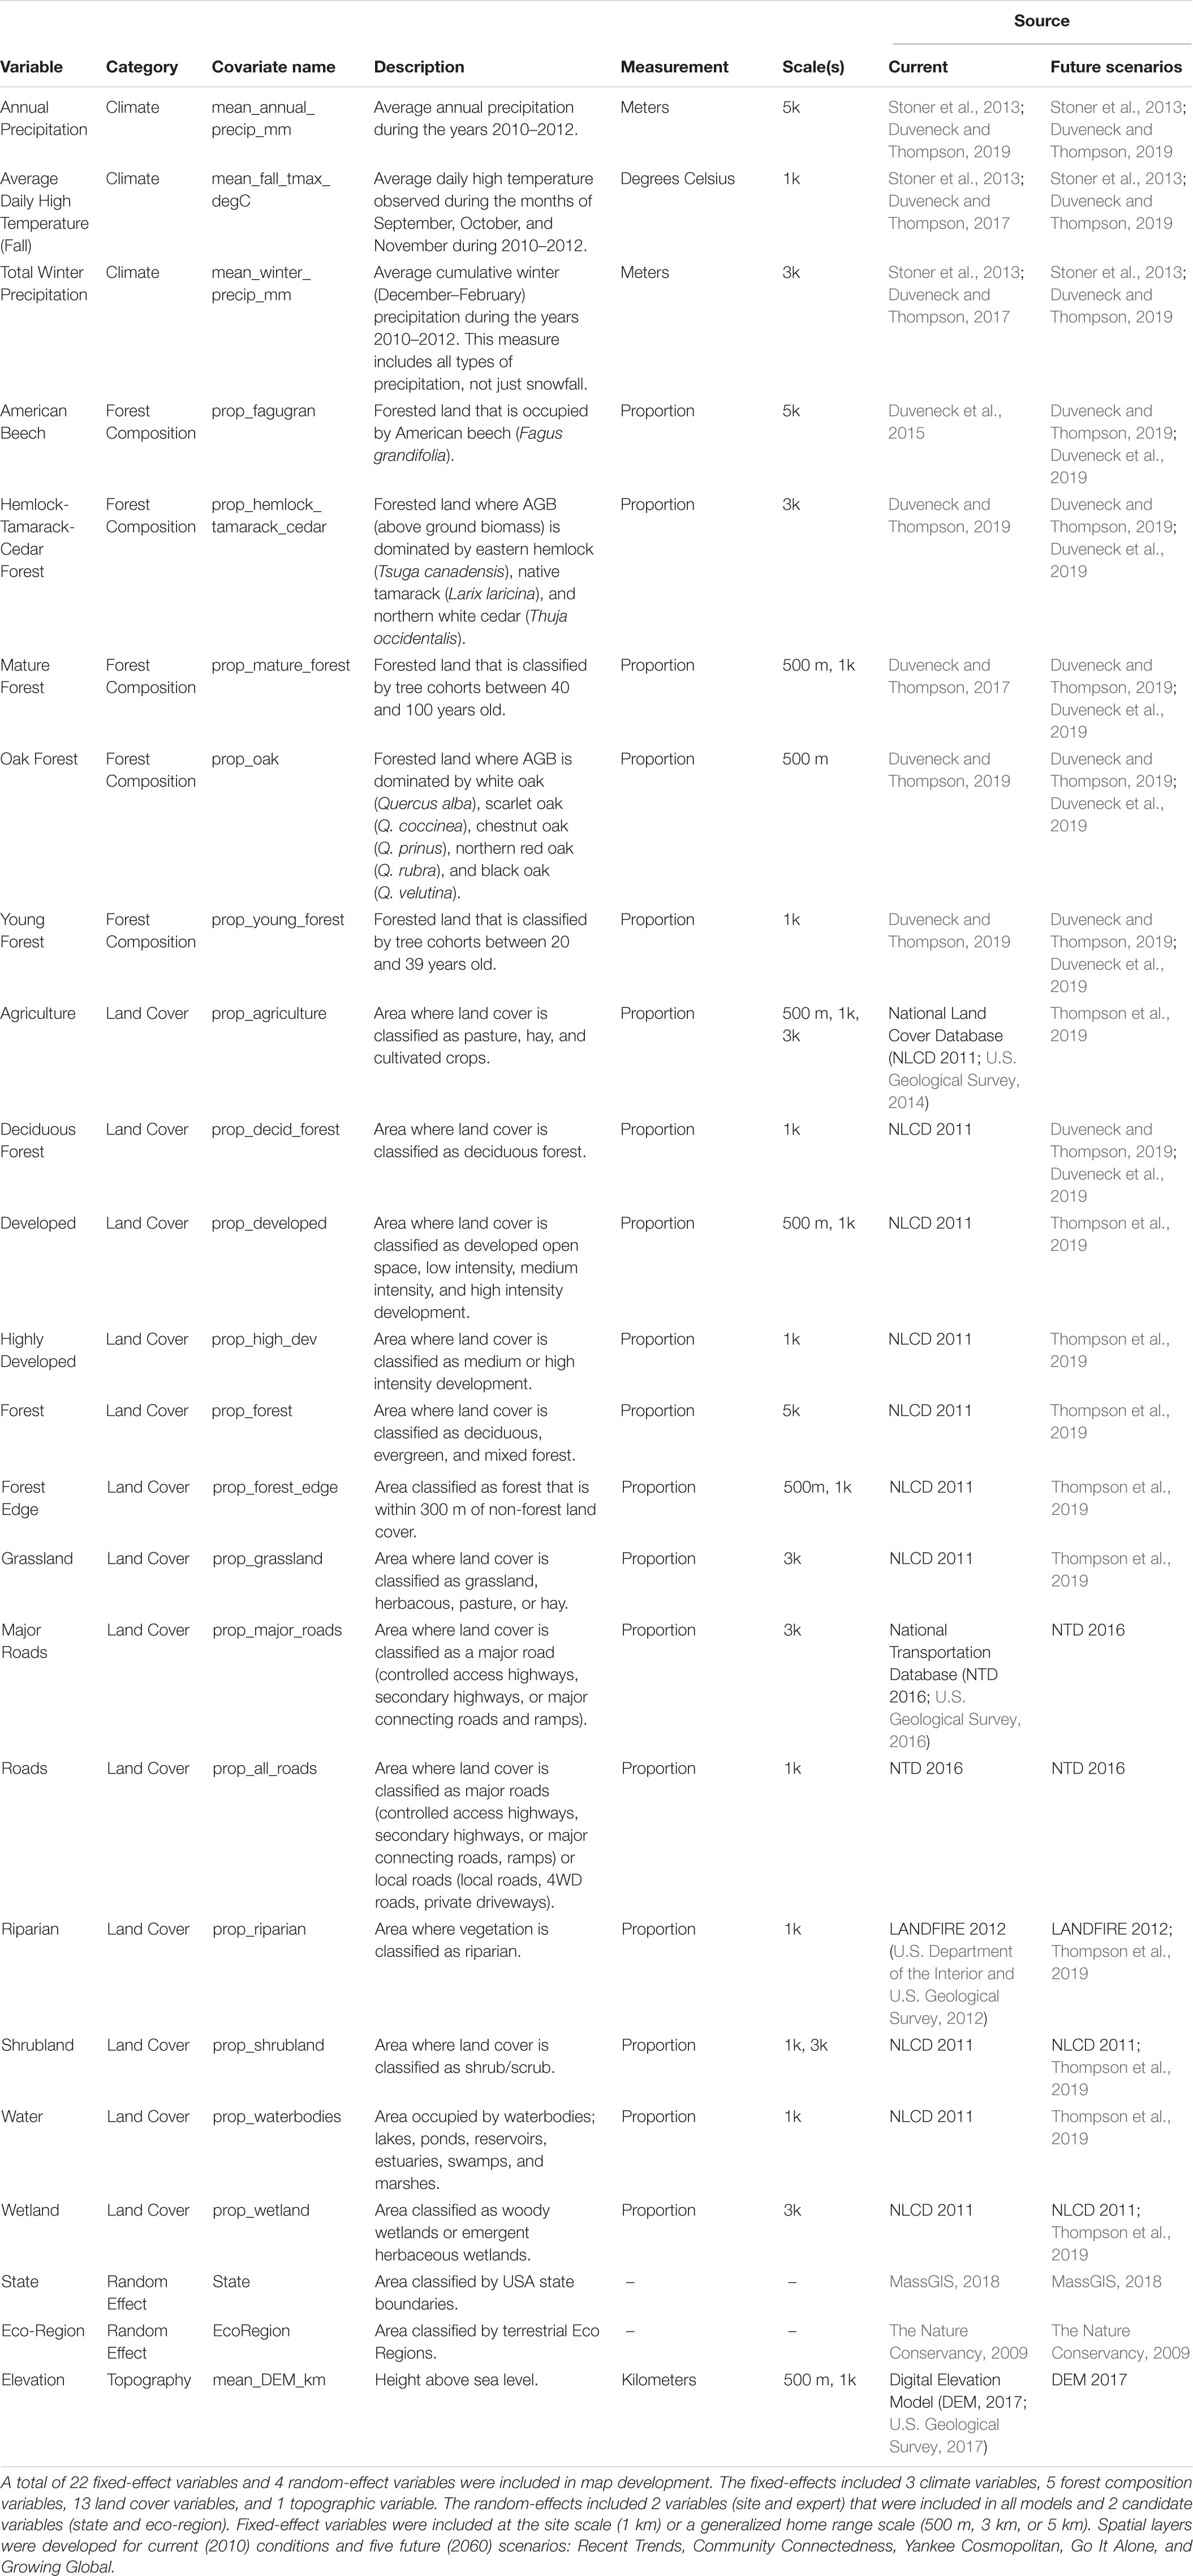
Table 2. Variables and associated spatial (raster) layers used in the development of wildlife species distribution models and maps across the New England region of the northeastern United States.
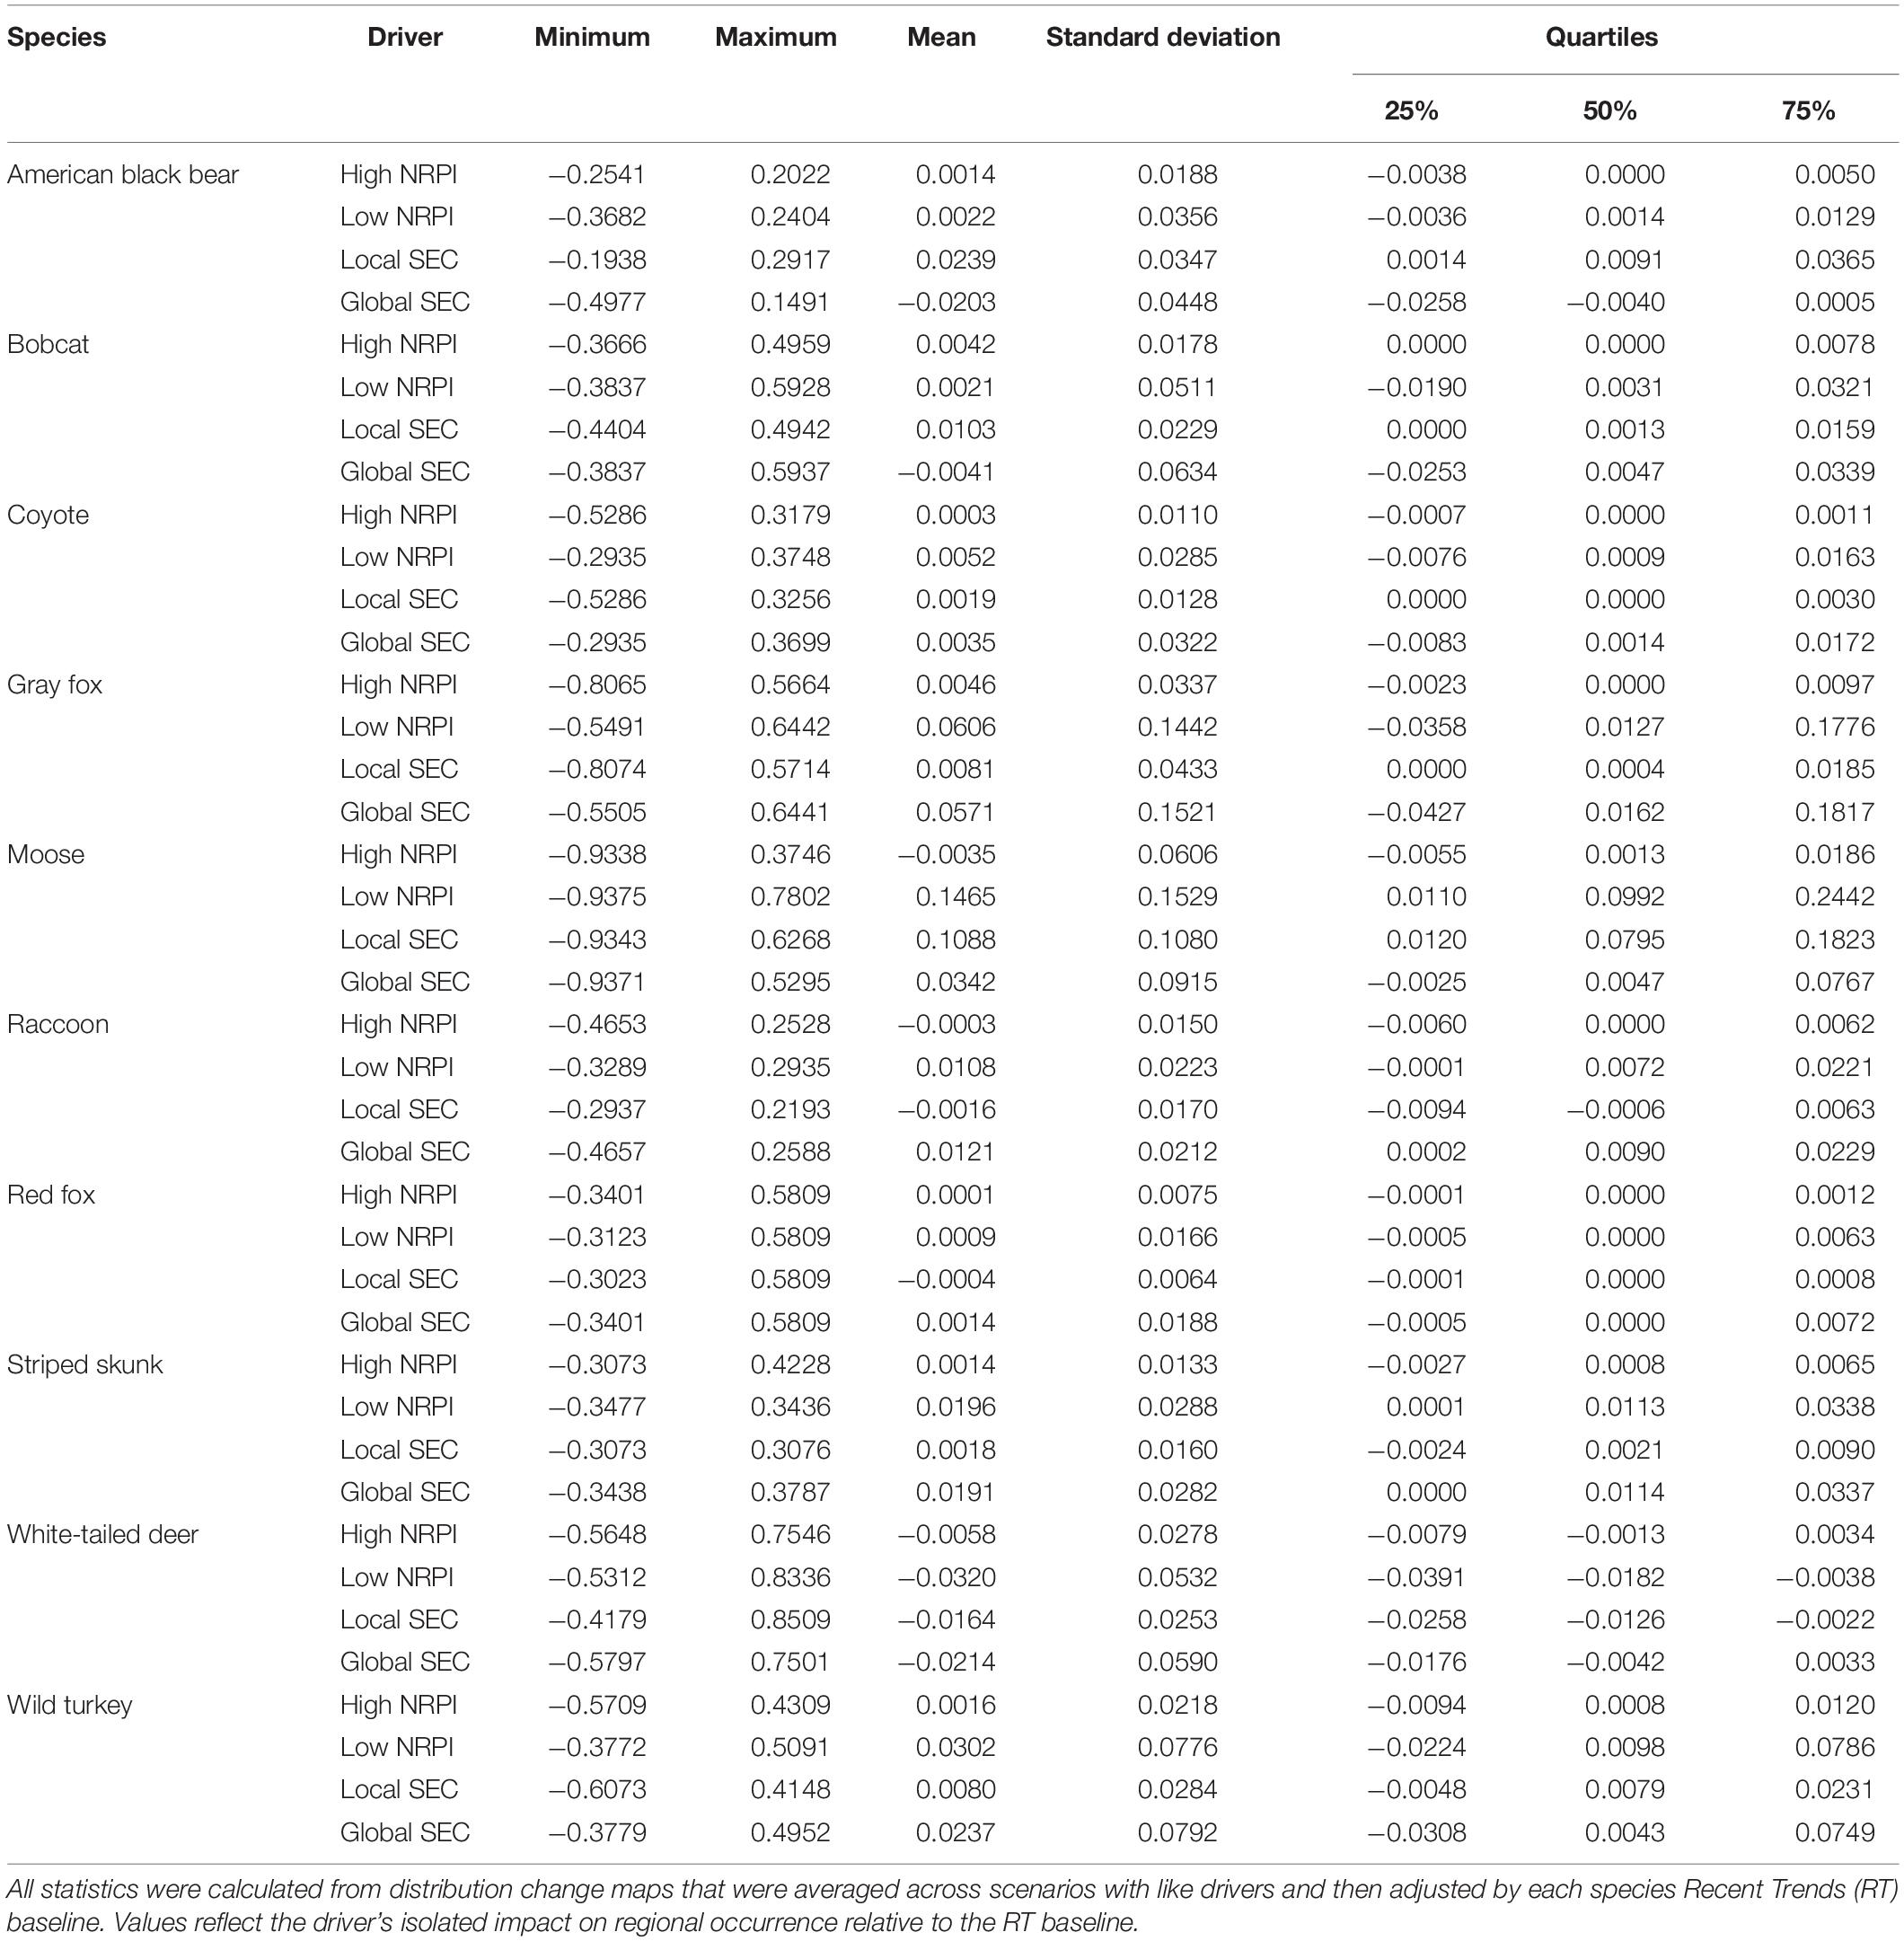
Table 3. Species-specific summary statistics for the two primary scenario drivers, Natural Resource Planning and Innovation (NRPI, High or Low) and Socio-Economic Connectedness (SEC, Global or Local).
Scenario Simulations
To estimate species distributions under projected conditions, we applied each SDM to the Recent Trends scenario and the four NELFP scenarios (McBride et al., 2017; Thompson et al., 2019), each defined by their degree of Natural Resource Planning and Innovation (NRPI) and Socio-Economic Connectedness (SEC). For details about the NELFP scenario development process, detailed scenario descriptions, and scenario figures, see McBride et al. (2017) and Thompson et al. (2019). A summary of each scenario is described below:
(1) Recent Trends (Business-As-Usual). This scenario represents a baseline projection extended from the region’s contemporary circumstances. It depicts the linear continuation of New England’s recent trends in the rate and spatial patterns of landscape change. This scenario offers a baseline for evaluating the other scenarios of change.
(2) Connected Communities (High NRPI and Local SEC). In this scenario, the New England population has slowly increased over the past 50 years and communities are coping with climate change by anchoring in place, making local culture and the protection of local resources important government and community priorities. Concerns about global unrest and the environmental impacts of global trade led New England communities toward a more community-focused lifestyle. Strengthened local relations and advances in local green energy contribute to more self-reliant communities. Heightened community interest and public policies protected wildlands, strengthened local economies and fueled growing local markets (primarily local food, wood, and recreation).
(3) Yankee Cosmopolitan (High NRPI and Global SEC). This scenario describes a future in which New England remains relatively resilient to climate change, has become a leader in research and technology, and subsequently experienced substantial population growth. The region’s population has largely grown due to an influx of international migrants seeking areas less vulnerable to the effects of climate change (e.g., heat, drought, sea-level rise). As a world leader in biotech and engineering, New England has a large demand for a skilled labor work force and established itself as a major center of economic and population growth within the U.S. Most development has occurred in urban areas with sprawl occurring as populations grow faster than the infrastructure can support. In a globally connected world, the region relies on imports for most food products. With a global shift toward sustainability, New England has invested in land protection, ecosystem services, and its carbon storing forests.
(4) Growing Global (Low NRPI and Global SEC). In this scenario, New England has remained relatively sheltered from the effects of climate change and has become a desirable location for migrants seeking more environmentally stable areas. This has led to population and development increases that have outpaced local planning efforts and contributed to city sprawl, haphazard expansion of development, poor transportation infrastructure and inefficient energy use. Underprepared government entities have struggled to support the region’s growing population leading to higher levels of privatized municipal services, limited natural resource planning and sharp declines in land protection. With trade barriers lifted, global trade has amplified and the U.S. has experienced a surge in the production and export of commodity crops. Increased agriculture, development and growing biofuel markets have increased the degradation and conversion of New England’s forested land. Globalization and increased transportation demands have strengthened a global reliance on conventional and cheap energy sources (fossil fuels). With little innovation and no global commitment to climate action, the world remains divided on issues of climate change and renewable energy.
(5) Go It Alone (Low NRPI and Local SEC). This scenario describes a New England with fairly low economic opportunity, population growth, and land development. A lack of global economic connectivity, tightened national borders, and reductions in national budgets have limited the nation’s ability to deal with unemployment, demographic change, and climate resilience. Global efforts at climate adaptation have failed and conventional energy sources still dominate. In New England, the lack of regulation decreased natural resources protection, technological innovation and availability of goods and municipal services. With reduced access to global energy markets, failure to launch new energy development projects and the degradation of conventional energy infrastructure, the price of energy has continued to rise. Increased energy and export expenses have reduced timber harvesting and commercial agriculture contributing to economic collapse. New residential developments lack appropriate planning and most public authorities lack the funds to maintain critical infrastructure such as roads and sewers. High energy costs, poor infrastructure planning and failure to fund climate change adaption has left communities isolated and heavily reliant on local resources. Poor planning and extractive use have significantly degraded the region’s ecosystem services and considerably decreased quality of life.
Each scenario narrative was translated into spatial patterns of change using methods described by Thompson et al. (2017, 2019) and Duveneck and Thompson (2019). Briefly, these simulations were developed in two stages: first using a spatially explicit cellular land change model, Dinamica Environment for Geoprocessing Objects (Dinamica EGO 2.4.1; Soares-Filho et al., 2009) and second using a forest landscape succession model, LANDIS-II v6.2 (Scheller et al., 2007). Dinamica was used to simulate 50 years (2010–2060) of forest loss, land-use change, and land protection relative to the underlying narrative of each NELFP scenario. This process produced scenario specific land cover spatial layers (30 × 30 m) for forest, agriculture, high density development, and low density development (Thompson et al., 2017, 2019). Using these land cover spatial layers, a LANDIS-II forest simulation was run on all forest pixels for each scenario from 2010 to 2060 to simulate the growth, dispersal, and mortality of 32 individual tree species (Duveneck and Thompson, 2019). Climate change was incorporated into each scenario using climate projections (i.e., monthly maximum temperature, minimum temperature, and precipitation) based on the assumptions of the Representative Concentration Pathway (RCP) 8.5 emission scenario (IPCC, 2013) as simulated by to the Hadley Global Environment Model v.2-Earth System (HADGE) Global Circulation Model (GCM). This climate future includes an increase in temperature and slight increase in precipitation in New England by 2060. Much larger changes in climate are expected beyond 2060 (IPCC, 2014). Indeed, the effects of climate in these simulations were largely outweighed by the effects of land use (Duveneck and Thompson, 2019). The LANDIS-II simulations included changes in forest composition relative to a warming climate, development, and harvest patterns for the Recent Trends (RT) scenario (Duveneck and Thompson, 2019) and each alternative NELFP scenario. The resulting above-ground biomass layers by tree species were used for modeling wildlife distributions (see below). Additional spatial layers utilized came from the HADGE GCM simulated climate data, Dinamica land cover outputs, and recent conditions land cover data (see Table 2).
Mapping Projected Species Distributions
We applied the SDMs to the simulated spatial layers generated for each NELFP scenario (Table 2) to map the future distributions of each species in New England. Species distribution maps were generated for each scenario by (1) multiplying the scenario’s covariate rasters by the corresponding SDM coefficients for a given species, then (2) summing the resulting raster layers to obtain logit scores for every pixel, and (3) transforming the logits to create a raster of occurrence probabilities. This process generated species-specific distribution maps for each scenario (n = 5). We also created species richness maps by stacking the 10 individual species rasters and summing the values in each pixel to generate an index of species richness for each future scenario (Sauer et al., 2013). Richness values could potentially vary from 0 (no species present) to 10 (all species present). We developed distribution maps and species richness maps using the raster package (Hijmans, 2016) in the statistical computing software, R (R Core Team, 2019).
Objective 2 – Quantify Scenario-Specific Distribution Change
Scenario-specific distribution maps were compared against current distribution maps to estimate shifts (i.e., recession or expansion) in regional distributions. We compared each species’ current distribution (Pearman-Gillman et al., 2020) to each scenario’s projected distribution. Current distribution map pixels were subtracted from superimposed projected distribution map pixels to calculate values of projected change. Pixels with negative distribution change values represented locations of declining species occurrence and pixels with positive values represented locations of increasing occurrence.
Objective 3 – Compare the Impacts of NRPI and SEC on Wildlife Species
Isolating Driver Impacts
Each NELFP scenario was built around two directional drivers of land use change: NRPI (high or low) and SEC (global or local). For each species, we combined (averaged) distribution change information across scenarios with a common directional driver, marginalizing the influence of the second driver. For example, to obtain a distribution shift under the High NRPI driver, we averaged the two High NRPI scenarios (Yankee Cosmopolitan and Connected Communities), marginalizing over the directional SEC drivers. As a second example, to obtain a distribution shift for each species under the Local SEC driver, we averaged the two Local SEC scenarios (Go It Alone and Connected Communities), marginalizing over the directional NRPI drivers. We used this process to provide comparative baselines for NELFP’s two primary drivers of land use change. Next, we subtracted the RT values from the isolated driver maps to account for forecasted baseline changes over the 50-year period, effectively removing the external factors of change that were not a product of shifts produced by the NRPI or SEC drivers. The resulting maps depict the potential influence of each driver on species occurrence and identify areas where species benefited from high or low investment in innovation and natural resources, or were most vulnerable to globalized or localized growth.
Quantify and Compare Drivers
We calculated descriptive statistics (minimum, maximum, mean, standard deviation, and quartiles) across each isolated driver landscape to quantify the effect each driver had on species occurrence. This provided comparable statistics and allowed us to assess how and to what degree the NRPI and SEC drivers are expected to impact wildlife in the future. As a final comparison, we calculated the absolute difference that NRPI and SEC had on species occurrence (i.e., the difference between high and low NRPI and global and local SEC). This allowed for quantitative comparisons between the two primary drivers of change and indicated which driver may have a greater impact on the focal wildlife species.
Results
Objective 1 and 2 – Future Distributions and Projected Distribution Change
The projected distribution maps varied among species and the five scenarios. For all species but one (red fox), average regional occurrence likelihoods were projected to decline under nearly all scenarios by 2060 (see Supplementary Figure S1, for individual species maps). The locations and overall extent of distribution decline varied among species and scenarios. Generally, focal species distributions shifted away from areas of potential development expansion (largely in the southern New England states), and remained relatively stable in the northern and central regions of New England where less development was projected and timber harvest, forest management, and agriculture were largely driving landscape change (Supplementary Figure S1).
Projected declines in species occurrence probabilities were accompanied by declines in focal species richness. A regional average focal species richness (μs) of 7.16 was estimated for the New England landscape in 2010 representing current conditions (Figure 2A). All future scenarios at 2060 projected lower focal species richness than was estimated for current conditions (Figures 2B–F). Of the future scenarios, average regional focal species richness was lowest under the Yankee Cosmopolitan (YC; μs = 6.44, a 10.1% decline) and RT (μs = 6.54, an 8.7% decline) scenarios (Figure 2). The Growing Global (GG) scenario had the highest average regional focal species richness (μs = 6.84, a 4.4% decline), followed by Go It Alone (GA; μs = 6.72, a 6.2% decline) and Connected Communities (CC; μs = 6.64, a 7.2% decline; Figure 2).
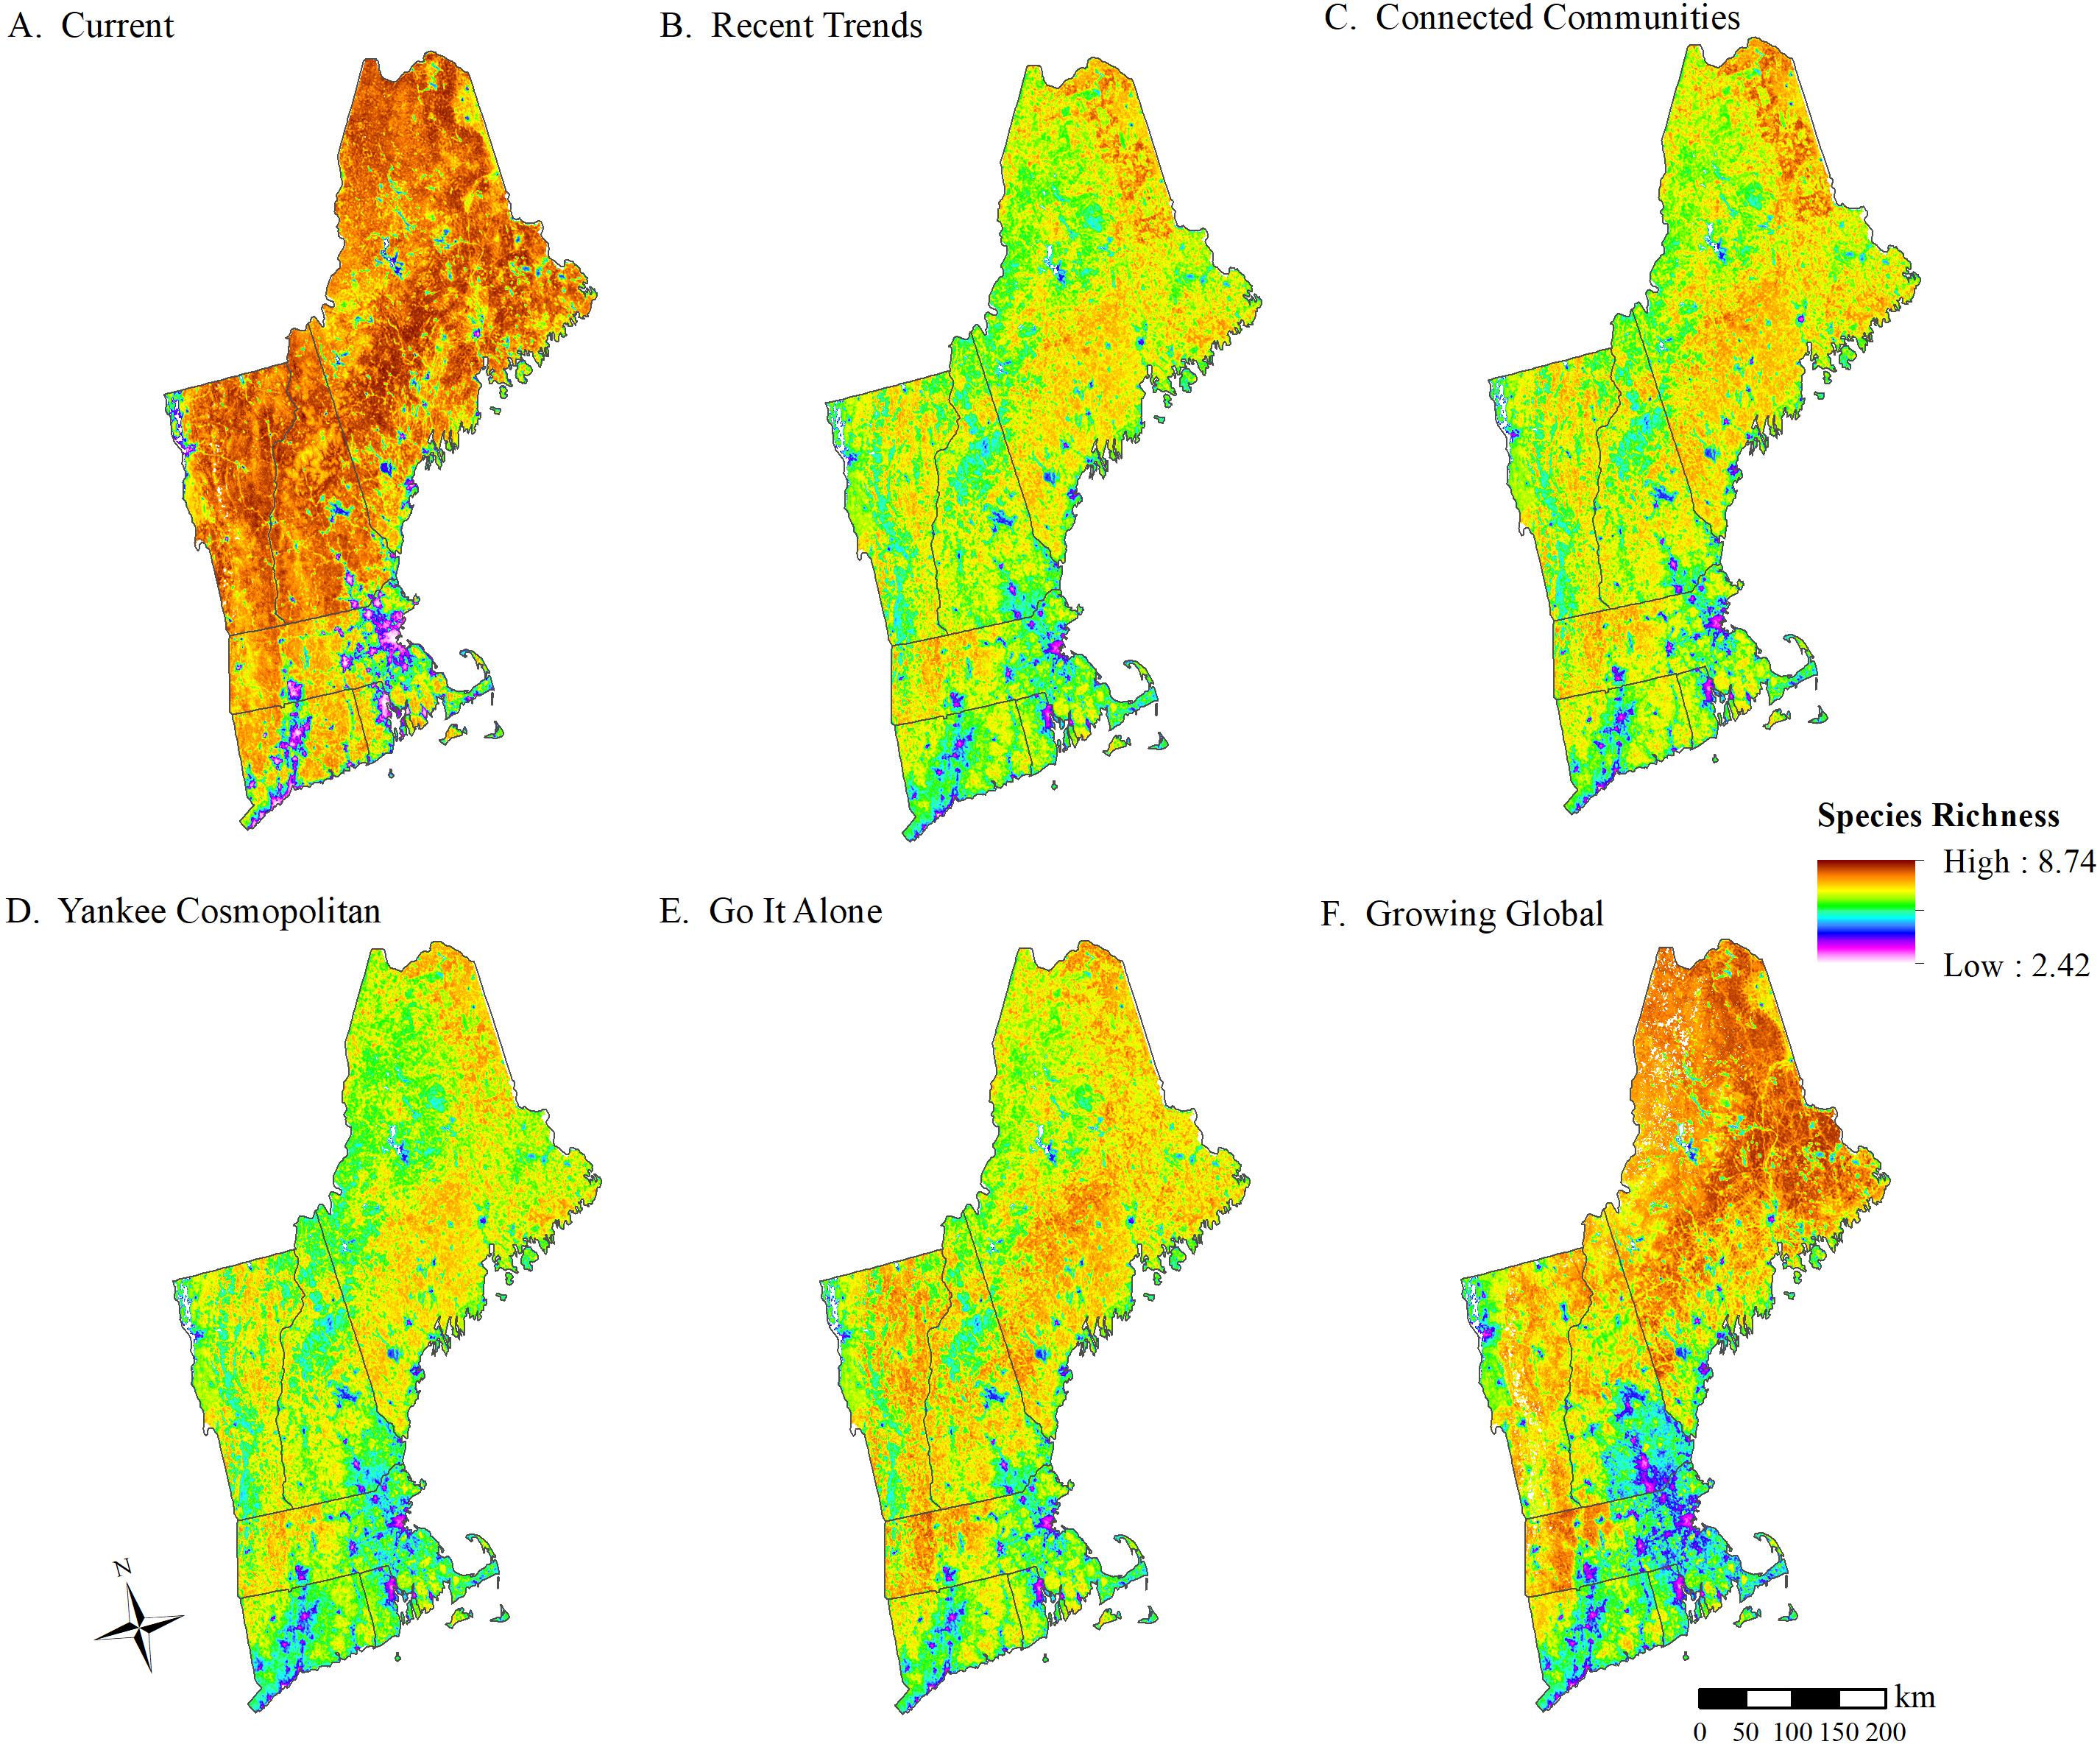
Figure 2. Focal wildlife species richness across New England as projected by (A) current (2010) conditions, and each of the NELFP scenarios at year 2060: (B) Recent Trends, (C) Connected Communities, (D) Yankee Cosmopolitan, (E) Go It Alone, and (F) Growing Global.
For individual species, the greatest distribution declines across scenarios were projected for American black bear, gray fox, moose, and wild turkey (Figure 3). Considerably lower levels of decline were observed for bobcat, raccoon, and striped skunk, and minimal declines in mean regional occurrence were projected for coyote and white-tailed deer (Figure 3). An increase in regional occurrence was projected for red fox across all scenarios (Figure 3G).
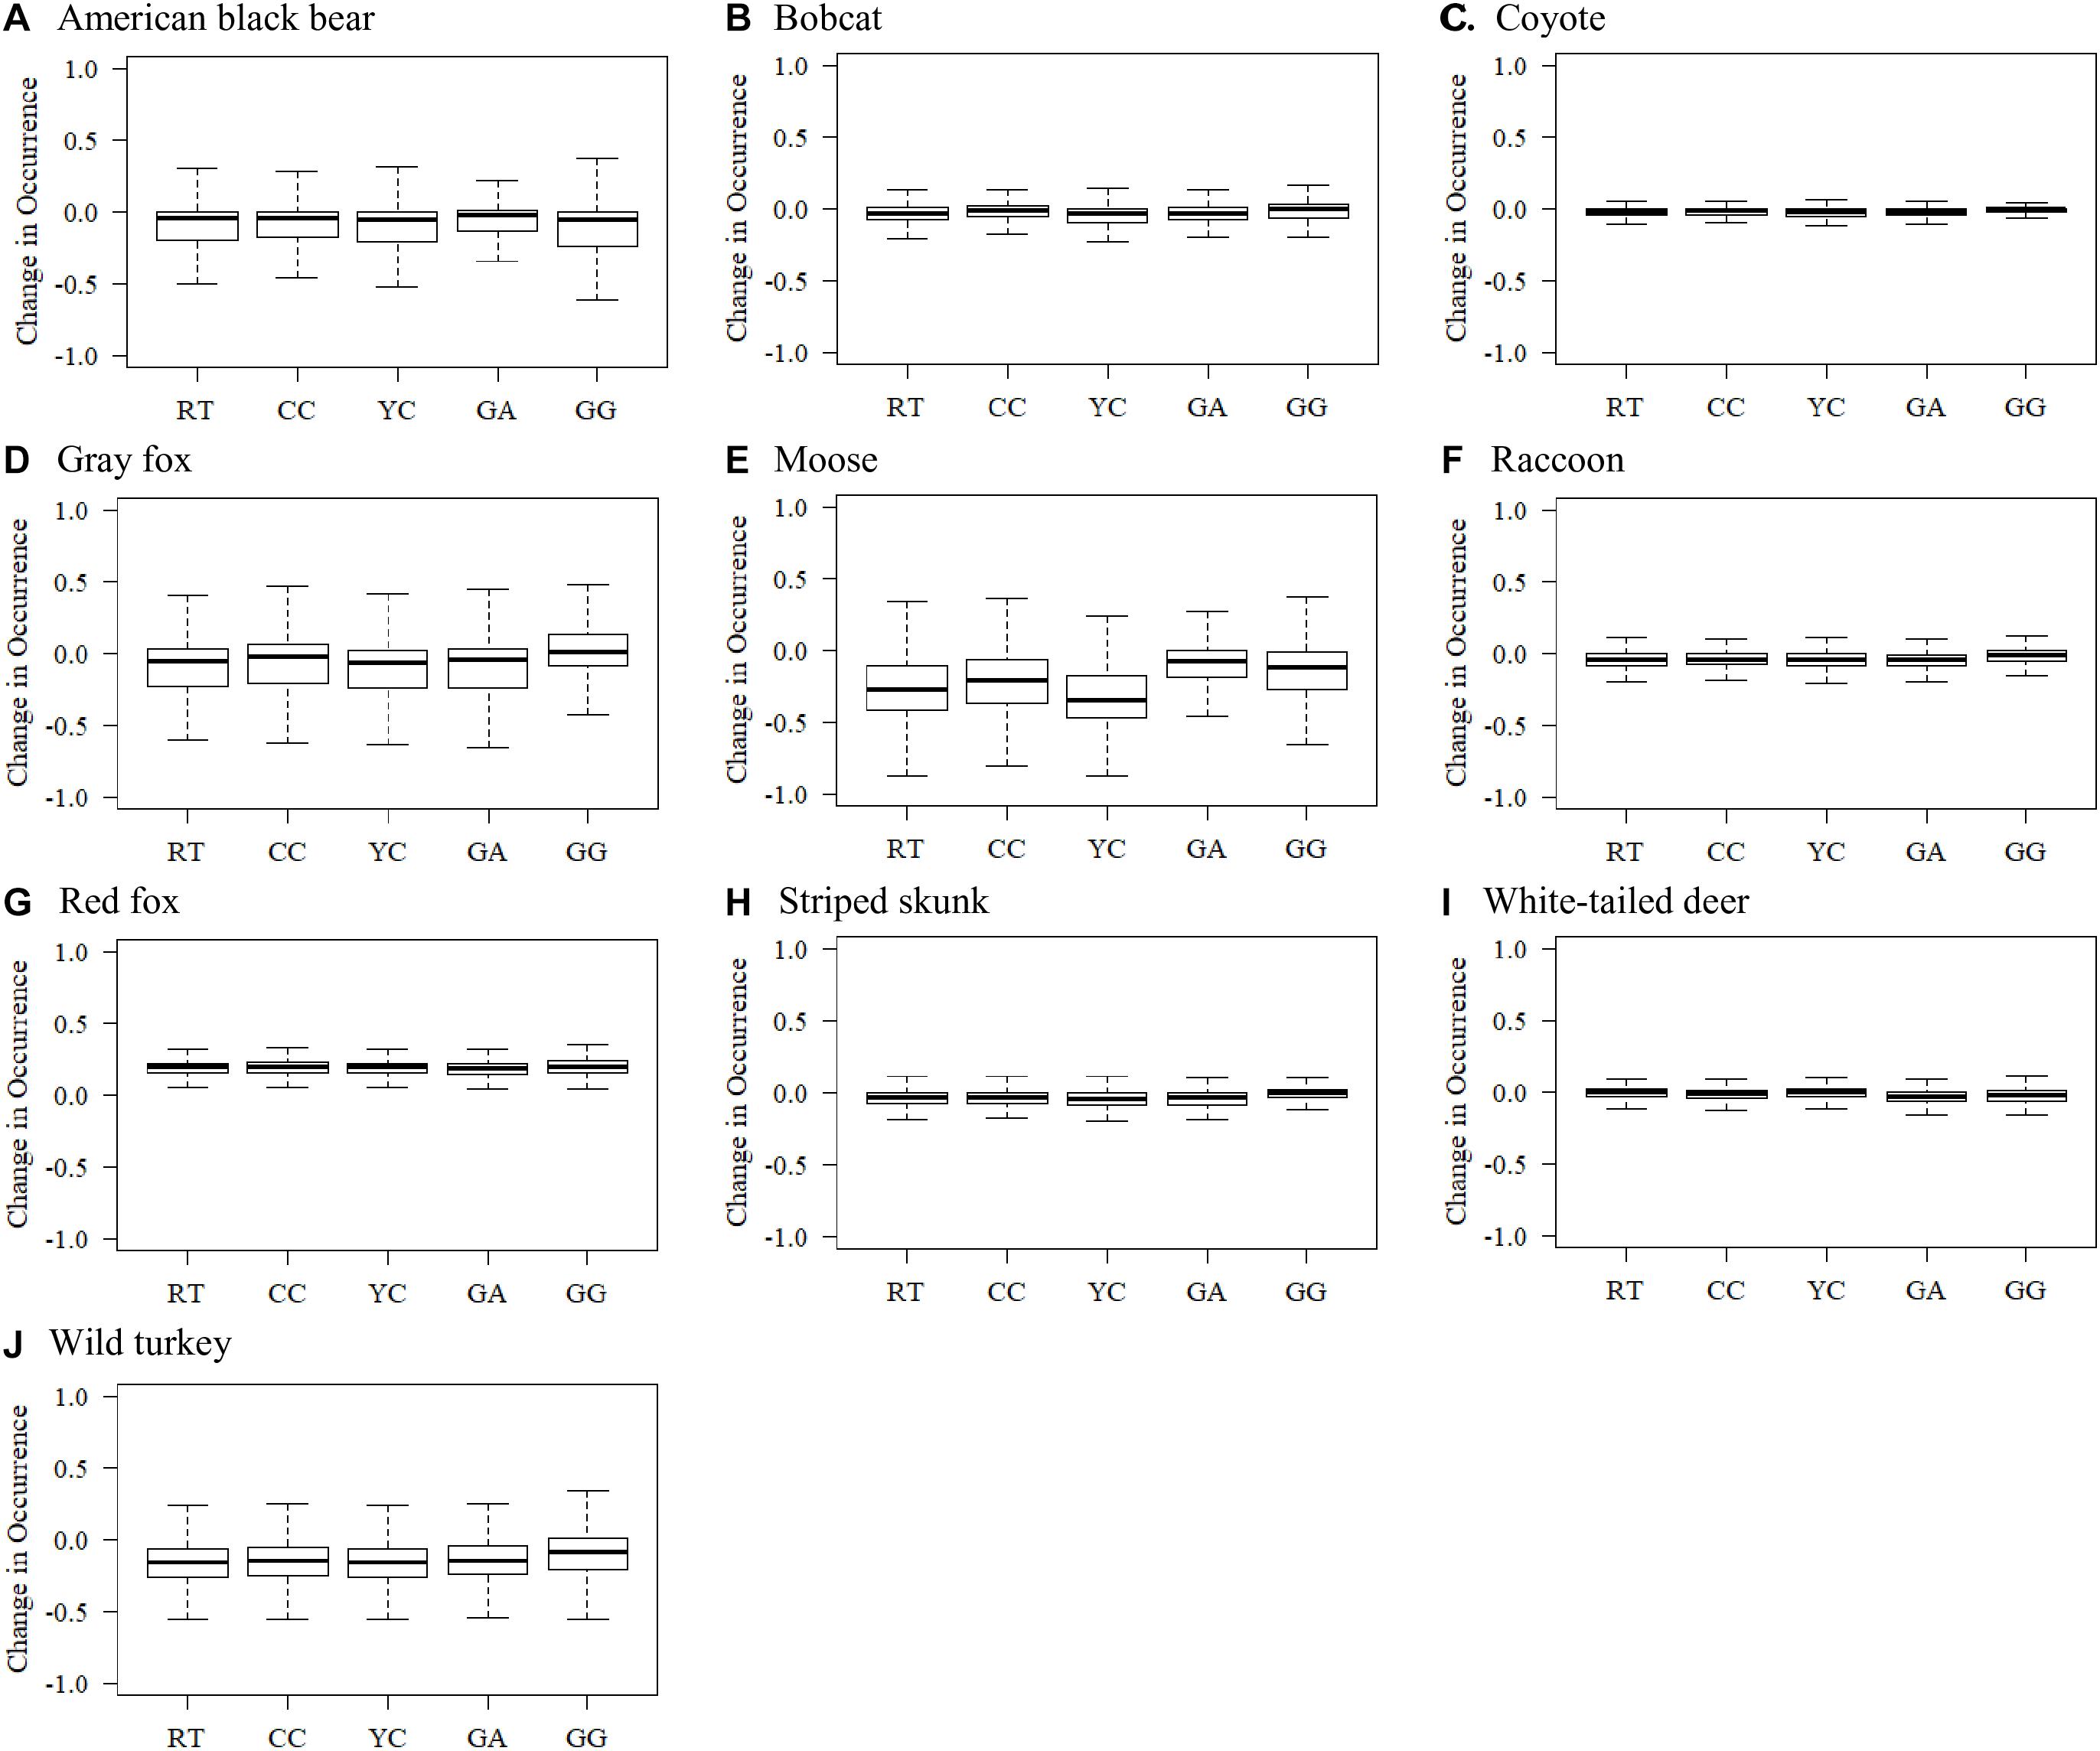
Figure 3. Boxplots displaying estimated changes in species occurrence likelihoods throughout the New England region of the northeastern United States. Changes in occurrence were projected for 10 wildlife species (A–J) by comparing species recent (2010) distribution against the year 2060 distribution projections for each NELFP scenario: Recent Trends (RT), Connected Communities (CC), Yankee Cosmopolitan (YC), Go It Alone (GA), and Growing Global (GG).
Objective 3 – Impacts of NRPI and SEC on Wildlife Species
Eight of the focal species (American black bear, bobcat, coyote, gray fox, moose, raccoon, striped skunk, and wild turkey) simulated distribution declines under the RT scenario and all four of the driver-specific assessments (Figure 4A). For white-tailed deer, distribution increased slightly under RT and declined under the four driver-specific assessments (although declines were generally lower than the declines for other species), and red fox distribution increased under all simulations (Figure 4A). Generally, the driver-specific simulations projected higher regional occurrence for the focal species than the 2060 RT simulations (Figure 4B).
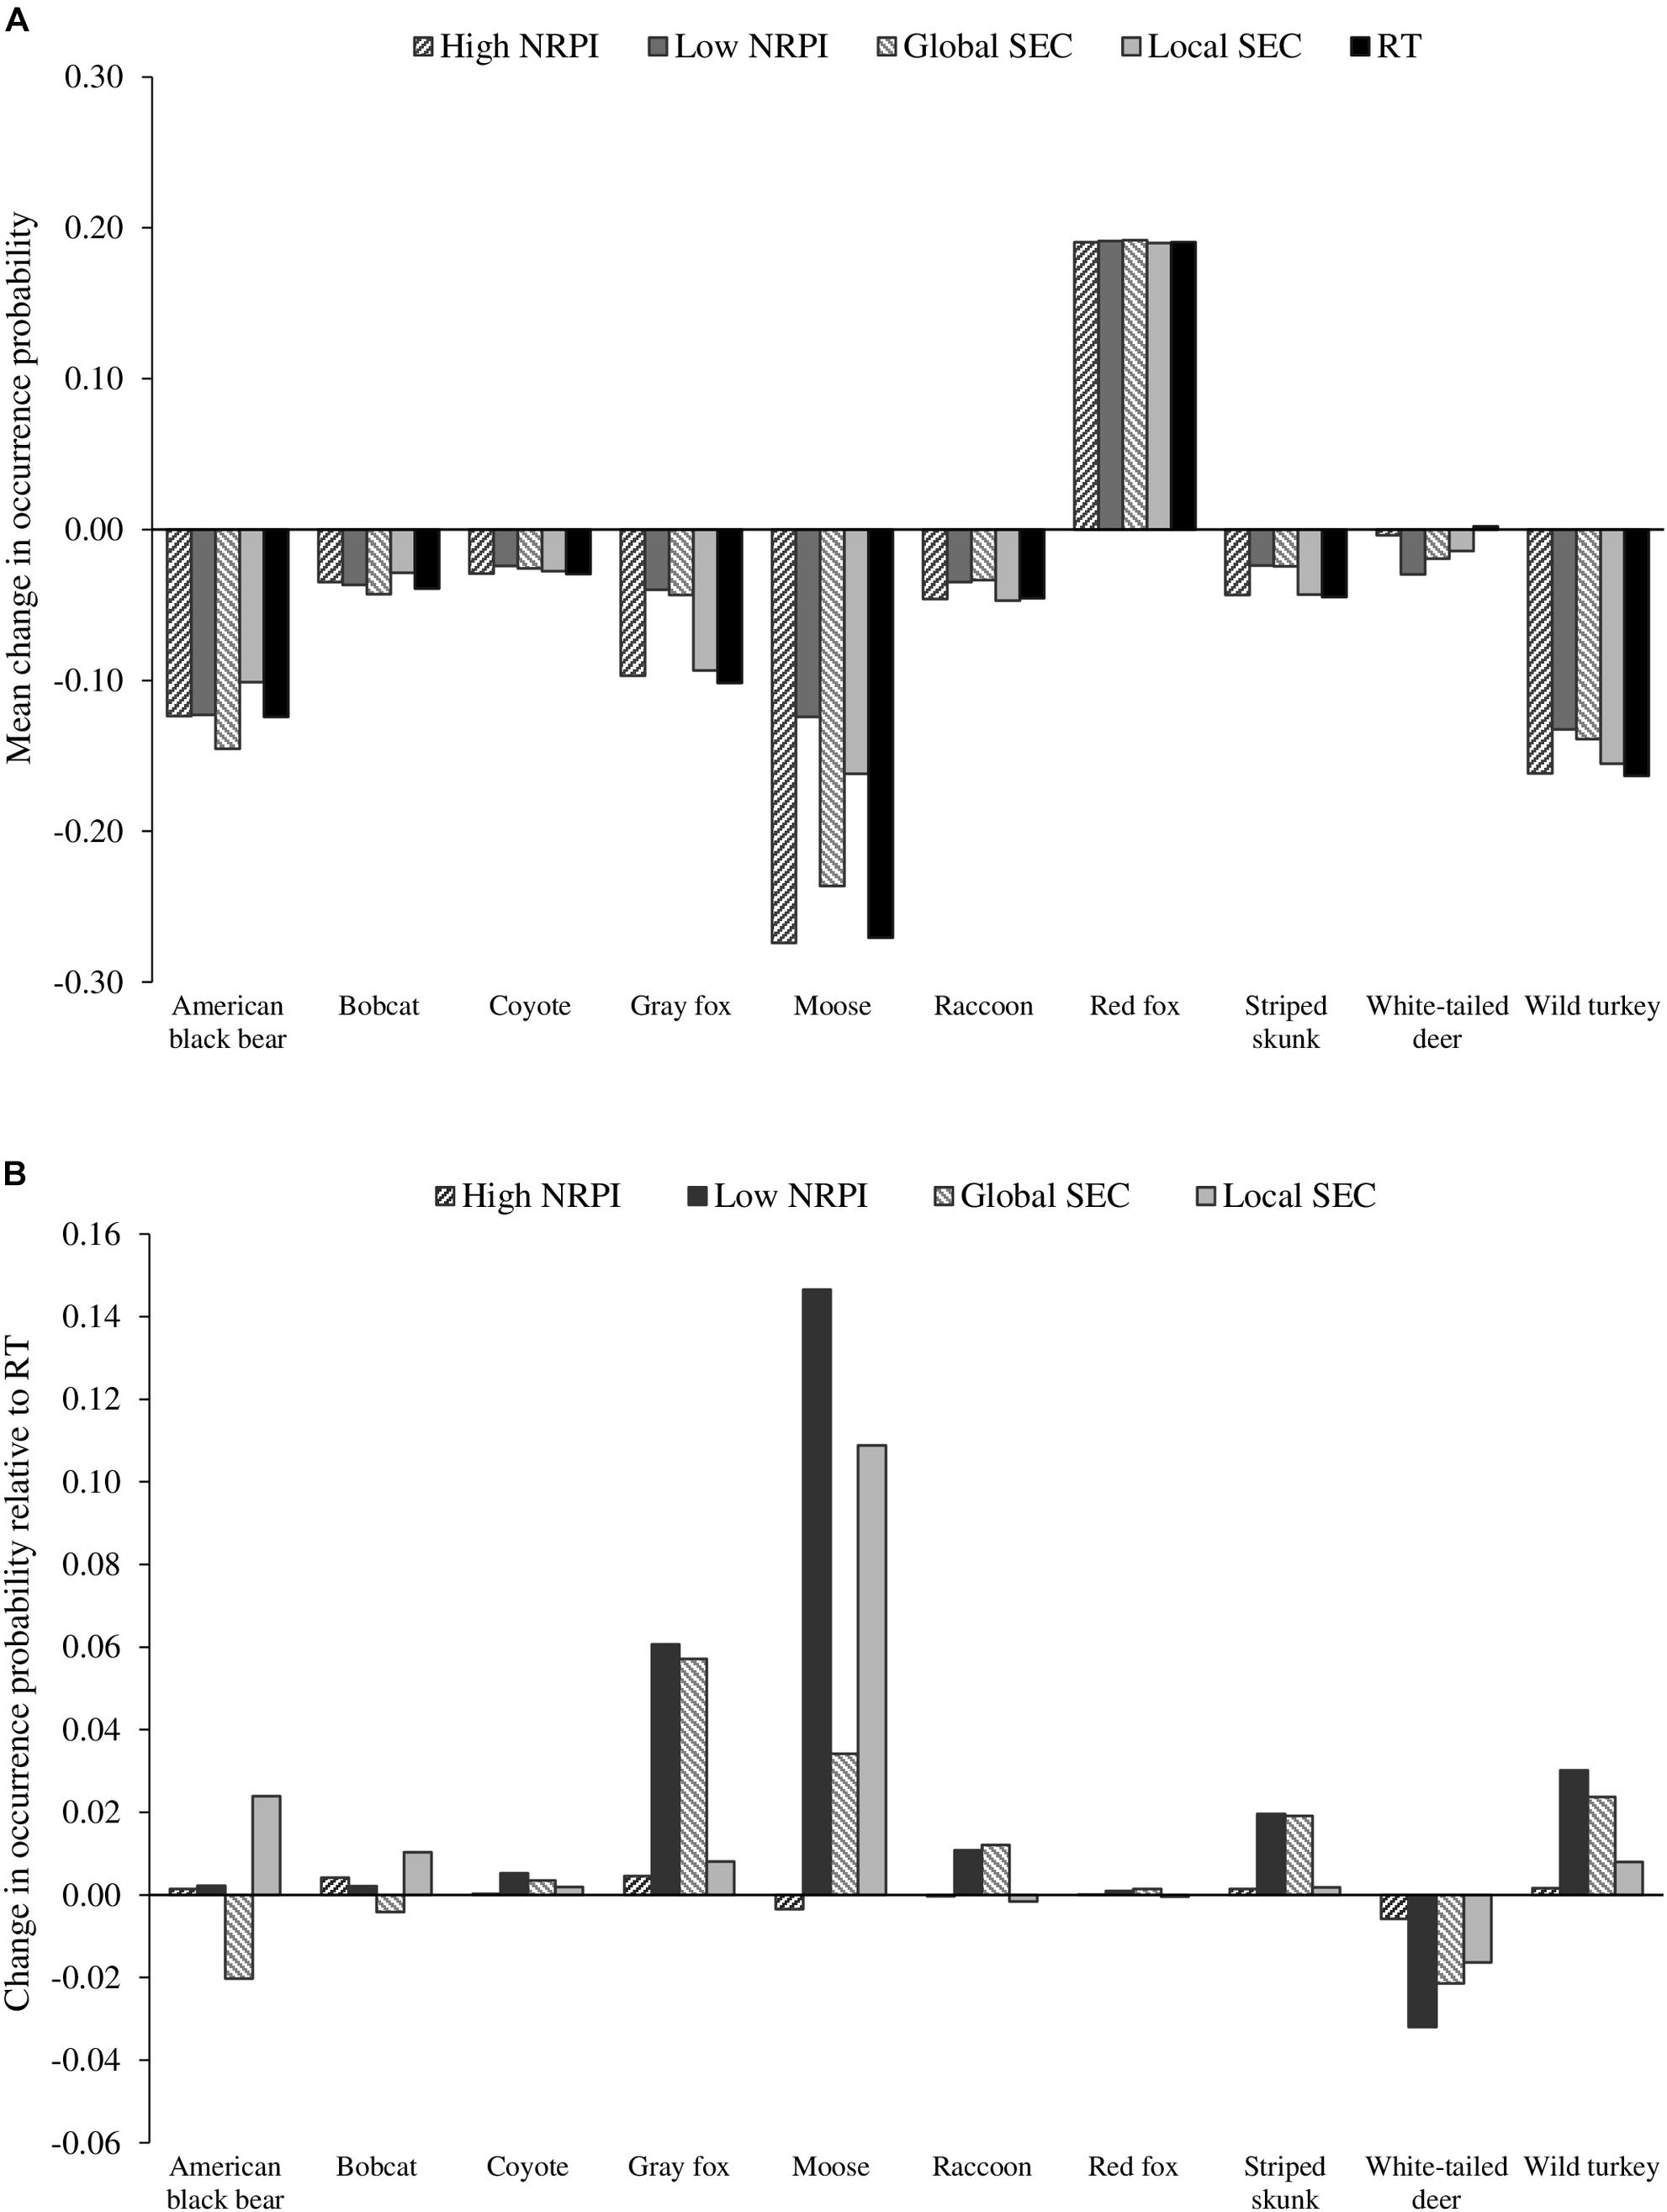
Figure 4. Bar graphs showing the overall impact of drivers on mean regional change in species probability of occurrence (A) and drivers isolated impact on occurrence likelihood after RT adjustment (B). For (A), values represent mean distribution change calculated from species probability of occurrence maps averaged across scenarios with like drivers. For (B), values indicate difference from the RT baseline associated with each isolated driver (i.e., High NRPI, Low NRPI, Global SEC, and Local SEC).
SEC had a greater impact on distribution change than NRPI for four species, including American black bear, bobcat, raccoon and red fox (Table 4). For American black bear, Local SEC was the only driver that simulated higher regional occurrence than the 2060 RT projection, while both High NRPI and Low NRPI drivers led to distribution loss similar to the RT baseline. Of the directional drivers, Local SEC simulated the highest regional occurrence for American black bear, while Global SEC simulated the lowest regional occurrence (Table 3, Figure 4B, and see Supplementary Figure S2, for species-specific maps of driver isolated distribution change). For bobcat, Local SEC simulated the highest regional occurrence while Global SEC simulated the lowest regional occurrence. Both High NRPI and Low NRPI drivers led to distribution loss similar to the 2060 RT projection, and Global SEC was the only driver that projected lower regional occurrence than the RT baseline (Table 3, Figure 4B, and Supplementary Figure S2). The Global SEC driver simulated the highest regional occurrence for raccoon, while Local SEC simulated the lowest regional occurrence. Both High NRPI and Local SEC simulated slightly lower regional occurrence than the 2060 RT projection, and Low NRPI and Global SEC projected higher regional occurrence for raccoon than RT (Table 3, Figure 4B, and Supplementary Figure S2). For red fox, all four drivers led to distribution gain similar to the 2060 RT projection. Global SEC simulated the highest regional occurrence for red fox, while Local SEC was the only driver that simulated lower regional occurrence than the RT baseline (Table 3, Figure 4B, and Supplementary Figure S2).
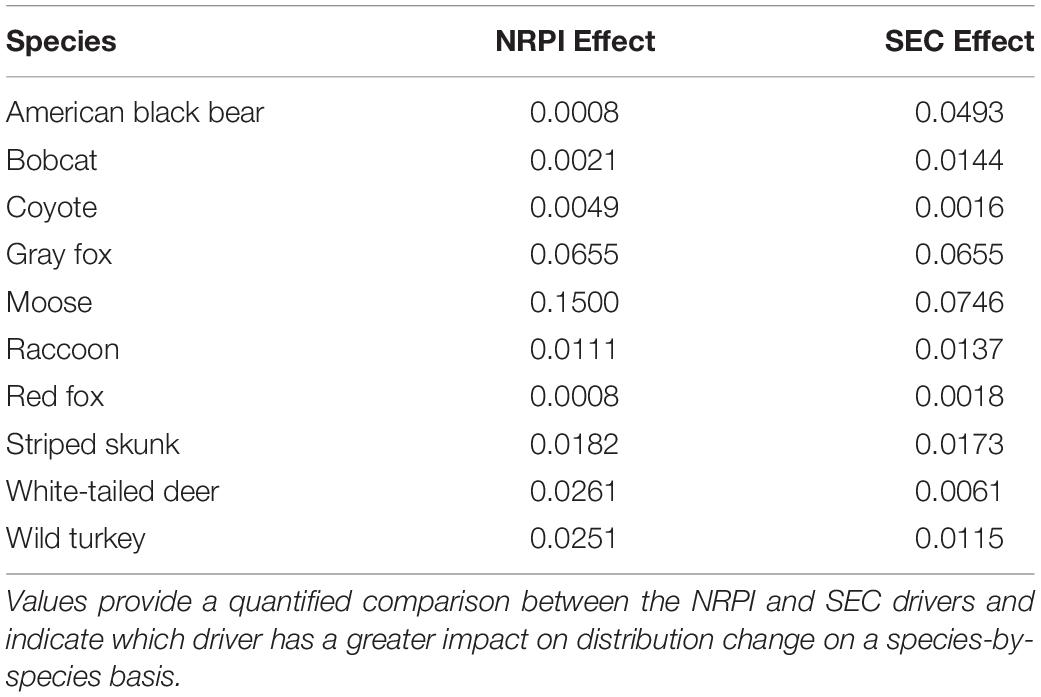
Table 4. Driver comparison statistics showing absolute difference between regional average occurrence for High vs. Low NRPI (Natural Resource Planning and Innovation) and Local vs. Global SEC (Socio-Economic Connectedness).
NRPI had a greater impact on distribution change than SEC for five species, including coyote, moose, striped skunk, white-tailed deer, and wild turkey (Table 4). For coyote, the Low NRPI driver simulated the highest regional occurrence and the High NRPI driver simulated the lowest regional occurrence (Table 3, Figure 4B, and Supplementary Figure S2). Low NRPI simulated the highest regional occurrence for moose, while High NRPI simulated the lowest regional occurrence. High NRPI was also the only driver that simulated lower regional occurrence for moose than the 2060 RT projection, and Local SEC simulated considerably higher mean regional occurrence than expected under RT (Table 3, Figure 4B, and Supplementary Figure S2). For striped skunk, Low NRPI simulated the highest regional occurrence; Global SEC driver had a similar impact as Low NRPI, leading to higher mean regional occurrence than expected under RT (Table 3, Figure 4B, and Supplementary Figure S2). For white-tailed deer, Low NRPI simulated the lowest regional occurrence and had the largest impact on distribution change, while High NRPI had the smallest impact on distribution change (Table 3, Figure 4B, and Supplementary Figure S2). Low NRPI simulated the highest regional occurrence for wild turkey, and both Low NRPI and Global SEC projected higher regional occurrence than High NRPI and Local SEC (Table 3, Figure 4B, and Supplementary Figure S2).
For one species, gray fox, SEC and NRPI had an equal influence on distribution change (Table 4). Of the directional drivers, Low NRPI simulated the highest regional occurrence for gray fox (Table 3, Figure 4B, and Supplementary Figure S2). Low NRPI and Global SEC also projected considerably higher regional occurrence than High NRPI and Local SEC (Figure 4B).
Generally, Low NRPI and Global SEC were the most influential directional drivers of distribution change (Figure 5). Low NRPI had the largest impact on regional distribution change for six of the species (coyote, gray fox, moose, striped skunk, white-tailed deer, and wild turkey), while Global SEC had the largest impact for two species (raccoon and red fox) and had a relatively large influence on distribution change for the remainder of the focal group. Of the four drivers, High NRPI had the smallest impact on distribution change for nearly all species, and Local SEC had a large impact for a few species but was otherwise less influential than the Low NRPI and Global SEC drivers (Figure 5). When comparing the difference between High vs. Low NRPI and Local vs. Global SEC, we found a nearly 50/50 split in the focal group for which the primary driver had a greater impact on distribution change (Table 4).
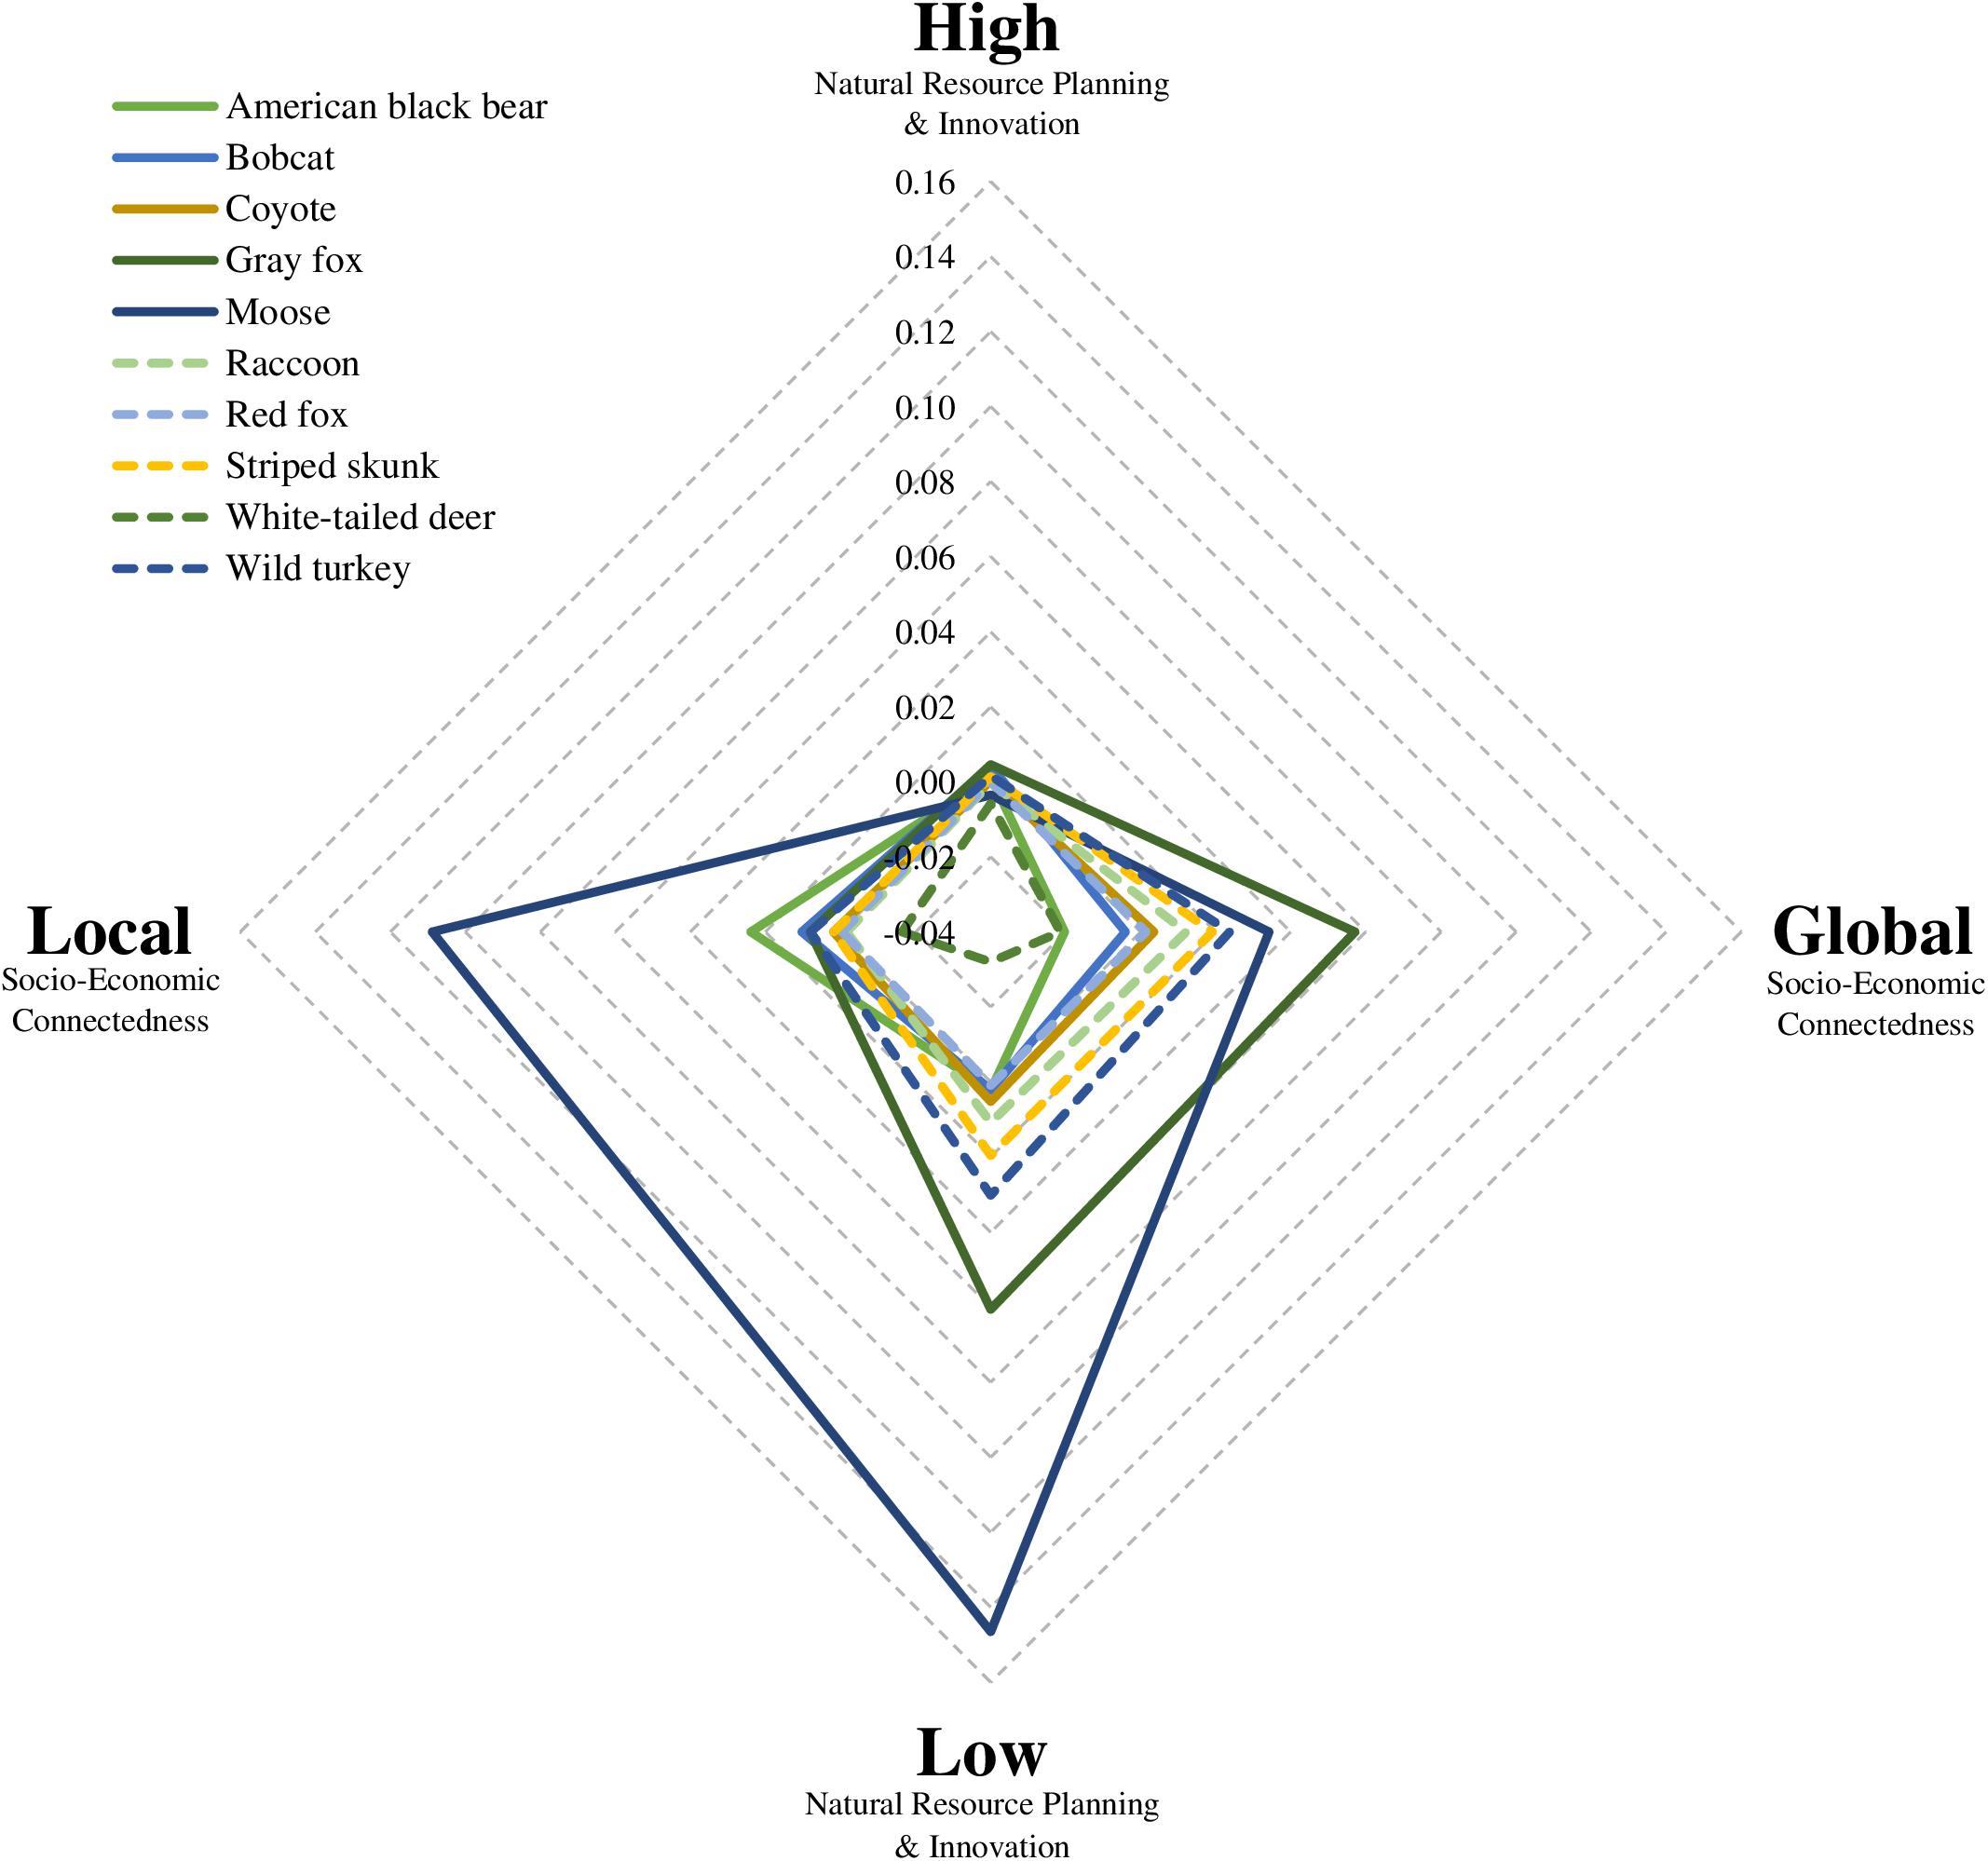
Figure 5. Radar plot showing species-specific (n = 10) distribution changes associated with each directional driver – i.e., high or low Natural Resource Planning and Innovation (NRPI), and global or local Socio-Economic Connectedness (SEC). The NRPI and SEC axes display how each driver impacted distribution change (i.e., change in mean regional occurrence likelihood) in the New England region of the northeastern United States between 2010 and 2060. All values were derived from species distribution models and provide a measure of how each driver shifted species regional occurrence likelihood relative to the occurrence likelihood simulated for Recent Trends. The overlay of all species shows driver associated trends within the focal group.
Discussion
The New England region is a large landscape that covers six US states and includes some of the largest expanses of hardwood forest and metropolitan areas in the country. Climate change and the pace of urban development has increased substantially in recent years, and the impacts of these changes on wildlife are largely unknown (Seto et al., 2012; Hayhoe et al., 2018). Our analysis suggests that a continuation of current trends will result in declines in the distribution of harvested species, which are important ecologically, socially, and economically in the region (U.S. Department of the Interior et al., 2016). For example, in Vermont, hunting, trapping, and shooting are important activities to residents, major contributors to the state’s economy, and are largely focused on species that exert strong ecological impacts on forest ecosystems like moose, deer, and bear (Pastor et al., 1998; Horsley et al., 2003; U.S. Department of the Interior et al., 2016; U.S. Bureau of Economic Analysis, 2019).
Species distributions are predicted to decline for most of the focal species if current climate and land use trends continue. The RT scenario – which simulated climate trends following the RCP 8.5 emission scenario and a continuation of recent trends in land use – resulted in 4.36% less forest cover by 2060 (Duveneck and Thompson, 2019) due to increases in development and agricultural land cover (37% and <5% more, respectively; Thompson et al., 2019). Under this scenario, eight of the ten focal species demonstrated a decrease in regional occurrence. Red fox and white-tailed deer were the only species that experienced an increase in regional occurrence (29.6 and 0.5%, respectively). The red fox is the widest ranging member of the Carnivora order and is capable of living in a variety of environments, including deserts, forests, tundra, and urban environments largely due to its physiology and behavioral plasticity (Voigt, 1987; Tesky, 1995; Lariviere and Pasitschniak-Arts, 1996). Similarly, white-tailed deer often occur at the interface between natural and developed areas and occupy a variety of habitat types (Swihart et al., 1993). Increases in these species distributions probably reflects their ability to adapt to the current trends of environmental change.
Among the species expected to decline if recent trends continue, four showed low to moderate declines in regional occurrence, including bobcat, coyote, raccoon, and striped skunk (ranging between a 3.0 and 6.6% decline by 2060). By comparison, American black bear, gray fox, moose, and wild turkey experienced relatively large reductions in distribution and average regional occurrence (ranging between 15.7 and 51.7% decline). These species are generally more sensitive to development and climate shifts, which may explain the projected negative impacts on distribution (Renecker and Hudson, 1986; Roberts and Porter, 1998; Rustad et al., 2012; COSEWIC, 2015; Evans, 2016; Lavoie et al., 2017; Environment and Climate Change Canada, 2018; Johnson et al., 2018). High levels of decline are concerning, especially for moose and gray fox, which have been identified as Species of Greatest Conservation Need by one or more of the New England states (Maine Dept. of Inland Fisheries and Wildlife, 2015; Massachusetts Division of Fisheries and Wildlife, 2015; New Hampshire Fish and Game Department, 2015; Rhode Island Department of Environmental Management Division on Fish and Wildlife, 2015; Vermont Fish and Wildlife Department, 2015). Additional assessments have also indicated recent population and distribution declines for moose in New England (Wattles and DeStefano, 2011; Timmermann and Rodgers, 2017) and many other regions in North America (Murray et al., 2006; Lenarz et al., 2010; Broders et al., 2012).
The RT scenario presents one plausible future, but we also explored the effects of other alternative futures on wildlife. The NELFP scenarios provided a set of alternative futures, influenced by climate change, yet based mainly on two social drivers of land use change – NRPI and SEC. These scenarios accounted for future climate impacts and allowed us to assess how patterns of wildlife occurrence and species richness were influenced by different drivers and trajectories of land use change. Of the four alternative scenarios, Growing Global (GG), Go It Alone (GA), and Connected Communities (CC) all led to higher species richness then RT; Yankee Cosmopolitan (YC) led to lower richness. Similarly, our assessment of the social drivers of change indicated that a low investment in NRPI and a global approach to SEC were most influential on distribution change and species richness.
In terms of land cover change, a low investment in NRPI led to increased rates of timber harvest in the NELFP scenarios. The GA and GG scenarios were built around the Low NRPI driver and simulated the highest timber harvest rates of all the scenarios (i.e., 135 and 110% increase in harvest rate compared to RT, respectively) and the highest species richness of all the scenarios. Timber harvest can benefit some species, including some in the focal group (Monthey, 1984; Hunter and Schmiegelow, 2011) by generating important habitats (e.g., early succession forest) and increasing heterogeneity in forest structure and composition (Hansen et al., 1991; Hunter and Schmiegelow, 2011). Moose, gray fox, and wild turkey are all species that appear to benefit from increased forest heterogeneity driven by Low NRPI. For example, moose distribution was greatest under the GA and GG scenarios; probably because these scenarios resulted in high levels of timber harvest and larger amounts of young forest, which benefit moose (Monthey, 1984; Innes, 2010; Wattles and DeStefano, 2011). However, it is important to recognize that a continuation of Low NRPI actions and disregard for both innovation and more extensive natural resource planning activities will probably have less favorable long-term consequences for many other wildlife species. Climate impacts on forest composition may also have greater long-term consequences for wildlife. For this analysis we simulated climate and land use change 50 years into the future, however, the effects of climate change on forest composition are projected to increase dramatically beyond 50 years (Duveneck and Thompson, 2017; Janowiak et al., 2018). With larger shifts occurring in the second half of the 21st century, wildlife species may experience less favorable conditions over time.
Economic development activities like urban expansion and the conversion of forest to agriculture can also have considerable impacts on species richness by reducing the availability and quality of habitat in the region (Murphy and Romanuk, 2014; Newbold et al., 2015). In the NELFP simulations, the CC and GA scenarios were built around the Local SEC driver and led to lower rates of development (i.e., 75 and 25% decrease in development rate, respectively) and higher species richness than the RT projection. By comparison, the GG and YC scenarios were built around the Global SEC driver and simulated high rates of development (i.e., 180 and 40% increase in development rate compared to RT, respectively). These two scenarios resulted in the highest (GG) and lowest (YC) species richness, showing that increased development rates can negatively influence species occurrence, but may not directly translate to lower richness. Rather, other factors including the pattern and intensity of development may be more influential than rate alone. Both Global and Local SEC drivers altered development patterns and subsequently influenced distribution change – drawing attention to the considerable influence that social and economic factors can have on natural systems and emphasizing the importance of including these factors in regional planning efforts.
The scenario assessments provide measures of the response of multiple wildlife species to future natural, social, and economic changes in New England. The results provide species information that can aid in landscape decision-making around management and conservation problems (Peterson et al., 2003). For a given problem, decision-makers can set objectives, then use the models to assess the consequences associated with each scenario, evaluate trade-offs among scenarios, and identify the trajectory that most successfully meets their objectives. As a simple example, a group interested in maximizing black bear populations in New England could compare occurrence probabilities across the scenarios to evaluate the trade-offs of each type of future scenario; in this case, choosing the GA scenario may be best as it projects the highest regional occurrence for black bear. Information about the GA scenario could then be used to help guide policy and management actions.
The scenarios could also be used in more complex decision-making problems that account for trade-offs across multiple objectives and multiple spatial and temporal scales. For example, the state of Vermont has set a goal of meeting 90% of the state’s energy needs through renewable sources (e.g., solar, wind, forest-derived bioenergy) by the year 2050 (Vermont Department of Public Service, 2016). Considering this objective, Vermont may change following a trajectory similar to the CC scenario – in which advances in local green energy support a more self-reliant community – or the GA scenario – in which poor planning and extractive use significantly degrades the region’s ecosystem services. However, the state also has objectives related to the sustainability of harvested species, other natural resources, and climate change. Decision-making frameworks following principles of Structured Decision Making (Gregory et al., 2012) could be used to evaluate possible impacts of climate change and the trade-offs of each future scenario on renewable energy production, and the sustainability of harvested species and other natural resources, which can inform policy actions.
Our assessments of landscape change on wildlife species accounted for several social, ecological, and economic factors based on information from models, expert opinion, and consensus from a consortium of scientists, managers, and community members (i.e., the Scenarios, Services, and Society Research Coordination Network that developed the NELFP scenarios). However, any future scenario projections involve uncertainties. Uncertainty in the SDM parameters has been estimated, which provides a measure of confidence in the occurrence estimates. Other factors not considered in the modeling process, such as species interactions or variable trajectories of climate change, may impact distribution patterns and induce additional uncertainty in the outcome for species (Royle and Dorazio, 2008). For example, coyotes are dominant competitors and have been shown to shape the distribution of other sympatric carnivore species (Johnson et al., 1996; Fedriani et al., 2000); changes in their occurrence over time may have impacts on red foxes and gray foxes through competition (Johnson et al., 1996; Fedriani et al., 2000; Levi and Wilmers, 2012), and even game birds like wild turkey through altered predation risk (Guthrey, 1995). Accounting for the behavioral and ecological complexities of species interactions is challenging, and would require additional (and currently unavailable) data to be integrated into future scenario modeling. Future climate conditions are also largely uncertain and species future distributions may vary considerably under different trajectories of climate change. Here, we simulated future climate conditions based on a single high emissions scenario to aide interpretability and offer distribution projections that account for both climate and land-use change. Considering additional climate scenarios and climate-related factors could provide further insight on species future distribution patterns.
We also used probability of occurrence at a 30 m pixel level as a measure for evaluating the effects of landscape change on a species. Occurrence probability reflects habitat quality, which we assumed also relates to the number of individuals, an important measure for harvest management (e.g., setting harvest quotas or bag limits). A positive relationship between occupancy probability and abundance has been shown for several wildlife species (Blackburn et al., 2006; Zuckerberg et al., 2009). However, this relationship is not always consistent and linear (Blackburn et al., 2006). For example, recent trends suggest that gray foxes are expanding in range in the northeastern US and eastern Canada (COSEWIC, 2015; Environment and Climate Change Canada, 2018). However, our projection for gray fox shows a decline in occurrence under the RT scenario. Here, it is important to distinguish range expansion from population growth and increased species occurrence – while the range of gray fox may be expanding, localized shifts in habitat can lead to lower abundance. It is also important to recognize that current trends may not continue into the future. While current conditions appear to facilitate range expansion for gray fox, changes to New England’s climate and land use may decrease gray fox occurrence in the future. Brown et al. (2018) also showed that small declines in regional occurrence probability of bird species in New England can result in large declines in the actual number of territories that a region can support. This is an important consideration, as seemingly small changes in occurrence probability may translate to much larger shifts in a species actual abundance.
Resilience of wildlife communities to change is a conservation priority for the New England region (Anderson et al., 2016). Our study focused on harvested wildlife species and provides a foundation for evaluating areas of high and low resilience under regimes of change for this group of ecologically, socially, and economically important species. Many resilience studies have focused on identifying resilient areas for broader biodiversity using focal taxa (e.g., birds) or groups (e.g., rare species). For example, Anderson et al. (2014) estimated resilience to climate change in northeastern North America using locations of rare species populations and representative natural communities as measures of biodiversity. Our study complements this and other assessments in the region (e.g., Staying Connected Initiative; Smith et al., 2012) by providing fine-scale information on harvested wildlife species that have been largely excluded in regional analyses.
Data Availability Statement
The datasets generated for this study are available through the FEMC Data Archive and can be found at https://www.uvm.edu/femc/data/archive/project/wildlife_future_scenarios/dataset.
Author Contributions
SP-G and TD contributed to the concept and design of the project. SP-G conducted the analyses and drafted the manuscript. MD provided the forest change simulations. All authors participated in revising and editing the manuscript.
Disclaimer
This draft manuscript is distributed solely for purposes of scientific peer review. Its content is deliberative and predecisional, so it must not be disclosed or released by reviewers. Because the manuscript has not yet been approved for publication by the U.S. Geological Survey (USGS), it does not represent any official USGS finding or policy.
Funding
We thank the USDA National Institute of Food and Agriculture, McIntire-Stennis project 1002300 for funding the study and the Vermont Fish and Wildlife Department, the Vermont Cooperative Fish and Wildlife Research Unit, and the University of Vermont for their support. This research was also supported in part by the National Science Foundation through funds provided to the Harvard Forest Long Term Ecological Research Program (Grant no. NSF-DEB-LTER 18-32210).
Conflict of Interest
The authors declare that the research was conducted in the absence of any commercial or financial relationships that could be construed as a potential conflict of interest.
Acknowledgments
We thank A. W. D’Amato of the University of Vermont and the New England Landscape Futures Project for their collaboration and data contributions. Any use of trade, firm, or product names is for descriptive purposes only and does not imply endorsement by the U.S. Government. The Vermont Cooperative Fish and Wildlife Research Unit is jointly supported by the U.S. Geological Survey, the University of Vermont, the Vermont Fish and Wildlife Department, and the Wildlife Management Institute.
Supplementary Material
The Supplementary Material for this article can be found online at: https://www.frontiersin.org/articles/10.3389/fevo.2020.00164/full#supplementary-material
Footnotes
References
Anderson, M. G., Barnett, A., Clark, M., Prince, J., Olivero Sheldon, A., and Vickery, B. (2016). Resilient and Connected Landscapes for Terrestrial Conservation. Boston, MA: The Nature Conservancy.
Anderson, M. G., Clark, M., and Sheldon, A. O. (2014). Estimating climate resilience for conservation across geophysical settings. Conserv. Biol. 28, 959–970. doi: 10.1111/cobi.12272
Aycrigg, J. L., Groves, C., Hilty, J. A., Scott, J. M., Beier, P., Boyce, D. A., et al. (2016). Completing the system: opportunities and challenges for a national habitat conservation system. Bioscience 66, 774–784. doi: 10.1093/biosci/biw090
Aylward, C. M., Murdoch, J. D., Donovan, T. M., Kilpatrick, C. W., Bernier, C., and Katz, J. (2018). Estimating distribution and connectivity of recolonizing American marten in the northeastern United States using expert elicitation techniques. Anim. Conserv. 21, 483–495. doi: 10.1111/acv.12417
Bates, D., Mächler, M., Bolker, B., and Walker, S. (2014). Fitting linear mixed-effects models using lme4. J. Stat. Softw. 67, 1–48. doi: 10.18637/jss.v067.i01
Blackburn, T. M., Cassey, P., and Gaston, K. J. (2006). Variations on a theme: sources of heterogeneity in the form of the interspecific relationship between abundance and distribution. J. Anim. Ecol. 75, 1426–1439. doi: 10.1111/j.1365-2656.2006.01167.x
Booth, T. H., Nix, H. A., Busby, J. R., and Hutchinson, M. F. (2014). Bioclim: the first species distribution modelling package, its early applications and relevance to most current MaxEnt studies. Divers. Distrib. 20, 1–9. doi: 10.1111/ddi.12144
Broders, H. G., Coombs, A. B., and Mccarron, J. R. (2012). Ecothermic responses of moose (Alces alces) to thermoregulatory stress on mainland Nova scotia. Alces 48, 53–61.
Brooks, R. T., Frieswyk, T. S., Griffith, D. M., Cooter, E., and Smith, L. (1992). The New England Forest: Baseline for New England Forest Health Monitoring. Resource Bulletin. NE-124. Radnor, PA: USDA. doi: 10.2737/NE-RB-124
Brown, M. L., Donovan, T. M., Mickey, R. M., Warrington, G. S., Schwenk, W. S., and Theobald, D. M. (2018). Predicting effects of future development on a territorial forest songbird: methodology matters. Landsc. Ecol. 33, 93–108. doi: 10.1007/s10980-017-0586-8
Burnham, K. P., and Anderson, D. (2002). Model Selection and Multimodel Inference: A Practical Information-Theoretic Approach, 2nd Edn. New York, NY: Springer-Verlag. doi: 10.1007/b97636
Carpenter, S. R., and Folke, C. (2006). Ecology for transformation. Trends Ecol. Evol. 21, 309–315. doi: 10.1016/j.tree.2006.02.007
Chen, I. C., Hill, J. K., Ohlemüller, R., Roy, D. B., and Thomas, C. D. (2011). Rapid range shifts of species associated with high levels of climate warming. Science 333, 1024–1026. doi: 10.1126/science.1206432
COSEWIC (2015). COSEWIC Assessment and Status Report on the Gray Fox Urocyon cinereoargenteus in Canada. Ottawa, ON: Committee on the Status of Endangered Wildlife in Canada, 12–54.
Díaz, S., Settele, J., Brondízio, E., Ngo, H. T., Guèze, M., Agard Trinidad, J., et al. (2019). Summary for Policymakers of the Global Assessment Report on Biodiversity and Ecosystem Services of the Intergovernmental Science-Policy Platform on Biodiversity and Ecosystem Services. Bonn: IPBES. doi: 10.5281/zenodo.3553579
Dupigny-Giroux, L.-A., Mecray, E., Lemcke-Stampone, M., Hodgkins, G. A., Lentz, E. E., Mills, K. E., et al. (2018). “Chapter 18: Northeast,” in Impacts, Risks, and Adaptation in the United States: The Fourth National Climate Assessment, Vol.II, eds D. R. Reidmiller, C. W. Avery, D. R. Easterling, K. E. Kunkel, K. L. M. Lewis, T. K. Maycock, et al. (Washington, DC: U.S. Global Change Research Program). doi: 10.7930/NCA4.2018.CH18
Duveneck, M. J., MacLean, M. G., Plisinski, J., Morreale, L., Fallon-Lambert, K., and Thompson, J. R. (2019). New England Landscape Futures Carbon v0.1. Available online at: https://zenodo.org/record/3541123#.XsBAFP8zbZ4 (accessed November 14, 2019).
Duveneck, M. J., and Thompson, J. R. (2017). Climate change imposes phenological trade-offs on forest net primary productivity. J. Geophys. Res. Biogeosci. 122, 2298–2313. doi: 10.1002/2017JG004025
Duveneck, M. J., and Thompson, J. R. (2019). Social and biophysical determinants of future forest conditions in New England: effects of a modern land-use regime. Glob. Environ. Chang. 55, 115–129. doi: 10.1016/j.gloenvcha.2019.01.009
Duveneck, M. J., Thompson, J. R., and Wilson, B. T. (2015). An imputed forest composition map for New England screened by species range boundaries. For. Ecol. Manage. 347, 107–115. doi: 10.1016/j.foreco.2015.03.016
Environment and Climate Change Canada (2018). Recovery Strategy for the Grey Fox (Urocyon cinereoargenteus) in Canada. Ottawa: Environment and Climate Change Canada, 9–42.
Evans, M. J. (2016). Ecological Effects of Development on American Black Bear. Ph.D. dissertation, University of Connecticut, Storrs, CT.
Fedriani, J. M., Fuller, T. K., Sauvajot, R. M., and York, E. C. (2000). Competition and intraguild predation among three sympatric carnivores. Oecologia 125, 258–270. doi: 10.1007/s004420000448
Foley, J. A., DeFries, R., Asner, G. P., Barford, C., Bonan, G., Carpenter, S. R., et al. (2005). Global consequences of land use. Science 309, 570–574. doi: 10.1126/science.1111772
Foster, D. R., Donahue, B. M., Kittredge, D. B., Lambert, K. F., Hunter, M. L., Hall, B. R., et al. (2010). Wildlands and Woodlands: A Vision for the New England Landscape. Cambridge, MA: Harvard University.
Franklin, J. (2010). Mapping Species Distributions: Spatial Inference and Prediction, Vol. 44. Cambridge: Cambridge University Press, 615. doi: 10.1017/s0030605310001201
Gregory, R., Failing, L., Harstone, M., Long, G., McDaniels, T., and Ohlson, D. (2012). Structured Decision Making: A Practical Guide to Environmental Management Choices. Chichester: Wiley-Blackwell. doi: 10.1002/9781444398557
Güneralp, B., McDonald, R. I., Fragkias, M., Goodness, J., Marcotullio, P. J., and Seto, K. C. (2013). “Urbanization forecasts, effects on land use, biodiversity, and ecosystem services,” in Urbanization, Biodiversity and Ecosystem Services: Challenges and Opportunities, eds T. Elmqvist, M. Fragkias, J. Goodness, B. Güneralp, P. J. Marcotullio, R. I. McDonald, et al. (Dordrecht: Springer), 437–452. doi: 10.1007/978-94-007-7088-1
Guthrey, F. S. (1995). “Coyotes and upland Gamebirds,” in Proceedings of the Coyotes in the Southwest: A Compendium of Our Knowledge, eds D. Rollins et al. (Austin, TX: Texas Parks and Wildlife Department), 104–107.
Haddad, N. M., Brudvig, L. A., Clobert, J., Davies, K. F., Gonzalez, A., Holt, R. D., et al. (2015). Habitat fragmentation and its lasting impact on Earth’s ecosystems. Sci. Adv. 1:e1500052. doi: 10.1126/sciadv.1500052
Hansen, A. J., Spies, T. A., Swanson, F. J., and Ohmann, J. L. (1991). Conserving biodiversity in managed forests. Bioscience 41, 382–392. doi: 10.2307/1311745
Hayhoe, K., Wuebbles, D. J., Easterling, D. R., Fahey, D. W., Doherty, S., Kossin, J., et al. (2018). “Our changing climate,” in Impacts, Risks, and Adaptation in the United States: Fourth National Climate Assessment, Volume II,” in Impacts, Risks, and Adaptation in the United States: Fourth National Climate Assessment, Vols I, II, eds D. R. Reidmiller, C. W. Avery, D. R. Easterling, K. E. Kunkel, K. L. M. Lewis, T. K. Maycock, et al. (Washington, DC: U.S. Global Change Research Program), 72–144. doi: 10.7930/NCA4.2018.CH2
Hijmans, R. J. (2016). raster: Geographic Data Analysis and Modeling. Available online at: https://cran.r-project.org/web/packages/raster/index.html (accessed May 25, 2020).
Homer, C., Dewitz, J., Yang, L., Jin, S., Danielson, P., Xian, G., et al. (2015). Completion of the 2011 National Land Cover Database for the Conterminous United States – Representing a Decade of Land Cover Change Information. Photogramm. Eng. Remote Sens. 81, 345–354. doi: 10.14358/PERS.81.5.345
Horsley, S. B., Stout, S. L., and DeCalesta, D. S. (2003). White-tailed deer impact on the vegetation dynamics of a northern hardwood forest. Ecol. Appl. 13, 98–118.
Hunter, M., and Schmiegelow, F. (2011). Wildlife, Forests and Forestry: Principles of Managing Forests for Biological Diversity. Upper Saddle River, NJ: Prentice Hall, 259. doi: 10.1002/jwmg.209
Huntington, T. G., Richardson, A. D., McGuire, K. J., and Hayhoe, K. (2009). Climate and hydrological changes in the northeastern United States: recent trends and implications for forested and aquatic ecosystems. Can. J. For. Res. 39, 199–212. doi: 10.1139/X08-116
Innes, R. J. (2010). Alces americanus. In: Fire Effects Information System, [Online]. U.S. Department of Agriculture, Forest Service, Rocky Mountain Research Station, Fire Sciences Laboratory (Producer). Available: www.fs.fed.us/database/feis/animals/mammal/alam/all.html (accessed January 29, 2015).
IPCC (2013). Climate Change 2013: The Physical Science Basis, Contribution of Working Group I, eds T. F. Stocker, D. Qin, G.-K. Plattner, M. Tignor, S. K. Allen, J. Boschung, et al. (Cambridge: Cambridge University Press).
IPCC (2014). Climate Change 2014: Synthesis Report. Contribution of Working Groups I, II and III to the Fifth Assessment Report of the Intergovernmental Panel on Climate Change. Geneva: IPCC. doi: 10.1017/CBO9781107415324.004
James, A., Choy, S. L., and Mengersen, K. (2010). Elicitator: an expert elicitation tool for regression in ecology. Environ. Model. Softw. 25, 129–145. doi: 10.1016/j.envsoft.2009.07.003
Janowiak, M. K., D’Amato, A. W., Swanston, C., Iverson, L., Thompson, F. III, Dijak, W. D., et al. (2018). New England and New York Forest Ecosystem Vulnerability Assessment and Synthesis: A Report from the New England Climate Change Response Framework. Newtown Square, PA: USDA. doi: 10.2737/nrs-gtr-173
Johnson, H. E., Lewis, D. L., Verzuh, T. L., Wallace, C. F., Much, R. M., Willmarth, L. K., et al. (2018). Human development and climate affect hibernation in a large carnivore with implications for human–carnivore conflicts. J. Appl. Ecol. 55, 663–672. doi: 10.1111/1365-2664.13021
Johnson, W. E., Fuller, T. K., and Franklin, W. L. (1996). “Sympatry in canids: a review and assessment,” in Carnivore Behavior, Ecology and Evolution, ed. J. L. Gittleman (Ithaca, N Y: Cornell University Press), 189–218.
Jones, C. G., Lawton, J. H., and Shachak, M. (1994). Organisms as ecosystem engineers. Oikos 69, 373–386. doi: 10.2307/3545850
Jones, H., Pekins, P., Kantar, L., Sidor, I., Ellingwood, D., Lichtenwalner, A., et al. (2019). Mortality assessment of moose (Alces alces) calves during successive years of winter tick (dermacentor albipictus) epizootics in New Hampshire and Maine (USA). Can. J. Zool. 97, 22–30. doi: 10.1139/cjz-2018-0140
Klein Goldewijk, K., Beusen, A., Van Drecht, G., and De Vos, M. (2011). The HYDE 3.1 spatially explicit database of human-induced global land-use change over the past 12,000 years. Glob. Ecol. Biogeogr. 20, 73–86. doi: 10.1111/j.1466-8238.2010.00587.x
Koen, E. L., Bowman, J., Murray, D. L., and Wilson, P. J. (2014). Climate change reduces genetic diversity of Canada lynx at the trailing range edge. Ecography 37, 754–762. doi: 10.1111/j.1600-0587.2013.00629.x
Laliberte, A. S., and Ripple, W. J. (2004). Range contractions of north american carnivores and ungulates. Bioscience 54, 123–138.
Lariviere, S., and Pasitschniak-Arts, M. (1996). Vulpes vulpes. Mamm. Species 537, 1–11. doi: 10.2307/3504236
Lavoie, M., Blanchette, P., Larivière, S., and Tremblay, J. P. (2017). Winter and summer weather modulate the demography of wild turkeys at the northern edge of the species distribution. Popul. Ecol. 59, 239–249.
Lenarz, M. S., Fieberg, J., Schrage, M. W., and Edwards, A. J. (2010). Living on the edge: viability of moose in Northeastern Minnesota. J. Wildl. Manage. 74, 1013–1023.
Levi, T., and Wilmers, C. C. (2012). Wolves-coyotes-foxes: a cascade among carnivores. Ecology 93, 921–929. doi: 10.1890/11-0165.1
Maine Dept. of Inland Fisheries and Wildlife (2015). Maine’s Wildlife Action Plan. Augusta, ME: Maine Department of Inland Fisheries and Wildlife.
Massachusetts Division of Fisheries and Wildlife (2015). Massachusetts State Wildlife Action Plan 2015. Westborough, MA: Massachusetts Division of Fisheries and Wildlife.
MassGIS (2018). MassGIS Data: New England Boundaries. Available online at: https://docs.digital.mass.gov/dataset/massgis-data-new-england-boundaries (accessed May 31, 2019).
McBride, M. F., Lambert, K. F., Huff, E. S., Theoharides, K. A., Field, P., and Thompson, J. R. (2017). Increasing the effectiveness of participatory scenario development through codesign. Ecol. Soc. 22:16. doi: 10.5751/ES-09386-220316
McGarigal, K., Compton, B., Plunkett, E., Deluca, W., and Grand, J. (2017). Designing Sustainable Landscapes: Project Overview. Report to the North Atlantic Conservation Cooperative, US Fish and Wildlife Service, Northeast Region. Amherst, MA: University of Massachusetts.
Monthey, R. W. (1984). Effects of Timber Harvesting on Ungulates in Northern Maine. J. Wildl. Manage. 48, 279–285. doi: 10.2307/3808489
Mouton, A. M., De Baets, B., and Goethals, P. L. M. (2009). Knowledge-based versus data-driven fuzzy habitat suitability models for river management. Environ. Model. Softw. 24, 982–993. doi: 10.1016/j.envsoft.2009.02.005
Murphy, G. E. P., and Romanuk, T. N. (2014). A meta-analysis of declines in local species richness from human disturbances. Ecol. Evol. 4, 91–103. doi: 10.1002/ece3.909
Murray, D. L., Cox, E. W., Ballard, W. B., Whitlaw, H. A., Lenzar, M. S., Custer, T. W., et al. (2006). Pathogens, nutritional deficiency, and climate influences on a declining moose population. Wildl. Monogr. 166, 1–30.
Murray, J. V., Goldizen, A. W., O’Leary, R. A., McAlpine, C. A., Possingham, H. P., and Choy, S. L. (2009). How useful is expert opinion for predicting the distribution of a species within and beyond the region of expertise? A case study using brush-tailed rock-wallabies Petrogale penicillata. J. Appl. Ecol. 46, 842–851. doi: 10.1111/j.1365-2664.2009.01671.x
Murray, J. V., Low Choy, S., McAlpine, C. A., Possingham, H. P., and Goldizen, A. W. (2008). The importance of ecological scale for wildlife conservation in naturally fragmented environments: a case study of the brush-tailed rock-wallaby (Petrogale penicillata). Biol. Conserv. 141, 7–22. doi: 10.1016/j.biocon.2007.07.020
New Hampshire Fish and Game Department. (2015). New Hampshire Wildlife Action Plan. Concord, NH: New Hampshire Fish and Game Department.
Newbold, T., Hudson, L. N., Hill, S. L. L., Contu, S., Lysenko, I., Senior, R. A., et al. (2015). Global effects of land use on local terrestrial biodiversity. Nature 520, 45–50. doi: 10.1038/nature14324
Olofsson, P., Holden, C. E., Bullock, E. L., and Woodcock, C. E. (2016). Time series analysis of satellite data reveals continuous deforestation of New England since the 1980s. Environ. Res. Lett. 11:064002. doi: 10.1088/1748-9326/11/6/064002
Pastor, J., Dewey, B., Moen, R., Mladenoff, D. J. J., White, M., and Cohen, Y. (1998). Spatial Patterns in the Moose – Forest – Soil Ecosystem on Isle Royale, Michigan, USA. Ecol. Appl. 8, 411–424.
Pearce, J. L., Cherry, K., Drielsma, M., Ferrier, S., and Whish, G. (2001). Incorporating expert opinion and fine-scale vegetation mapping into statistical models of faunal distribution. J. Appl. Ecol. 38, 412–424. doi: 10.1046/j.1365-2664.2001.00608.x
Pearman-Gillman, S. B., Katz, J. E., Mickey, R. M., Murdoch, J. D., and Donovan, T. M. (2020). Predicting wildlife distribution patterns in New England USA with expert elicitation techniques. Glob. Ecol. Conserv. 21:e00853. doi: 10.1016/j.gecco.2019.e00853
Peterson, G. D., Cumming, G. S., and Carpenter, S. R. (2003). Scenario planning: a tool for conservation in an uncertain world. Conserv. Biol. 17, 358–366. doi: 10.1046/j.1523-1739.2003.01491.x
Phillips, S. J., Anderson, R. P., and Schapire, R. E. (2006). Maximum entropy modeling of species geographic distributions. Ecol. Modell. 190, 231–259. doi: 10.1016/j.ecolmodel.2005.03.026
R Core Team (2019). R: A Language and Environment for Statistical Computing. Vienna: R Foundation for Statistical Computing.
Renecker, L. A., and Hudson, R. J. (1986). Seasonal energy expenditures and thermoregulatory responses of moose. Can. J. Zool. 64, 322–327. doi: 10.1139/z86-052
Rhode Island Department of Environmental Management Division on Fish and Wildlife (2015). Rhode Island Wildlife Action Plan. Providence, RI: Rhode Island Department of Environmental Management Division on Fish and Wildlife
Roberts, S. D., and Porter, W. F. (1998). Relation between Weather and Survival of Wild Turkey Nests. J. Wildl. Manage. 62, 1492–1498. doi: 10.2307/380201
Root, T. L., Price, J. T., Hall, K. R., Schneider, S. H., Rosenzweig, C., and Pounds, J. A. (2003). Fingerprints of global warming on wild animals and plants. Nature 421, 57–60. doi: 10.1038/nature01333
Royle, J. A., and Dorazio, R. M. (2008). Hierarchical Modeling and Inference in Ecology: The Analysis of Data from Populations, Metapopulations and Communities. San Diego, CA: Elsevier.
Rustad, L., Campbell, J., Dukes, J. S., Huntington, T., Lambert, K. F., Mohan, J., et al. (2012). Changing Climate, Changing Forests: The Impacts of Climate Change on Forests of the Northeastern United States and Eastern Canada. Washington, DC: USDA. doi: 10.1002/eap.1974
Sauer, J. R., Blank, P. J., Zipkin, E. F., Fallon, J. E., and Fallon, F. W. (2013). Using multi-species occupancy models in structured decision making on managed lands. J. Wildl. Manage. 77, 117–127. doi: 10.1002/jwmg.442
Scheller, R. M., Domingo, J. B., Sturtevant, B. R., Williams, J. S., Rudy, A., Gustafson, E. J., et al. (2007). Design, development, and application of LANDIS-II, a spatial landscape simulation model with flexible temporal and spatial resolution. Ecol. Modell. 201, 409–419. doi: 10.1016/j.ecolmodel.2006.10.009
Seto, K. C., Guneralp, B., and Hutyra, L. R. (2012). Global forecasts of urban expansion to 2030 and direct impacts on biodiversity and carbon pools. Proc. Natl. Acad. Sci. U.S.A. 109, 16083–16088. doi: 10.1073/pnas.1211658109
Smith, Z. P., Glennon, M. J., Karasin, L. N., Reed, S. E., and Kretser, H. E. (2012). Protecting Wildlife Connectivity through Land Use Planning: Best Management Practices and the Role of Conservation Development. Wildlife Conservation Society, Adirondack Program Technical Paper #4. New York, NY: Wildlife Conservation Society.
Soares-Filho, B. S., Rodrigues, H. O., and Costa, W. L. S. (2009). Modeling Environmental Dynamics with Dinamica EGO. Available online at: http://www.csr.ufmg.br/dinamica (accessed August 3, 2009). doi: 10.13140/RG.2.1.5179.4641
Stoner, A. M. K., Hayhoe, K., Yang, X., and Wuebbles, D. J. (2013). An asynchronous regional regression model for statistical downscaling of daily climate variables. Int. J. Climatol. 33, 2473–2494. doi: 10.1002/joc.3603
Swihart, R. K., Picone, P. M., DeNicola, A. J., and Cornicelli, L. (1993). “Ecology of urban and suburban white-tailed deer,” in Urban Deer: A Manageable Resource?” in Proceedings of the55th Midwest Fish and Wildlife Conference, St. Louis, 35–44.
Tesky, J. L. (1995). Vulpes vulpes. US Forest Service, Rocky Mountain Research Station, Fire Sciences Laboratory (Producer). Fire Effects Information System. Available online at: http://www.fs.fed.us/database/feis/animals/mammal/vuvu/all.html (accessed April 5, 2015).
The Nature Conservancy (2009). TNC Terrestrial Ecoregions. Available online at: http://maps.tnc.org/ (accessed June 24, 2019).
Thomas, C. D., Cameron, A., Green, R. E., Bakkenes, M., Beaumont, L. J., Collingham, Y. C., et al. (2004). Extinction risk from climate change. Nature 427, 145–148. doi: 10.1038/nature02121
Thompson, J. R., Lambert, K. F., Foster, D. R., Broadbent, E. N., Blumstein, M., Zambrano, A. M. A., et al. (2016). Four land-use scenarios and their consequences for forest ecosystems and services they provide. Ecosphere 7, 1–22. doi: 10.1002/ECS2.1469
Thompson, J. R., Plisinski, J., Lambert, K. F., Duveneck, M. J., Morreale, L., McBride, M., et al. (2019). Spatial simulation of co-designed land-cover change scenarios in New England: alternative futures and their consequences for conservation priorities. bioRxiv [Preprint]. doi: 10.1101/722496
Thompson, J. R., Plisinski, J. S., Olofsson, P., Holden, C. E., and Duveneck, M. J. (2017). Forest loss in New England: a projection of recent trends. PLoS One 12:e0189636. doi: 10.1371/journal.pone.0189636
Timmermann, H. R., and Rodgers, A. R. (2017). The status and management of moose in North America - circa 2015. Alces 53, 1–22.
U.S. Bureau of Economic Analysis (2019). Outdoor Recreation Satellite Account, U.S. and Prototype for States, 2017. Washington, DC: U.S. Bureau of Economic Analysis.
U.S. Census Bureau (2019). Resident Population in the New England Census Division. Available online at: https://fred.stlouisfed.org/series/CNEWPOP (accessed September 30, 2019).
U.S. Department of the Interior and U.S. Geological Survey (2012). Existing Vegetation Type Layer, LANDFIRE 1.3.0. LANDFIRE. Available online at: https://www.landfire.gov/vegetation.php (accessed December 6, 2019).
U.S. Department of the Interior, U.S. Fish and Wildlife Service, U.S. Department of Commerce, and U.S. Census Bureau. (2016). National Survey of Fishing, Hunting, and Wildlife-Associated Recreation. Washington, DC: U.S. Department of the Interior
U.S. Geological Survey (2014). NLCD 2011 Land Cover (2011 Edition, amended 2014) - National Geospatial Data Asset (n.d.) Land Use Land Cover: U.S. Geological Survey. Available online at: https://www.sciencebase.gov/catalog/item/581d050ce4b08da350d52363 (accessed November 6, 2019).
U.S. Geological Survey (2016). USGS National Transportation Dataset (n.d.). Available online at: ftp://rockyftp.cr.usgs.gov/vdelivery/Datasets/Staged/Tran/GDB (accessed November 6, 2019).
U.S. Geological Survey (2017). 1 meter Digital Elevation Models (DEMs) - USGS National Map 3DEP Downloadable Data Collection: U.S. Geological Survey. Available online at: https://www.sciencebase.gov/catalog/item/543e6b86e4b0fd76af69cf4c (accessed November 6, 2019).
UNEP-WCMC, and IUCN (2016). Protected Planet Report 2016. Gland: IUCN. doi: 10.1017/S0954102007000077
Vermont Department of Public Service (2016). Vermont Comprehensive Energy Plan. Montpelier, VT: Vermont Department of Public Service.
Vermont Fish and Wildlife Department (2015). Vermont Wildlife Action Plan 2015. Montpelier, VT: Vermont Fish and Wildlife Department.
Vitousek, P. M., Mooney, H. A., Lubchenco, J., and Melillo, J. M. (1997). Human Domination of Earth’ s Ecosystems. Science 277, 494–499. doi: 10.1126/science.277.5325.494
Voigt, D. R. (1987). “Red fox,” in Wild Furbearer Management and Conservation in North America, eds M. Novak, J. A. Baker, M. E. Obbard, and B. Malloch (Toronto: Ontario Ministry of Natural Resources), doi: 10.1016/0006-3207(89)90078-5
Walther, G. R., Post, E., Convey, P., Menzel, A., Parmesan, C., Beebee, T. J. C., et al. (2002). Ecological responses to recent climate change. Nature 416, 389–395. doi: 10.1038/416389a
Wattles, D. W., and DeStefano, S. (2011). Status and management of moose in the Northeastern United States. Alces 47, 53–68.
White, E. M., Morzillo, A. T., and Alig, R. J. (2009). Past and projected rural land conversion in the US at state, regional, and national levels. Landsc. Urban Plan. 89, 37–48. doi: 10.1016/j.landurbplan.2008.09.004
Yamada, K., Elith, J., McCarthy, M., and Zerger, A. (2003). Eliciting and integrating expert knowledge for wildlife habitat modelling. Ecol. Modell. 165, 251–264. doi: 10.1016/S0304-3800(03)00077-2
Keywords: climate change, land use change, New England, occurrence probability, scenarios, species distribution models (SDMs), species richness, wildlife
Citation: Pearman-Gillman SB, Duveneck MJ, Murdoch JD and Donovan TM (2020) Drivers and Consequences of Alternative Landscape Futures on Wildlife Distributions in New England, United States. Front. Ecol. Evol. 8:164. doi: 10.3389/fevo.2020.00164
Received: 29 January 2020; Accepted: 12 May 2020;
Published: 05 June 2020.
Edited by:
Anouschka R. Hof, Wageningen University & Research, NetherlandsReviewed by:
Federica Roscioni, University of Molise, ItalyTiago Vasconcelos, São Paulo State University, Brazil
Copyright © 2020 Pearman-Gillman, Duveneck, Murdoch and Donovan. This is an open-access article distributed under the terms of the Creative Commons Attribution License (CC BY). The use, distribution or reproduction in other forums is permitted, provided the original author(s) and the copyright owner(s) are credited and that the original publication in this journal is cited, in accordance with accepted academic practice. No use, distribution or reproduction is permitted which does not comply with these terms.
*Correspondence: Schuyler B. Pearman-Gillman, c2NodXlsZXJwZ0BnbWFpbC5jb20=