 Hannes Gaisberger1,2*
 Sylvain Legay3
 Christelle Andre3,4
 Judy Loo1Rashid Azimov5Sagynbek Aaliev6Farhod Bobokalonov7Nurullo Mukhsimov8
 Chris Kettle1,9
 Barbara Vinceti1
- 1Bioversity International, Rome, Italy
- 2Department of Geoinformatics, University of Salzburg, Salzburg, Austria
- 3Luxembourg Institute of Science and Technology, Belvaux, Luxembourg
- 4New Zealand Institute for Plant and Food Research Ltd., Auckland, New Zealand
- 5Bioversity International, Tashkent, Uzbekistan
- 6Kyrgyz National Agrarian University named after K. I. Skryabin, Bishkek, Kyrgyzstan
- 7Institute of Horticulture and Vegetable Growing of Tajik Academy of Agricultural Sciences, Dushanbe, Tajikistan
- 8Republican Scientific and Production Center of Ornamental Gardening and Forestry, Tashkent, Uzbekistan
- 9Department of Environmental System Science, ETH Zürich, Zurich, Switzerland
Central Asia is an important center of diversity for common walnut (Juglans regia L.). We characterized the genetic diversity of 21 wild and cultivated populations across Kyrgyzstan, Tajikistan, and Uzbekistan. A complete threat assessment was performed evaluating the short-term threats from overexploitation, overgrazing, landslides, and fragmentation as well as long-term threats from climate change. Based on key indicators of genetic diversity and threat magnitude, we developed an approach to identify wild populations for priority conservation and defined appropriate measures to conserve their genetic diversity based on the specific threat magnitudes. We propose (i) ex situ conservation in areas with “severe threat level” due to climate change and (ii) in situ conservation in areas with “minor threat level” due to climate change. In addition, we suggest (iii) assisted natural regeneration in areas where “minor threat levels” from climate change coincide with “severe threat levels” from one or more short-term threats. Our research shows high levels of genetic diversity as well as high threat levels in the walnut populations examined across three countries. Overgrazing and overexploitation were identified as the two most important threats whereas climate change turned out to be of minor concern in the near future. Four out of the five populations selected for priority conservation are severely threatened: Kara-Alma (KGP3) and Sariosiyo (UZP4) by overexploitation and overgrazing, Vanj (TJP2) by landslides and fragmentation and Bostanlyk_2 (UZP2) by overexploitation. Only the Baljuvon population (TJP4) in Tajikistan shows minor threat levels in the short and long term. Thus, for all five priority populations the most appropriate conservation approach appears to be in situ conservation. Spontaneous natural regeneration should be sufficient to ensure the long-term survival of the Baljuvon population (TJP4), while for the other four priority populations assisted natural regeneration may be needed. This network of five sites represents the minimum number of conservation areas for wild walnut in the three countries that should be established to capture a significant amount of the species genetic diversity. Conservation efforts could be extended to home gardens, which are a valuable genetic reservoir for the wild diversity found in the region.
Introduction
Central Asia is a center of origin of many fruit and nut species and is a recognized center of diversity for some species of commercial importance globally, such as common (Persian) walnut (Juglans regia L.). Wild populations of common walnut are found mixed with fruit trees in so-called walnut fruit forests. These forests occur in Kyrgyzstan, Tajikistan, and Uzbekistan on the foothills and slopes of the Tien Shan, Pamir-Alai, and the Kopetdag mountains between 800 and 2,000 m of altitude (Eastwood et al., 2009). Local people depend on the nut harvest as an important contribution to their livelihoods (Schmidt, 2006) but overexploitation and degradation of these forests are of concern internationally (Eastwood et al., 2009). The region was considered by Vavilov to be the center of origin for common walnut, although evidence from more recent studies indicates that walnut may have survived glaciation in multiple refugia in other areas, including southern Europe (Vischi et al., 2017). There is no consensus on the origin of current populations in China, Iran, and southern Europe, but the Persian walnut group of species appears to have evolved in the mountains of Central Asia where wild populations still exist, albeit with longstanding human influence, sometimes as almost pure stands or in mixtures with wild fruit trees (Leslie and McGranahan, 1998).
Common walnut is the most widely grown and commercially valuable among the 21 walnut species, both for timber and nuts (Zeven and de Wit, 1982; Arzani et al., 2008). Commercial production of walnut occurs throughout southern Europe, northern Africa, eastern Asia, the United States, and western South America (Martinez et al., 2010), where it exhibits a broad range of adaptations to a multitude of environments (Dogan et al., 2014). Central Asia, as a Centre of origin, is home to large populations of walnut across varied environmental gradients boasting valuable genetic resources for the global walnut industry. As climate change brings warmer and drier weather and greater climatic extremes to areas where walnut is grown for commercial production, cultivars grown now may not be the best adapted for optimum growth and nut productivity under the new climatic conditions (Luedeling and Brown, 2011). The Central Asian gene pool has developed under hot, dry conditions with frequent climatic extremes and currently represents a source of genetic material that may be important for nut producers worldwide. In addition, several valuable traits such as early fruiting, high productivity, pest and disease tolerance and high fruit and kernel quality are of interest to breeders outside of the region (Leslie and McGranahan, 1998; Germain, 2004).
Compared to other nuts, walnuts are uniquely high in poly-unsaturated fatty acids (PUFAs, 47% in weight), which comprise both omega-6 and omega-3 fatty acids (Martinez et al., 2010). In addition, walnuts are a good source of minerals (such as phosphorous, potassium, and magnesium) and of a wide variety of bioactive components, including phenolic compounds, sterols, tocopherols, and dietary fibers (Hayes et al., 2016). Interestingly, walnut consumption has been shown to reduce various cardiometabolic risk factors and has been associated with a significantly lower risk of various diseases such as cancers and type 2 diabetes (Sabate et al., 2010; Pan et al., 2013). Increased consumption of nuts such as walnut offer a valuable contribution to healthier and lower carbon diets (Willett et al., 2019).
The Red Book assessment assigned Near Threatened status to walnut in Central Asia (Eastwood et al., 2009). The area of walnut fruit forest in Kyrgyzstan is estimated to have declined by as much as 90% since the mid-1960s (Orozumbekov et al., 2014). Official data strongly vary and the real extent of walnut forests remains unclear, but as a consequence of the socio-economic difficulties of the transition period after the independence of Kyrgyzstan in 1991, the pressure on these forests has increased, and the area of the forest has diminished (Beer et al., 2008). Orozumbekov et al. (2014) studied the status of walnut in Kyrgyzstan, supporting the perception that poor regeneration in walnut forests can be attributed to overgrazing. Cantarello et al. (2014) used a modeling approach employing LANDIS-II, combined with empirical data, to predict the impact of wood cutting and grazing on the long-term status of the walnut fruit forest in the Sary-Chelek State Nature Reserve and UNESCO-MAB Biosphere Reserve in the western Tien Shan mountains of Kyrgyzstan. Their results indicated that forest cover would remain intact, but species composition would be simplified and substantially changed. In particular, walnut would decline rapidly, virtually disappearing within 150 years, if the current level of wood cutting continues, but the decline would be less rapid (over a 300-year period) with grazing alone. In the absence of wood cutting but with continued grazing at current levels, natural succession in walnut populations would lead to a gradual replacement of walnut by more shade tolerant species. They suggested that a regular low level of grazing might in fact be necessary to maintain the presence of walnut and of other shade intolerant fruit tree species.
Within the Sary-Chelek Reserve, the extent of human-caused disturbance in the forest, such as harvesting of nuts and fuelwood, has legislated limits (Orozumbekov et al., 2014) that are not necessarily experienced in other walnut fruit forest areas in the region. Where overgrazing occurs, walnut regeneration is lacking, and forest loss associated with landslides and less extreme forms of erosion are likely accelerated.
Understanding the combined effects of different threats on the spatial distribution of walnut populations is necessary for priority setting in conservation planning. Previous attempts to rank threats to forest cover included primarily an assessment of potential changes in biodiversity at a larger regional or eco-regional scale (McPherson et al., 2008; Jarvis et al., 2009; Higgins and Esselman, 2010), combining this information with spatially unspecific IUCN red listing categories (Cadima et al., 2014). In this study, we employed a framework developed by Gaisberger et al. (2017) to predict, at the population level, where multiple threats are likely to impact the extent of suitable habitat for common walnut in the short term (i.e., overexploitation, overgrazing, landslides, and habitat fragmentation) and long term (i.e., projected impact of climate change).
Home gardens, small plots of privately owned land where farmers plant different crops and varieties for their own consumption, can represent authentic reservoirs of walnut genetic diversity and essential components of livelihood strategies in Central Asian countries. In Tajikistan, for example, home gardens provide an estimated 50% of total household income (Lapena et al., 2014). Therefore, we also evaluated to what extent these cultivated populations, which traditionally consists of trees directly grown from seed, contributed to maintaining the genetic diversity of common walnut as a crucial component of agricultural biodiversity in the region.
We characterized genetic diversity across 630 individuals genotyped at 12 nuclear microsatellite loci coupled with spatial threat mapping to address three questions relevant to the conservation of genetic resources in walnut:
(1) What is the spatial distribution of Juglans regia L. across Kyrgyzstan, Tajikistan, and Uzbekistan;
(2) How is genetic diversity distributed in wild and cultivated populations (also called “home garden” populations in this study);
(3) What is the distribution and intensity of different threats to wild walnut populations distributed across the three countries?
Based on the above analysis we propose a prioritization approach as well as recommendations to safeguard the most vulnerable reserves of genetic diversity in our study region.
Materials and Methods
Sampling and Genetic Analysis
Between September 2013 and September 2015, samples of Juglans regia L. were collected from three countries in Central Asia: Tajikistan, Uzbekistan, and Kyrgyzstan. We selected 360 sample individuals from wild tree populations from typical mountainous sites (four populations of 30 individuals in each country) and 270 samples from cultivated populations from home gardens (three populations of 30 individuals in each country). Within each wild population, a systematic sampling experimental design has been chosen to collect the 30 individual adult trees with at least 50 m between any two sampled trees. Each tree location was recorded with GPS-coordinates (Table 1 and Figure 1), and the immediate area surrounding each sampled tree was searched for seedlings to assess the level of natural regeneration as well as for the presence of livestock. Most populations sampled were located more than 10 km apart, with exception of 11 population pairs (Supplementary Table 1).
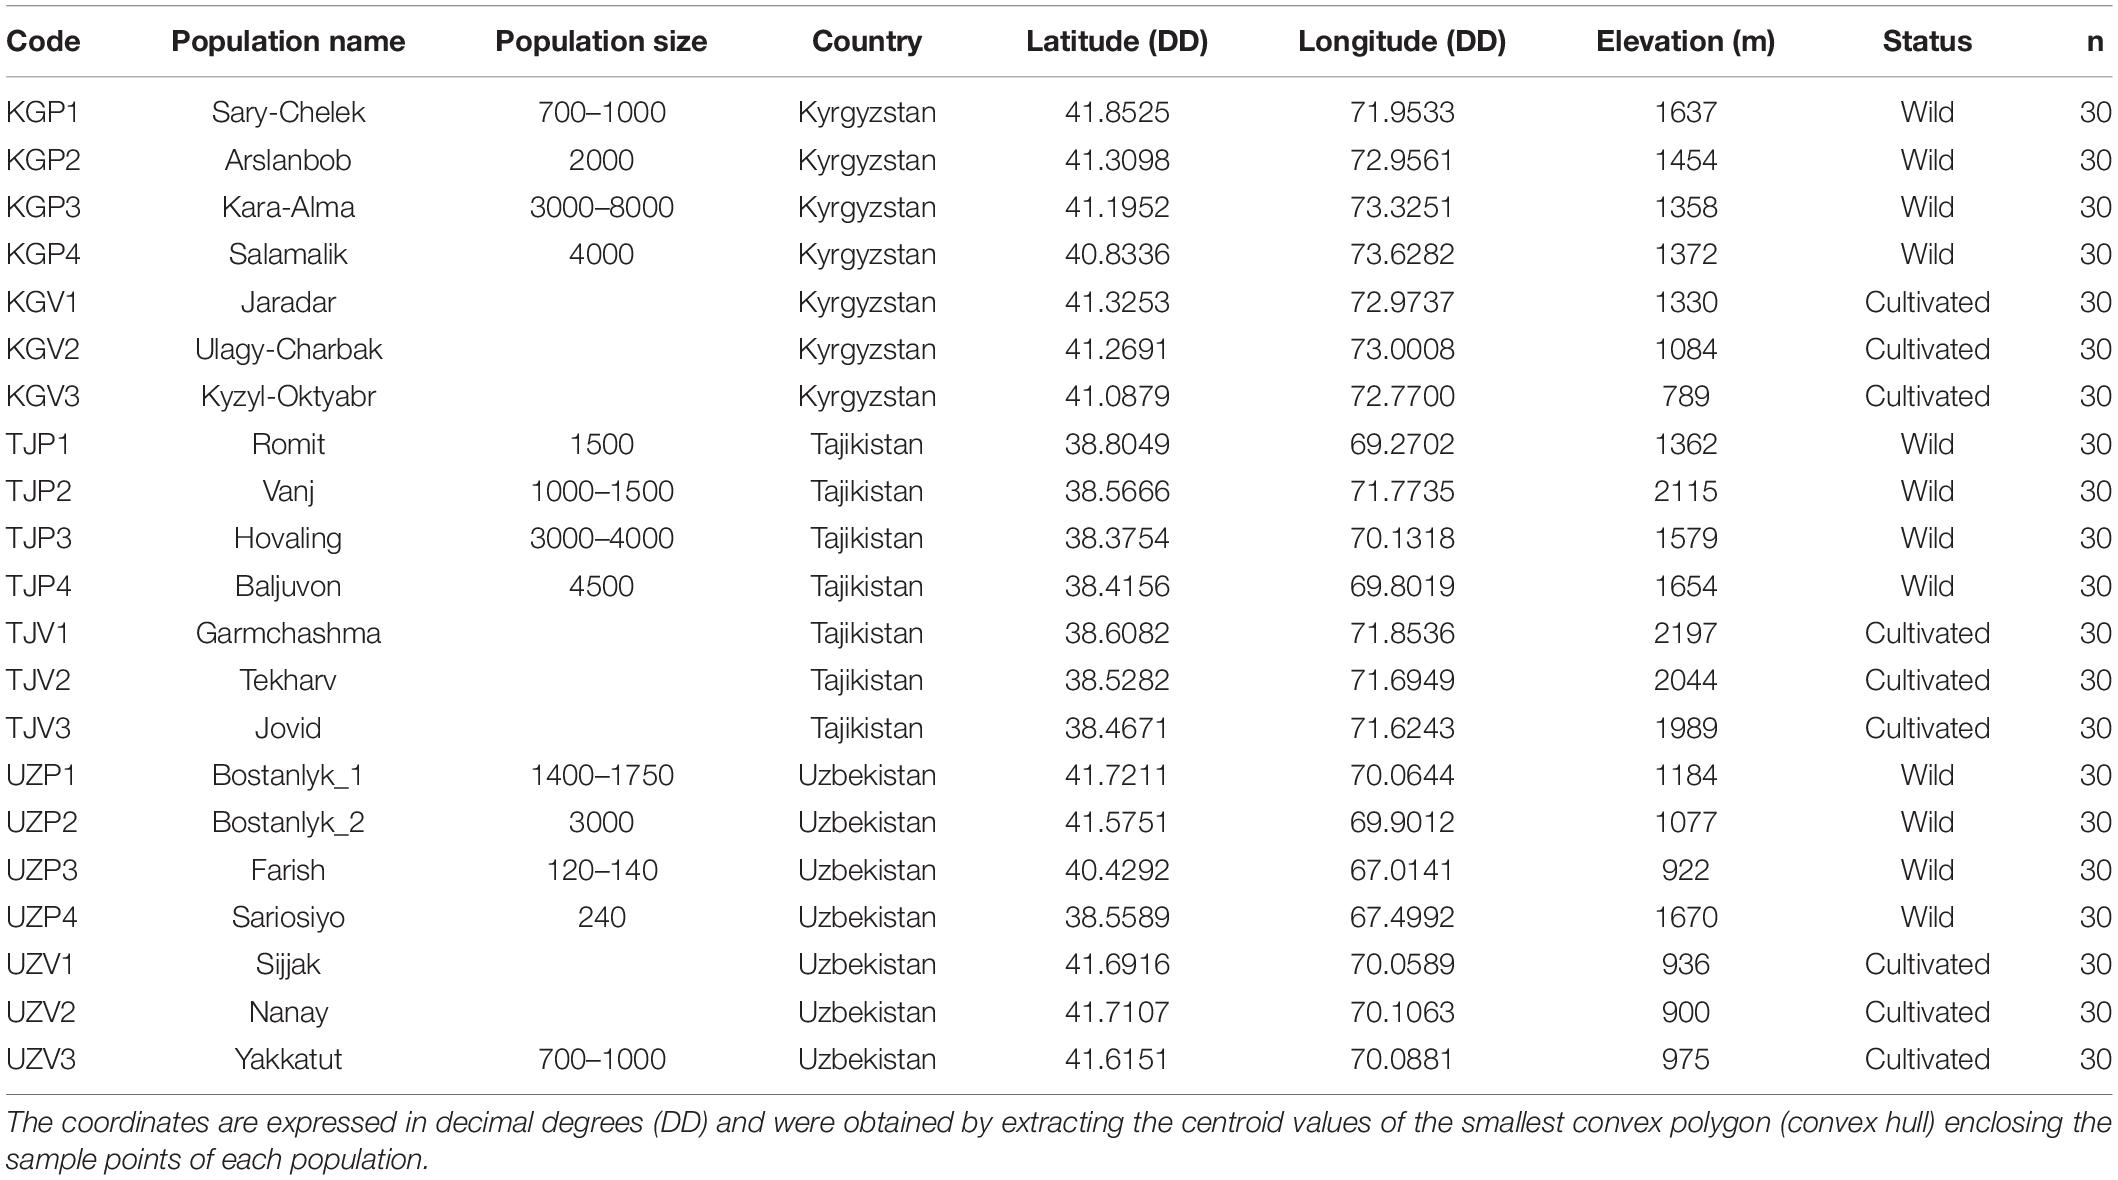
Table 1. List of 21 Juglans regia L. populations analyzed in this study.
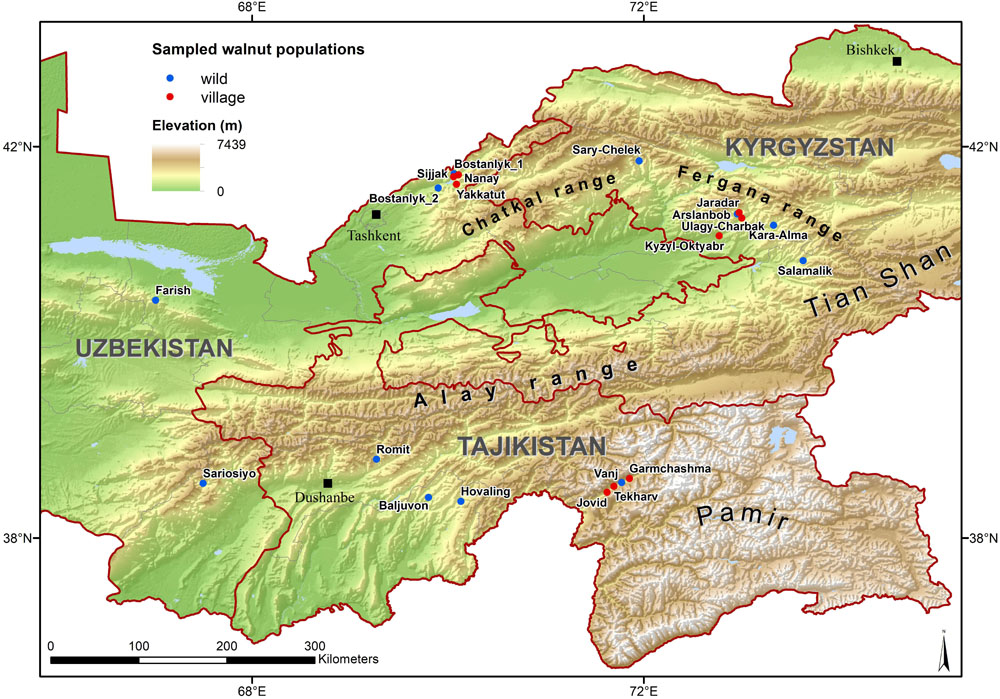
Figure 1. Study area with 21 sampled wild and cultivated populations of Juglans regia L.
From each sampled tree, three leaves were collected and stored in silica for subsequent genetic analyses conducted at the Luxembourg Institute of Science and Technology (LIST). Genomic DNA was extracted from ground silica dried leaf material using the NucleoSpin Plant II kit (Macherey-Nagel). All SSR loci were PCR amplified following Pollegioni et al. (2014) and multiplex PCR products analyzed on an ABI3500 Genetic Analyzer (Life Technologies, Waltham, MA, United States). Subsequently, fragment analysis was conducted using the Genemapper 5.0 software.
Simple sequence repeats (SSR) markers were selected based on their ease of use and peak quality. All samples were genotyped using 12 SSRs previously used in Juglans regia L. genetic diversity studies (Dangl et al., 2005; Ibrahimov et al., 2009; Pollegioni et al., 2009; Ahmed et al., 2012; Pollegioni et al., 2014). Allele calling and genotyping were conducted using Convert v4.1 and PowerMarker v3.25 (Liu and Muse, 2005). Allele frequency, genotype number, expected and observed heterozygosity as well as the allele number and the Shannon diversity index were obtained with POPGENE v1.32 (Yeh and Boyle, 1997). Allelic rarefaction, i.e., allele and private allele richness, were evaluated using HP-Rare v1.0 (Kalinowski, 2005). Arlequin V3.5.2.2 (Excoffier and Lischer, 2010) was used to compute the statistical test on the Hardy-Weinberg disequilibrium, to calculate the inbreeding coefficient (FIS) values and the fixation index (FST) distances between populations.
The presence of population genetic structure was tested with STRUCTURE v2.3.4, performing a Bayesian clustering of wild and cultivated populations jointly (Pritchard et al., 2000). Different runs were carried out with a different number of clusters from K = 1 to K = 20 with 50,000 iterations and 20 repeats. The method developed by Evanno et al. (2005) was first used to determine the optimal number of clusters. Then, the results obtained from STRUCTURE were analyzed with the Harvester tool (Earl and von Holdt, 2012). The results in the ΔK chart enabled to determine the optimal number of clusters. The Wilcoxon signed-rank test implemented using the BOTTLENECK software (Piry et al., 1999) enabled to detect recent bottlenecks. As previously described, a two-phase model (TPM) with 95% SMM and 5% multistep mutations was chosen (Piry et al., 1999; Pollegioni et al., 2014).
Subsequently, the Inverse Distance Weighted (IDW) interpolation function implemented in ArcGIS 10.1 (ESRI, Redlands, CA, United States) was used to show the geographic patterns of allelic richness of wild and cultivated walnut populations (Pollegioni et al., 2014). As described by Murphy et al. (2008), to minimize the effect of irregular sampling, we created a continuous surface map using a linearly weighted combination of all sample points, such that each input point had a local influence declining with distance. Then, we restricted the surface to the distribution area corrected through expert validation.
Species Distribution Modeling
Species distribution modeling (SDM) was used to estimate the potential geographic distribution of wild walnut populations in the three target countries. The wild tree occurrence records from this study were complemented with provenance locations (GPS data) from the University of Oxford (Hemery, 2000) and the Bioversity Collecting Mission Database (Thormann et al., 2012). MaxEnt (Phillips et al., 2006) was selected as the modeling algorithm due to its good performance when compared with other modeling approaches and given its wide use in conservation analyses (Elith et al., 2006).
We used a set of 23 environmental predictor variables with a spatial resolution of 30 arc seconds (ca. 1 km at the equator) to define the ecological niche of wild walnut populations. This set comprised 19 bioclimatic variables of the WorldClim database Version 1.4 (Hijmans et al., 2005), elevation data (Farr et al., 2007), a slope and aspect layer calculated from the elevation layer with ArcGIS 10.1 and the spatially dominant soil unit from the Harmonized World Soil Database v1.2 (FAO et al., 2012).
In order to avoid undesirable co-linearity (Heikkinen and Luoto, 2006), we calculated the pairwise correlation coefficient for the continuous predictor variables (bioclimatic and geophysical) extracted from the occurrence points. Highly cross-related variables (correlation coefficient > 0.9 or < −0.9) were highlighted and ranked according to the number of correlated variables. The variable with the highest rank was retained while the redundant ones were discarded. If two variables had the same rank, we used the sum of the absolute correlation values to select the most representative variable (Lompo et al., 2018).
In addition, we qualitatively examined the overlap of the ecological niche of wild and cultivated populations extracted from the 23 environmental layers, using a Factorial Analysis of Mixed Data (FAMD), a principal component method that accounts for both continuous and categorical parameters (Husson, 2008). It behaves as a Principal Component Analysis (PCA) in treating quantitative variables and as a Multiple Correspondence Analysis in dealing with qualitative variables in the same dataset. During the analysis, quantitative and qualitative variables are normalized in order to balance their influence.
Model Training, Evaluation, and Prediction
Based on the method described above, we used 11 predictor variables (seven bioclimatic, three geophysical, and one edaphic) associated with 374 wild walnut occurrence points as input for the MaxEnt model (Supplementary Table 2).
The algorithm was run with the maximum number of iterations set to 5,000, which enables the model to have adequate time for convergence (Young et al., 2011). Ten thousand random points were used as background points across Central Asia for model training and a ten-fold cross validation option (10:1 ratio of training versus test samples) was implemented; this was summarized subsequently into a single layer with an average logistic output value (Phillips et al., 2006) across the replicates. The performance of the SDM was assessed checking three commonly used parameters (Kong, 2012; Jones, 2012): (i) 10-fold average area under the Receiver Operating Characteristic (ROC) curve (AUC) of test data; (ii) standard deviation of the test AUC of the 10 different folds below 0.15; and (iii) True Skill Statistic (TSS), a threshold-dependent measure of model accuracy (Allouche et al., 2006).
We restricted the modeled distribution of common walnut to the “Equal sensitivity and specificity” threshold, one of the most widely used and recommended threshold criteria (Liu et al., 2005; Young et al., 2011). We further refined the maps by excluding urban areas, water bodies and permanent snow and ice regions defined by the soil cover data (European Space Agency [ESA], 2009), and by excluding areas with less than 1% tree cover (DiMiceli et al., 2011). Then we created binary maps of suitable versus unsuitable habitat (Scheldeman and van Zonneveld, 2010).
Expert Validation of SDM
Distribution models of plant species need to be carefully interpreted since they may predict species presence in areas where the species does not occur due to dispersal limitations, environmental constraints not included in the modeling and/or human disturbance. To overcome this general limitation of SDMs, we involved local experts in reviewing and correcting the modeled distribution maps of common walnut in the three countries and refined versions were produced.
Spatial Threat Analysis
Selection and Construction of Key Layers
The threat analysis was restricted to the common walnut distribution area in the three countries, corrected by local experts. Five key threats were identified as relevant for the species, in consultation with local scientists: Overexploitation (i.e., overharvesting of nuts, cutting, and collection of firewood), overgrazing (i.e., cattle farming and ranching), landslides, habitat fragmentation (assessed through discontinuities in the modeled species distribution) and climate change. For each threat, a spatial layer with an estimate of the threat intensity was constructed (Table 2).
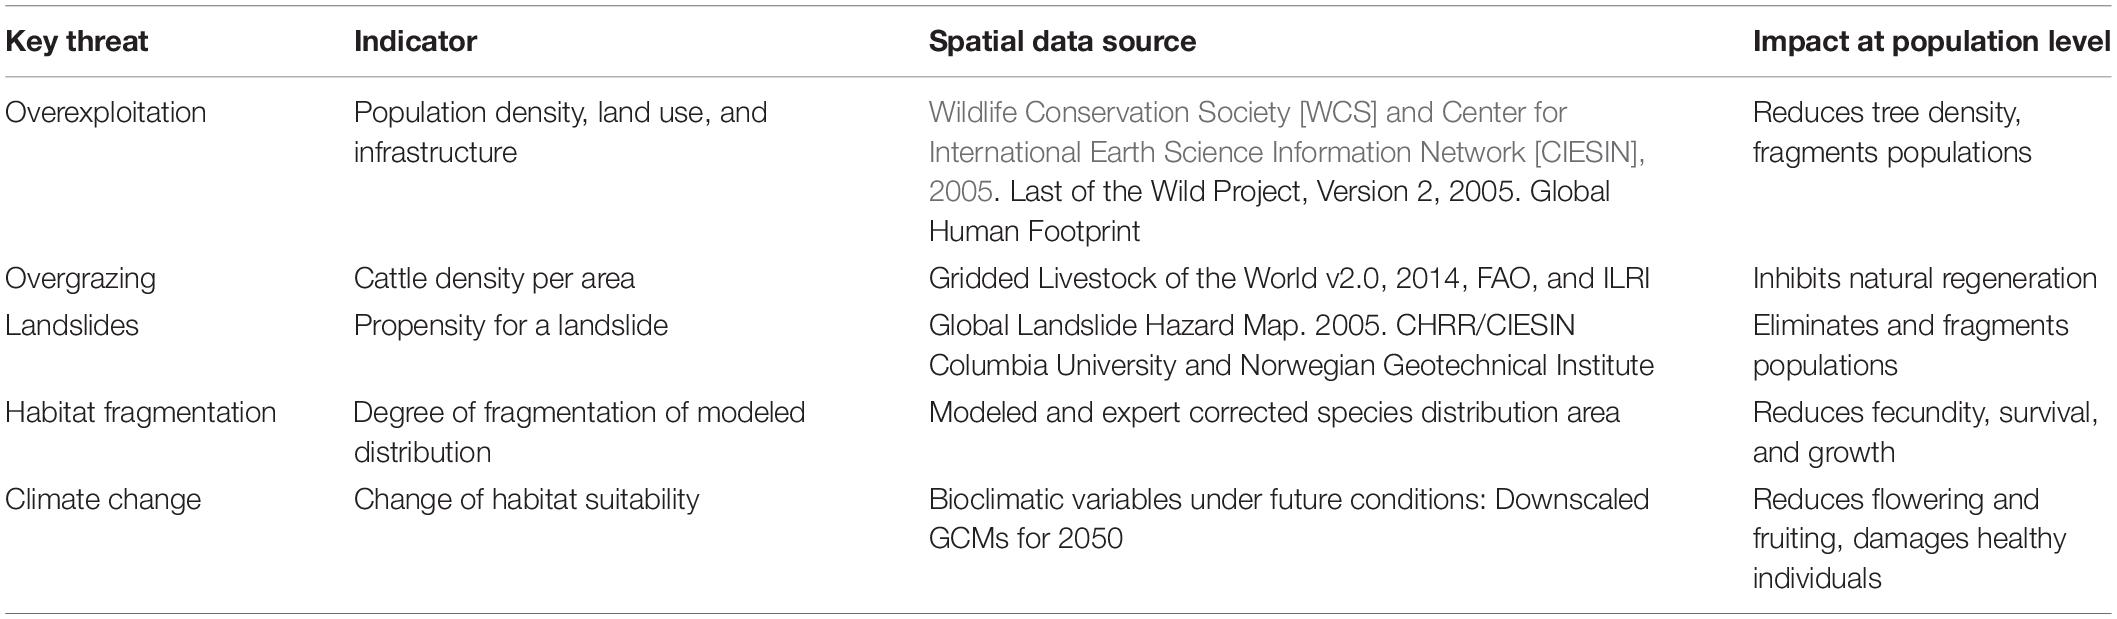
Table 2. Threat layers and corresponding data sources.
The spatial resolution of the threat layers was defined as 30 arc seconds (ca. 1 km at the equator), based on the resolution of most available data sources and the demand for spatial detail. Layers with different resolutions were resampled in ArcGIS 10.1. To facilitate calculations, the raster layers with quantitative data (overexploitation and overgrazing) were normalized on a pixel-by-pixel basis to obtain values between 0 and 1. The methodological details of the construction of the threat layers are outlined in Table 2 and Supplementary Table 3.
Climate change
The predicted climate data for 2050 (average for 2041–2060) was obtained from the WorldClim database (Hijmans et al., 2005) at a spatial resolution of 30 s (ca. 1 km at the equator). MaxEnt (Phillips et al., 2006) was used to project suitable habitat for common walnut to future conditions, computed as median ensembles of 19 general circulation models (GCMs), based on the representative concentration pathways (RPCs) RCP4.5 and RCP8.5. These correspond respectively to an intermediate and worst-case scenario of radiative forcing caused by increased atmospheric greenhouse gas concentrations (IPCC, 2014).
Climate change threat maps were created to delineate: (i) very high threat: predicted absence of suitable habitat for both scenarios (RCP 4.5 or RCP 8.5); (ii) high threat: predicted absence of suitable habitat for one scenario (RCP 4.5 or RCP 8.5); (iii) medium threat: predicted presence of suitable habitat for both scenarios in novel regional climate conditions (these correspond to areas that are outside the minimum-maximum range of current bioclimatic conditions for at least one bioclimatic variable); (iv) low threat: predicted presence of suitable habitat for one scenario in novel regional climate conditions; and (v) no threat: predicted presence of suitable habitat for both scenarios.
Novel climatic conditions appearing within the range of the species, according to future projections, were considered as a threat associated with climate change.
Threat Magnitude Rating
In order to estimate the relationship between threat intensity and potential impact we applied the methodology developed by Gaisberger et al. (2017) and used a five-point rating scale (Supplementary Table 4) to define the threat magnitude. The threat values for landslides, fragmentation and climate change were directly classified (Table 3), whereas expert feedback was used to attribute a magnitude to the impact of overexploitation and overgrazing to all 12 sampled wild walnut populations. Comparing the expert ratings with the threat intensities values for overexploitation and overgrazing, we calculated the correlation factors and interpolated them to the expert corrected modeled distribution area using the Inverse Distance Weighted (IDW) interpolation function implemented in ArcGIS 10.1 (ESRI, Redlands, CA, United States). We considered it appropriate to apply a simple geographic interpolation function, such as IDW, because we found that threat impacts were population specific, therefore spatially associated with the particular forest management practices and legislation in place in a specific location rather than following any regional or country patterns. Then, we multiplied the threat intensity values by the correction factors on a pixel-by-pixel basis and transformed the results into the corresponding threat magnitude classes as by Table 3.
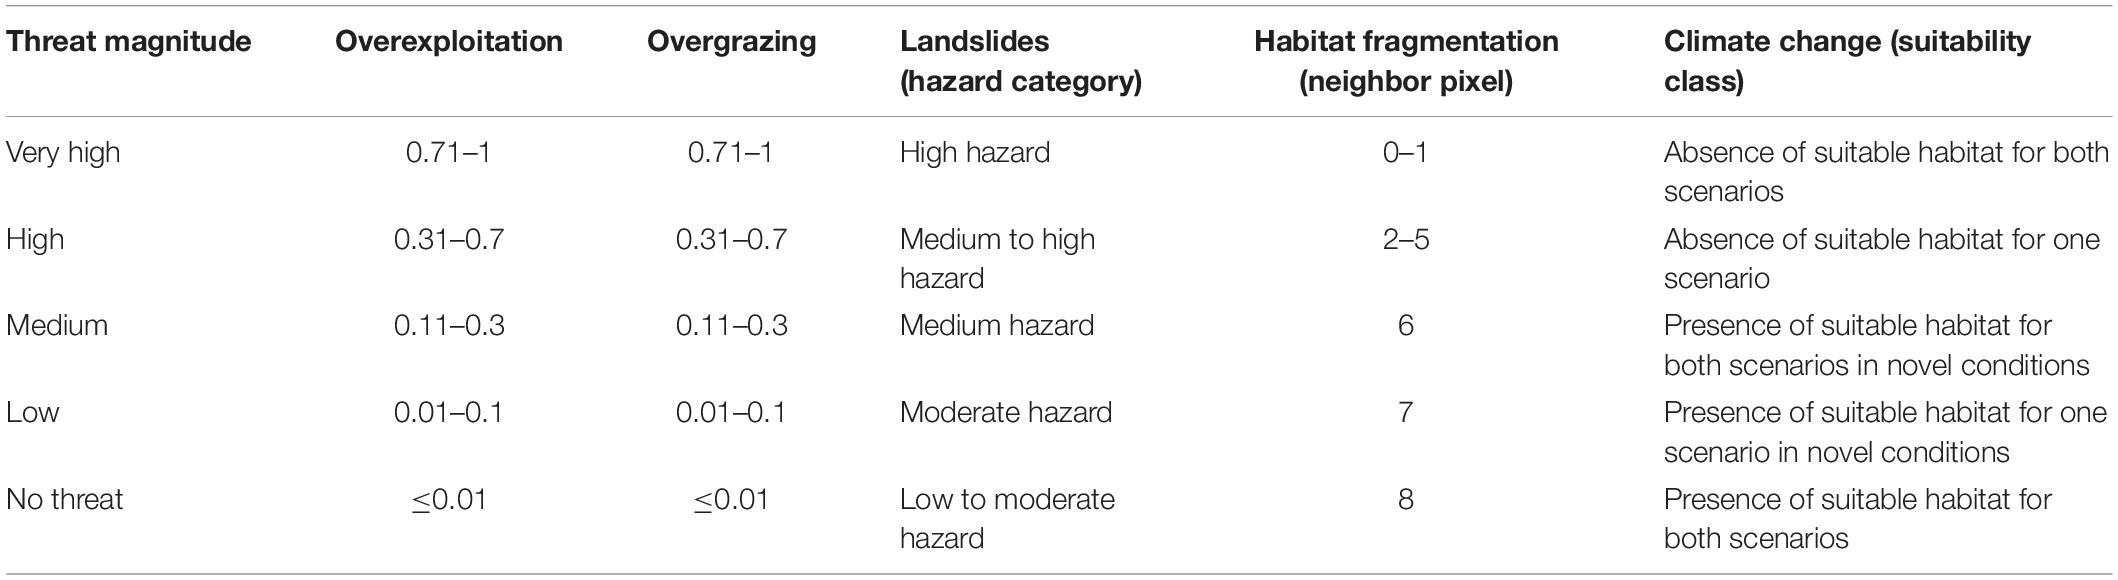
Table 3. Threat levels and applied criteria to transform the threat intensity into threat magnitude.
Individual and combined threat levels
We created five individual threat maps (overexploitation, overgrazing, landslides, fragmentation, and climate change) that we restricted to the expert-corrected walnut distribution area included within the boundaries of Kyrgyzstan, Tajikistan, and Uzbekistan. The short-term threats overexploitation, overgrazing, landslides and fragmentation were aggregated into one combined threat map. The combined threat level of an area, corresponding to an individual pixel, was set to be equal to the highest threat level among the four individual layers.
It is important to note that threat classes generated through this process do not represent an absolute measure of the impact on common walnut tree populations but rather the relative likelihood of a species to survive in one place versus another based on the threat level of one or more threats.
Priority Setting
Based on key indicators of genetic diversity and threat magnitude, we developed an approach to identify priority populations for conservation of common walnut across the three countries and defined the most appropriate conservation measures needed for each of these priority populations, based on their specific threats.
We adapted a methodology presented by Vinceti et al. (2013) and clustered the 12 wild walnut populations based on their genetic similarity, choosing K = 5 (results from STRUCTURE) as a compromise between genetic differentiation of walnut populations and feasibility of conservation efforts, distributed across the three countries. In each cluster, we identified the highest-ranking population based on three parameters: Allelic richness (AR), private allelic richness (PAR), and Shannon diversity index (SDI). Allelic richness is a very informative parameter and a good indicator of past demographic changes, thus meaningful from a conservation point of view, while private allelic richness is an indicator of the distinctiveness of a population (Petit et al., 1998). As secondary parameter, we considered the SDI that defines within population variation.
The highest-ranking populations were assigned a conservation priority and the type and magnitude of the threats associated to each population were assessed. We recommend (i) ex situ conservation in areas with high and very high threat levels due to climate change (further referred to as “severe threat level” in this study) and (ii) in situ conservation in areas with medium to no threat due to climate change (further referred to as “minor threat level”). In addition, we suggest (iii) assisted natural regeneration in areas where “minor threat levels” from climate change coincide with “severe threat levels” from short-term threats. Assisted natural regeneration aims to accelerate natural successional processes by removing or reducing barriers to natural forest regeneration, such as competition with weedy species or recurring disturbances (i.e., fire, grazing, and wood harvesting). If this measure is not sufficient, enrichment planting can be used in addition to speed up the process (Shono et al., 2007). Spontaneous natural regeneration might be adequate for successful tree regeneration in areas where climate change as well as short-term threats indicate “minor threat levels” (Chazdon et al., 2017; Crouzeilles et al., 2017), although further research on this topic, especially in temperate forests, is needed.
Results
Genetic Diversity of Walnut Populations
The analysis of genetic diversity in adult individuals across the 21 common walnut populations sampled (Supplementary Table 5) revealed high levels of polymorphism (two SSR markers in particular, WGA276 and WGA202, with 26 and 19 alleles detected, and 106 and 69 different allelic combinations identified, respectively).
Genetic diversity of walnut was generally consistent between neighboring wild and cultivated populations in home gardens and displayed noticeable differences among sites, as indicated by the patterns of AR illustrated in Figure 2. Wild populations in Uzbekistan displayed the largest range in AR values among populations (AR: 3.10–3.98), compared to wild populations in Tajikistan (AR: 3.21–3.68) and Kyrgyzstan, which had the smallest differences in AR among populations (AR range: 2.76–3.06). For wild populations, the highest genetic diversity was observed in Uzbekistan and the lowest in Kyrgyzstan. The wild population of Sariosiyo (UZP4) displayed the highest allelic richness and SDI, followed by UZP3, TJP4, and TJP3. A similar trend was observed for PAR and polymorphic information content (PIC) that were also notably higher in Uzbek and Tajik wild populations.
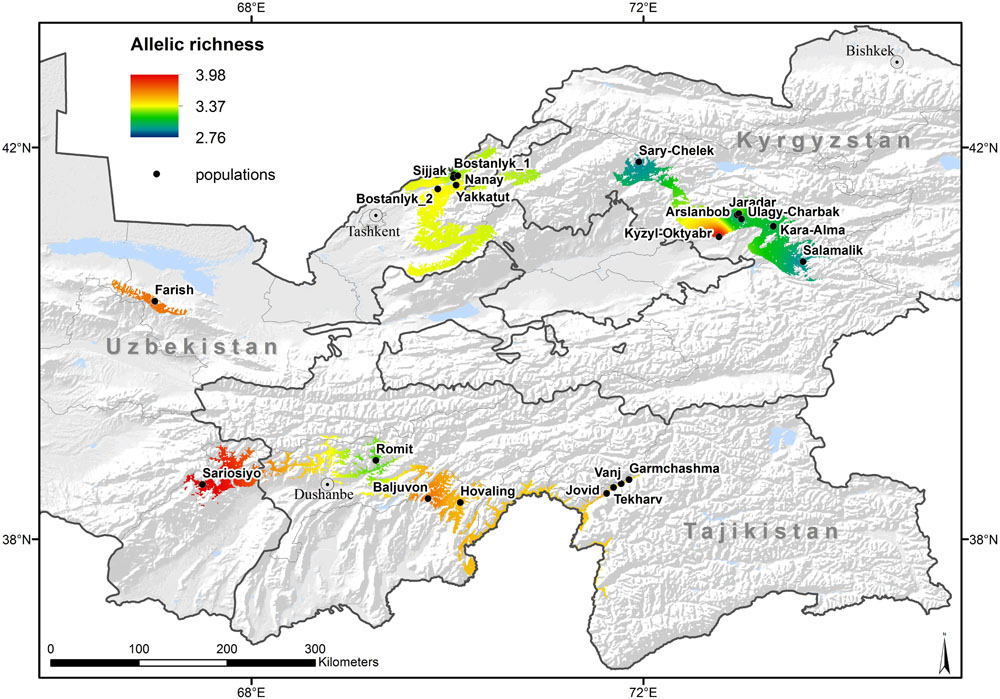
Figure 2. Allelic richness (average number of alleles per locus) calculated for 21 walnut populations 12 SSR markers, and its IDW interpolation overlaid on the expert corrected modeled distribution area of the species.
Regarding the cultivated populations, the broadest range of AR values was found in Kyrgyzstan, followed by Tajikistan and Uzbekistan, with more homogeneous values across the sampled populations. Home garden populations in villages surrounding the Tchavark lake (UZV1, UZV2, UZV3) displayed similar allelic richness to their neighboring wild populations in Bostanlyk (UZP1 and UZP2). A similar pattern was observed for the SDI values in two cultivated populations of the Vanj Valley (TJV1, TJV3) with respect to their neighboring wild population (TJP2). Differently from the other two countries, home garden populations in Kyrgyzstan (KGV1, KGV3) displayed a higher diversity compared to the nearby wild population (KGP2), with a significantly higher value of private allelic richness recorded in the village of Jaradar (KGV1). Based on information gathered from local experts, the trees sampled in Kyzyl-Oktyabr (KGV3) had been planted in the 60s but there is no information on their putative origin. The genetic diversity parameters of KGV3 were quite different from those associated to the other Kyrgyz wild populations and this suggests a different genetic background.
In all populations, the mean observed heterozygosity (Ho) was generally lower than the expected heterozygosity (He) except for the wild population of Vanj (TJP2) and Baljuvon (TJP4) and Kara-Alma (KGP3). Deviation from the Hardy-Weinberg equilibrium was observed for multiple loci in Uzbek wild populations (UZP1, UZP2, and UZP4) and cultivated populations such as Tekharv (TJV2), Sijjak UZV1), Jaradar (KGV1), Ulagy-Charbak (KGV2), and Kyzyl-Oktyabr (KGV3).
A significant heterozygosity excess was revealed by a sided Wilcoxon test for Vanj wild population (TJP2) and the nearby village Jovid (TJV3), indicating a recent reduction of the population size as indicated by the results of the bottleneck analysis below. Surprisingly, we did not observe any heterozygosity excess in the Bostanlyk wild populations, a result that differed from our expectations based on previous work carried out on walnut in Central Asia (Pollegioni et al., 2014). On the contrary, a significant deficiency in heterozygosity was observed in the Sijjak (UZV1), Yakkatut (UZV3), and Jaradar (KGV1) home garden populations (Table 4). All these populations displayed an L-shaped allelic distribution, except for the TJP2 wild population, possibly affected by a recent bottleneck. The average FIS value for each population was between −0.046 (Kara-Alma, KGP3) and 0.159 (Farish, UZP3).
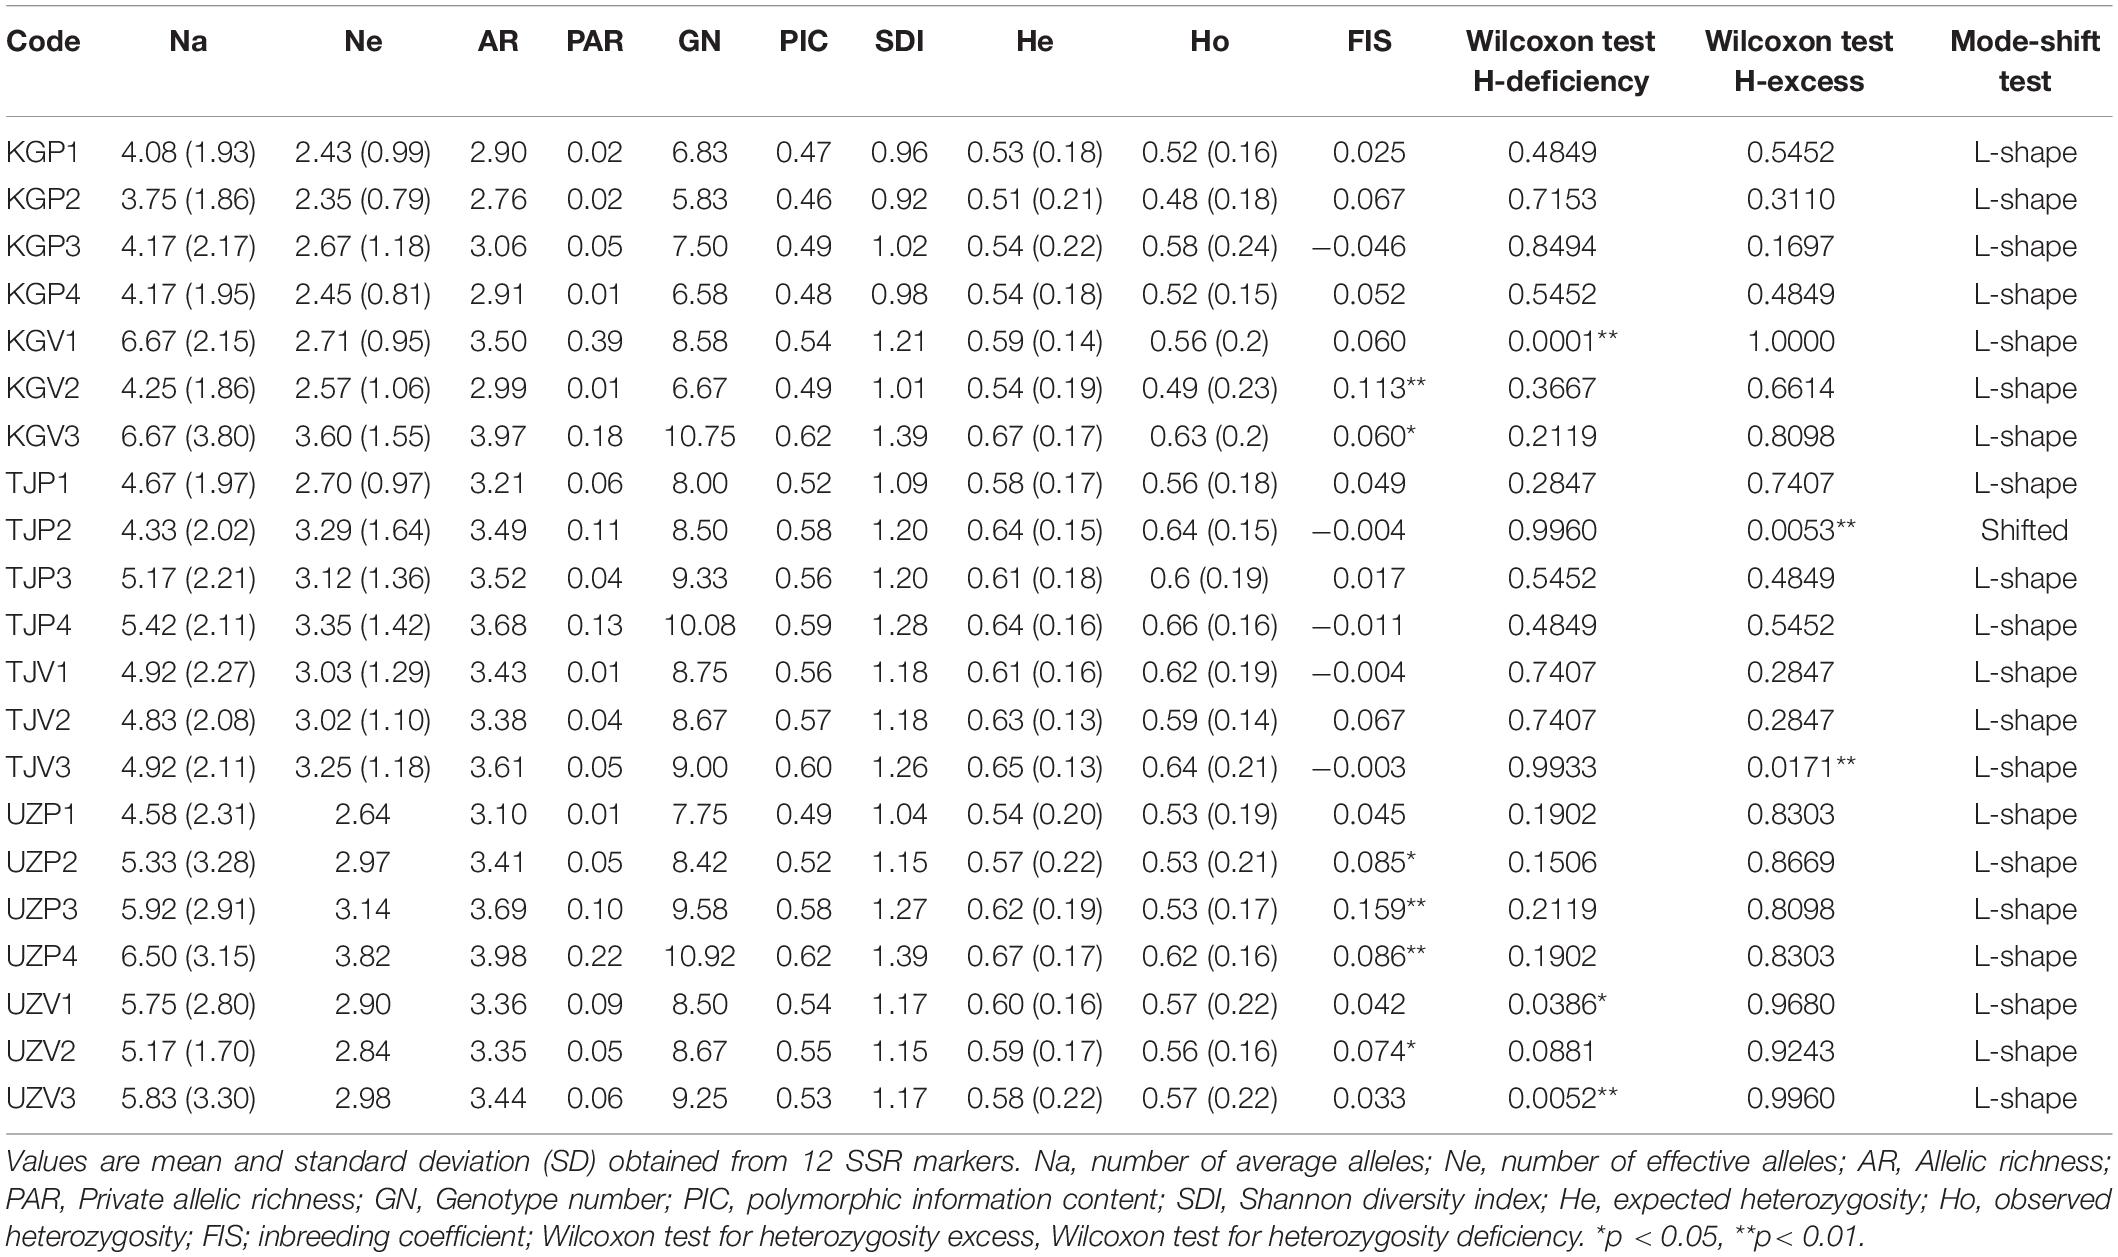
Table 4. Within population genetic diversity of the 21 walnut populations sampled.
Genetic Structure
The genetic structure of the 21 populations was investigated using STRUCTURE v2.3.4 (Figure 3). The Structure analysis was consistent with a PCA performed on the genetic differentiation (Supplementary Table 6 and Supplementary Figure 1) and UPGMA phylogenetic tree (Supplementary Figure 2) demonstrating the significant genetic structure. The statistics developed by Evanno et al. (2005) enabled to obtain an optimal K number = 2 (ΔK = 403.25), followed by K = 3 (ΔK = 20.19) and K = 5 (ΔK = 4.99) (Supplementary Figures 3, 4). Based on the UPGMA phylogenetic tree, we also tested a clustering with K = 8.
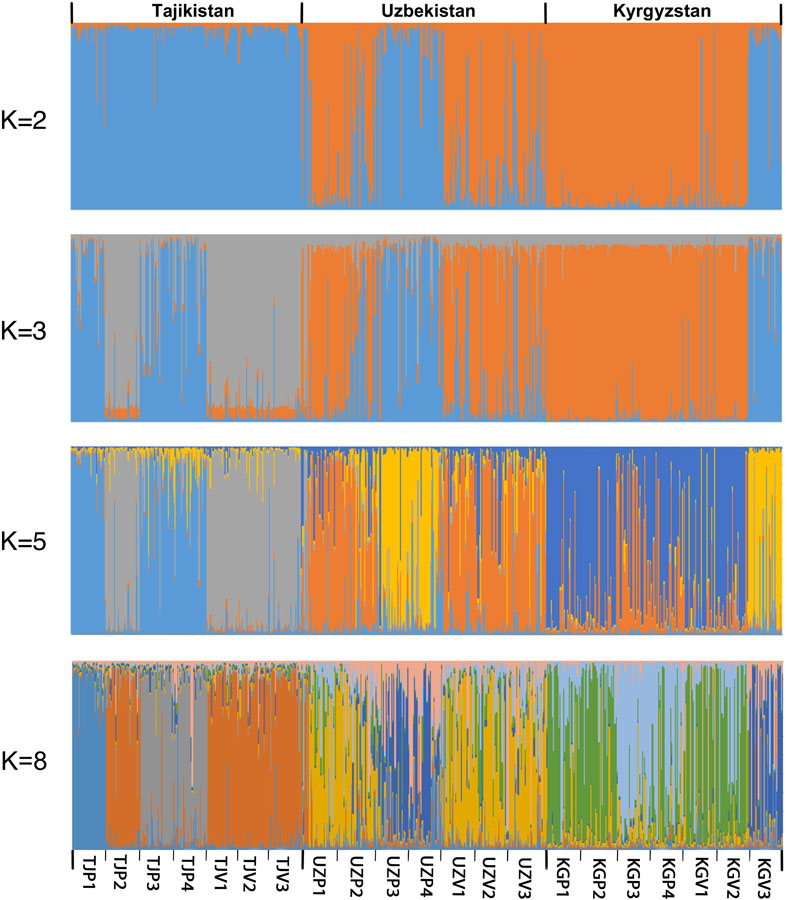
Figure 3. Population structure inference for 624 Central Asia walnut samples in Structure v2.3.4. Each genotype is represented by a vertical colored line. Colors represent the membership of each individual to the different clusters.
Using K = 2, the 21 populations split in two main clusters, corresponding to a Southwestern and a Northeastern group, with the KGV3 population being an exception, not following this main pattern. The Southwestern group includes all wild and cultivated populations in Tajikistan as well as two wild populations in Uzbekistan (UZP3, UZP4). The Northeastern group includes all Kyrgyz wild and cultivated populations (except KGV3) and the Uzbek populations from nearby the Tcharvak lake (UZP1, UZP2, UZV1, UZV2, UZV3).
To avoid the well-known bias in the ΔK statistic that often indicates K = 2 as optimal (Pollegioni et al., 2014), higher cluster numbers were tested. With an increasing K the affiliation of populations to different clusters was increasingly defined by their geographic origin. A change to K = 3 increased the splitting of Tajik populations, separating Vanj (TJP2) and its surrounding home garden populations from the Hovaling and Baljuvon populations (TJP3, TJP4), in accordance with the results from the UPGMA phylogenetic tree. On the contrary, Romit wild population (TJP1) clustered with the wild populations of Hovaling and Baljuvon (TJP3, TJP4). The analysis with K = 5 distinguished between Farish (UZP3), Sariosiyo (UZP4), and Kyzyl-Oktyabr (KGV3) from Romit (TJP1), Hovaling (TJP3), and Baljuvon (TJP4). Additionally, K = 5 indicated a split in the remaining Northeastern group into two subgroups separating Uzbek population of the Tcharvak lake from the Kyrgyz populations. Finally, the K = 8 option displayed in Figure 3 produced clusters similar to those resulting from the UPGMA phylogenetic tree results (Supplementary Figure 2).
Species Distribution Modeling
The modeled distribution area of common walnut is associated with mountainous sites between 630 and 2,500 m of altitude. Based on the value of indicators (ATAUC = 0.9913, STAUC = 0.0023, TSS = 0.910), the SDM performance was good (Jones, 2012; Kong, 2012). The incorporation of expert knowledge into the original distribution model led to a reduction of the species range by about 56% (Figure 4). Wild populations covered a broader range of environmental conditions than the cultivated populations in home gardens (Supplementary Figure 5).
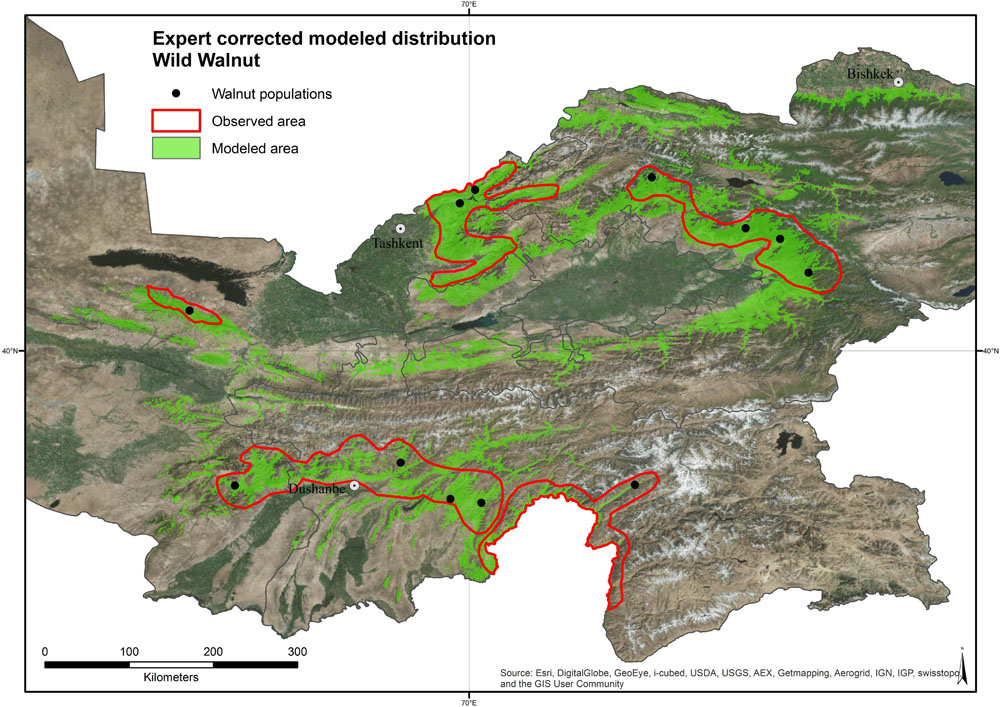
Figure 4. Modeled and expert corrected distribution area of wild Juglans regia L.
Spatial Threat Analysis
The combination of species distribution models and threat maps resulted in a visualization of species-specific patterns of pressure from threats throughout the distribution range of common walnut in the three countries. The short-term threats are presented individually and in combination (Figures 5A–F). From these map layers we also calculated the percentage of modeled distribution area assigned to the threat classes, individually and in combination (Supplementary Table 7).
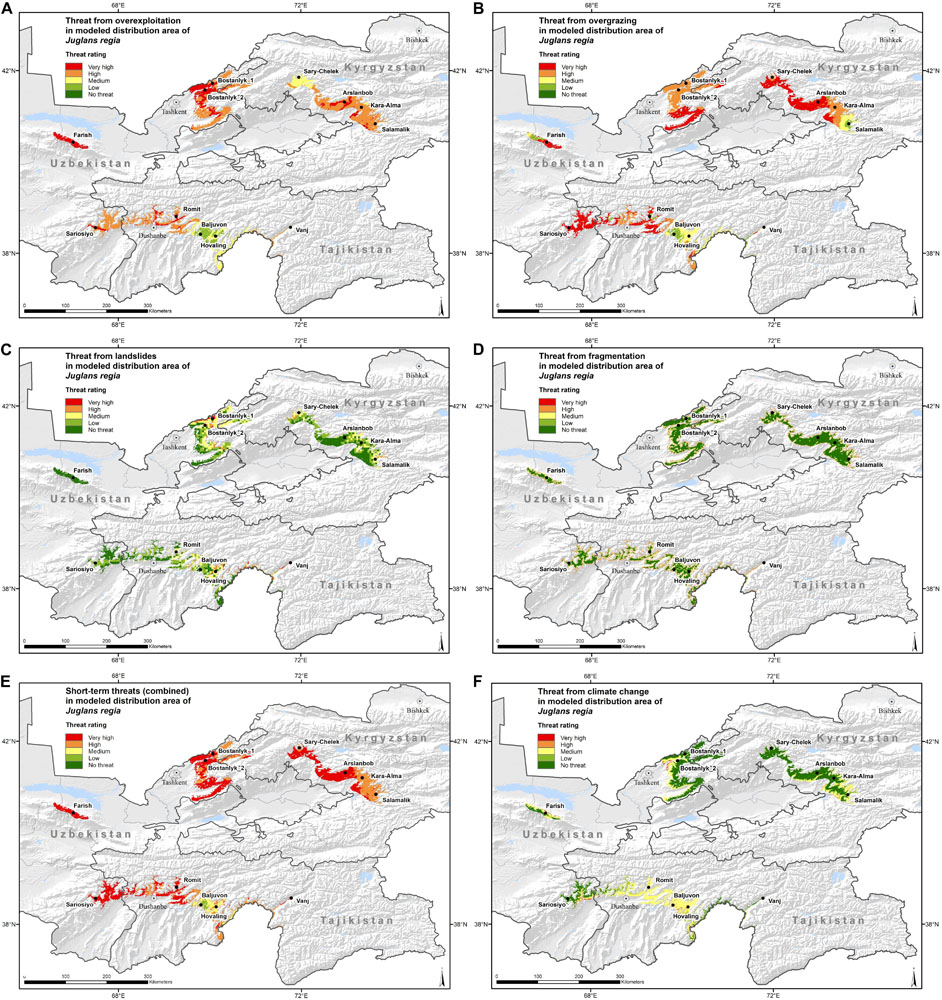
Figure 5. Maps with threat magnitude levels of (A) “Overexploitation,” (B) “Overgrazing,” (C) “Landslides,” (D) “Fragmentation,” (E) “Short-term threats (combined),” and (F) “Climate change” for the distribution range of wild walnut populations in Kyrgyzstan, Tajikistan and Uzbekistan. The criteria to define the threat levels are presented in Table 4.
Walnut populations in Kyrgyzstan, Tajikistan and Uzbekistan presented very high threat levels due to short-term threats in a large portion (59.5%) of their distribution area. Overgrazing emerged as the single most important threat (45.9%) followed by overexploitation (21.2%). When looking at the proportion under “severe threat levels,” both threats are predicted to occur in about 80% of the walnut distribution range. Severe threat from overgrazing occurs in all three countries to a similar extent, whereas severe threat from overexploitation affected a higher share of walnut distribution area in Uzbekistan, followed by Kyrgyzstan and Tajikistan. Our assessment indicated that severe levels of threat from fragmentation affected almost a quarter (22.5%) of the walnut distribution area and landslides played a significant role only in a very small part of the species range.
High threat levels from climate change are predicted in small areas (less than 3%), at the edges of the current distribution ranges across the three countries (Figure 5F), where the mean temperature may increase between 2 and 3.2 degrees Celsius until 2050. Moderate threat from climate change, associated with the emergence of novel climate conditions, is predicted to occur in 38.3% of the walnut distribution range, most of it in Tajikistan. These novel conditions mainly concern the variables “mean temperature of wettest quarter” and “annual mean temperature.”
In nearly 93% of its entire distribution area, common walnut is classified is “severely” threatened, if we consider the combination of all four short-term threats (Supplementary Table 7). In Uzbekistan and Kyrgyzstan, the proportion reaches 100%, whereas the only area with medium short-term threat magnitude can be found in the south-west part of Tajikistan, toward the border with Afghanistan.
Threat Level of Sample Populations
Threat magnitude classes were assigned to all 12 wild walnut populations based on the four short-term threats individually and in combination together with the long-term threat climate change (Table 5). Based on the number of populations affected by “severe threat level,” overexploitation was the most important threat (eight populations), followed by overgrazing (seven populations). Landslides (two populations), fragmentation (one population), and climate change (one population) were less important.
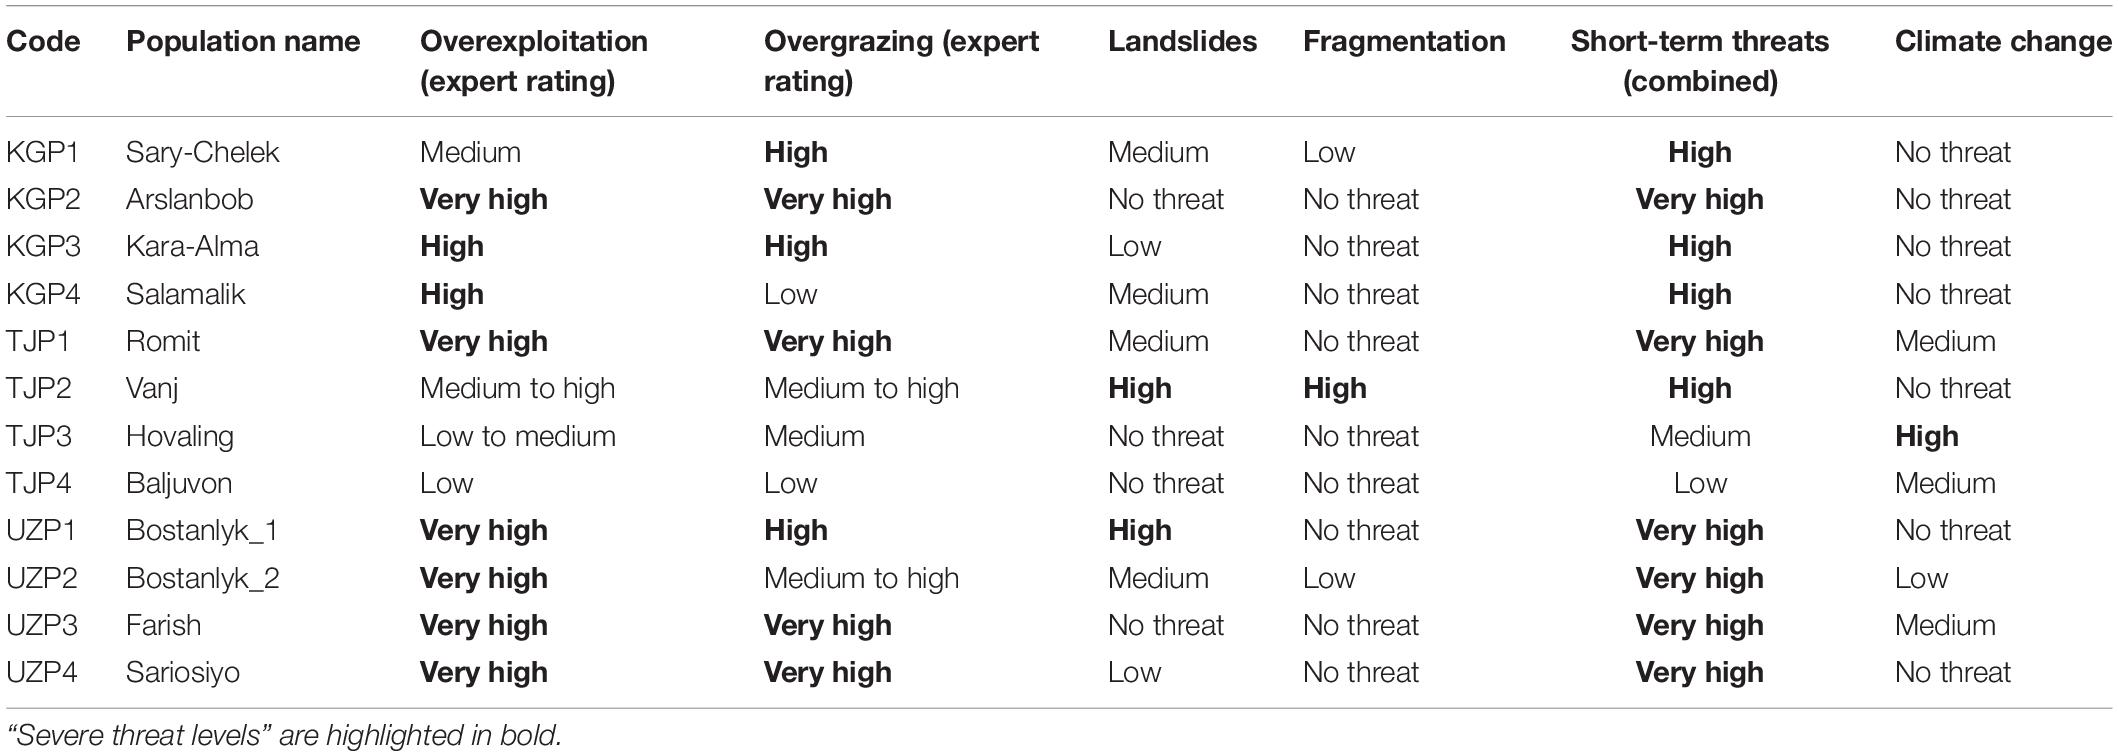
Table 5. Potential threat magnitude classes for 12 wild Juglans regia L. populations.
Considering the combination of short-term threats, 10 out of 12 populations were classified as severely threated. Overexploitation and overgrazing were the most frequent severe threats. For the Vanj population (TJP2), growing in a steep and narrow river valley, the high threat levels were related to landslides and fragmentation and for the Bostanlyk_1 population (UZP1), a high threat level was associated to landslides in addition to high overgrazing and very high overexploitation pressure.
Populations under very high short-term threat included Arslanbob (KGP2), Romit (TJP2), and all wild Uzbek populations (UZP1-4), whereas the lowest combined threat levels were found in Baljuvon (TJP4; low threat) and Hovaling (TJP3; medium threat), both in Tajikistan.
Climate change appeared to pose no threat to seven populations, low threat to one population and medium threat to two populations. Only Hovaling (TJP3) showed a high threat level due to climate change, which under the high emission scenario (RCP8.5) predicted a lack of suitable habitat for walnut by 2050. Walnut distribution areas with very high threat levels due to climate change were not identified in this analysis.
Conservation Recommendations
The genetic prioritization led to the identification of five priority populations of the total 12 wild common walnut populations analyzed in this study (Table 6 and Figure 6). The wild population of Sariosiyo (UZP4) showed the highest ranking based on the combination of three genetic parameters (AR, PAR, and SDI), followed by Baljuvon (TJP4), Vanj (TJP2), Bostanlyk 2 (UZP2), and Kara-Alma (KGP3).
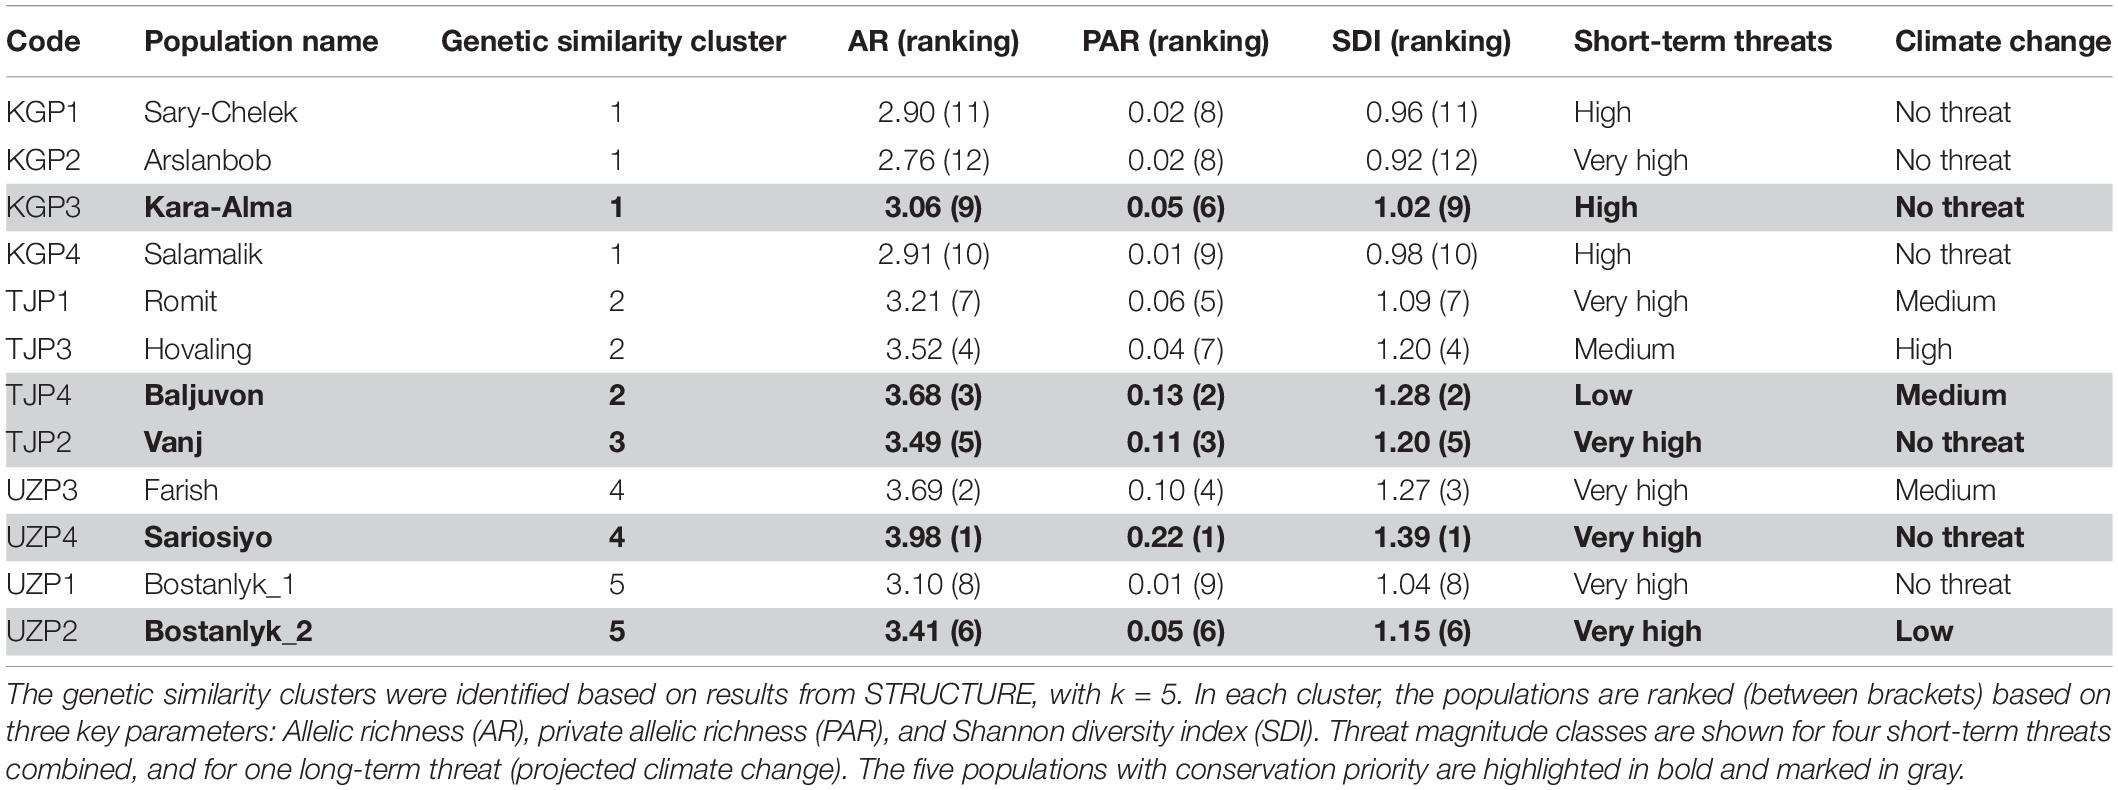
Table 6. Genetic diversity ranking and threat magnitude classes assigned to the 12 wild common walnut populations.
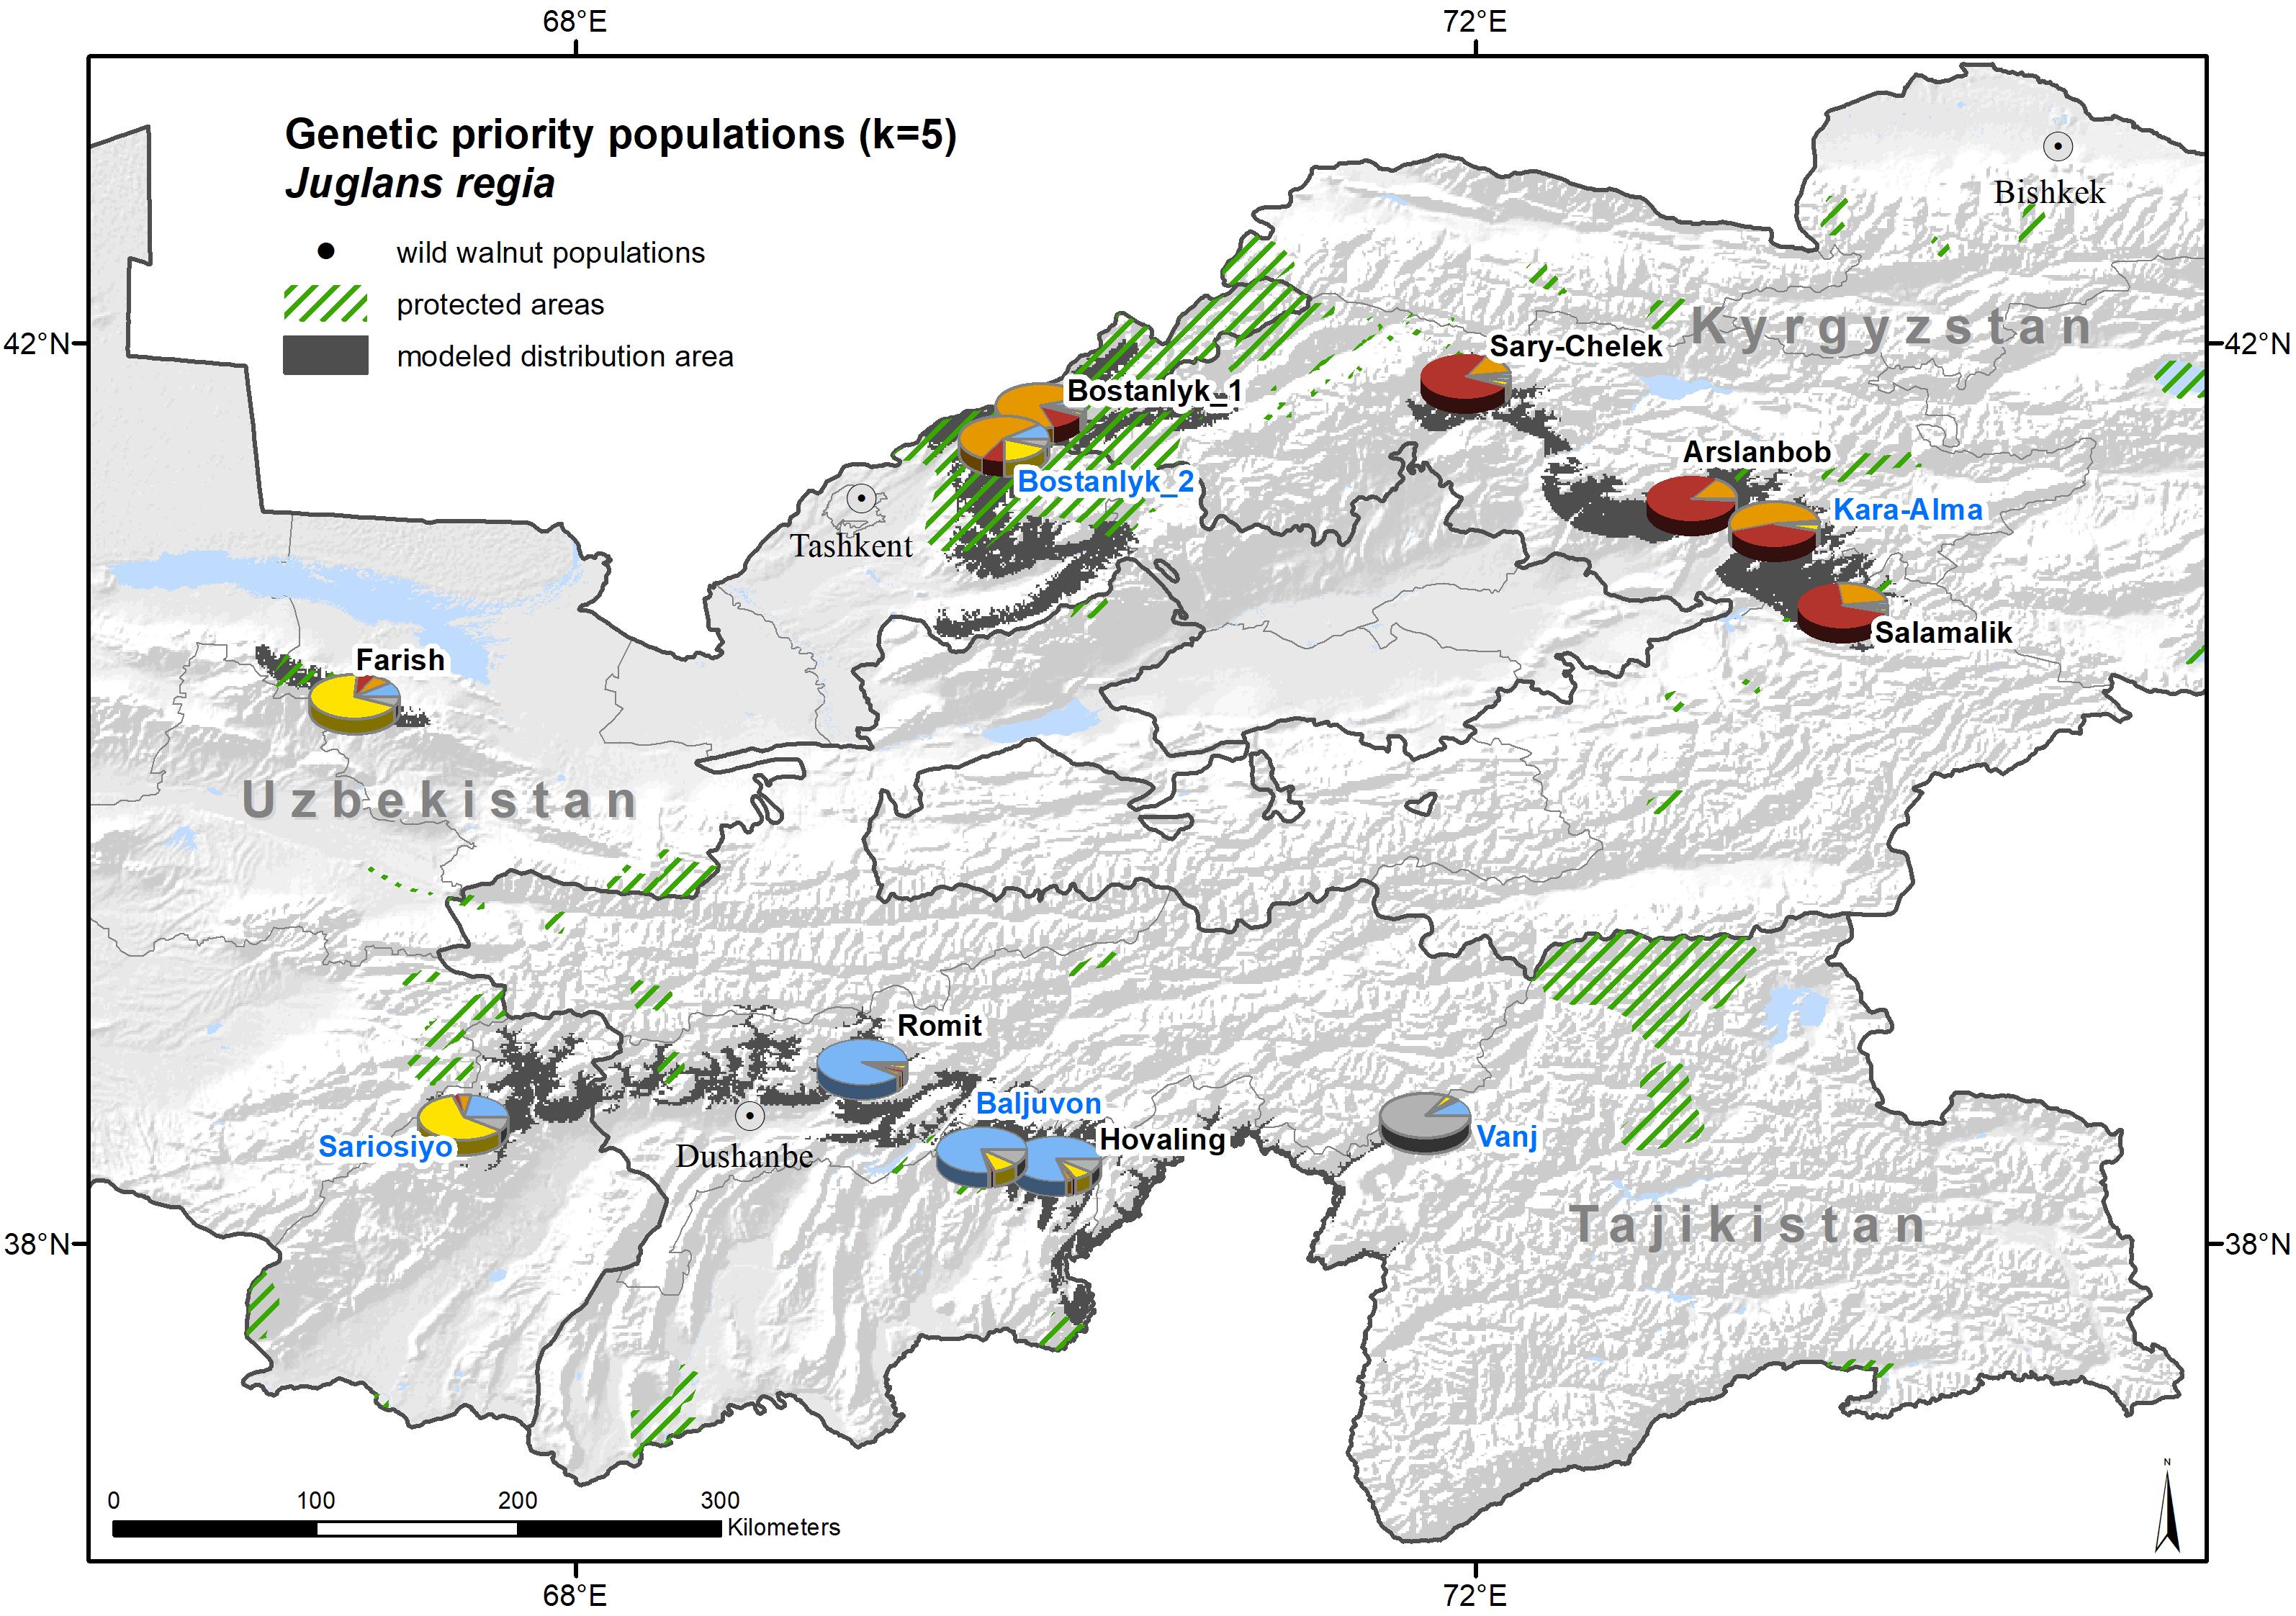
Figure 6. Genetic clusters and priority population for conservation (named in blue) of wild common walnut, superimposed on the expert-corrected modeled distribution area of the species. The colors of the pie charts refer to the membership of the population to one of the five genetic clusters identified by STRUCTURE (K = 5) and the proportion of the pie charts sectors to the relative number of individuals assigned.
With regard to short-term threats, our analysis found four out of the five priority populations were under “severe threat level.” Kara-Alma (KGP3) and Sariosiyo (UZP4) were severely threatened by overexploitation and overgrazing, Vanj (TJP2) by landslides and fragmentation and Bostanlyk_2 (UZP2) by overexploitation (Tables 6, 7). Only the Baljuvon population (TJP4) in Tajikistan showed minor threat levels in the short and long term.
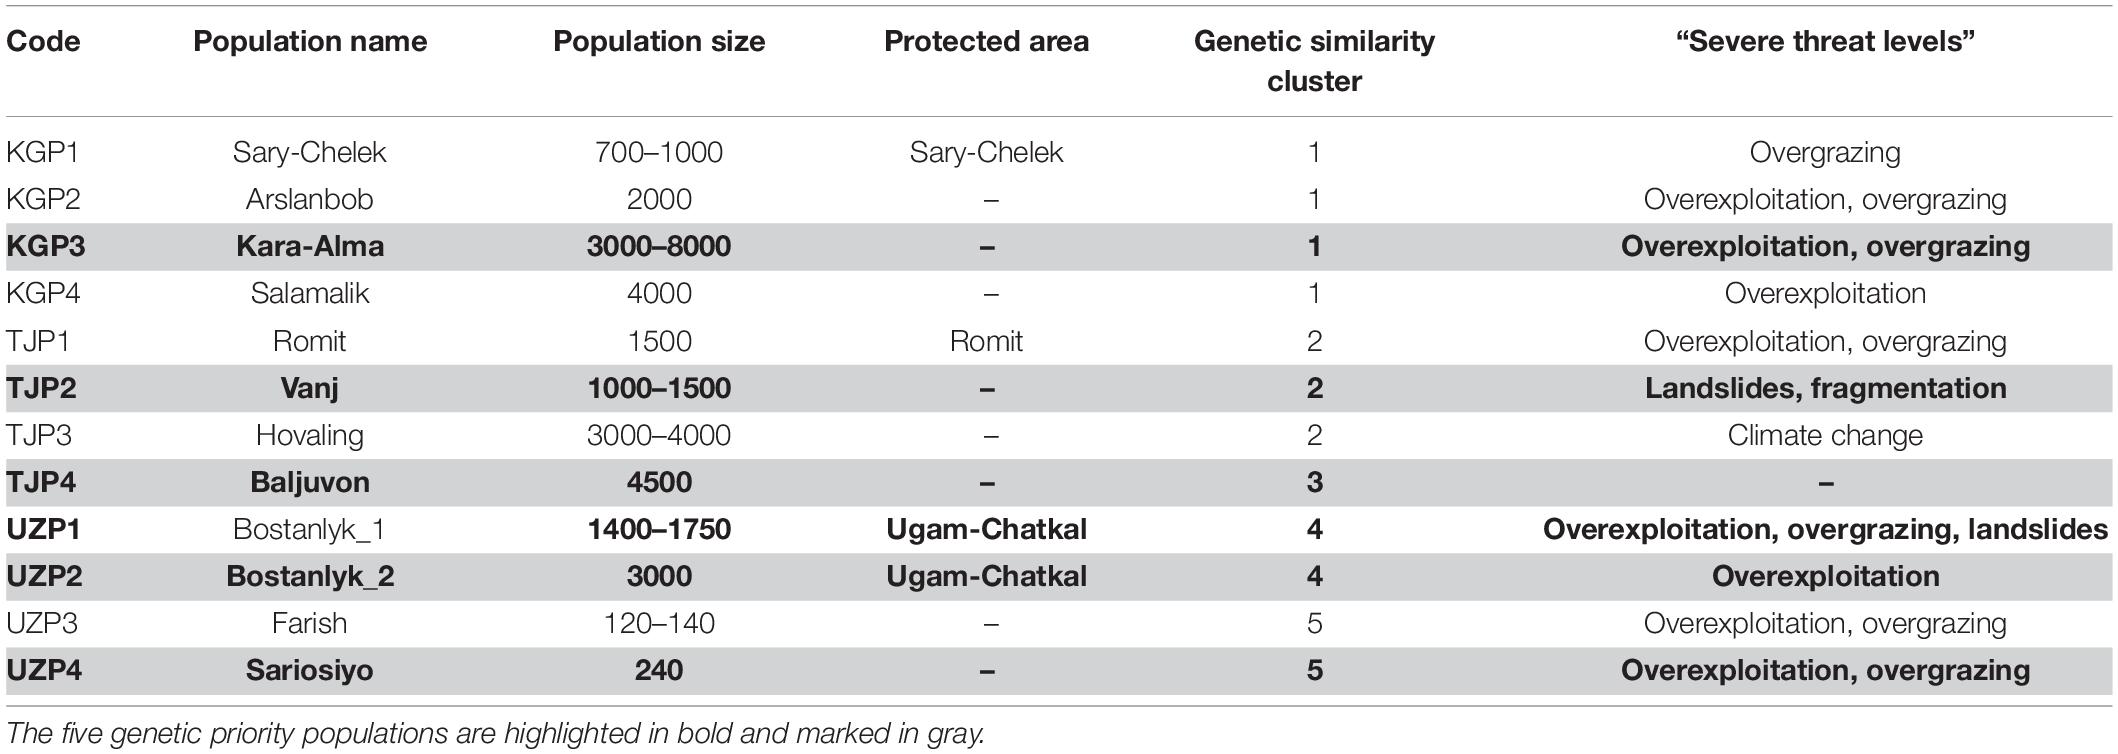
Table 7. Summary of “severe threat levels” and related threats, genetic similarity, population size, and protected areas of 12 wild Juglans regia L. populations.
Concerning the long-term threat posed by climate change, all five genetic priority populations were under “minor threat level,” with these habitats predicted to remain suitable until 2050 based on our analysis. Three populations showed “no threat” (KGP3, TJP2, UZP4), one population “low threat” (UZP2) and one population “medium threat” (TJP4) based on projected climate change. For all five priority populations, the most appropriate conservation approach is in situ conservation. Based on our results, spontaneous natural regeneration should be sufficient to ensure the long-term survival of the Baljuvon population in Tajikistan (TJP4), while for the other four priority populations assisted natural regeneration may be needed, due to short-term threats. Population sizes in all priority wild populations were relatively high (1,000–8,000), except for the Sariosiyo population (UZP4) which consisted of ca. 240 adult trees. In this case, additional enrichment planting may be necessary.
Discussion
Our research shows high levels of genetic diversity in Juglans regia L. populations across Kyrgyzstan, Tajikistan, and Uzbekistan as well as high threat levels. Fortunately, there are still relatively large walnut populations left, mainly in Kyrgyzstan and Uzbekistan. However, this region is not genetically homogenous, hence conservation strategies need to be focused on different genetic units in each country. Spatial analyses using climate models and potential species distribution calibrated by local experts indicates that overgrazing and overexploitation are serious and growing threats to walnut genetic diversity, which is a resource closely related to the poverty of rural communities living near walnut stands. Walnut exhibits a high degree of gene flow between wild populations and home gardens, so although the wild populations all experience a high degree of threat, these genetic resources are protected to an extent by home gardens and both wild and cultivated populations should be targeted by conservation measures to maintain overall genetic diversity.
Genetic Diversity
Our results indicated that, among the sampled wild walnut stands, the highest genetic diversity is located in Uzbekistan and the lowest in Kyrgyzstan. The interpretation of the genetic patterns in wild populations of common walnut is complicated because human activities have significantly contributed to movement of material and consequently the species distribution. However, some general patterns are apparent despite the long tradition of cultivation of the species. Previous studies have observed a general decline in genetic diversity moving from south Asia to Kyrgyzstan (Pollegioni et al., 2017; Roor et al., 2017) with clear hot spots of genetic diversity in Eastern Uzbekistan and in northern Pamir (Tajikistan), which our study corroborates.
The moderate genetic diversity in Kyrgyzstan has been explained on the basis of some pollen studies (Beer et al., 2008), which showed that common walnut in most Kyrgyz sites investigated derived from a putatively anthropogenic origin approximately 2000 years BP. Authors of an earlier study had indicated that walnut forests of western Kyrgyzstan originated ca. 25,000–30,000 years BP, at the end of the Pleistocene (Hemery et al., 2005), so there are still some uncertainties around the time of emergence of walnut in Kyrgyzstan.
Our tests to unveil the genetic structure of the 12 wild populations studied across the three target countries all align and point to a marked cleavage between Northeastern and Southwestern populations. By looking at wild and cultivated populations jointly, two main clusters are found in the Northeastern region (one including Kyrgyz wild and cultivated populations, except KGV3, and another including Uzbek populations from nearby the Tcharvak lake). In the Southwestern part of the range, a third group is apparent, which includes wild populations from Uzbekistan and both wild and cultivated populations from the Vanj valley in Tajikistan. The Romit population (TJP1) occupies an isolated position. These findings confirm the patterns found by other authors (Pollegioni et al., 2014; Roor et al., 2017) and provide additional evidence that walnut populations in Uzbekistan and Kyrgyzstan may originate from different historic gene pools.
The values of genetic parameters examined are generally consistent between neighboring wild and cultivated populations in home gardens. Results obtained for home garden populations are more difficult to interpret given the strong impact of human management in ways that are not fully known. However, trees from wild and home garden populations located near to each other are genetically similar and this suggests that farmers brought reproductive material from nearby forests to their home gardens and orchards. This can be observed in the wild populations of Bostanlyk (UZP1, UZP2) in Uzbekistan and Vanj (TJP2) in Tajikistan, and their nearby home garden populations. Another explanation for genetic similarity between neighboring wild and home garden populations could be that the populations sampled in this study are part of a larger, less fragmented ancestral distribution of walnut forests (which covered the area currently occupied by both wild and cultivated populations), later reduced in size due to different pressures on forest stands. The significant heterozygosity excess found in the wild population of Vanj (TJP2) and in a nearby home garden population (TJV3) supports this hypothesis. However, with the present experimental sampling setup, no recent bottlenecks were detected in Bostanlyk (UZP1, UZP2) or in the nearby home garden populations, and this finding is not in alignment with previous work carried out in these populations (Pollegioni et al., 2014).
All Uzbek wild and cultivated populations, except Farish (UZP1), display significant (p < 0.05) positive inbreeding coefficients, indicating some degree of inbreeding. Uzbek wild populations are located in isolated, dry mountainous regions in the east of the country. Fragmentation and isolation has been shown to lead to restricted gene flow and elevated inbreeding in many tree species (Vranckx et al., 2012). The population of the Kyzyl-Oktyabr village (KGV3) in Kyrgyzstan represents a particular case; its trees were planted in the 1960s, most likely from seeds collected in proximity of the wild population of Sarioziyo (UZP4) in Uzbekistan. In the studies by Pollegioni et al. (2014) and Roor et al. (2017), Uzbek populations clustered with distant populations in Iran or Pakistan, and this finding was interpreted as a sign that long-distance dispersal took place, fostered by human activities and movements along the Silk Road.
Distribution and Threats
This study provides the most detailed distribution map of common walnut across its center of origin (Figure 4). The model and expert-corrected distribution area of wild Juglans regia L. populations across the three countries is associated with mountainous sites between 630 and 2,500 m of altitude. The largest area with continuous distribution of the species occurs in the Fergana range of the Tian Shan Mountains in Kyrgyzstan, followed by the Ugam-Chatkal National park in Uzbekistan, while the distribution is more scattered in other parts of the Tian Shan and in the Pamir Mountains in Tajikistan. The smallest area with continuous distribution occurs in Uzbekistan, in the area of Farish (UZP3).
The combination of threat models and potential distribution, calibrated by local experts, enabled a comprehensive, spatially explicit, threat assessment of different types of short- and long-term drivers of change in wild walnut stands in the region. Our results indicate that more than 90% of the common walnut distribution area in Kyrgyzstan, Tajikistan, and Uzbekistan is severely threatened due to short-term threats. The most important threats in the region and in each country are overgrazing and overexploitation. This is a serious and growing problem for walnut, highlighted in previous studies (Beer et al., 2008; Eastwood et al., 2009; Cantarello et al., 2014; Orozumbekov et al., 2014).
Wild walnut populations are likely to be less influenced by warming temperatures in the near future but are negatively affected by winter thaws followed by hard frosts, which are likely to increase with changing climate. Ex situ collections, existing in Central Asia in the form of tree orchards at research institutes (Molnar et al., 2011), should therefore be considered as complementary conservation units.
The threat analysis and the observations of livestock presence in protected areas during field work support the view that walnut populations located within protected areas are not sufficiently protected. Orozumbekov et al. (2014) observed frequent signs of livestock browsing on seedlings and saplings in sample plots in the Sary-Chelek Reserve and confirmed the common assumption that scarce natural regeneration of fruit trees in walnut forests is attributable to overgrazing. Although grazing and logging are illegal in the majority of the state-owned forests in the region, they are common practice (Eastwood et al., 2009). The near complete absence of seedlings in our sampled stands in all three countries is confirmation of this.
Conservation Priorities
Walnut stands continue to decline across their natural range (Ashimov, 1998; Mapelli et al., 2014). In order to maximize conservation efforts, we have identified five priority populations for conservation based on their genetic diversity. Climate change is a minor concern for these priority populations compared to other threats, therefore we propose in situ conservation as the most adequate conservation measure.
The network of five priority sites in our study represents the minimum number of in situ conservation areas for wild walnut that should be established in the three countries in order to capture and safeguard a significant amount of the species genetic diversity. Applying the methods and principles used in our study to a wider area of wild populations across the species range would enable conservation priority setting for a great proportion of the genetic diversity within this important species.
In total, four out of the 12 sampled wild populations are located inside protected areas (Table 7). Only one population (Bostanlyk_2) out of the five genetic priority populations is located within a protected area. However, severe threat levels from overexploitation and overgrazing exist also within protected areas in the Ugam-Chatkal National Park in Uzbekistan and in the State Nature Reserves in Tajikistan (Romit) and Kyrgyzstan (Sary-Chelek). Therefore, the inclusion of walnut populations inside the boundaries of protected area is not always a sufficient conservation measure (Squires, 2013; Schulze et al., 2018).
Short-term threats seemed to pose more significant challenges for the identified priority sites. Four out of the five priority populations are under “severe threat level,” including the priority populations located inside protected areas. More active management is needed to effectively protect these stands from further demographic decline and erosion of their genetic diversity. Assisted natural regeneration could be a valuable management approach to ensure conservation of these stands that are severely threatened in the short term. One priority population in Uzbekistan (Sariosiyo, UZP4) has a small population size and is subject to high threat levels from overexploitation and overgrazing, thus additional enrichment planting with adapted local walnut trees together with temporary livestock exclusion is one of the most critical management measures needed. Establishing livestock exclusion through fencing (Al-Rowaily et al., 2015) has proven an effective and sustainable approach to restore forest cover and promote conservation. Jalilova and Vacik (2012) investigated sustainable management options in Kyrgyzstan and found that local people were not well aware of the effects of uncontrolled grazing on individual forest species, or ignored the existence and extent of the damage; therefore, capacity building and awareness raising campaigns are needed. For one priority population expected to be exposed to minor short and long-term threat levels (Baljuvon, TJP4), natural regeneration seemed sufficient to ensure the long-term maintenance of the stand.
Given the general decline of the distribution range of walnut and considering that home garden populations analyzed in this study are genetically closely related with their neighboring wild populations (with few exceptions), cultivated populations in home gardens are worth considering as a conservation strategy. Although the wild populations all experience a high degree of threat, the gene pools are to some extent conserved in the current genetic reservoir in home gardens. It is of concern that the environmental niche of the cultivated populations sampled is much narrower than that of the wild populations studied, therefore cultivated populations appeared exposed to different environmental pressures and future evolutionary selection. In particular, in Uzbekistan, cultivated populations show a great uniformity of conditions that are a small subset of the environmental conditions found across wild populations.
There is an urgent need for financial resources, investment and training to build the capacity of scientific institutions, nature conservation and forestry agencies, botanic gardens and germplasm banks to manage and conserve this unique heritage effectively.
Data Availability Statement
The genetic SSR data has been published on the Harvard Dataverse repository: Gaisberger, Hannes; Legay, Sylvain, 2020, “Walnut SSR raw data, Central Asia”, doi: 10.7910/DVN/VUP7OH, Harvard Dataverse, V1, UNF:6:254awoJkmwuQGPFAPzG/Aw== [fileUNF].
Author Contributions
HG: leading conception and design, analysis and interpretation of threats and distribution, interpretation of genetic data, and leading the drafting and revising, accountable for all aspects in ensuring that questions related to the accuracy and integrity are appropriately investigated and resolved. SL: acquisition, analysis, and interpretation of genetic data, training Ph.D. students on genetic data analysis, drafting and revising for intellectual content. CA: acquisition and interpretation of genetic data, drafting, and revising for intellectual content. JL: substantial contributions to the conception; revising it critically for important intellectual content. RA: acquisition of samples, organization of meetings, revising for intellectual content. SA, FB, and NM: acquisition of samples and assistance in analysis of genetic data. CK: revising it critically for important intellectual and technical content. BV: drafting and contributing to the concept and content, revising it critically for important intellectual and technical content.
Funding
This research manuscript was part of the research project “Conservation for diversified and sustainable use of fruit tree genetic resources in Central Asia, 2011–2014” which was funded by the Luxembourg Ministry of Finance.
Conflict of Interest
The authors declare that the research was conducted in the absence of any commercial or financial relationships that could be construed as a potential conflict of interest.
Acknowledgments
We thank the National Partners and Project Focal Points in the research project “Conservation for diversified and sustainable use of fruit tree genetic resources in Central Asia” for selecting three highly motived Ph.D. students who contributed to this research and for providing valuable input during all the project meetings, especially during the threat impact rating. These include Kubanichbek Turgunbaev, Associate Professor from the Kyrgyz National Agrarian University named after K.I. Skryabin, Hikmatullo Nazirov, the Director of the Institute of Horticulture and Vegetable Growing of Tajik Academy of Agricultural Sciences and Ruslan Sultanov, Scientist at the Republican Scientific and Production Center of Ornamental Gardening and Forestry (Tashkent, Uzbekistan). A special thank to Muhabbat Turdieva, the Regional Project Coordinator from the Regional office of Bioversity International in Tashkent, for the continuous and efficient support. We wish to further acknowledge with thanks the contribution of Evgeniy Butkov, a deeply committed walnut expert for decades, from the Republican Scientific and Production Centre of Ornamental Gardening and Forestry, who knows walnut and its current and past distribution in the region like the back of his hands. Finally, we would like to thank the Luxembourg Ministry of Finance and all donors who supported this research through their contributions to the CGIAR Research Program on Forests, Trees and Agroforestry (FTA).
Supplementary Material
The Supplementary Material for this article can be found online at: https://www.frontiersin.org/articles/10.3389/fevo.2020.00171/full#supplementary-material
References
Ahmed, N., Mir, J. I., Mir, R. R., Rather, N. A., Rashid, R., Wani, S. H., et al. (2012). SSR and RAPD analysis of genetic diversity in walnut (Juglans regia L.) genotypes from Jammu and Kashmir, India. Physiol. Mol. Biol. Plants 18, 149–160. doi: 10.1007/s12298-012-0104-z
Allouche, O., Tsoar, A., and Kadmon, R. (2006). Assessing the accuracy of species distribution models: prevalence, kappa and the true skill statistic (TSS). J. Appl. Ecol. 43, 1223–1232. doi: 10.1111/j.1365-2664.2006.01214.x
Al-Rowaily, S. L., El-Bana, M. I., Al-Bakre, D. A., and Assaeed, A. M. (2015). Effects of open grazing and livestock exclusion on floristic composition and diversity in natural ecosystem of Western Saudi Arabia. Saudi J. Biol. Sci. 22, 430–437. doi: 10.1016/j.sjbs.2015.04.012
Arzani, K., Mansouri−Ardakan, H., Vezvaei, A., and Roozban, M. R. (2008). Morphological variation among Persian walnut (Juglans regia) genotypes from central Iran. N. Z. J. Crop Hortic. Sci. 36, 159–168. doi: 10.1080/01140670809510232
Ashimov, K. S. (1998). “The condition of and prospects for scientific research in Kyrgyzstan walnut-fruit forests,” in Biodiversity and Sustainable Use of Kyrgyzstan’s Walnut-Fruit Forests, eds J. Blaser, J. Carter, and D. Gilmour, (Gland: IUCN), 87–90.
Beer, R., Kaiser, F., Schmidt, K., Ammann, B., Carraro, G., Grisa, E., et al. (2008). Vegetation history of the walnut forests in Kyrgyzstan (Central Asia): natural or anthropogenic origin? Quat. Sci. Rev. 27, 621–632. doi: 10.1016/j.quascirev.2007.11.012
Cadima, X., van Zonneveld, M., Scheldeman, X., Castañeda, N., Patiño, F., Beltran, M., et al. (2014). Endemic wild potato (Solanum spp.) biodiversity status in Bolivia: reasons for conservation concerns. J. Nat. Conserv. 2014, 113–131. doi: 10.1016/j.jnc.2013.09.007
Cantarello, E., Lovegrove, A., Orozumbekov, A., Birch, J., Brouwers, N., and Newton, A. C. (2014). Human impacts on forest biodiversity in protected Walnut-fruit forests in Kyrgyzstan. J. Sustain. For. 33, 454–481. doi: 10.1080/10549811.2014.901918
Center for Hazards and Risk Research [CHRR], Center for International Earth Science Information Network [CIESIN], and Norwegian Geotechnical Institute [NGI] (2005). Global Landslide Hazard Distribution, v1 (2000). Palisades, NY: NASA Socioeconomic Data and Applications Center (SEDAC). http://dx.doi.org/10.7927/H4P848VZ. Accessed 01/04/2014
Chazdon, R. L., Bodin, B., Guariguata, M., Lamb, D., Walder, B., Chokkalingam, U., et al. (2017). Partnering With Nature: The Case for Natural Regeneration in Forest and Landscape Restoration. Montreal, QC: FERI Policy Brief.
Crouzeilles, R., Ferreira, M. S., Chazdon, R. L., Lindenmayer, D. B., Sansevero, J. B. B., Monteiro, L., et al. (2017). Ecological restoration success is higher for natural regeneration than for active restoration in tropical forests. Sci. Adv. 3:e170134. doi: 10.1126/sciadv.1701345
Dangl, G., Woeste, K., Aradhya, M., Pitcher, A., Simon, C., Potter, D., et al. (2005). Characterization of 14 microsatellite markers for genetic analysis and cultivar identification of Walnut. J. Am. Soc. Hortic. Sci. 130, 348–354. doi: 10.21273/JASHS.130.3.348
DiMiceli, C. M., Carroll, M. L., Sohlberg, R. A., Huang, C., Hansen, M. C., and Townshend, J. R. G. (2011). Annual Global Automated MODIS Vegetation Continuous Fields (VCF MOD44B) at 250 m Spatial Resolution for Data Years Beginning Day 65, 2000 - 2010, Collection 5 Percent Tree Cover. College Park, MD: University of Maryland.
Dogan, Y., Kafkas, S., Sutyemez, M., Akca, Y., and Turemis, N. (2014). Assessment and characterization of genetic relationships of walnut (Juglans regia L.) genotypes by three types of molecular markers. Sci. Hort. 168, 81–87.
Earl, D. A., and von Holdt, B. M. (2012). STRUCTURE HARVESTER: a website and program for visualizing STRUCTURE output and implementing the Evanno method. Conserv. Genet. Resour. 4, 359–361. doi: 10.1007/s12686-011-9548-7
Eastwood, A., Lazkov, G., and Newton, A. C. (2009). The Red List of trees of Central Asia. Richmond, GB: Botanic Gardens Conservation International.
Elith, J., Graham, C. H., Anderson, R. P., Dudík, M., Ferrier, S., Guisan, A., et al. (2006). Novel methods improve prediction of species’ distributions from occurrence data. Ecography 2006, 129–151.
European Space Agency [ESA] (2009). Global Land Cover Map, GLOBCOVER 2009, Products Description and Validation Report. Paris: European Space Agency.
Evanno, G., Regnaut, S., and Goudet, J. (2005). Detecting the number of clusters of individuals using the software STRUCTURE: a simulation study. Mol. Ecol. 14, 2611–2620. doi: 10.1111/j.1365-294x.2005.02553.x
Excoffier, L., and Lischer, H. E. (2010). Arlequin suite ver 3.5: a new series of programs to perform population genetics analyses under Linux and Windows. Mol. Ecol. Resour. 10, 564–567. doi: 10.1111/j.1755-0998.2010.02847.x
FAO, IIASA, ISRIC, ISSCAS, and JRC, (2012). Harmonized World Soil Database (Version 1.2). Rome: FAO.
Farr, T. G., Rosen, P. A., Caro, E., Crippen, R., Duren, R., Hensley, S., et al. (2007). The shuttle radar topography mission. Rev. Geophys. 45:RG2004.
Gaisberger, H., Kindt, R., Loo, J., Schmidt, M., Bognounou, F., Da, S. S., et al. (2017). Spatially explicit multi-threat assessment of food tree species in Burkina Faso: a fine-scale approach. PLoS One 12:e0184457. doi: 10.1371/journal.pone.0184457
Germain, E. (2004). Inventory of Walnut Research, Germplasm and References di REU Technical Series, Vol. 66. Rome: Food and agriculture organization of the United Nations, 264.
Hayes, D., Angove, M. J., Tucci, J., and Dennis, C. (2016). Walnuts (Juglans regia) chemical composition and research in human health. Crit. Rev. Food Sci. Nutr. 56, 1231–1241. doi: 10.1080/10408398.2012.760516
Heikkinen, R. K., and Luoto, M. (2006). Methods and uncertainties in bioclimatic envelope modelling under climate change. Prog. Phys. Geogr. 6, 751–777. doi: 10.1177/0309133306071957
Hemery, G. E. (2000). Juglans regia L: Genetic Variation and Provenance Performance. Ph.D. thesis, University of Oxford, Oxford.
Hemery, G. E., Savill, P. S., and Thakur, A. (2005). Height growth and flushing in common walnut (Juglans regia L.): 5-year results from provenance trials in Great Britain. Forestry 78, 121–133. doi: 10.1093/forestry/cpi012
Higgins, J., and Esselman, R. (2010). The Ecoregional Assessment and Biodiversity Vision Toolbox. Chapter 10: Conduct an Analysis of the Severity and Geographic Scope of Threats to Conservation Targets/Biodiversity Elements and Their Occurrences, and Analyze the Root Causes of Priority Threats. Arlington County, VA: The Nature Conservancy (TNC).
Hijmans, R. J., Cameron, S. E., Parra, J. L., Jones, P. G., and Jarvis, A. (2005). Very high resolution interpolated climate surfaces for global land areas. Int. J. Climatol. 25, 1965–1978. doi: 10.1002/joc.1276
Husson, F. (2008). FactoMineR: an R package for multivariate analysis. J. Stat. Softw. 25, 1–18. doi: 10.18637/jss.v025.i01
Ibrahimov, Z., Mcgranahan, G., Leslie, C., and Aradhya, M. (2009). Genetic diversity in walnut (Juglans regia) from the Caucasus nation of Azerbaijan. Acta Hortic. 861, 163–170. doi: 10.17660/ActaHortic.2010.861.21
IPCC (2014). Climate Change 2014: Synthesis Report. Contribution of Working Groups I, II and III to the Fifth Assessment Report of the Intergovernmental Panel on Climate Change. Geneva: IPCC, 151.
Jalilova, G., and Vacik, H. (2012). Local people’s perceptions of forest biodiversity in the walnut fruit forests of Kyrgyzstan. Int. J. Biodivers. Sci. Ecosyst. Serv. Manag. 8, 204–216. doi: 10.1080/21513732.2012.696557
Jarvis, A., Touval, J. L., Castro Schmitz, M., Sotomayor, L., and Hyman, G. G. (2009). Assessment of threats to ecosystems in South America. J. Nat. Conserv. 18, 180–188. doi: 10.1016/j.jnc.2009.08.003
Jones, C. C. (2012). Challenges in predicting the future distributions of invasive plant species. For. Ecol. Manage. 284, 69–77. doi: 10.1016/j.foreco.2012.07.024
Kalinowski, S. (2005). HP-RARE 1.0: a computer program for performing rarefaction on measures of allelic richness. Mol. Ecol. Notes 5, 187–189. doi: 10.1111/j.1471-8286.2004.00845.x
Kong, Z. (2012). Empirical Correlations Between Anthropogenic Factors and Occurrences of Herpetofauna Species and Protected Areas Effectiveness on Controlling Anthropogenic Factors for Herpetofauna in Crete, Greece. Master, thesis, Lund University, Sweden and University of Twente, Netherlands.
Lapena, I., Turdieva, M., Noriega, I. L., and Ayad, W. G. (2014). Conservation of Fruit tree Diversity in Central Asia: Policy Options and Challenges. Rome: Bioversity International.
Leslie, C. A., and McGranahan, G. H. (1998). “The origin of the walnut,” in Walnut Production Manual, ed. D. E. Ramos, (Davis, CA: University of California. Division of Agriculture and Natural Resources. Publication 3373), 3–7.
Liu, C., Berry, P. M., Dawson, T. P., and Pearson, R. G. (2005). Selecting thresholds of occurrence in the prediction of species distributions. Ecography 28, 385–393. doi: 10.1111/j.0906-7590.2005.03957.x
Liu, K., and Muse, S. V. (2005). PowerMarker: an integrated analysis environment for genetic marker analysis. Bioinformatics 21, 2128–2129. doi: 10.1093/bioinformatics/bti282
Lompo, D., Vinceti, B., Konrad, H., Gaisberger, H., and Geburek, T. (2018). Phylogeography of African locust bean (Parkia biglobosa) reveals genetic divergence and spatially structured populations in West and Central Africa. J. Hered. 109, 811–824. doi: 10.1093/jhered/esy047
Luedeling, E., and Brown, P. H. (2011). A global analysis of the comparability of winter chill models for fruit and nut trees. Int. J. Biometeorol. 55, 411–421. doi: 10.1007/s00484-010-0352-y
Mapelli, S., Bertani, A., Malvolti, M. E., Olimpieri, I., Pollegioni, P., Alexandrovski, E. S., et al. (2014). Resources of Juglans regia in Uzbekistan: a valuable step along the silk road. Acta Hort. 1032, 55–62. doi: 10.17660/actahortic.2014.1032.7
Martinez, M. L., Labuckas, D. O., Lamarque, A. L., and Maestri, D. M. (2010). Walnut (Juglans regia L.): genetic resources, chemistry, by-products. J. Sci. Food Agric. 90, 1959–1967. doi: 10.1002/jsfa.4059
McPherson, M., Schill, S., Raber, G., John, K., Zenny, N., and Thurlow, K. (2008). GIS-based modeling of environmental risk surfaces (ERS) for conservation planning in Jamaica. J. Conserv. Plan. 4, 60–89.
Molnar, T. J., Zaurov, D. E., Capik, J. M., Eisenman, S. W., Ford, T., Nikolyi, L. V., et al. (2011). Persian walnuts (Juglans regia L.) in Central Asia. Annu. Rep. North Nut. Grow Assoc. 2011, 56–69.
Murphy, M. A., Evans, J. S., Cushman, S. A., and Storfer, A. (2008). Representing genetic variation as continuous surfaces: an approach for identifying spatial dependency in landscape genetic studies. Ecography 31, 685–697. doi: 10.1111/j.1600-0587.2008.05428.x
Orozumbekov, A., Cantarello, E., and Newton, A. C. (2014). Status, distribution and use of threatened tree species in the walnut-fruit forests of Kyrgyzstan. For. Trees Livelih. 24, 1–17. doi: 10.1080/14728028.2014.928604
Pan, A., Sun, Q., Manson, J. E., Willett, W. C., and Hu, F. B. (2013). Walnut consumption is associated with lower risk of type 2 diabetes in women. J. Nutr. 143, 512–518. doi: 10.3945/jn.112.172171
Petit, R. J., El Mousadik, A., and Pons, O. (1998). Identifying populations for conservation on the basis of genetic markers. Conserv. Biol. 12, 844–855. doi: 10.1046/j.1523-1739.1998.96489.x
Phillips, S. J., Anderson, R., and Schapire, R. E. (2006). Maximum entropy modeling of species geographic distributions. Ecol. Model. 190, 231–259. doi: 10.1016/j.ecolmodel.2005.03.026
Piry, S., Luikart, G., and Cornuet, J. M. (1999). BOTTLENECK: a computer program for detecting recent reductions in effective population size from allele frequency data. J. Hered. 90, 502–503. doi: 10.1093/jhered/90.4.502
Pollegioni, P., Woeste, K., Chiocchini, F., Del Lungo, S., Ciolfi, M., Olimpieri, I., et al. (2017). Rethinking the history of common walnut (Juglans regia L.) in Europe: Its origins and human interactions. PLoS ONE 12:e0172541. doi: 10.1371/journal.pone.0172541
Pollegioni, P., Woeste, K., Chiocchini, F., Olimpieri, I., Tortolano, V., Clark, J., et al. (2014). Landscape genetics of Persian walnut (Juglans regia L.) across its Asian range. Tree Genet. Genom. 10, 1027–1043. doi: 10.1007/s11295-014-0740-2
Pollegioni, P., Woeste, K., Mugnozza, G. S., and Malvolti, M. E. (2009). Retrospective identification of hybridogenic walnut plants by SSR fingerprinting and parentage analysis. Mol. Breed. 2009, 321–335. doi: 10.1007/s11032-009-9294-7
Pritchard, J. K., Stephens, M., and Donnelly, P. (2000). Inference of population structure using multilocus genotype data. Genetics 155, 945–959.
Robinson, T. P., Wint, G. R. W., Conchedda, G., Van Boeckel, T. P., Ercoli, V., Palamara, E., et al. (2014). Mapping the global distribution of livestock. PLoS One 9:e96084. doi: 10.1371/journal.pone.0096084
Roor, W., Konrad, H., Mamadjanov, D., and Geburek, T. (2017). Population differentiation in common walnut (Juglans regia L.) across major parts of its native range-insights from molecular and morphometric data. J. Hered. 108:391–404. doi: 10.1093/jhered/esw122
Sabate, J., Oda, K., and Ros, E. (2010). Nut consumption and blood lipid levels: a pooled analysis of 25 intervention trials. Arch. Intern. Med. 170, 821–827. doi: 10.1001/archinternmed.2010.79
Scheldeman, X., and van Zonneveld, M. J. (2010). Training Manual on Spatial Analysis of Plant Diversity and Distribution. Rome: Bioversity International.
Schmidt, K. (2006). “NTFPs and poverty alleviation in Kyrgyzstan: potential and critical issues,” in Non-Timber Forest Products Between Poverty Alleviation and Market Forces, eds J.-L. Pfund and P. Robinson, (Berne: Intercooperation), 53.
Schulze, K., Knights, K., Coad, L., Geldmann, J., Leverington, F., Eassom, A., et al. (2018). An assessment of threats to terrestrial protected areas. Conserv. Lett. 2018:e12435. doi: 10.1111/conl.12435
Shono, K., Cadaweng, E. A., and Durst, P. B. (2007). Application of assisted natural regeneration to restore degraded tropical forestlands. Restorat. Ecol. 15, 620–626. doi: 10.1111/j.1526-100x.2007.00274.x
Squires, D. (2013). Biodiversity conservation in Asia. Asia Pacific Policy Stud. 1, 144–159. doi: 10.1002/app5.13
Thormann, I., Gaisberger, H., Mattei, F., Snook, L., and Arnaud, E. (2012). Digitization and online availability of original collecting mission data to improve data quality and enhance the conservation and use of plant genetic resources. Genet. Resour. Crop Evol. 59, 635–644. doi: 10.1007/s10722-012-9804-z
Vinceti, B., Loo, J., Gaisberger, H., van Zonneveld, M. J., Schueler, S., Konrad, H., et al. (2013). Conservation priorities for Prunus africana defined with the aid of spatial analysis of genetic data and climatic variables. PLoS One 8:e59987. doi: 10.1371/journal.pone.0059987
Vischi, M., Chiabà, C., Raranciuc, S., Poggetti, L., Messina, R., Ermacora, P., et al. (2017). Genetic diversity of Walnut (Juglans regia L.) in the Eastern Italian Alps. Forests 8:81. doi: 10.3390/f8030081
Vogt, P., Riitters, K., Estreguil, C., Kozak, J., Wade, T., and Wickham, J. (2007). Mapping spatial patterns with morphological image processing. Landsc. Ecol. 22, 171–177. doi: 10.1007/s10980-006-9013-2
Vranckx, G., Jacquemyn, H., Muys, B., and Honnay, O. (2012). Meta-analysis of susceptibility of woody plants to loss of genetic diversity through habitat fragmentation. Conserv. Biol. 26, 228–237. doi: 10.1111/j.1523-1739.2011.01778.x
Wildlife Conservation Society [WCS] and Center for International Earth Science Information Network [CIESIN] (2005). Last of the Wild Project, Version 2, 2005 (LWP-2): Global Human Footprint Dataset (IGHP). Palisades, NY: NASA Socioeconomic Data and Applications Center (SEDAC).
Willett, W., Rockström, J., Loken, B., Springmann, M., Lang, T., Vermeulen, S., et al. (2019). Food in the anthropocene: the EAT–lancet commission on healthy diets from sustainable food systems. Lancet Commissions. 393, 447–492.
Yeh, F. C., and Boyle, T. J. B. (1997). Population genetic analysis of co-dominant and dominant markers and quantitative traits. Belg. J. Bot. 129:157.
Young, N., Carter, L., and Evangelista, P. (2011). A MaxEnt Model v3.3.3e Tutorial (ArcGIS v10). Fort Collins, CO: Natural Resource Ecology Laboratory.
Keywords: threat mapping, distribution modeling, genetic diversity, conservation priority, Central Asia, common walnut, climate change, natural population
Citation: Gaisberger H, Legay S, Andre C, Loo J, Azimov R, Aaliev S, Bobokalonov F, Mukhsimov N, Kettle C and Vinceti B (2020) Diversity Under Threat: Connecting Genetic Diversity and Threat Mapping to Set Conservation Priorities for Juglans regia L. Populations in Central Asia. Front. Ecol. Evol. 8:171. doi: 10.3389/fevo.2020.00171
Received: 20 November 2019; Accepted: 14 May 2020;
Published: 23 June 2020.
Edited by:
David Jack Coates, Department of Biodiversity, Conservation and Attractions (DBCA), AustraliaReviewed by:
Bilal Habib, Wildlife Institute of India, IndiaKeith Woeste, United States Department of Agriculture (USDA), United States
Copyright © 2020 Gaisberger, Legay, Andre, Loo, Azimov, Aaliev, Bobokalonov, Mukhsimov, Kettle and Vinceti. This is an open-access article distributed under the terms of the Creative Commons Attribution License (CC BY). The use, distribution or reproduction in other forums is permitted, provided the original author(s) and the copyright owner(s) are credited and that the original publication in this journal is cited, in accordance with accepted academic practice. No use, distribution or reproduction is permitted which does not comply with these terms.
*Correspondence: Hannes Gaisberger, aC5nYWlzYmVyZ2VyQGNnaWFyLm9yZw==