 Marjorie D. Matocq1*
 Kaitlin M. Ochsenrider2,3
 Christopher S. Jeffrey3
 Danny P. Nielsen1
 Lora A. Richards4
- 1Department of Natural Resources and Environmental Science, Program in Ecology Evolution and Conservation Biology, University of Nevada, Reno, Reno, NV, United States
- 2Department of Biological Sciences, Boise State University, Boise, ID, United States
- 3Department of Chemistry, Program in Ecology Evolution and Conservation Biology, University of Nevada, Reno, Reno, NV, United States
- 4Department of Biology, Program in Ecology Evolution and Conservation Biology, University of Nevada, Reno, Reno, NV, United States
Sharp ecological boundaries often present animals with abrupt transitions in various resources, including the availability of food, potentially creating strong selective gradients. Yet little is known concerning how animals respond to abrupt shifts in resources, especially when gene flow may limit local adaptation. Here, we used DNA metabarcoding and untargeted metabolomics of fecal samples to begin characterizing the foraging ecology of two closely related rodents (Neotoma bryanti and N. lepida) across a sharp ecological boundary. We find abrupt transitions in diet and metabolomic signatures that coincide with the rapid habitat transition. Further, we show that individuals have habitat-specific diets that are dominated by distinctly toxic plants that likely require different metabolic processing. Our approach allows detailed characterization of diet and metabolic processing of food plants, which can provide evolutionary ecologists and wildlife biologists much needed insight into the nutritional and physiological ecology of the systems they study and manage.
Introduction
Strong selection across sharp ecological boundaries can produce or maintain patterns of adaptive divergence over small spatial scales, even in the presence of gene flow (Antonovics, 2006; Grahame et al., 2006; Rosenblum, 2006, reviewed in Richardson et al., 2014). Sharp ecotones provide spatially proximate but selectively distinct sets of environmental factors to which organisms may respond, thereby potentially initiating species divergence or influencing the evolutionary trajectory of species coming back into secondary contact after having diverged in isolation (Smith et al., 1997; Schluter, 2001). For animals, one of the main environmental factors to which they must respond at sharp habitat boundaries or in heterogeneous environments is food availability. Indeed, some of the best examples of ecological adaptation are the result of diet-related selection, including bill variation in Darwin’s finches (Grant and Grant, 2006), gill raker morphology of stickleback fishes (Schluter and McPhail, 1992), and jaw morphology in salamanders (Adams and Rohlf, 2000). For some herbivores, food consumption is ultimately a chemically-mediated ecological interaction wherein animals must balance the acquisition of nutrients while minimizing exposure to potentially toxic plant secondary compounds (Dearing et al., 2005). Some of the primary diet-related adaptations in these herbivores, then, are likely associated with how these animals protect themselves metabolically from over-exposure to plant toxins (Skopec et al., 2008; Forbey et al., 2018). Identifying the underlying phenotypic plasticity and evolutionary potential (Sorensen et al., 2005; Magnanou et al., 2009; Gompert et al., 2015; Oh et al., 2019) of the traits that allow metabolic processing of plant toxins is central to understanding diet-related ecological adaptation in herbivores. Further, identifying how animals respond to changes in exposure to plant secondary compounds, spatially and temporally, will be critical in predicting how animals will respond to climate change, and the associated shifts in community composition and food availability (Estrada et al., 2016; Beale et al., 2018; Forbey et al., 2018).
Here, we take advantage of the overall ecological transition between the relatively mesic southeastern slopes of the Sierra Nevada Mountains and the arid western valleys of the Mojave Desert (Figure 1) to understand how small mammal herbivores of the genus Neotoma (woodrats) respond to fine-scale shifts in plant availability and toxin exposure. At the western edge of the Kelso Valley of California there is a sharp habitat transition (within tens of meters) between the mesic woodland uplands, or “hill” habitat, and the starkly arid desert basin, or “flats” habitat immediately adjacent to the base of the hill (Figure 1; Shurtliff et al., 2014). At this site, the relatively mesic-adapted Neotoma bryanti (Bryant’s woodrat) primarily occupies the boulder-strewn hill habitat, while the relatively arid-adapted Neotoma lepida (Desert woodrat) primarily occupies the flats habitat (Patton et al., 2007; Shurtliff et al., 2014). Although the adjacent hill and flats habitats are well within the dispersal capabilities of individual woodrats, multi-year mark-recapture studies have shown that there is limited short or long-term movement between the two habitats (Shurtliff et al., 2014). Despite the overall spatial segregation of the two species, approximately 13% of the woodrats at the site have hybrid ancestry, ranging from first generation hybrids to highly backcrossed individuals in both parental directions that are largely co-distributed with their predominant parental genomic type (i.e., backcrossed-lepida are primarily found in the flats and backcrossed-bryanti are found almost solely on the hill; Shurtliff et al., 2014).
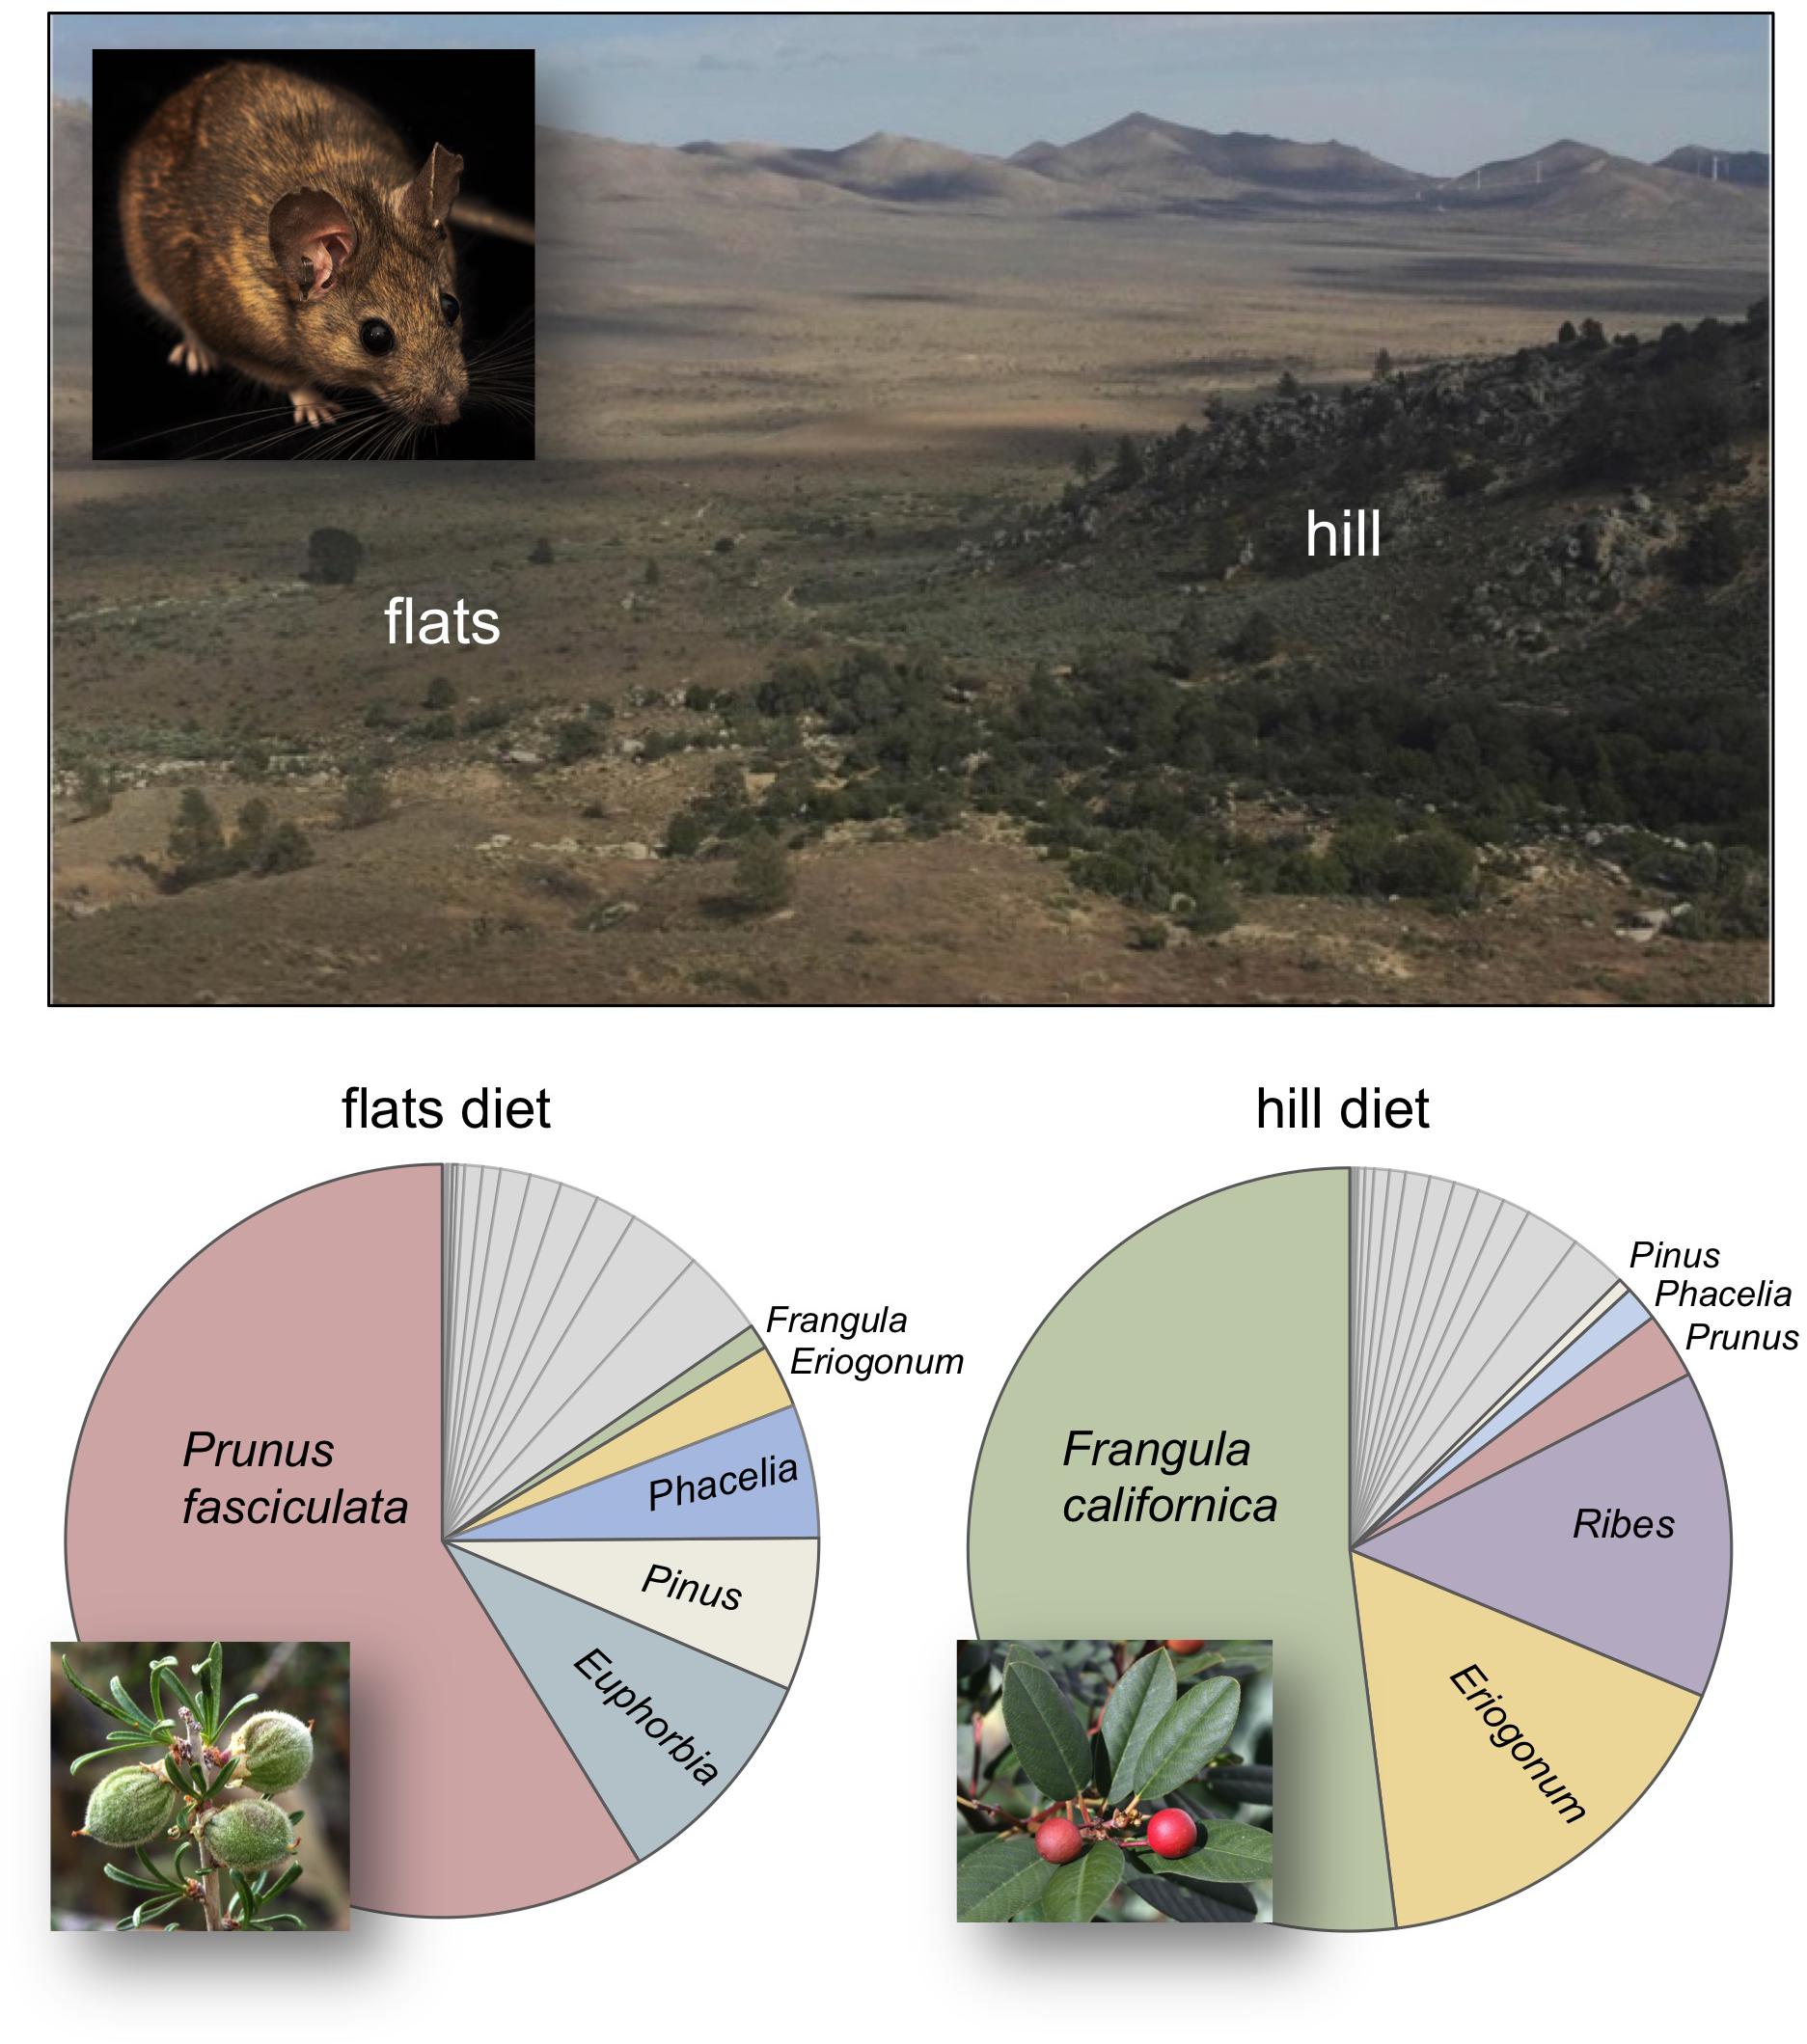
Figure 1. Diet composition of woodrats occupying the “flats” and “hill” habitats of a sharp ecological transition that exists at the Whitney Well site of Kelso Valley, California. The flats habitat is predominantly occupied by N. lepida while the hill is largely occupied by N. bryanti. Diet is represented as the relative read abundance of plant DNA found in fecal samples collected at woodrat nests in each habitat (Nhill = 13, Nflats = 12). A list of all plants, the range of relative read abundance values, and frequency of occurrence in each habitat are provided in Supplementary Table 1. Inset shows Neotoma lepida, the desert woodrat (photo by Alexx Hamblin). Plant inset photos taken from CalPhotos; Prunus © 2008 Steve Matson, Frangula © 2008 John J. Kehoe.
We hypothesize that the strong spatial segregation of the species and their respective backcrosses at this site is at least in part due to differential adaptations in metabolic processing of available plants in these distinct, yet adjacent, habitats. As such, we predicted that woodrats in the flats habitat would consume a diet distinct from woodrats on the hill. Further, many of the plants specific to either habitat are phytochemically distinct and well-defended including sagebrush (Artemesia tridentata), rabbitbrush (Ericameria sp.), and desert almond (Prunus fasciculata) in the flats; and California coffeeberry (Frangula californica) and pine (Pinus sp.) on the hill. As such, we sought to develop chemical profiling methods to identify fecal metabolites that may be associated with diet-specific metabolic processes. Thus, in addition to predicting we would find habitat-specific diets, we also predicted that woodrats would exhibit habitat-specific metabolomic profiles as a result of their encounters with unique phytochemical toxins in their diets. This system provides a unique opportunity to investigate the potential for fine-scale differential plant consumption and possible distinct strategies for metabolic processing of plant toxins even in the face of hybridization and gene flow between distinct habitats.
Materials and Methods
Field Sampling
Adult woodrats build and defend a large stick nest that they occupy solely, and each nest has an obvious latrine area where fecal pellets accumulate. To begin identifying which plants woodrats are consuming in these habitats, in July 2013, we collected fecal pellet clusters from 28 unique woodrat houses known to have been previously occupied by N. bryanti on the hill (n = 15) and N. lepida in the flats habitat (n = 13). We expected that this initial snapshot of the diet in these habitats would reflect among the most restrictive dietary conditions these animals face. That is, in July of any year at this desert site, plant availability is likely to be primarily restricted to perennial shrubs and trees, but because 2013 was a particularly severe drought year, we expect that few annual forbs were available in the weeks leading up to our sampling. We collected samples at nests within a 150 m radius of where the base of the hill meets the flats (Figure 1) in order to capture the abrupt habitat transition. Beyond being associated with obvious woodrat nests, all fecal pellets collected were the characteristic shape and size of adult Neotoma (Smith et al., 1995). Although samples were clearly associated with a single nest and our genotyping did not show evidence of multiple individuals within a sample (see below), we cannot be completely certain that all pellets taken from a nest were left by the same individual, and thus, these should be considered community samples representative of the surrounding habitat. We stored fecal samples in paper envelopes and allowed them to continue to dry at ambient temperature until processed. All plant metabarcoding and chemical analyses were conducted within 1 year of sample collection.
Woodrat Genotyping
We classified individual samples to species by extracting DNA from three fecal pellets per house using the QIAamp DNA Stool kit (Qiagen, Inc.). We followed manufacturer instructions with the following modifications: (1) we allowed fecal pellets to soak in the first buffer for 4 h, then pipetted out the buffer to start the first step of the protocol, and (2) the final elution step was done with 100 μl of molecular grade water, and this elute was passed through the filter twice to increase DNA concentration. We genotyped samples at a suite of microsatellite loci developed by Sousa et al. (2007) and following lab methods as described in Coyner et al. (2015). Species identity was made by combining the samples of this study with a larger dataset of known N. bryanti and N. lepida from the study site and running STRUCTURE (Pritchard et al., 2000) at K = 2 as in Shurtliff et al. (2014).
Fecal DNA Barcoding and Diet Composition
Fecal pellets were sent to SPYGEN (Inc.) where plant DNA was extracted from 8 to 10 individual pellets (∼10 mg) per pellet cluster using the DNeasy Mini Stool Kit (Qiagen, Inc.) following manufacturer instructions. A segment of the trnL gene was amplified using the universal primers gh that typically result in fragments between 10 and 143 bp depending on the plant species (Taberlet et al., 2007; Pompanon et al., 2012). DNA amplification was repeated 4 times per sample and mock extractions and amplifications were carried through each experiment to monitor for contamination. Amplified products were titrated by capillary electrophoresis (QIAxcel; Qiagen GmbH, Hilden, Germany) and purified using the MinElute PCR purification kit (Qiagen GmbH, Hilden, Germany), then titrated again using capillary electrophoresis. Purified PCR products were pooled in equal volumes. Library preparation and sequencing were performed at Fasteris (Geneva, Switzerland). Libraries were prepared using the TruSeq NanoDNA genomic kit (Illumina, San Diego, CA, United States) and paired-end sequenced (2 × 100 bp) on an Illumina MiSeq (Illumina, San Diego, CA, United States) using the Paired-end MiSeqReagentKit V2 (Illumina, San Diego, CA, United States) following manufacturer’s instructions. Raw sequences were demultiplexed and quality filtered and eliminated from the dataset if they had less than 98% identity to plant sequences held in GenBank (following Valentini et al., 2009). Putative OTUs (operational taxonomic units) were established based on clustering sequences with > 98% sequence similarity, and the most commonly recovered sequence was designated as representative for that OTU; this led to 33 OTUs represented by at least 50 reads across the entire dataset. Plant identification from these representative reads was made by conducting a BLAST search of the NCBI standard databases1 using a blastn search of “somewhat similar sequences” and inspecting all taxa with > 98% sequence identity. When only a single species had 100% sequence identity and was known to occur at the site from our own collections or from the region based on the CalFlora database2, we identified the read as representing that plant species. When multiple species of the same genus had 100% identity with the searched read, we narrowed the blastn list to those species known from the region based on the CalFlora database or from our own collections at the site, and only report the genus level since multiple species could be represented by the sequence we recovered. Finally, when multiple species within multiple genera known from the region or our own collections matched our read at 100%, we report the family level (Supplementary Table 1). To estimate diet composition we established the relative read abundance (RRA) of each plant within each woodrat sample, and then averaged across all hill or all flats samples to estimate habitat-based diet composition. Here, we assume that RRA is proportional to the amount of a food item consumed (Bergmann et al., 2015; Kartzinel et al., 2015). While we recognize that RRA may only be a coarse index of quantity of food consumed, even with moderate recovery biases, RRA has been shown to provide an accurate view of dietary composition at the population level (Deagle et al., 2019). We also report the frequency of occurrence (FOO); a measure that only relies on the presence/absence of plants rather than their abundance (Deagle et al., 2019). Finally, while we have confirmed that these primers amplify the most common shrub species at the study site, we have yet to conduct thorough digestion studies (e.g., Willerslev et al., 2014), so our results should be viewed as a coarse, overall view of diet composition across this study site at the time of sampling.
Fecal Metabolite Analyses
Operating with no prior knowledge of what woodrats consume at this site, we applied an untargeted metabolomics approach to generate chemical profiles from the same fecal samples used in the DNA diet analysis (see above). Our approach is designed to generate chemical profiles from small samples (fecal pellets) in order to quantify chemical variation at the individual level, allowing for direct comparison between individual plant consumption and chemical profile. We optimized a protocol adapted from Santos Pimenta et al. (2014), which entailed extracting 200 mg dry weight from each of 28 fecal samples in 2 mL of a 50:50 KH2PO4 buffer:CD3OD. We analyzed extracts using both proton nuclear magnetic resonance (1H-NMR) spectroscopy and high-pressure liquid chromatography coupled with mass spectrometry (HPLC-MS) to achieve un-targeted metabolite profiles. HPLC-MS analysis is more sensitive than 1H-NMR and can detect compounds that occur at very low concentrations, but is more dependent on the specific ionization efficiencies of the molecules under analysis when compared to 1H-NMR. To minimize the effect of the KH2PO4 buffer on the HPLC-MS chromatograms, we added 3 mL H2O + 0.1% formic acid and lyophilized the aqueous suspension prior to obtaining extract masses. We then dissolved samples in methanol to approximately 1 mg/mL for HPLC-MS analysis. Samples were analyzed using an Agilent 1200 HPLC coupled to an Agilent G6230A high-resolution high-mass accuracy time-of-flight (TOF) mass spectrometer with an electrospray ionization (ESI) source using the following settings: gas temperature: 325°C; gas flow: 8 L/min; nebulizer: 35 psig; capillary voltage: 3500 V; fragmentor: 175 V; skimmer1: 65 V; octopole: 750 V; mass range: 100–3000 m/z. Chromatographic separation was accomplished using a Phenomenex Kinetex-EVO C18 2.6 μm column (2.1 × 100 mm, 100 Å) maintained at 40°C. The mobile phase consisted of (A) H2O + 10 mM NH4OAc and (B) MeCN with an elution gradient of: 1–14 min, 5–100% B; 14–16 min, maintain 100% B; 16–17 min, 100–5% B; 17–20 min, maintain 5% B for column re-equilibration. The flow rate was 0.5 mL/min, and the sample injection volume was 2 μL. Finally, we analyzed extracts from several individuals of the dominant diet plants in each habitat. Approximately 200 mg dry weight from each individual was extracted in 3 mL of 50:50 CH3OH:H2O. Samples were vortexed for 30 s, sonicated for 15 min, and centrifuged for 15 min before filtering. An aliquot of each sample was diluted with H2O for HPLC-MS analysis as described above. The remaining liquid extract was dried down under nitrogen and reduced pressure. Samples were then reconstituted in 50:50 CD3OD:D2O for 1H-NMR analysis.
We processed 1H-NMR data using MestReNova software (Mestrelab Research, Spain). We aligned spectra from crude extracts using the solvent peak, then baseline and phase corrected, and binned every 0.04 ppm from 0.5 to 12 ppm using the global spectral deconvolution method. We removed solvent and water peaks prior to normalizing bins to a total area of 100. We ran a Mantel test using Spearman’s rank correlation coefficients in R (mantel function in vegan, Oksanen et al., 2018; R Core Team, 2019) to compare the Bray-Curtis dissimilarity matrix of the chemical profiles of fecal samples to the dissimilarity matrix of the plants present in each fecal sample based on DNA data. We used Partial Least Squares Discriminant Analysis (plsda function in mixOmics, Lê Cao et al., 2016) to visualize the 1H-NMR data. The HPLC-MS data were processed using Proteowizard (Chambers et al., 2012) and MZmine (Katajamaa et al., 2006) to obtain an aligned peak list. We used a network approach implemented in Cytoscape (Shannon et al., 2003) to visualize relationships between diet, habitat and fecal chemical profiles. We tested for differences in the chemical profiles of fecal samples from hill and flats habitats using a permutational multivariate analysis of variance of the Bray-Curtis dissimilarity matrices (function adonis in vegan package). For the HPLC-MS data, we also used Non-Metric Multidimensional Scaling (NMDS) for dimension reduction and data visualization. We tested whether the proportion of the dominant diet plants found through DNA analysis predicted chemical dissimilarity by projecting vectors on the NMDS plot that maximized the correlation between chemistry and proportion of the dominant diet plants (function envfit in vegan package). Finally, we validated these results using a linear regression model in which the proportion of the dominant diet plants in the sample predicted the first coordinate scores.
Results
Using microsatellite genotyping, we confirmed that 12 of 15 hill samples were left by N. bryanti, and 10 of 13 flats samples were left by N. lepida. Six woodrat fecal samples did not return an adequate number of alleles to definitively assign them to one species or the other. Because the results we report below are qualitatively the same with and without the woodrat samples that we could not attribute to one species or the other, we report data from all 25 samples that yielded trnL data that passed quality filtering.
From plant trnL sequencing, we recovered 2,345,967 reads from 25 sets of fecal samples resulting in a final sample size of Nhill = 13 and Nflats = 12 because we eliminated two of the original 15 hill samples and one of the original 13 flats samples that returned fewer than 500 reads each. The trnL dataset provided evidence of 33 unique taxa that included resolution to the species (19), genus (7), or family (7) level (Supplementary Table 1). All taxa recovered are well-known from the region (according to the CalFlora database) and most have been documented at the site and collected by our group (Q. Shurtliff and D. Nielsen, pers. comm.). Eleven plant taxa were recovered in diets from both the hill and the flats; another 11 taxa were only recovered from the flats; and the final 11 taxa were only recovered from the hill (Supplementary Table 1).
We found the diet of animals occupying the flats (predominantly N. lepida) was dominated by Prunus fasciculata (desert almond, RRA = 58.8%; Figure 1 and Supplementary Table 1) along with 21 other plants, none of which had an overall RRA greater than 5%, with the exception of Euphorbia maculata (spotted spurge, RRA = 9.8%), Phacelia tanacetifolia (tansy leafed phacelia, RRA = 5.7%) and the family Pinaceae (RRA = 6.6%). Animals on the hill (predominantly N. bryanti) had a diet dominated by Frangula californica (California coffeeberry; RRA = 51.9%; Figure 1), with moderate representation of Eriogonum umbellatum (sulpher buckwheat, RRA = 16.8%) and Ribes amarum (bitter gooseberry, RRA = 13.9%), but none of the other 19 plants eaten by hill animals occurred at a RRA higher than 5%, including P. fasciculata (RRA = 2.8%).
On the hill, 10 of 13 samples contained F. californica (frequency of occurrence (FOO) = 77%; Supplementary Table 1), while in the flats, 10 of 12 samples contained P. fasciculata (FOO = 83%). In contrast, one of 13 hill samples showed evidence of P. fasciculata (FOO = 7.7%), while one of 12 flats samples showed evidence of F. californica (FOO = 8.3%). The only other plant with a frequency of occurrence greater than 50% in either habitat was E. umbellatum. This species of buckwheat was found in 8 of 13 samples from the hill habitat (FOO = 62%). Only one sample from the flats habitat showed consumption of buckwheat (FOO = 8.3%), and this was the same sample that showed consumption of F. californica in the flats.
We were able to obtain HPLC-MS data from Nhill = 10 and Nflats = 10 fecal samples for which we present DNA data, but because 1H-NMR requires higher sample concentration than HPLC-MS, we were only able to obtain 1H-NMR data from Nhill = 7 and Nflats = 8 samples. Using 1H-NMR data, we found fecal samples have a significant correlation between their chemical profiles and plant RRA (Mantel statistic r = 0.19, p = 0.04). PLS-DA of 1H-NMR data showed that hill and flats animals had distinct metabolomic profiles (Figure 2A, R2 = 0.88, Q2 = 0.63), although further analyses are needed to interpret the specific 1H-NMR signal loadings of the PLS-DA. HPLC-MS data showed that there were many metabolites that were ubiquitous across all samples, but also revealed several habitat-specific metabolites [Figure 3, habitat effect on chemistry F(1, 19) = 2.61, p < 0.01]. Consistent with the 1H-NMR data, we found a significant correlation between chemistry and plant DNA found in fecal samples (Mantel statistic r = 0.26, p < 0.01). We found that the proportion of P. fasciculata and F. californica in the fecal samples was significantly correlated with chemical similarity (r2 = 0.34, p < 0.05 and r2 = 0.38, p < 0.05, respectively) in opposing directions along the first coordinate (NMDS1) of the NMDS plot. In a linear regression, we found that the proportion of F. californica in the diet significantly predicted chemistry [R2 = 0.36, F(1, 18) = 9.92, p < 0.01] and was positively related to NMDS1 with a slope coefficient of 0.58. In comparison, the proportion of P. fasciculata in the diet significantly predicted chemistry [R2 = 0.33, F(1, 18) = 8.80, p < 0.01], but was negatively related to NMDS1 with a slope coefficient of −0.58. Finally, we show that F. californica and P. fasciculata are chemically diverse plants that have distinct chemical profiles (Figure 4). Further analyses are required for full chemical characterization of these plants, including across seasons, individuals and tissue types. Nonetheless, our data show that F. californica from our study site contains a clear peak with a characteristic mass associated with emodin, a common anthraquinone (Figure 4 and Supplementary Figure 1). In P. fasciculata from our site we found evidence of masses and fragmentation that are characteristic of prunasin, a cyanogenic glycoside (Figure 4 and Supplementary Figure 1).
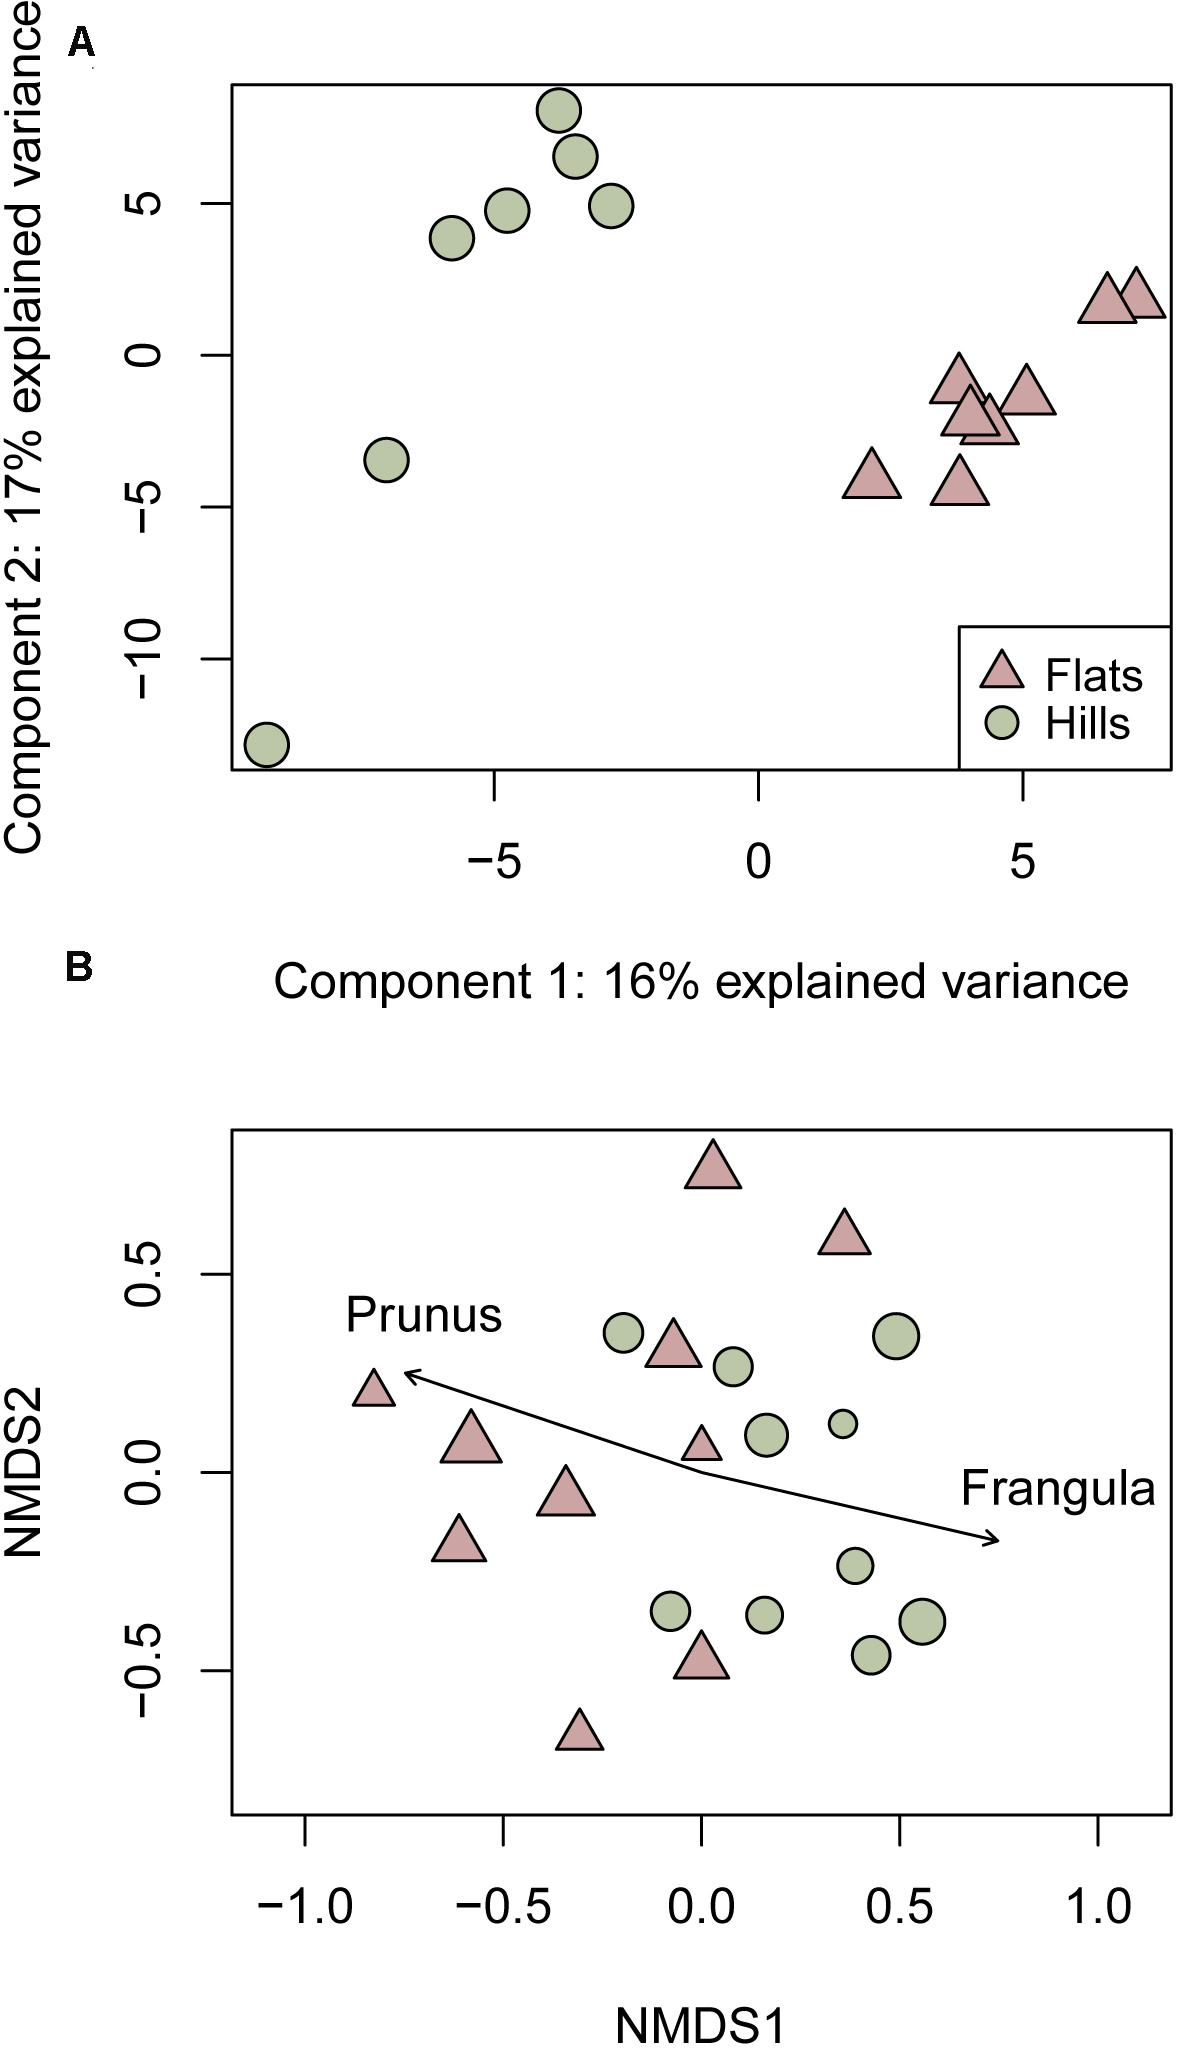
Figure 2. Metabolite profile of woodrat fecal pellets collected in the hill (green) and flats habitats (pink). (A) PLS-DA of 1H-NMR chemical profiles in each habitat. (B) NMDS plot of HPLC-MS chemical profiles showing that chemical differences in woodrat feces are associated with the proportion of Prunus fasciculata and Frangula californica DNA in the feces. Point size reflects RRA of Prunus and Frangula, no individuals were found to consume both plants.
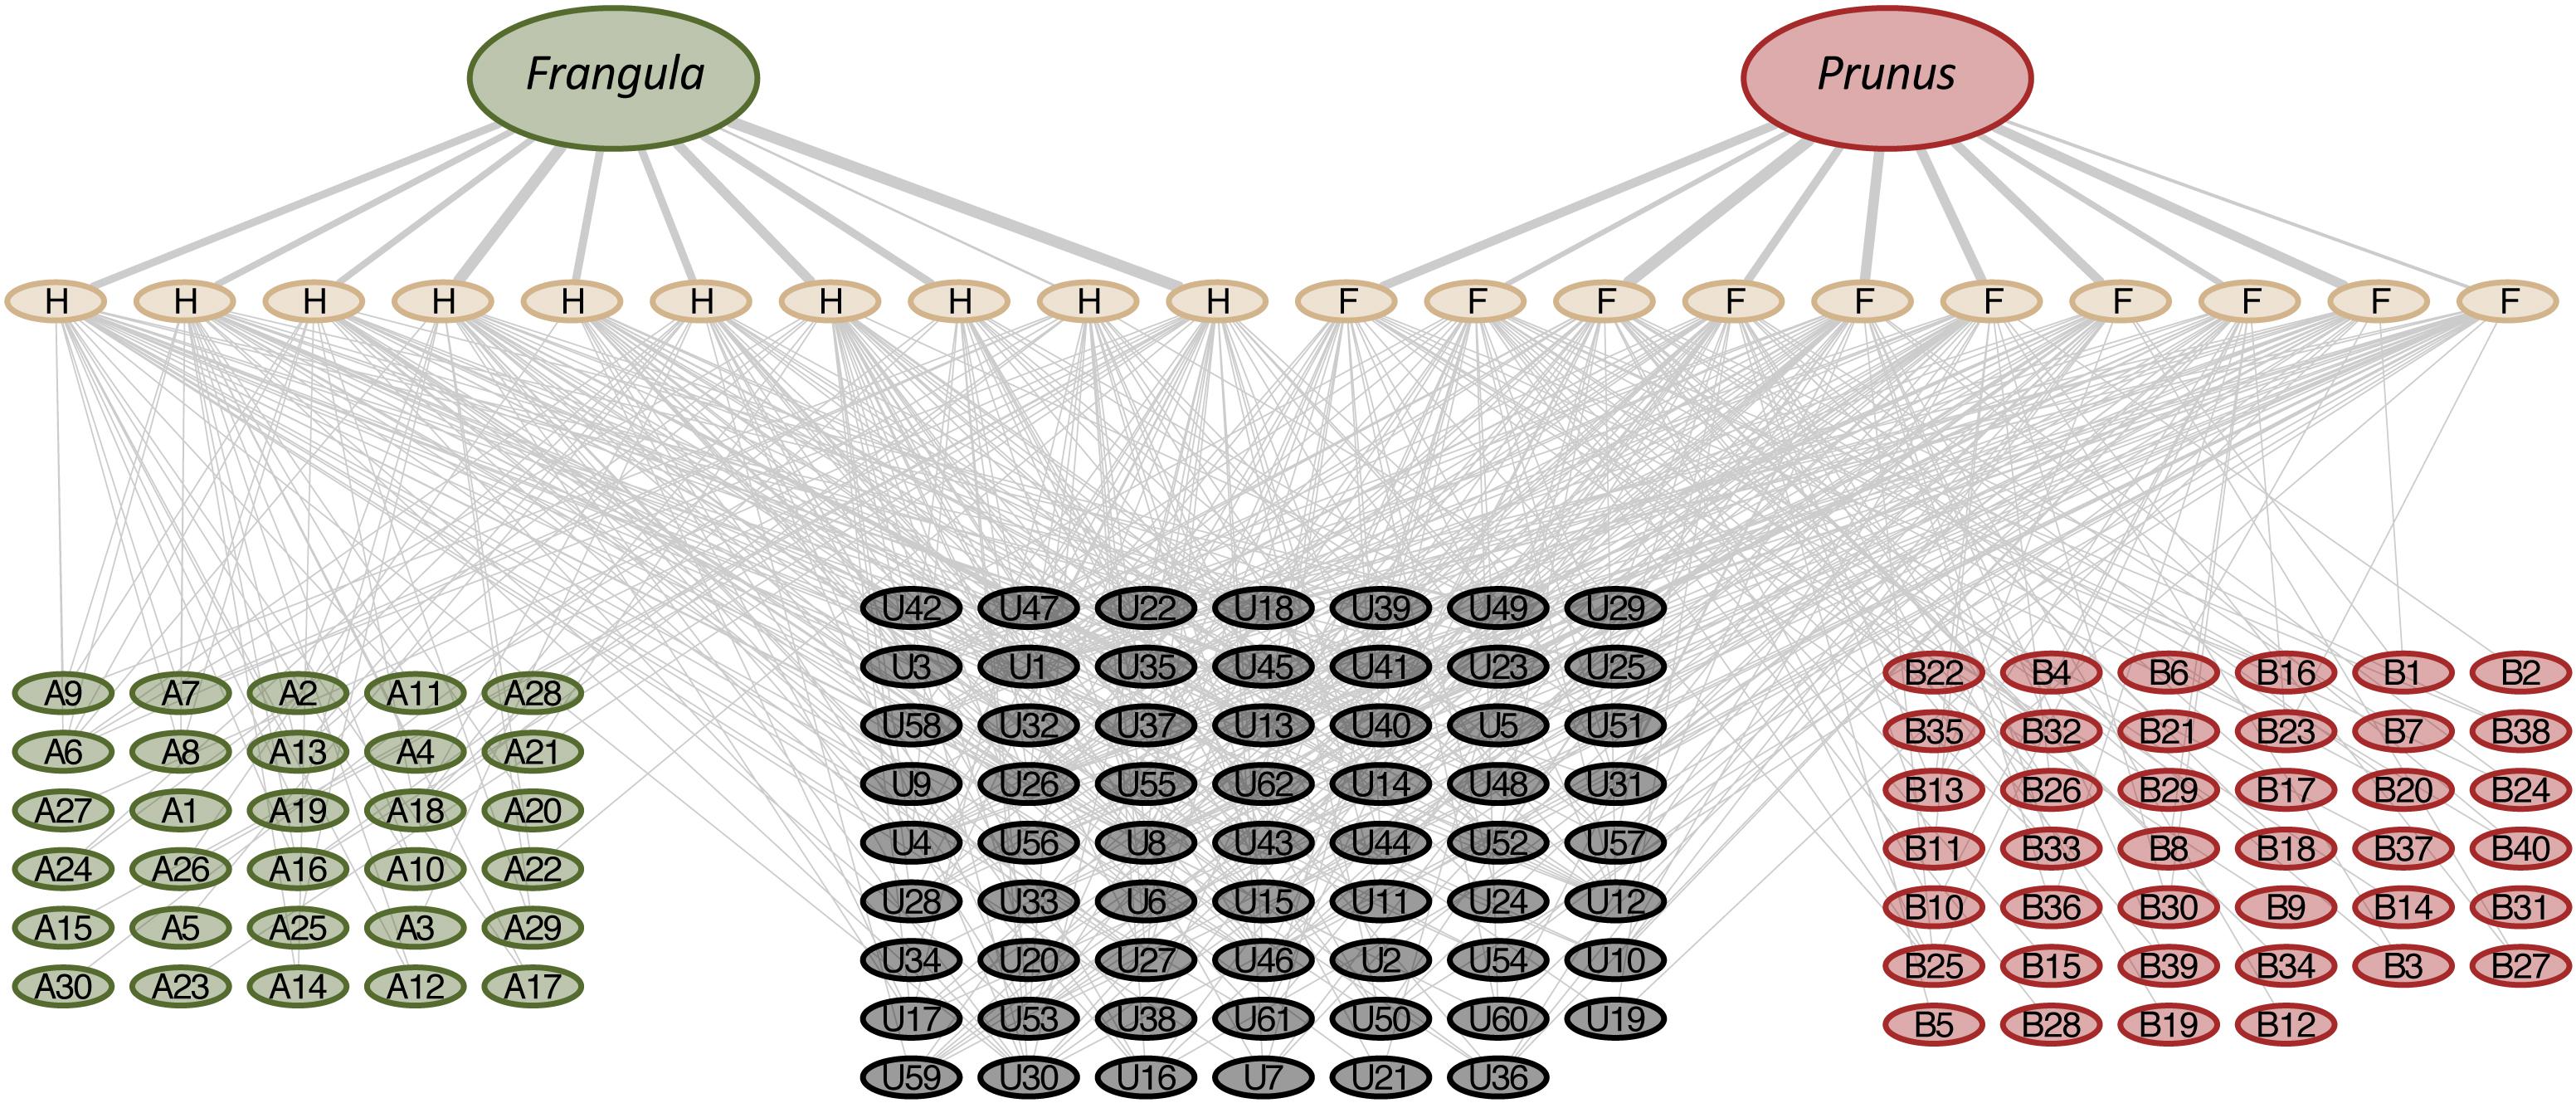
Figure 3. Tripartite network relating plant diet (Frangula californica and Prunus fasciculata) to individual woodrat fecal samples from the hill (H) and the flats (F) habitats and the metabolites (m/z features) identified through LC-MS of their respective fecal samples. The metabolites cluster into three groups, those that are shared between all rats (gray), those unique to hill rats consuming F. californica (green) and those unique to flat rats consuming P. fasciculata (pink).
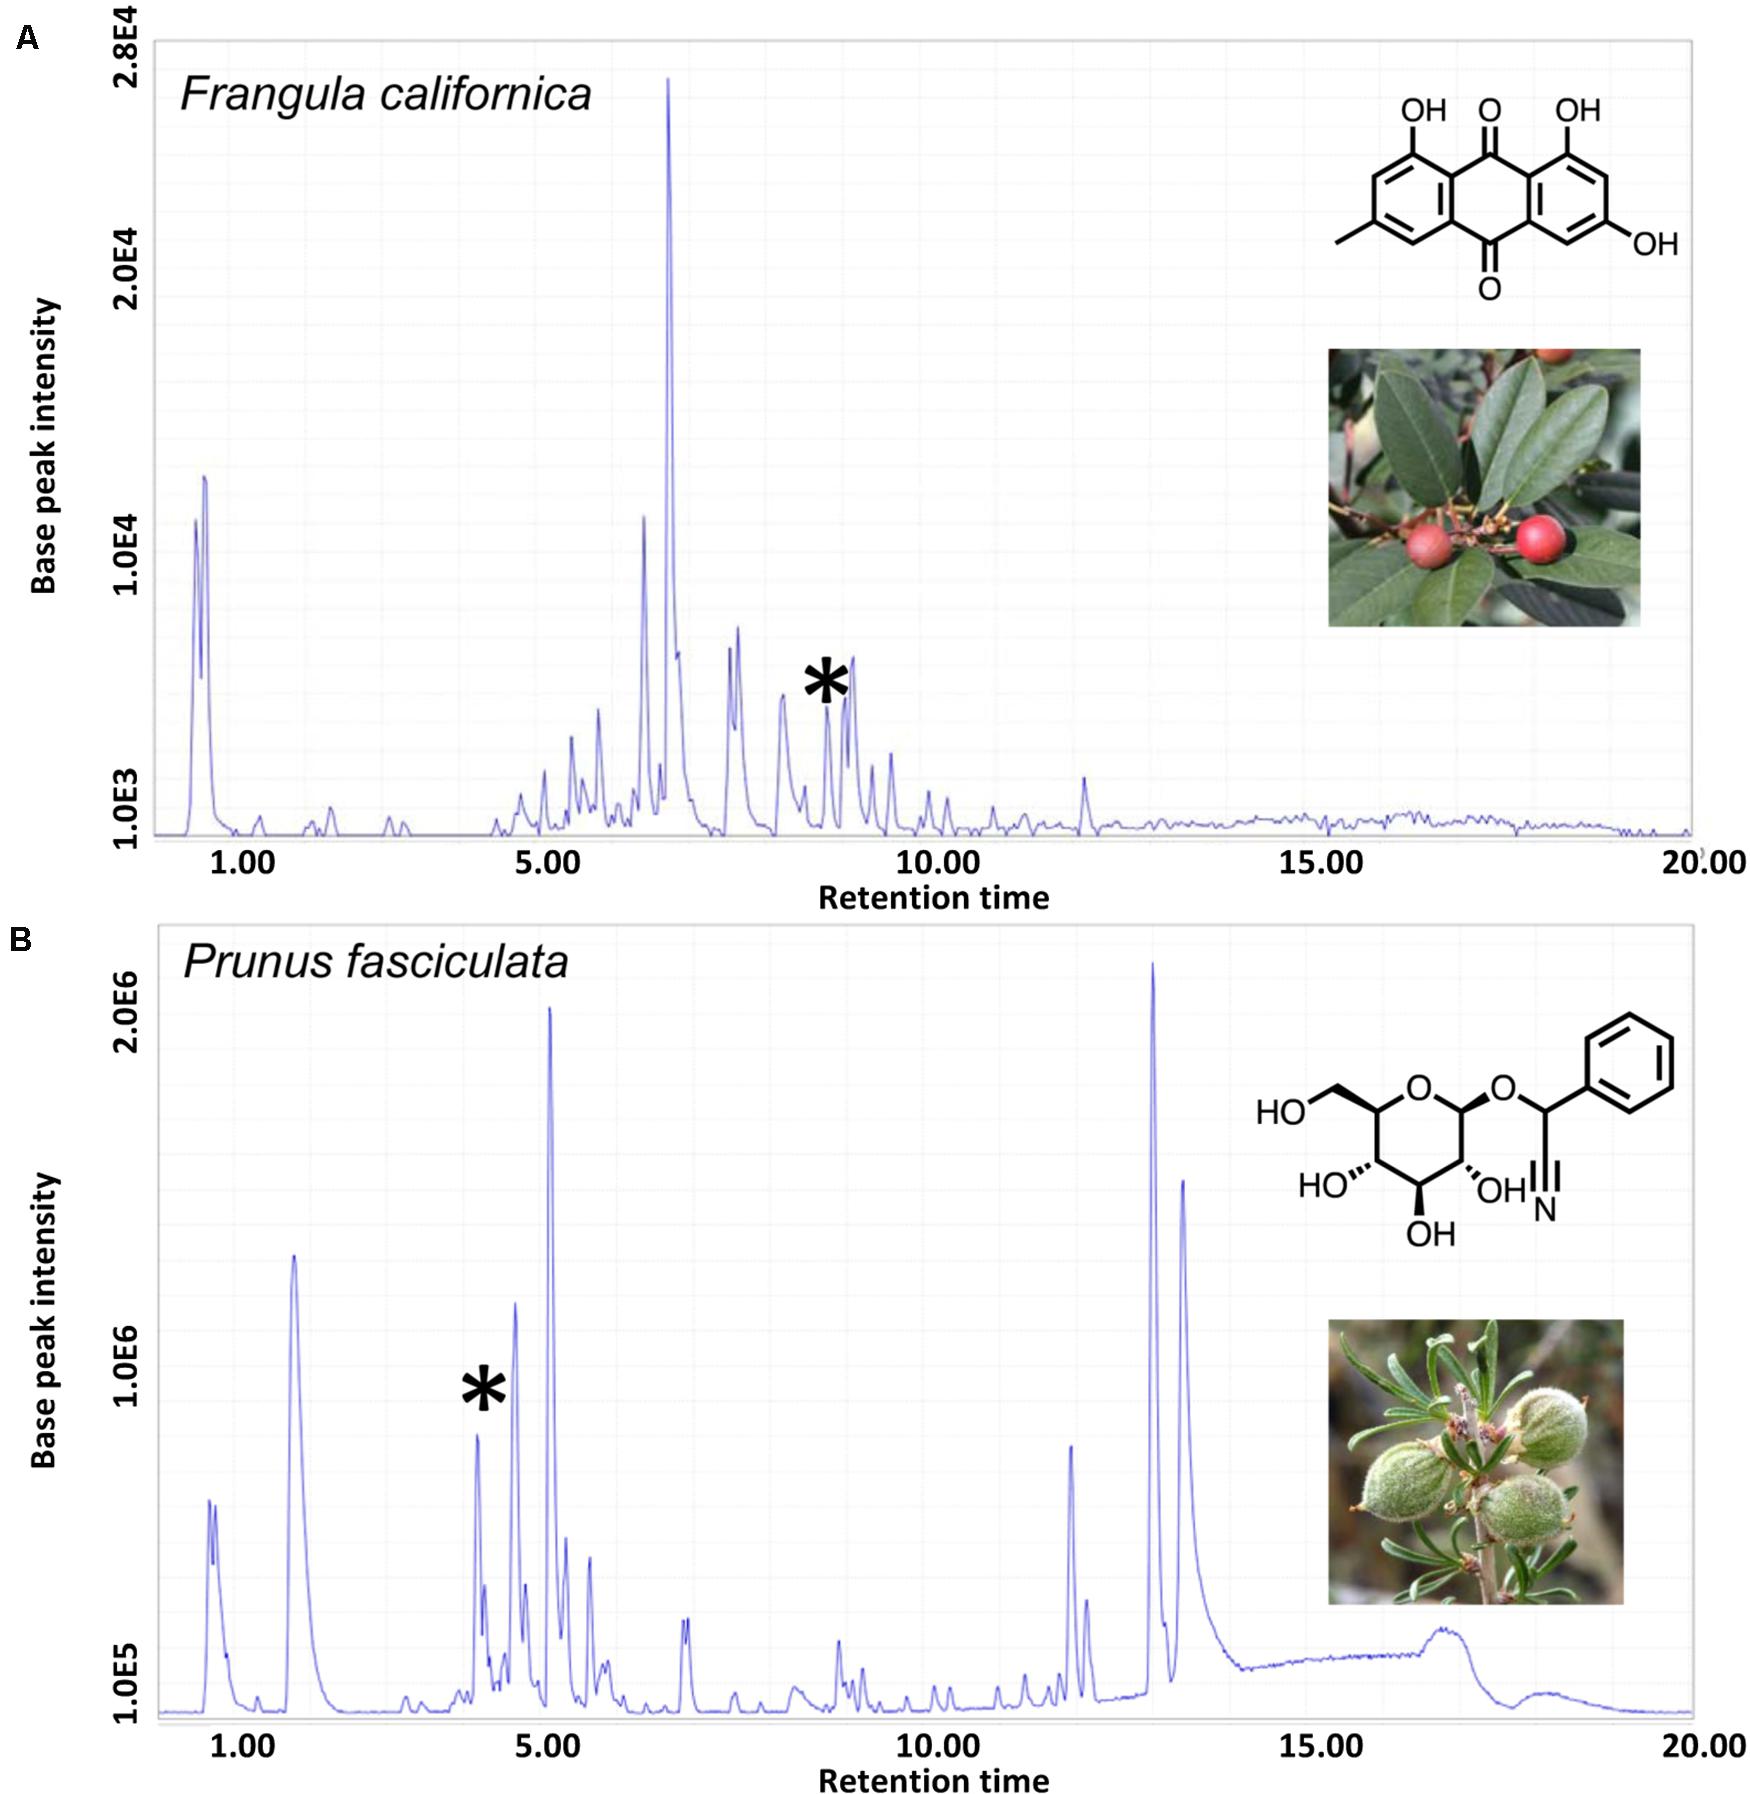
Figure 4. HPLC-MS chromatograms of the dominant plant species in hill and flat diets, Frangula californica and Prunus fasciculata, respectively. (A) The asterisk indicates the chromatographic peak that corresponds to the anthraquinone, emodin. (B) The asterisk indicates the chromatographic peak that corresponds to the cyanogenic glycoside, prunasin. Mass spectrum of specified chromatographic peaks are available in Supplementary Table 2.
Discussion
Our study demonstrates fine-scale diet and metabolomic differentiation across a sharp ecological boundary. Using genetic analysis of fecal samples we show that woodrats occupying each side of this sharp ecotone largely consumed distinct sets of plants during our sampling period. Frangula californica was the most common diet item in the hill habitat (FOO = 77%, RRA = 52%) while Prunus fasciculata was dominant in diets of woodrats in the flats habitat (FOO = 83%, RRA = 59%). Additional sampling across seasons and years will be needed to identify the importance of Frangula and Prunus in the dietary ecology of these animals. Nonetheless, that woodrats can consume large amounts of either of these plants for any duration of time is surprising because both are known to contain compounds that are potentially highly toxic to herbivores. From the literature we know that P. fasciculata contains cyanogenic glycosides that are transformed into hydrogen cyanide upon mastication and later in the digestive process (Santamour, 1998), while F. californica contains anthraquinones, which cause damage to the intestinal lining resulting in a strong laxative effect (Surh et al., 2013). We found evidence that the plants at our study site had characteristic HPLC-MS fragments for both cyanogenic glycosides in P. fasciculata (i.e., prunasin) and anthraquinones in F. californica (i.e., emodin). Holistically, HPLC-MS data of these plants reflect distinct chemical compositions that likely require different detoxification strategies (see below). Therefore, we anticipated discovering distinct metabolic products in the feces of the woodrats consuming these plants.
Our chemical analyses did, indeed, reveal distinct chemical signatures in the feces of animals consuming these different diets. Specifically, woodrats on the hill, that have diets containing a large amount of F. californica, had several unique fecal metabolites not shared with woodrats from the flats that consume diets dominated by P. fasciculata, and vice versa (Figure 3). Moreover, while both hill and flats animals eat a variety of plants, the proportion of P. fasciculata and F. californica consumed based on DNA evidence is the primary driver of differentiation between the fecal metabolomic profiles of these animals (Figure 2B). The habitat-specific chemical profiles we document here are a composite from various sources including unaltered plant chemistry (undigested plant material) as well as plant material chemically modified by woodrat and microbial digestive and detoxification processes. Further analyses, including controlled feeding trials with individual plants, will be needed to characterize the unique metabolites we have discovered here. Likewise, further sampling of woodrat tissues/products including blood and urine will be needed to capture a more complete array of dietary compounds from these plants and their post-ingestion metabolites (Dunn et al., 2011; Forbey et al., 2018). Nonetheless, these fecal metabolomic profiles reflect the distinct chemistries of the habitat-specific diets in this system, along with how hill and flats woodrats are metabolically processing these diets.
Other woodrat populations are known to consume large quantities of highly toxic plants including creosote bush (Larrea tridentata; Magnanou et al., 2009), juniper (Sorensen et al., 2005), oak leaves (Skopec et al., 2008), and mesquite (Smith et al., 2014). Our data suggest that the woodrats occupying the hill habitat (predominantly N. bryanti) have developed or evolved the capacity to consume large quantities of F. californica, while woodrats on the flats (predominantly N. lepida) have developed or evolved the capacity to consume large amounts of P. fasciculata. Our study adds to the growing list of chemically well-defended plants that members of the genus Neotoma appear capable of consuming in large quantities, and in some cases, on which they locally specialize.
Detoxification of F. californica and P. fasciculata has not been studied in woodrats, but data from laboratory rats and mice allow us to make initial predictions of metabolic processing of the compounds held in these plants. Anthraquinones produced by F. californica have a strong laxative effect and, in other mammals, detoxification of these compounds is at least partly mediated in the liver by cytochrome P450 1A2 (Mueller et al., 1998). In contrast, the hydrogen cyanide that animals are exposed to when consuming P. fasciculata is partly detoxified by the enzyme rhodanese, which is heavily expressed in the liver (Dooley et al., 1995). It is likely that woodrats at least partly use these mechanisms to protect themselves from toxin exposure when consuming F. californica and P. fasciculata, respectively. In addition to their own detoxification pathways, the microbiome may also be involved in helping woodrats detoxify these compounds. In the case of creosote, the microbiome facilitates the woodrat’s capacity to detoxify this plant (Kohl et al., 2014) suggesting that the microbiome may play a role in the detoxification of other plants woodrats consume (reviewed in Kohl and Dearing, 2016). Finally, the degree to which woodrats are exposed to either prunasin or emodin will also be determined by the interaction of these compounds with others that occur in these plants (Figure 4 and Supplementary Table 2) and those in other plants they consume simultaneously. It is intriguing to note that 12 of 14 individuals (86%) that consumed California coffeeberry (F. californica) also consumed sulpher buckwheat (E. umbellatum). This apparent co-occurrence could suggest that the combined chemistry of these plants might synergistically/antagonistically provide added nutrition and/or protection from toxins (Caesar and Cech, 2019).
This system presents a case of particularly fine-scale differentiation in feeding ecology despite gene flow across these species and habitat boundaries. Although our snapshot of diets at this site may represent among the most restrictive dietary conditions these populations face, the strong selection associated with these periods may have profound effects on population persistence and the evolutionary trajectory of these populations. Additional experimental work is needed to determine if N. lepida and N. bryanti have evolved unique genetically-based mechanisms to metabolize the dominant compounds in either P. fasciculata or F. californica, or whether they deploy existing metabolic pathways. Further, it will be critical to assess whether these species and their hybrids are capable of metabolizing the plant they are not adapted or acclimated to consuming in their native habitat (i.e., hill animals eating P. fasciculata and flats animals eating F. californica). Because neither plant is very common in either habitat (although P. fasciculata is predominantly found in the flats and F. californica is largely restricted to the hill), the distribution of these plants could influence the spatial distribution of these animals and the opportunity for interspecific contact and mating (prezygotic isolation, e.g., Caillaud and Via, 2000). Further, if only certain interspecific genomic or genomic-microbial combinations can successfully metabolize these diets, this may influence patterns of hybrid survival (postzygotic isolation) and genomic introgression across this system. Importantly, because there is interspecific gene flow across the habitat boundary, there is the potential for introgression of metabolically advantageous alleles and their integration into largely heterospecific genomes. Given this, the microsatellite species identifications presented here should be viewed as a coarse view of genome composition, because these animals could all have some heterospecific alleles in their genomes. Overall, systems such as this have the potential to provide novel insights into how a spectrum of mammalian genomes across a hybrid zone interact with microbial genomes to face the ecological challenges posed by their environment, including the plants they consume.
Future Directions
One of the most pressing challenges vertebrate populations will face as they respond to a changing climate is food acquisition. As species respond to changing conditions, shifts in plant phenology and distribution (Parmesan and Hanley, 2015) may reduce the availability of preferred food items for herbivores. In addition, environmental change (e.g., elevated CO2 and temperature) is expected to dramatically modify plant chemistry, often increasing potentially toxic plant secondary compounds (Zvereva and Kozlov, 2006; Jamieson et al., 2017). Further, as temperatures increase, the rates at which herbivores can metabolically process plant secondary compounds are expected to decrease (Kurnath et al., 2016; Beale et al., 2018), further exacerbating increases in plant toxicity (Forbey et al., 2013). There will be growing need for ecologists and wildlife managers to monitor the metabolic capabilities of wildlife populations as plants and animals respond to changing conditions.
The integrated approach we demonstrate here provides a non-invasive method to quickly gain insight into wild herbivore diet composition, the chemical profile of plants they are predominantly being exposed to, and the products of metabolism that indicate how they are metabolizing particular plants and their secondary compounds. The case study we present here could be classified as a “rapid assessment” to create an initial baseline of diet composition and metabolic processing. Thorough reconstruction of diet would require sampling across seasons and years, and ideally, repeated sampling of known individuals. If fecal samples can be collected directly from live-trapped individuals and immediately frozen, it is possible to recover the fecal microbiome (see Kohl et al., 2015) in addition to plant DNA and fecal chemistry, providing an integrated view of concerted change in diet, microbial community composition, and overall metabolic processing. In addition to sampling animal diet, plant chemistry should also be monitored through time at a site, although the method we describe here is intended to recover relatively stable chemical compounds and metabolites, and not volatile compounds. Overall, in this study system and others, additional work is needed to (1) refine primer sets and DNA databases so that fecal DNA read counts more accurately reflect herbivore diets, (2) identify specific metabolites and the metabolic processes they reflect, and (3) integrate this approach into wildlife monitoring plans to link diet-related physiology to population health and demography (Forbey et al., 2018). The application of these approaches will require close collaboration between ecologists and wildlife managers, and will result in unprecedented insight into how these and other herbivores interact with their environment at a highly mechanistic level.
Data Availability Statement
The datasets presented in this study can be found in online repositories. The names of the repository/repositories and accession number(s) can be found below: NCBI GenBank (accession MT640105–MT640142).
Author Contributions
MM conceived of the study, conducted the fieldwork, genotyping, and diet analyses, and wrote the first draft of the manuscript. MM, LR, and CJ obtained the funding. KO and LR collected the metabolic data. DN assisted in genotyping and diet analyses. All authors contributed to revising the manuscript.
Funding
This research was supported in part by the National Science Foundation (IOS-1457209 and OIA-1826801).
Conflict of Interest
The authors declare that the research was conducted in the absence of any commercial or financial relationships that could be construed as a potential conflict of interest.
Acknowledgments
We thank D. Dearing, J. Forbey, J. Patton, E. Bellemain, C. Feldman, and the UNR EvolDoers for helpful discussions. We thank P. Murphy for assistance in the field, K. Graski for assistance in the lab, and P. Hartley for his assistance through the Nevada Genomics Center. We also thank the Hitchcock Center for Chemical Ecology at the University of Nevada Reno for access to resources including graduate fellowships to KO and DN.
Supplementary Material
The Supplementary Material for this article can be found online at: https://www.frontiersin.org/articles/10.3389/fevo.2020.00282/full#supplementary-material
Footnotes
References
Adams, D. C., and Rohlf, F. J. (2000). Ecological character displacement in Plethodon: biomechanical differences found from a geometric morphometric study. Proc. Natl. Acad. Sci. U.S.A. 97, 4106–4111. doi: 10.1073/pnas.97.8.4106
Antonovics, J. (2006). Evolution in closely adjacent plant populations X: long-term persistence of prereproductive isolation at a mine boundary. Heredity 97, 33–37. doi: 10.1038/sj.hdy.6800835
Beale, P. K., Marsh, K. J., Foley, W. J., and Moore, B. D. (2018). A hot lunch for herbivores: physiological effects of elevated temperatures on mammalian feeding ecology. Biol. Rev. Camb. Philos. Soc. 93, 674–692. doi: 10.1111/brv.12364
Bergmann, G. T., Craine, J. M., and Robeson, M. S. (2015). Seasonal shifts in diet and gut microbiota of the American bison (Bison bison). PLoS One 10:e0142409. doi: 10.1371/journal.pone.0142409
Caesar, L. K., and Cech, N. B. (2019). Synergy and antagonism in natural product extracts: when 1 + 1 does not equal 2. Natural Prod. Rep. 36, 869–888. doi: 10.1039/c9np00011a
Caillaud, M. C., and Via, S. (2000). Specialized feeding behavior influences both ecological specialization and assortative mating in sympatric host races of pea aphids. Am. Nat. 156, 606–621. doi: 10.1086/316991
Chambers, M. C., MacLean, B., Burke, R., Amode, D., Ruderman, D. L., and Neumann, S. (2012). A cross-platform toolkit for mass spectrometry and proteomics. Nat. Biotechnol. 30, 918–920.
Coyner, B., Murphy, P. J., and Matocq, M. D. (2015). Hybridization and asymmetric introgression across a narrow zone of contact between Neotoma fuscipes and N. macrotis (Rodentia: Cricetidae). Biol. J. Linn. Soc. 115, 162–172.
Deagle, B. E., Thomas, A. C., McInnes, J. C., Clarke, L. J., Vesterinen, E. J., Clare, E. L., et al. (2019). Counting with DNA in metabarcoding studies: how should we convert sequence reads to dietary data? Mol. Ecol. 28, 391–406. doi: 10.1111/mec.14734
Dearing, M. D., Foley, W. J., and McLean, S. (2005). The influence of plant secondary metabolites on the nutritional ecology of herbivorous terrestrial vertebrates. Annu. Rev. Ecol. Evol. Syst. 36, 169–189. doi: 10.1146/annurev.ecolsys.36.102003.152617
Dooley, T. P., Nair, S. K., Garcia, R. E. IV, and Courtney, B. C. (1995). Mouse rhodanese gene (tst) - cdna cloning, sequencing, and recombinant protein expression. Biochem. Biophys. Res. Commun. 216, 1101–1109. doi: 10.1006/bbrc.1995.2734
Dunn, W. B., Broadhurst, D. I., Atherton, H. J., Goodacre, R., and Griffin, J. L. (2011). Systems level studies of mammalian metabolomes: the roles of mass spectrometry and nuclear magnetic resonance spectroscopy. Chem. Soc. Rev. 40, 387–426. doi: 10.1039/b906712b
Estrada, A., Morales-Castilla, I., Caplat, P., and Early, R. (2016). Usefulness of species traits in predicting range shifts. Trends Ecol. Evol. 31, 190–203. doi: 10.1016/j.tree.2015.12.014
Forbey, J. S., Liu, R., Caughlin, T. T., Matocq, M. D., Vucetich, J. A., Kohl, K. D., et al. (2018). Using physiologically-based models to predict population responses to phytochemicals by wild vertebrate herbivores. Animal 12, s383–s398.
Forbey, J. S., Wiggins, N. L., Frye, G. G., and Connelly, J. W. (2013). Hungry grouse in a warming world: emerging risks from plant chemical defenses and climate change. Wildlife Biol. 19, 374–381. doi: 10.2981/13-014
Gompert, Z., Jahner, J. P., Scholl, C. F., Wilson, J. S., Lucas, L. K., Soria-Corrasco, V., et al. (2015). The evolution of novel host use is unlikely to be constrained by trade-offs or a lack of genetic variation. Mol. Ecol. 24, 2777–2793. doi: 10.1111/mec.13199
Grahame, J. W., Wilding, C. S., and Butlin, R. K. (2006). Adaptation to a steep environmental gradient and an associated barrier to gene exchange in Littorina saxatilis. Evolution 60, 268–278. doi: 10.1554/05-592.1
Grant, P. R., and Grant, B. R. (2006). Evolution of character displacement in Darwin’s finches. Science 313, 224–226. doi: 10.1126/science.1128374
Jamieson, M. A., Burkle, L. A., Manson, J. S., Runyon, J. B., Trowbridge, A. M., and Zientek, J. (2017). Global change effects on plant-insect interactions: the role of phytochemistry. Curr. Opin. Insect Sci. 23, 70–80. doi: 10.1016/j.cois.2017.07.009
Kartzinel, T. R., Chen, P. A., Coverdale, T. C., Erickson, D. L., Kress, W. J., Kuzmina, M. L., et al. (2015). DNA metabarcoding illuminates dietary niche partitioning by African large herbivores. Proc. Natl. Acad. Sci. U.S.A. 112, 8019–8024. doi: 10.1073/pnas.1503283112
Katajamaa, M., Miettinen, J., and Orešič, M. (2006). MZmine: toolbox for processing and visualization of mass spectrometry based molecular profile data. Bioinformatics 22, 634–636. doi: 10.1093/bioinformatics/btk039
Kohl, K. D., and Dearing, M. D. (2016). The woodrat gut microbiota as an experimental system for understanding microbial metabolism of dietary toxins. Front. Microbiol. 7:1165. doi: 10.3389/fmicb.2016.01165
Kohl, K. D., Luong, K., and Dearing, M. D. (2015). Validating the use of trap-collected feces for studying the gut microbiota of a small mammal (Neotoma lepida). J. Mammal. 96, 90–93. doi: 10.1093/jmammal/gyu008
Kohl, K. D., Weiss, R. B., Cox, J., Dale, C., and Dearing, M. D. (2014). Gut microbes of mammalian herbivores facilitate intake of plant toxins. Ecol. Lett. 17, 1238–1246. doi: 10.1111/ele.12329
Kurnath, P., Merz, N. D., and Dearing, M. D. (2016). Ambient temperature influences tolerance to plant secondary compounds in a mammalian herbivore. Proc. R. Soc. B 283:20152387. doi: 10.1098/rspb.2015.2387
Lê Cao, K. A., Rohart, F., Gonzalez, I., Dejean, S., Gautier, B., Bartolo, F., et al. (2016). mixOmics: Omics Data Integration Project. R Package Version 6.1.1. Avaliable at: https://CRAN.R-project.org/package=mixOmics (accessed January 30, 2020).
Magnanou, E., Malenke, J. R., and Dearing, M. D. (2009). Expression of biotransformation genes in woodrat (Neotoma) herbivores on novel and ancestral diets: identification of candidate genes responsible for dietary shifts. Mol. Ecol. 18, 2401–2414. doi: 10.1111/j.1365-294x.2009.04171.x
Mueller, S. O., Stopper, H., and Dekant, W. (1998). Biotransformation of the anthraquinones emodin and chrysophanol by cytochrome p450 enzymes - bioactivation to genotoxic metabolites. Drug Metab. Dispos. 26, 540–546.
Oh, K. P., Aldridge, C. L., Forbey, J. S., Dadabay, C. Y., and Oyler-McCance, S. J. (2019). Conservation genomics in the sagebrush sea: population divergence, demographic history, and local adaptation in sage grouse (Centrocercus spp.). Genome Biol. Evol. 11, 2023–2034. doi: 10.1093/gbe/evz112
Oksanen, J., Blanchet, F. G., Friendly, M., Kindt, R., Legendre, P., McGlinn, D., et al. (2018). vegan: Community Ecology Package. R package version 2.5-2. Avaliable at: https://CRAN.R-project.org/package=vegan (accessed August 30, 2019).
Parmesan, C., and Hanley, M. E. (2015). Plants and climate change: complexities and surprises. Ann. Bot. 116, 849–864. doi: 10.1093/aob/mcv169
Patton, J. L., Huckaby, D. G., and Alvarez-Castaneda, S. (2007). The Evolutionary History and a Systematic Revision of Woodrats of the Neotoma Lepida Group. Berkeley, CA: University of California Publications, 135.
Pompanon, F., Deagle, B. E., Symondson, W. O., Brown, D. S., Jarman, S. N., and Taberlet, P. (2012). Who is eating what: diet assessment using next generation sequencing. Mol. Ecol. 21, 1931–1950. doi: 10.1111/j.1365-294x.2011.05403.x
Pritchard, J. K., Stephens, M., and Donnelly, P. (2000). Inference of population structure using multilocus genotype data. Genetics 155, 945–959.
R Core Team (2019). R: A Language and Environment for Statistical Computing. Vienna: R Foundation for Statistical Computing.
Richardson, J. L., Urban, M. C., Bolnick, D. I., and Skelly, D. K. (2014). Microgeographic adaptation and the spatial scale of evolution. Trends Ecol. Evol. 29, 165–176. doi: 10.1016/j.tree.2014.01.002
Rosenblum, E. B. (2006). Convergent evolution and divergent selection: lizards at the White Sands ecotone. Am. Nat. 167, 1–15. doi: 10.2307/3491243
Santamour, F. S. (1998). Amygdalin in Prunus leaves. Phytochemistry 47, 1537–1538. doi: 10.1016/s0031-9422(97)00787-5
Santos Pimenta, L. P., Schilthuizen, M., Verpoorte, R., and Choi, Y. H. (2014). Quantitative analysis of amygdalin and prunasin in Prunus serotina Ehrh. using (1) H-NMR spectroscopy. Phytochem. Anal. 25, 122–126. doi: 10.1002/pca.2476
Schluter, D. (2001). Ecology and the origin of species. Trends Ecol. Evol. 16, 372–380. doi: 10.1016/s0169-5347(01)02198-x
Schluter, D., and McPhail, J. D. (1992). Ecological character displacement and speciation in sticklebacks. Am. Nat. 140, 85–102. doi: 10.1086/285404
Shannon, P., Markiel, A., Ozier, O., Baliga, N. S., Wang, J. T., Ramage, D., et al. (2003). Cytoscape: a software environment for integrated models of biomolecular interaction networks. Genome Res. 13, 2498–2504. doi: 10.1101/gr.1239303
Shurtliff, Q. R., Murphy, P. J., and Matocq, M. D. (2014). Ecological segregation in a small mammal hybrid zone: habitat-specific mating opportunities and selection against hybrids restrict gene flow on a fine spatial scale. Evolution 68, 729–742. doi: 10.1111/evo.12299
Skopec, M. M., Haley, S., Torregrossa, A. M., and Dearing, M. D. (2008). An oak (Quercus agrifolia) specialist (Neotoma macrotis) and a sympatric generalist (Neotoma lepida) show similar intakes and digestibilities of oak. Physiol. Biochem. Zool. 81, 426–433. doi: 10.1086/589106
Smith, F. A., Brown, J. H., and Betancourt, J. L. (1995). Evolution of body size in the woodrat over the past 25,000 years of climate change. Science 270, 2012–2014. doi: 10.1126/science.270.5244.2012
Smith, F. A., Murray, I. W., Harding, L. E., Lease, H. M., and Martin, J. (2014). Life in an extreme environment: a historical perspective on the influence of temperature on the ecology and evolution of woodrats. J. Mammal. 95, 1128–1143. doi: 10.1644/13-mamm-s-070
Smith, T. B., Wayne, R. K., Girman, D. J., and Bruford, M. W. (1997). A role for ecotones in generating rainforest biodiversity. Science 276, 1855–1857. doi: 10.1126/science.276.5320.1855
Sorensen, J. S., McLister, J. D., and Dearing, M. D. (2005). Plant secondary metabolites compromise the energy budgets of specialist and generalist mammalian herbivores. Ecology 86, 125–139. doi: 10.1890/03-0627
Sousa, B., Svensson, L. M. E., and Patton, J. L. (2007). Characterization of 18 microsatellite loci for woodrats for the Neotoma lepida group (Rodentia, Cricetidae, Neotominae). Mol. Ecol. Notes 7, 868–870. doi: 10.1111/j.1471-8286.2007.01732.x
Surh, I., Brix, A., French, J. E., Collins, B. J., Sanders, J. M., Vallant, M., et al. (2013). Toxicology and carcinogenesis study of senna in c3b6.129f1-trp53 (tm1brd) n12 haploinsufficient mice. Toxicol. Pathol. 41, 770–778. doi: 10.1177/0192623312464304
Taberlet, P., Coissac, E., Pompanon, F., Gielly, L., Miquel, C., Valentini, A., et al. (2007). Power and limitations of the chloroplast trnL (UAA) intron for plant DNA barcoding. Nucleic Acids Res. 35:e14. doi: 10.1093/nar/gkl938
Valentini, A., Miquel, C., Nawaz, M. A., Bellemain, E., Coissac, E., Pompanon, F., et al. (2009). New perspectives in diet analysis based on DNA barcoding and parallel pyrosequencing: the trnL approach. Mol. Ecol. Resour. 9, 51–60. doi: 10.1111/j.1755-0998.2008.02352.x
Willerslev, E., Davison, J., Moora, M., Zobel, M., Coissac, E., Edwards, M., et al. (2014). Fifty thousand years of arctic vegetation and megafaunal diet. Nature 506, 47–51.
Keywords: feeding ecology, chemical ecology, plant secondary compounds, Neotoma, woodrats
Citation: Matocq MD, Ochsenrider KM, Jeffrey CS, Nielsen DP and Richards LA (2020) Fine-Scale Differentiation in Diet and Metabolomics of Small Mammals Across a Sharp Ecological Transition. Front. Ecol. Evol. 8:282. doi: 10.3389/fevo.2020.00282
Received: 21 April 2020; Accepted: 10 August 2020;
Published: 11 September 2020.
Edited by:
Shannon J. McCauley, University of Toronto Mississauga, CanadaReviewed by:
Brian K. Trevelline, University of Pittsburgh, United StatesMichele M. Skopec, Weber State University, United States
Copyright © 2020 Matocq, Ochsenrider, Jeffrey, Nielsen and Richards. This is an open-access article distributed under the terms of the Creative Commons Attribution License (CC BY). The use, distribution or reproduction in other forums is permitted, provided the original author(s) and the copyright owner(s) are credited and that the original publication in this journal is cited, in accordance with accepted academic practice. No use, distribution or reproduction is permitted which does not comply with these terms.
*Correspondence: Marjorie D. Matocq, bW1hdG9jcUB1bnIuZWR1