Abstract
The southern North Sea is part of an important flyway for nocturnal bird migration, but is also risky as it stretches over a large surface of water. Selecting nights with suitable weather conditions for migration can be critical for a bird’s survival. The aim of this study is to unravel the weather-related bird migration decisions, by providing a descriptive analysis of the synoptic weather conditions over the North Sea on nights with very high and low migration intensities and compare these conditions to the prevailing climatology. For this study, bird radar data were utilized from an offshore wind farm off the Dutch coast, in the North Sea. The study suggests that atmospheric conditions clear of rain and frontal systems, dominated by high pressure systems and tailwinds in spring and sidewinds in autumn are most suitable for nights of intense migration. Differences in temperature, relative humidity and cloud cover appear less significant between intense and low migration nights, suggesting that these variables exert only a secondary role on migration. We discuss how future developments in radar aeroecology and the integration of meteorology can help improve our ability to forecast bird migration.
Introduction
Twice a year large flows of terrestrial birds migrate over the North Sea during the night (Lack, 1963a,b; Hüppop et al., 2006; Hüppop and Hüppop, 2011; Shamoun-Baranes and van Gasteren, 2011). The crossing mainly occurs between the lowlands of Netherlands and Germany and Norway (cca 540 km), Denmark and Netherlands (cca 300 km) and between United Kingdom and Netherlands (cca 200 km) (Lack, 1959; Shamoun-Baranes and van Gasteren, 2011; Bradarić et al., 2020). To cross such distances, a bird with the average airspeed of 16 m/s needs between 3.5 and 10 h in still air. Since such large water bodies are not suitable for resting and refueling for many terrestrial migrants, the trip is considered risky for migration, especially if at the same time birds have to cope with unfavorable weather conditions. It is therefore important for migrating birds to select nights with atmospheric conditions that support migration (Richardson, 1978). An addition to the risk posed by encountering inclement weather en route is the risk of collisions with large man-made structures, such as wind turbines developed within migratory flyways (Brabant et al., 2015; Fijn et al., 2015; Aschwanden et al., 2018; Thaxter et al., 2019). Nowadays the production of wind energy experiences a rapid expansion, as the necessity to reduce reliance on fossil fuels is large in order to mitigate the risks from human-induced climate change. To reduce chances of bird collisions the temporary shutdown of wind turbines is one of the mitigation measures suggested to reduce collision risk when bird migration intensities are high (May et al., 2015). In order to design effective and sustainable early warning systems a good understanding of migratory behavior is needed (Bauer et al., 2017).
During migration, daily numbers of birds in the air can fluctuate by orders of magnitude, and studies have shown that temporal variation in migration intensity can be explained in part by local weather conditions (Richardson, 1978; Erni et al., 2002; Van Belle et al., 2007; Shamoun-Baranes et al., 2017). Among diverse atmospheric variables, wind speed and direction is often considered the most influential for nocturnal migrants and especially passerines using flapping flight (Bruderer et al., 1995; Erni et al., 2002; Van Belle et al., 2007; Sjöberg et al., 2015), as with greater wind support travel time and energy expenditure are minimized (Liechti et al., 2000; Schmaljohann et al., 2009). The influence of wind on migratory birds is often discussed in terms of head and tailwinds along a preferred migration direction and sidewinds perpendicular to the preferred migration direction. It has been demonstrated that nocturnal passerine migrants have the ability to partially compensate for the side wind drift during their journey (Alerstam, 2011; McLaren et al., 2012; Chapman et al., 2016), but they tend to follow paths where they have to compensate less (Horton et al., 2016). Studies have shown that numbers of birds aloft (e.g., Erni et al., 2002; Van Belle et al., 2007) as well as probability of departure of passerines (Åkesson and Hedenström, 2000; Schaub et al., 2004; Sjöberg et al., 2015) is higher on nights with supporting winds.
There is evidence that precipitation is another key factor for migrants as it may temporarily suppresses migration (Richardson, 1978; Schaub et al., 2004). Rain might increase the risk of mortality as it decreases visibility and increases disorientation for birds en route (Newton, 2007). However, the impact of precipitation on departure decisions is not always clear, for example while Schaub et al. (2004) found decreased departure chances of small passerines during precipitation, Andueza et al. (2013) did not find an important effect of precipitation on departure decisions of migrating passerines. Cloud cover and temperature, have also been shown to influence departure decisions. For example a radio telemetry study showed that yellow-rumped warblers Setophaga coronata were more likely to depart from stopover sites (i.e., rest and refueling sites) in autumn in clear skies than overcast (Liu and Swanson, 2015) with temperature having less of an impact on departure decisions. The relative importance of weather variables may vary between spring and autumn as the prevailing weather conditions differ. For example, the passage of high-pressure systems can be related to opposing winds in autumn and supporting winds in spring (Dokter et al., 2013). Additionally, species with similar flight modes but contrasting migration strategies, for example short vs long distance passerines may respond differently to weather conditions at departure (Packmor et al., 2020). As many weather variables are closely intercorrelated, less influential variables such as the relative humidity will tend to vary in predictable ways as a function of the variables of higher importance, such as the pressure systems (Richardson, 1990), or precipitation, especially during relatively unstable atmospheric conditions.
The advancement of radar technology has greatly facilitated studying nocturnal migration even though radar systems cannot distinguish patterns and characteristics of migration at a species level (Bauer et al., 2019). The aim of this study is to increase our understanding of how weather influences mass migration events over the sea. The study compares synoptic scale weather conditions to climatology on nights of very high migration intensities and nights of very low migration intensities over the North Sea. In order to study conditions during migration within the context of seasonal weather conditions, we calculate the climatological anomalies of several key weather variables. The weather conditions associated with the selected high migration intensity nights should indicate conditions that favor migration. Respectively the weather conditions associated with the low migration nights should indicate the conditions that might inhibit migration for the specific latitude and geography over the North Sea. The key variables of interest follow suggestions from previous research (Richardson, 1990) and include: winds at 925 hPa, mean sea level pressure (MSLP), 500 hPa geopotential height, precipitation, relative humidity, cloudiness, and temperature. Furthermore, using surface synoptic weather maps, we explore the passage of frontal systems on nights of high and low migration intensity. The research is based on spring and autumn bird radar observations made 18 km from the Dutch coast, in the North Sea, and the concurrent synoptic weather conditions over sea and in potential departure areas. We expect that intense peaks and lulls in migration observed over sea will be strongly influenced by weather conditions at potential departure areas over land during the night of interest. Previous studies of passerine migration have shown that seasonal phenology at stopover sites can be strongly influenced by weather conditions at distant stopover or overwintering areas in spring (Haest et al., 2018) and distant stopover or breeding ranges in autumn (Haest et al., 2019). Thus, we describe the synoptic scale conditions in relation to potential departure areas on nights of high migration intensity. A back-trajectory analysis of migration using the same radar dataset (Bradarić et al., 2020) showed that the most probable departure areas of the birds on nights of high migration intensity observed at the radar site in spring is southern United Kingdom (area in blue circle in Figure 1) and in autumn is Southern Scandinavia, the north coast of Netherlands and Germany (area in red circle in Figure 1). We discuss similarities and differences between spring and autumn in synoptic scale conditions that support or potentially inhibit migration over the southern North Sea.
FIGURE 1
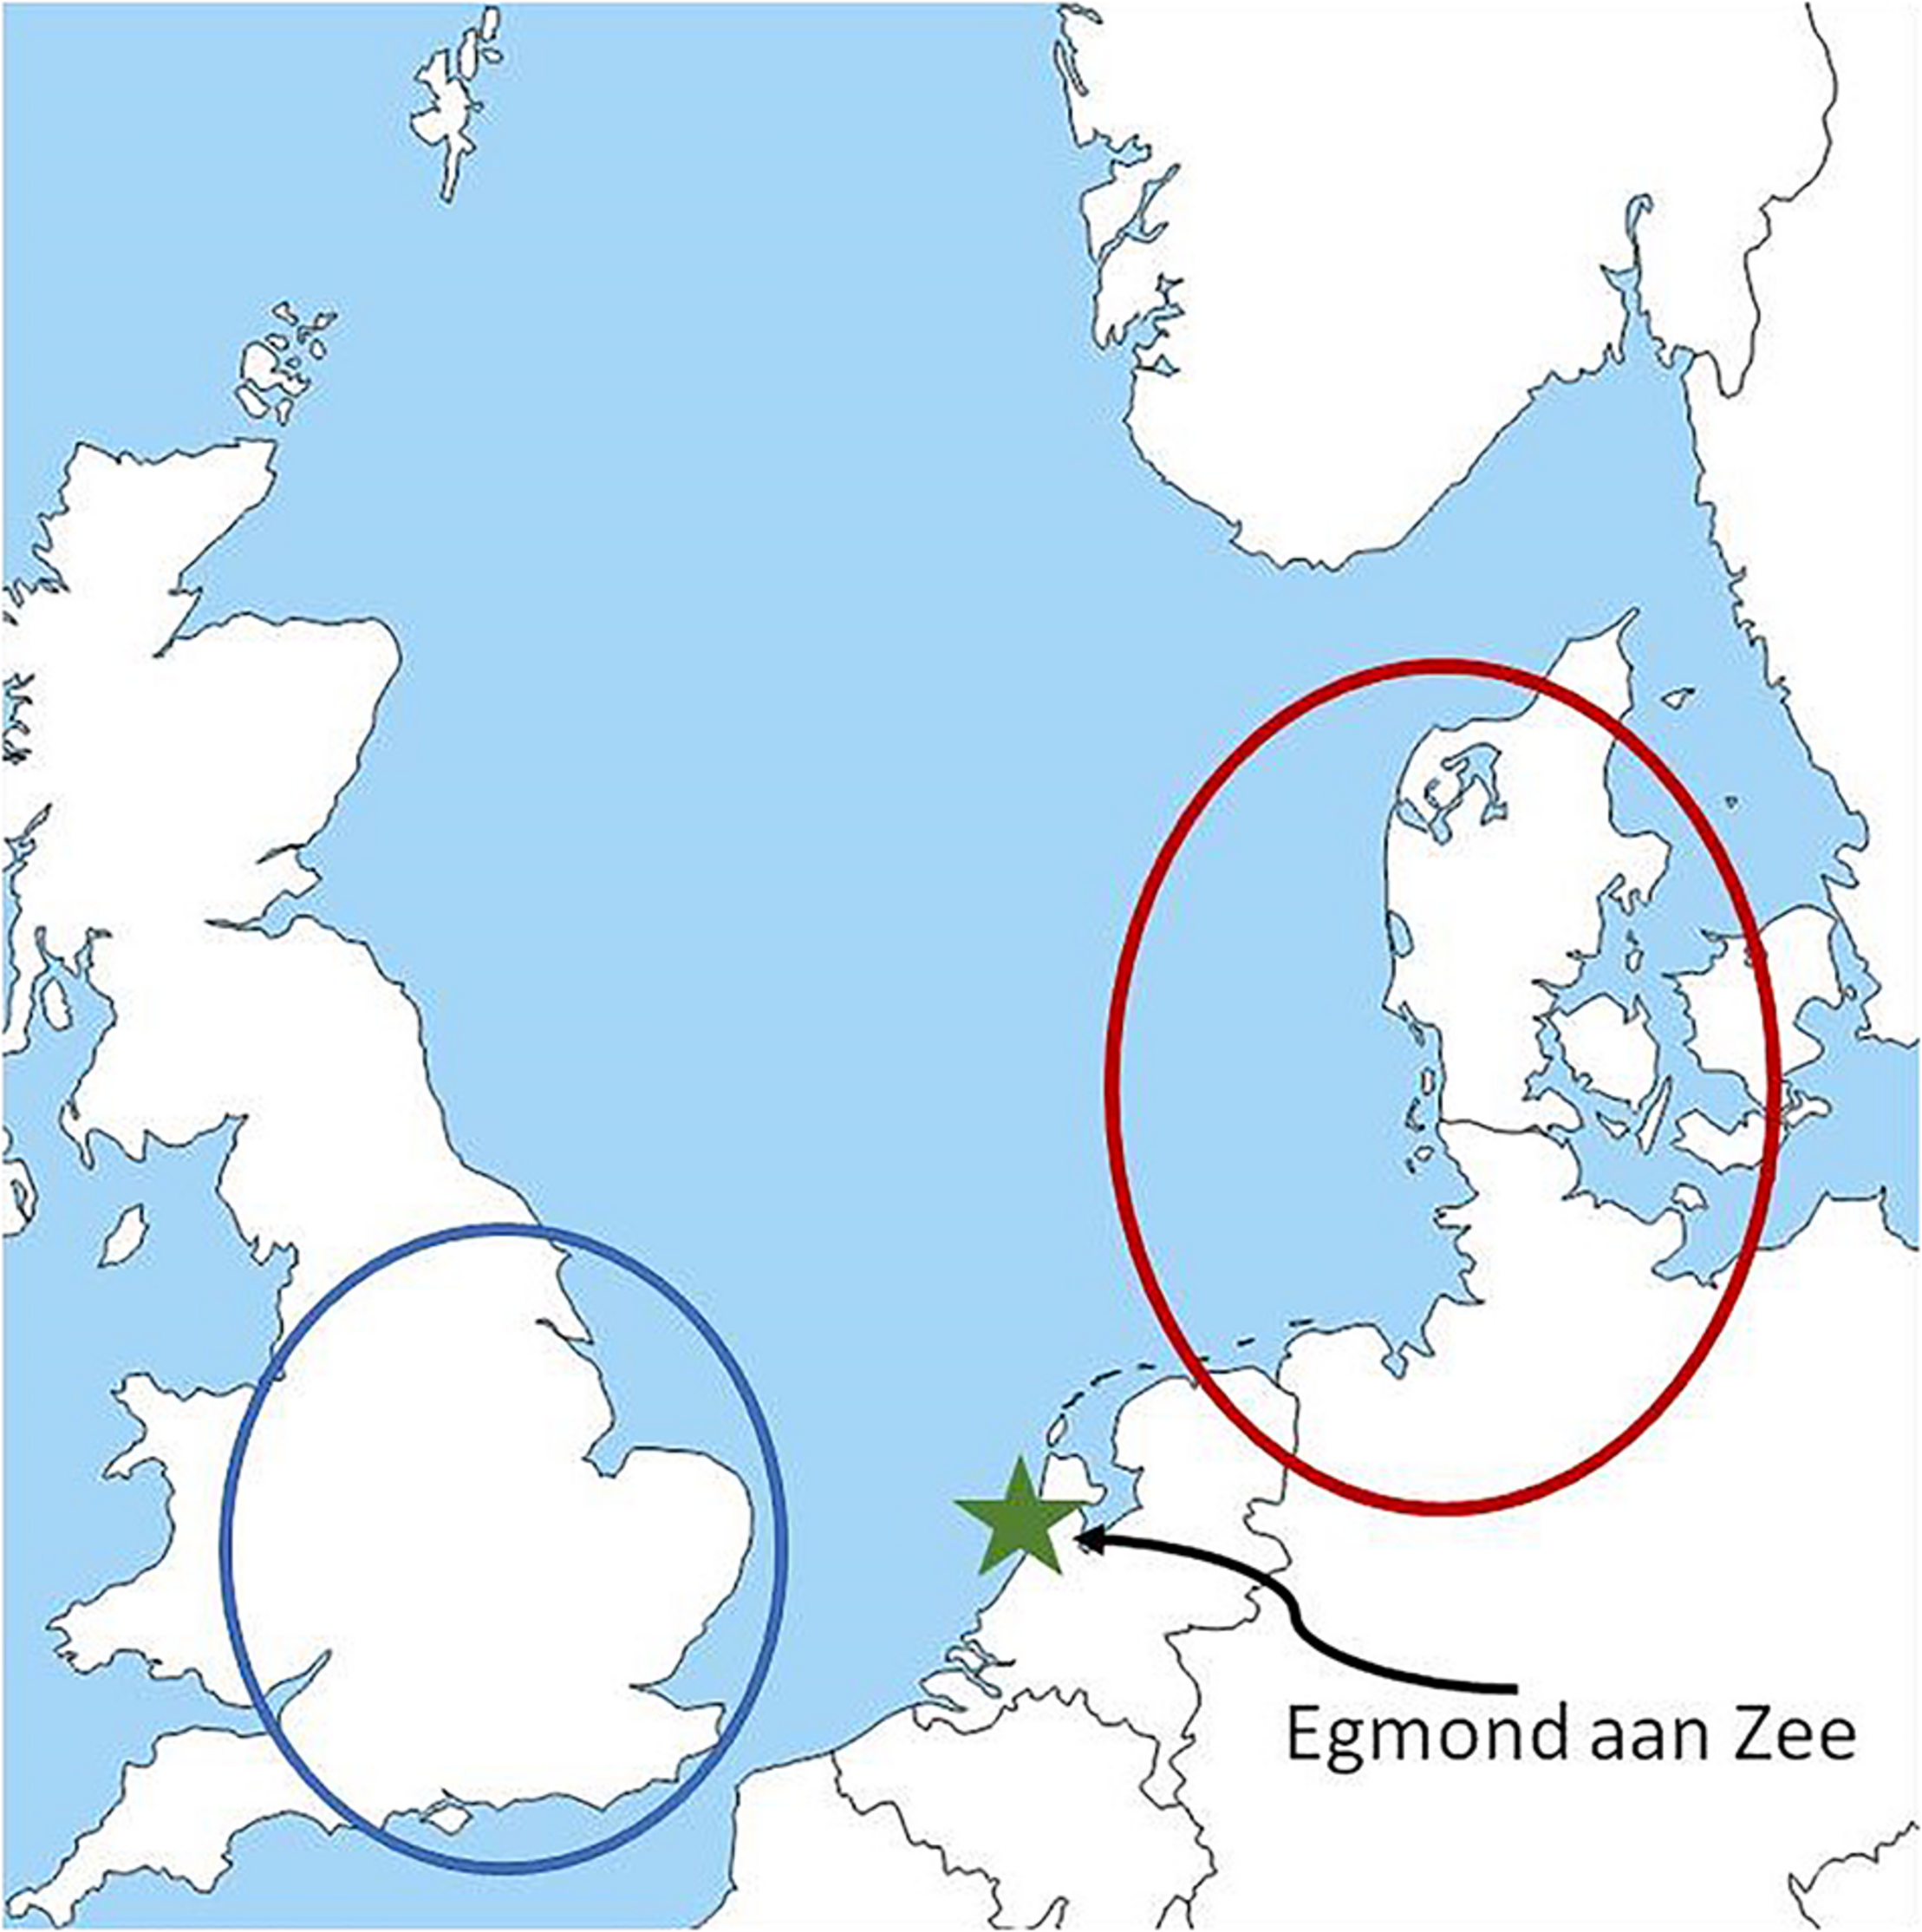
The map of study area around the North Sea. The star indicates the position of Egmond aan Zee wind farm, where the radar is located. The blue circle indicates the most probable departure area of the migrants on nights of high migration intensity in spring. The red circle indicates the most probable departure area of the migrants on nights of high migration intensity in autumn outside of the Netherlands according to Bradarić et al. (2020).
Data and Methods
Radar Observations of Migration
We utilize data collected for previous projects (Krijgsveld et al., 2005, 2011; Fijn et al., 2015), recorded by a Merlin radar system (DeTect Inc., Panama City, FL, United States) which was mounted on a meteorological mast of the Egmond aan Zee Offshore Wind Farm (OWEZ) (N 52.60, E 4.38) located 18 km off the Dutch NW coast (location shown in Figure 1). The radar system consisted of two marine surveillance radars that allow detection of individual bird echoes. A vertical X-band Furuno radar scanned the area along a NW-SE direction at speed of 25 rpm and detected biological objects within a detection range of ∼1.4 km from the radar (vertical extent). A horizontal S-band Furuno radar with a detection range of 5.5 km scanned an area of 360° around the radar at a speed of 22 rpm. The detection of targets by the radar system depends on their size, distance from the radar and orientation relative to the radar beam. Measurements showed that effective detection of the Merlin system varied between 900 and 1.4 km for the vertical radar and between 900 m and 4.5 km for the horizontal radar, depending on the previously mentioned factors. Small birds were successfully detected up to an altitude of 900 m.
We utilized radar data collected from June 2007 until May 2010. The radar was operational 90% of the time, except for short breaks caused by technical failure, weather conditions that could have caused mechanical damage of the radar (wind speed >14 m/s) or disrupt detection of targets (rain) and maintenance. The vertical radar recorded numbers of targets that were crossing the radar beam and their altitudes. The horizontal radar collected information about ground speeds and track directions of the targets. Extensive field measurements of the radar performance (Krijgsveld et al., 2005) which included visual identification of targets and their flagging in the database allowed for detailed post processing of the data. Filters based on echo characteristics of targets such as speed, direction and size were developed (Krijgsveld et al., 2011). These filters were used to exclude echoes originating from waves, rain, insects and other types of interference (e.g., boats). For more information about data quality, filtering procedures and the quantification of fluxes see Krijgsveld et al. (2011) and Fijn et al. (2015).
Using track directions and ground speeds recorded by the horizontal radar and hourly u and v components of 925 hPa wind from the ERA5 data described below, airspeeds (speed of a bird in still air) and headings (direction of a bird in still air) at the radar location were calculated using vector summation (Shamoun-Baranes et al., 2007). Wind was analyzed at 925 hPa, since the radar used in this study recorded mainly birds flying below 1000 m of altitude (Fijn et al., 2015), and represents the altitude layer where migration intensity is highest in this region (Kemp et al., 2013). The wind data was linearly interpolated to the start time of tracks as recorded by the radar.
Selection of High and Low Migration Intensity Nights
In this study, the spring migration season was defined as 15 February–31 May and autumn migration season was defined as 1 August–30 November. For each night beginning around sunset and ending at sunrise the next day (18:00–06:00 UTC), we calculated the total number of tracks recorded by the vertical radar as a measure of migration intensity per night. We ranked nocturnal migration intensity in descending order and selected the nights exceeding the 90th percentile separately for spring and autumn, resulting in 24 spring and 22 autumn nights. If successive nights among them exceeded the 90th percentile threshold, then only the maximum night was included in this analysis, in order to avoid the analysis of dependent synoptic weather conditions, resulting in the final nine autumn and eight spring nights (called hereafter high migration nights). The 90th percentile was selected for statistical reasons, as with this threshold at least one case per year is selected and thus all years are represented in the analysis. Nights with very low migration intensity that occurred just before or just after the selected high migration nights were also selected, and called thereafter low migration nights. In total, eight nights with low migration were selected in autumn and seven in spring and occurred from 1 to 7 days before or after the high migration nights. The low migration nights on average had migration intensities that were 95% lower than the associated high migration nights. Nights in which the radar was not operational, were excluded from any selection. The selection of the nights with low migration intensity was made in order to investigate whether inhibiting weather precedes a high migration pulse, or pauses it (the nights after the high migration pulse). However, migration intensities might also be low in nights of favoring weather conditions, as the flying migrants also need to feed and rest, or simply because after nights of high migration intensity there are not many birds left in the source area (Gauthreaux et al., 2005).
All analysis of directional data was done using the R package circular (Agostinelli and Lund, 2017; R Core Team, 2018). Circular mean and ± angular deviation (AD) of track direction, heading and wind direction at the radar location were calculated per night. Furthermore, the mean resultant vector length r was estimated for each of the parameters to assess the dispersion of directional data around the mean (values closer to 1 indicate less dispersion). Finally, Rayleigh test was performed to test for non-uniformity of directional data (alternative hypothesis is unimodal distribution). Density distributions (Figures 2, 3) of all directional data are kernel densities derived using density circular function.
FIGURE 2
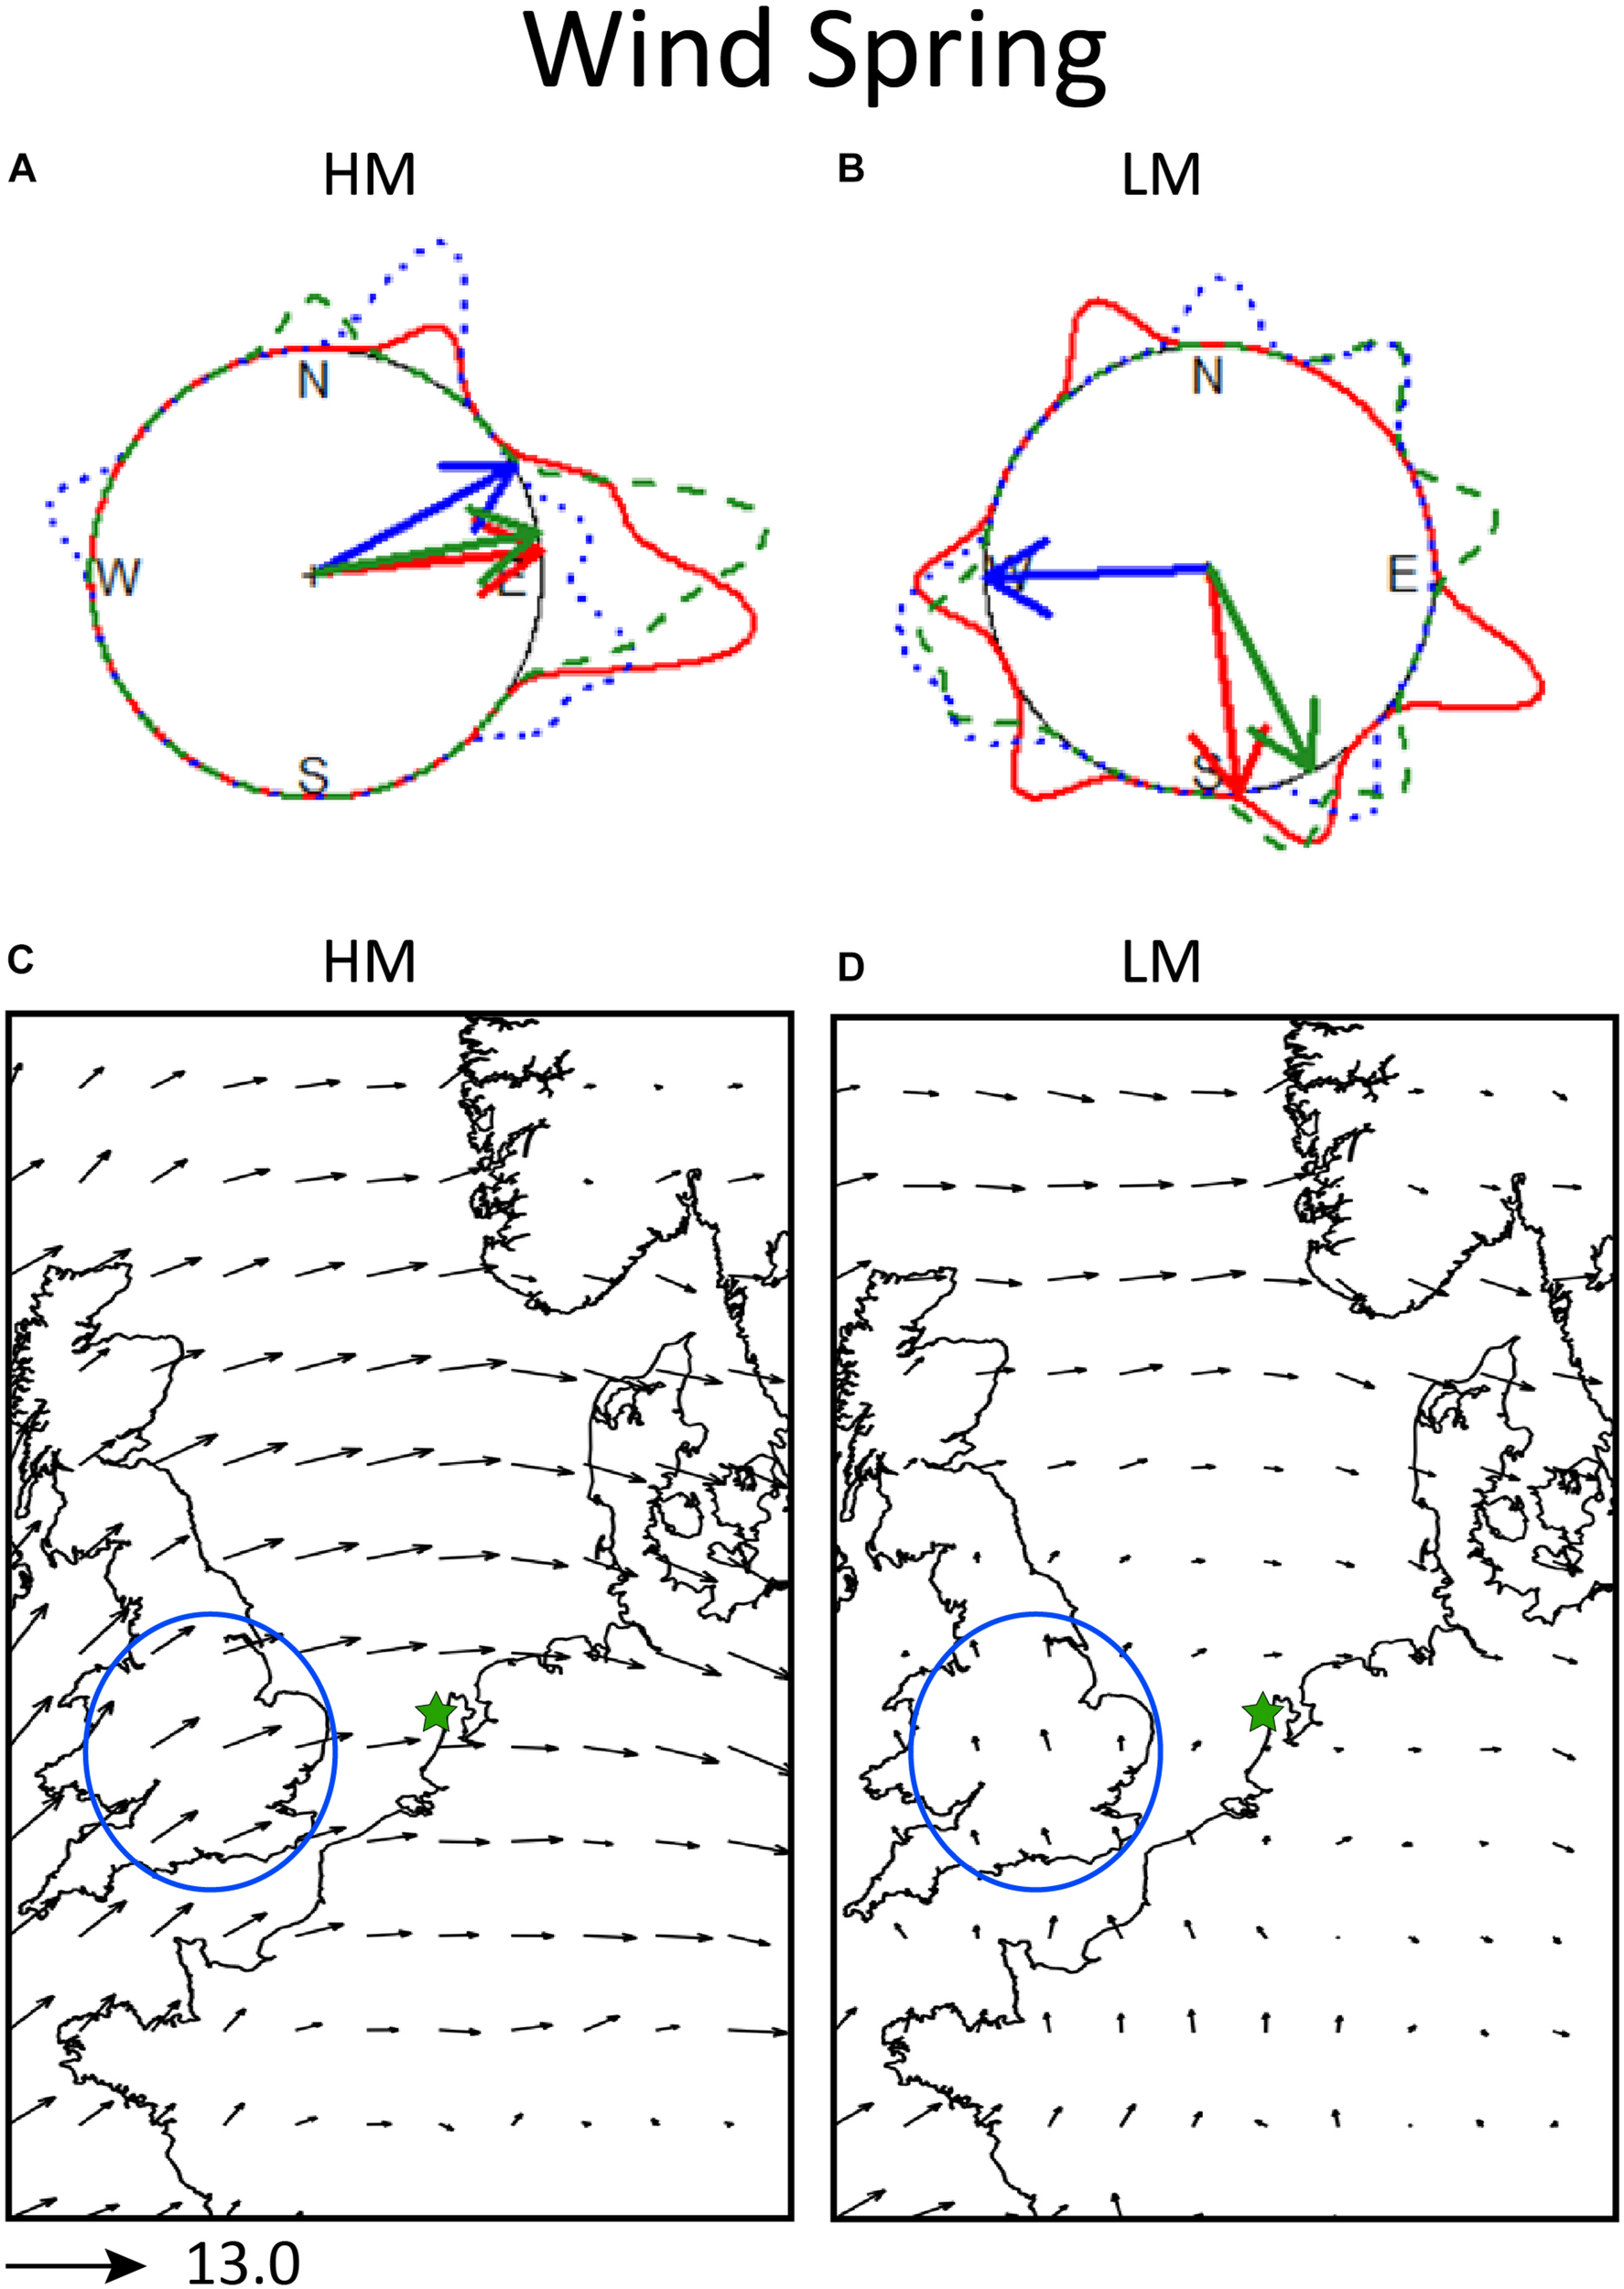
Local and synoptic 925 hPa winds in spring. Top panel: Inside each circle, the mean heading of the birds (red arrows), mean 925 hPa wind direction at the radar location (blue arrows), and mean track direction of the birds (green arrows). Around the circle, the circular density distributions of bird heading (solid line), wind direction (dotted line), and track direction (dashed line), in panel (A) for nights of high migration intensity (HM) and in panel (B) for nights of low migration intensity (LM). Bottom panel: synoptic 925 hPa wind conditions in spring, in panel (C) for nights of high migration intensity (HM) and in panel (D) for nights of low migration intensity (LM). The length of the arrows is proportional to the strength of the averaged wind. As a reference the length of the arrow of 13 m/s wind strength is given under the panels. The circled area designates the most probable area of departure for the detected flying migrants during those nights. The star designates the location of the radar.
FIGURE 3
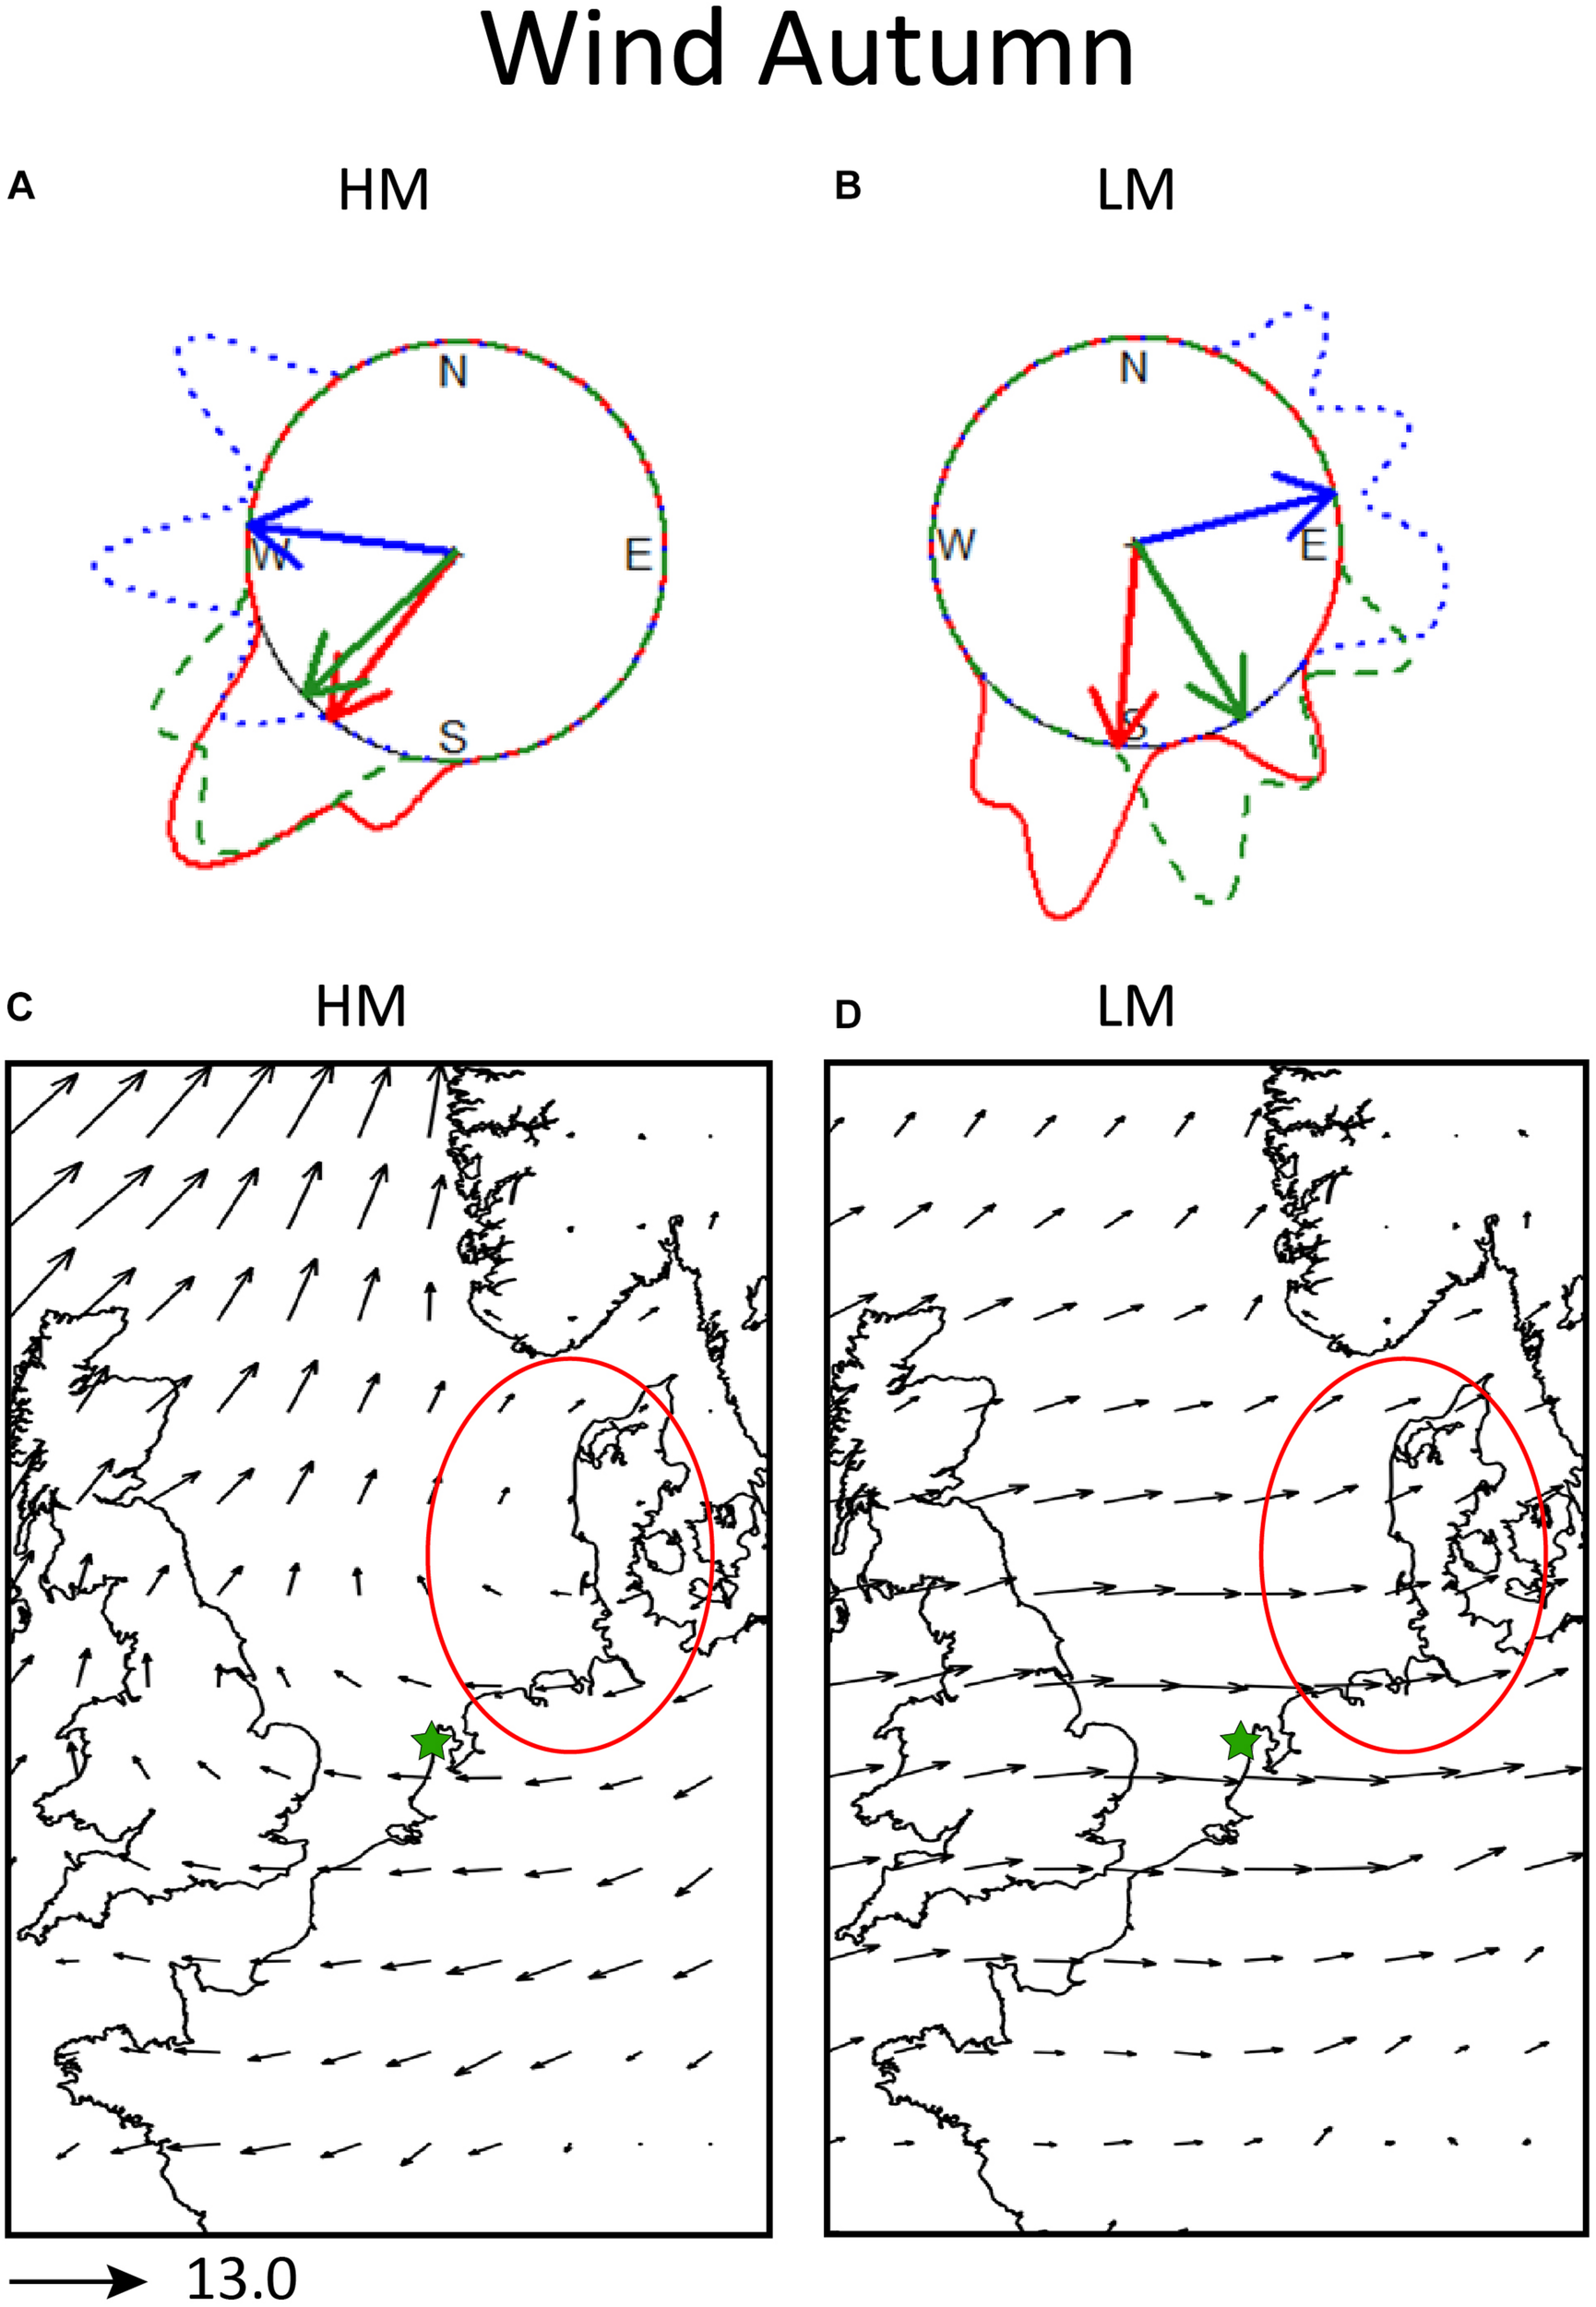
Local and synoptic 925 hPa winds in autumn. Top panel: Inside each circle, the mean heading of the birds (red arrows), mean 925 hPa wind direction at the radar location (blue arrows) and mean track direction of the birds (green arrows). Around the circle, the circular density distributions of bird heading (solid line), wind direction (dotted line) and track direction (dashed line), in panel (A) for nights of high migration intensity (HM) and in panel (B) for nights of low migration intensity (LM). Bottom panel: synoptic 925 hPa wind conditions in autumn, in panel (C) for nights of high migration intensity (HM) and in panel (D) for nights of low migration intensity (LM). The length of the arrows is proportional to the strength of the averaged wind. As a reference the length of the arrow of 13 m/s wind strength is given under the panels. The circled area designates the most probable area of departure for the detected flying migrants during those nights. The star designates the location of the radar.
Meteorological Data and Analysis
We used the recently released ERA5 reanalysis product from the European Centre for Medium-Range Weather Forecasts (ECMWF) (Hersbach and Dee, 2016) with hourly temporal and 30 km spatial resolution. The analyzed ERA5 variables were 925 hPa wind, MLSP, precipitation, geopotential height at 500 hPa (the height where the ridges and troughs are usually detected in the middle troposphere), relative humidity, cloudiness and 2 m temperature for three springs and three autumns for the years 2007–2010. As we are focusing on factors influencing nocturnal migration we calculated nightly means from 18:00 UTC of the day of interest until the next morning at 06:00 UTC. The nightly precipitation data is the total precipitation from 18:00 to 06:00 UTC. The local Dutch time is UTC+1 in winter and UTC+2 in summer. The weather variables were extracted from the spatial range of 35N–70N and 16W–19E. This entire region is plotted for the MSLP (Figures 4, 5) to allow a clear overview of the passing synoptic scale pressure systems. The rest of the analyzed variables have more local character and are therefore plotted over the North Sea and the continental regions around it (Figures 2, 3, 6, 7). Finally, the surface pressure and frontal systems are shown over a broader region as they are extracted from the KNMI data center (Figures 8, 9).
FIGURE 4
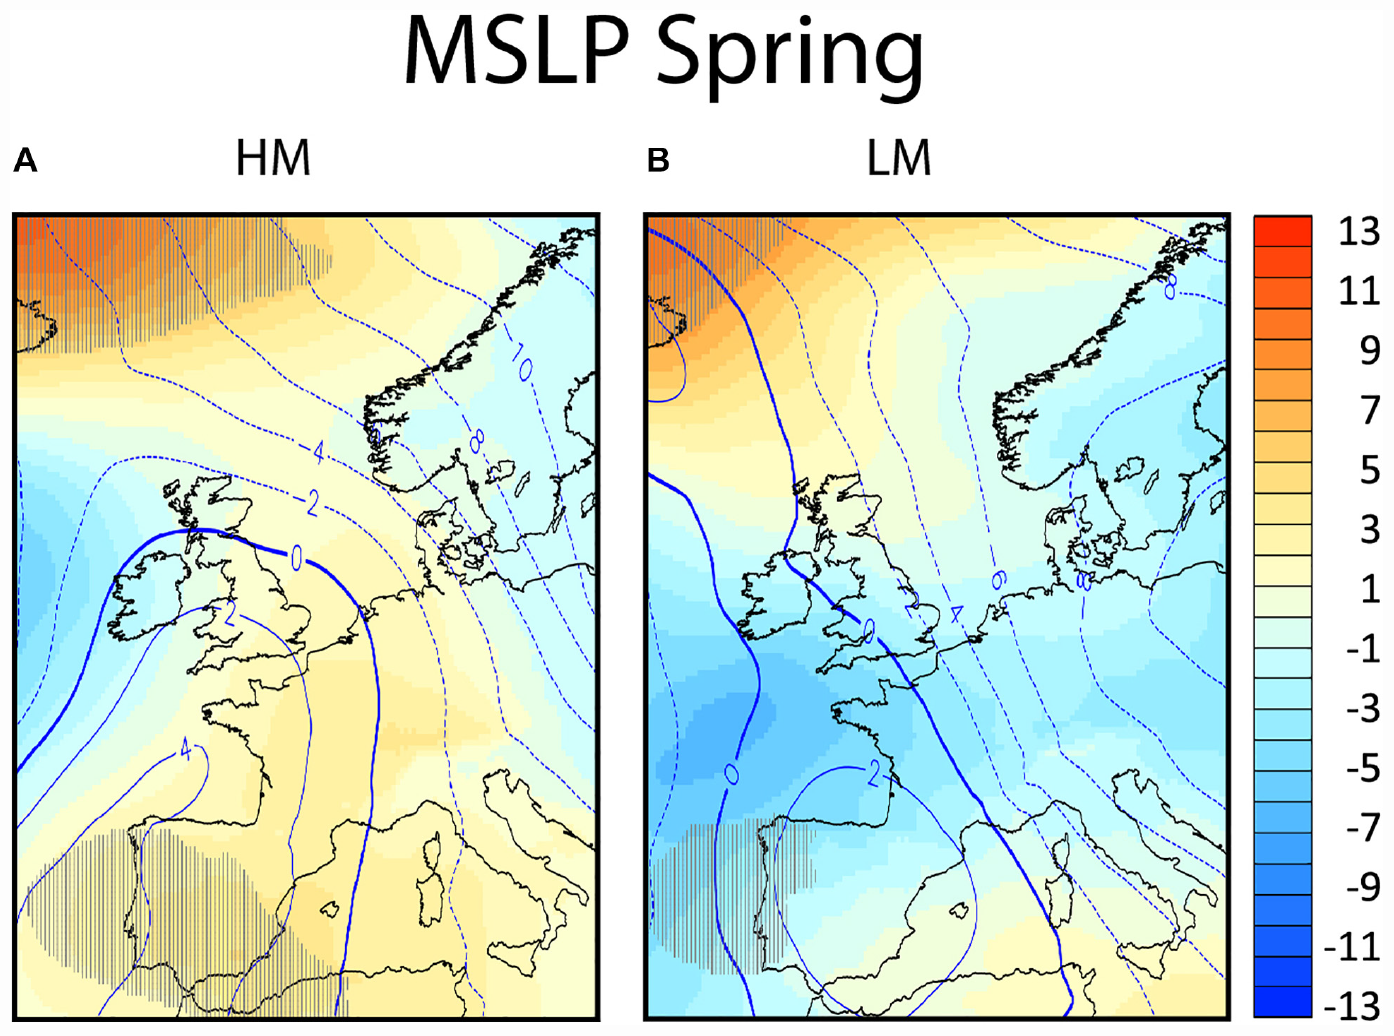
The composites of the anomalies from climatology for spring migration for the mean sea level pressure (MLS P in hPa, in colors) and for the 500 hPa geopotential height (in decameters, in contours) in panel (A) for nights of high migration intensity (HM) and in panel (B) for nights of low migration intensity (LM). Areas exceeding the 95% confidence level as concluded by the Welch’s t-test are hatched.
FIGURE 5
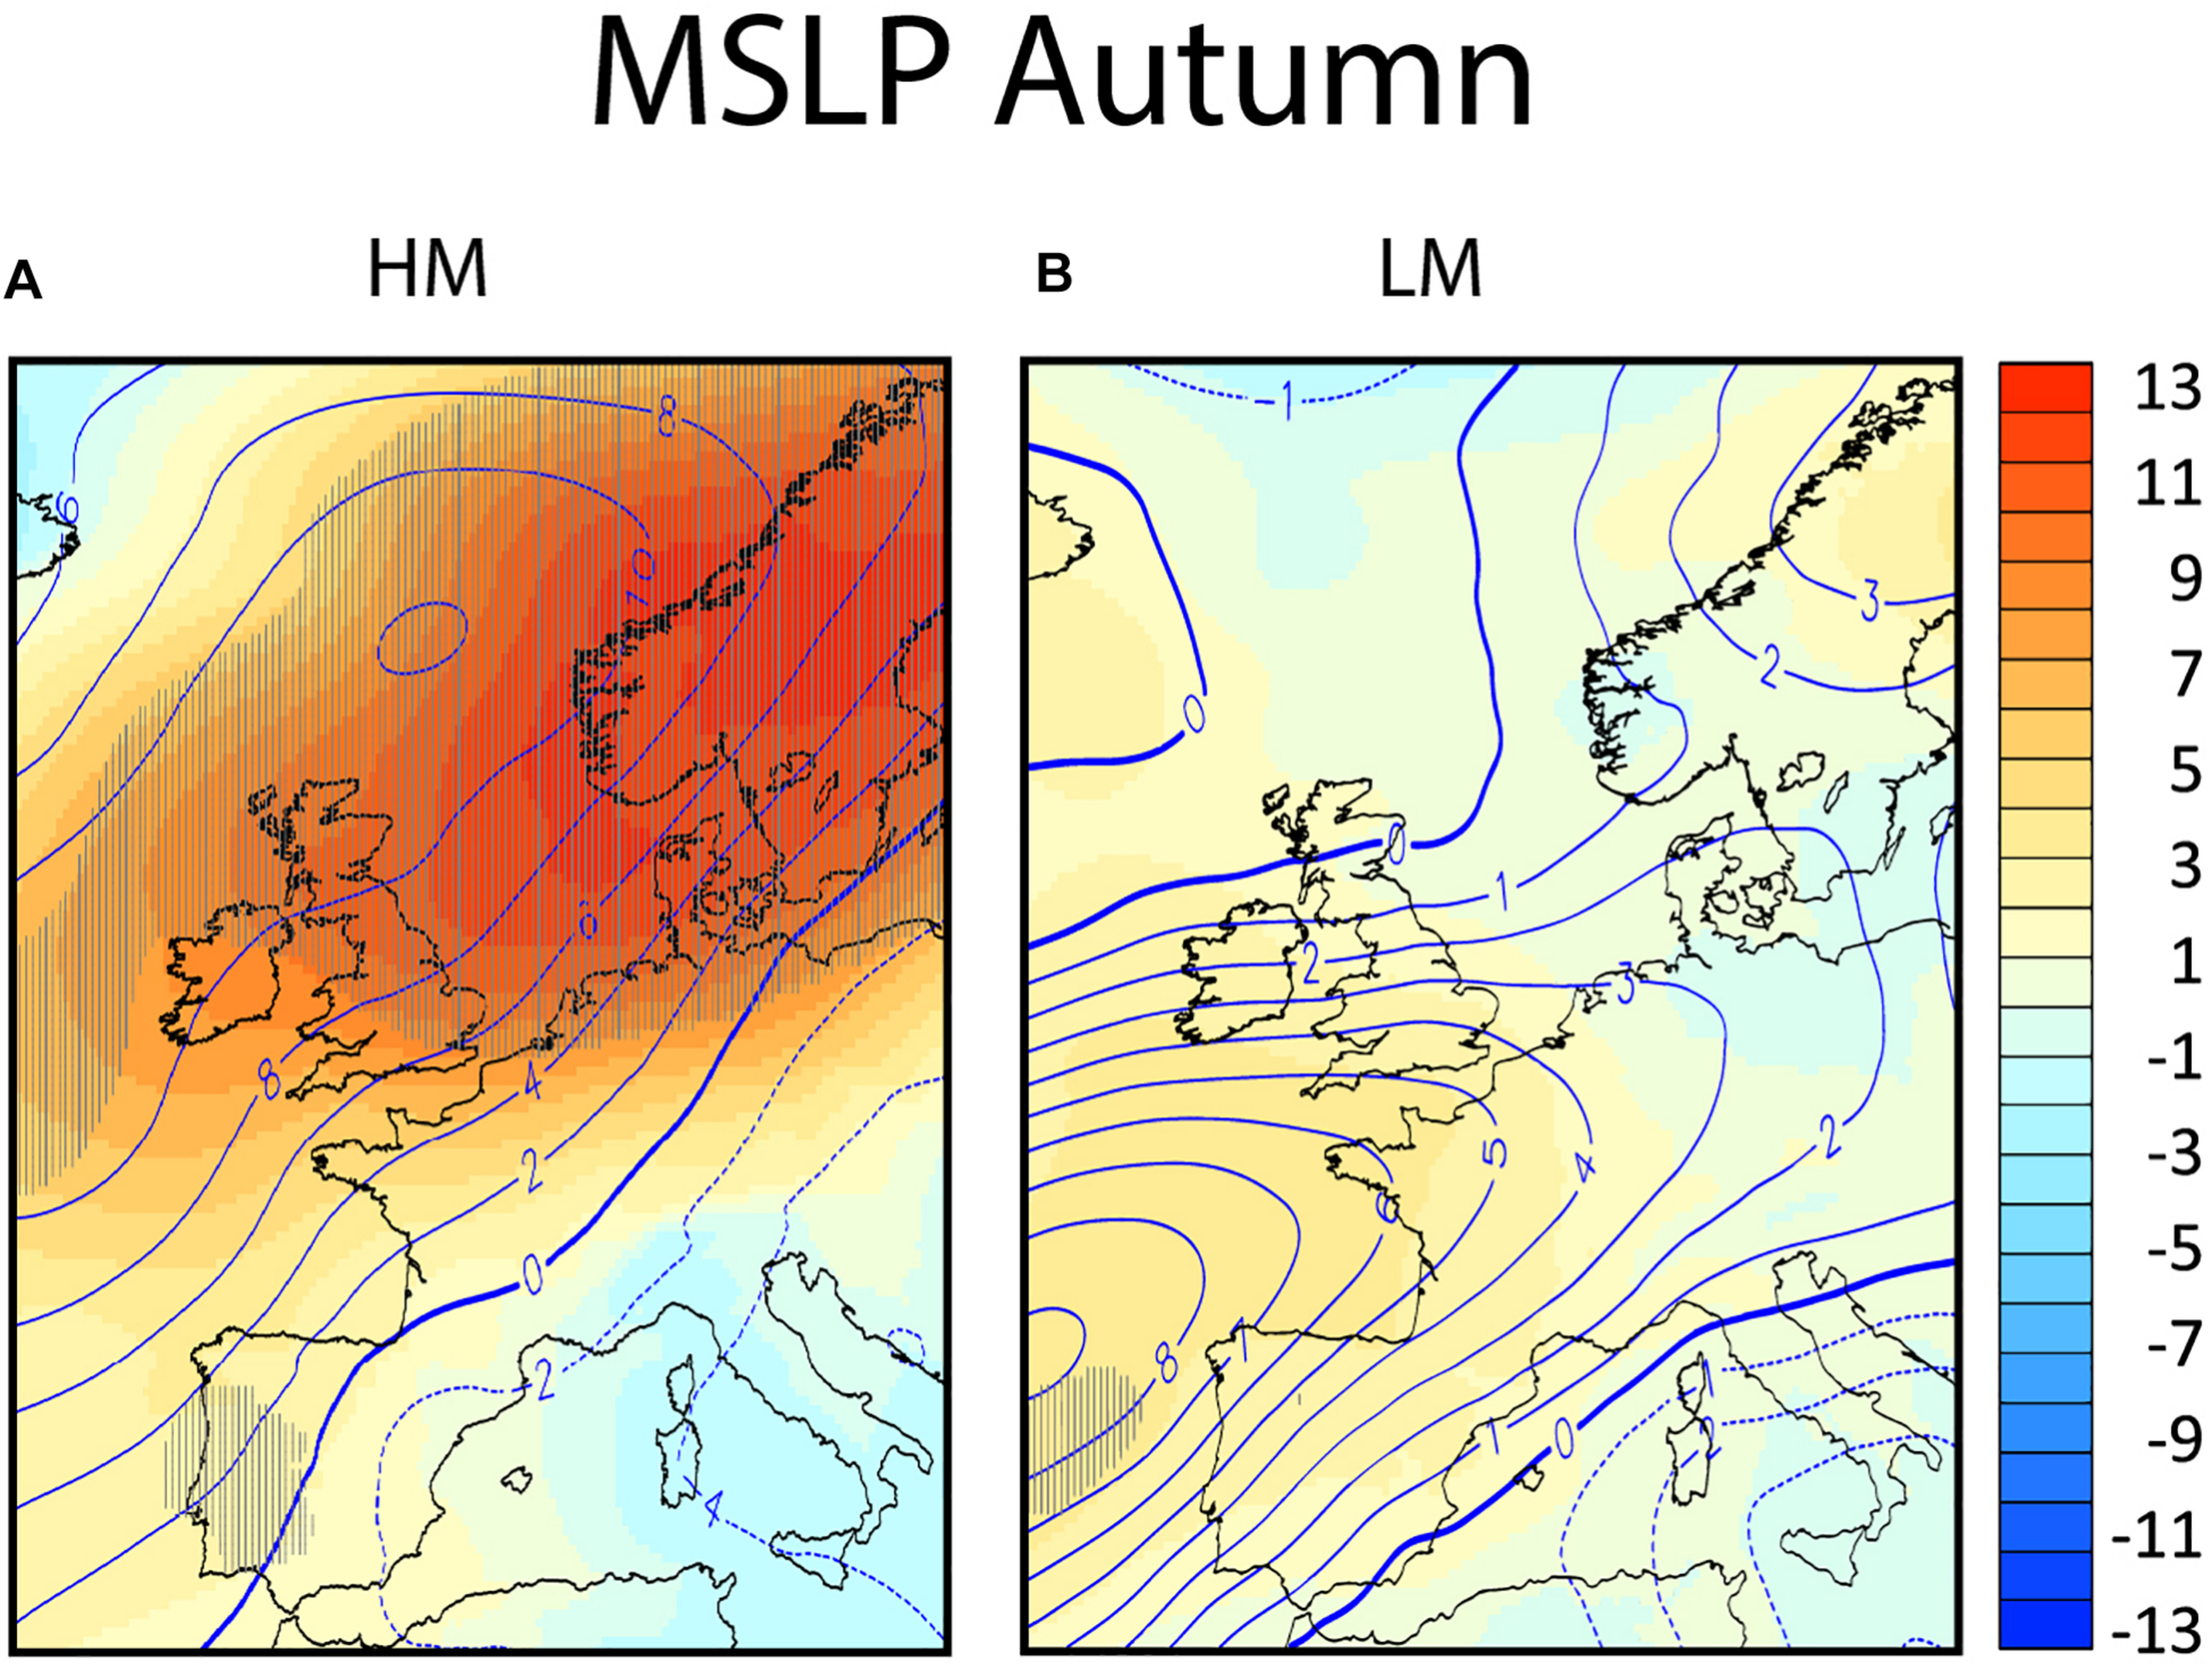
The composites of the anomalies from climatology in autumn for the mean sea level pressure (in hPa, in colors) and for the 500 hPa geopotential height (in decameters, in contours) in panel (A) for nights of high migration intensity (HM) and in panel (B) for nights of low migration intensity (LM). Areas exceeding the 95% confidence level are hatched.
FIGURE 6
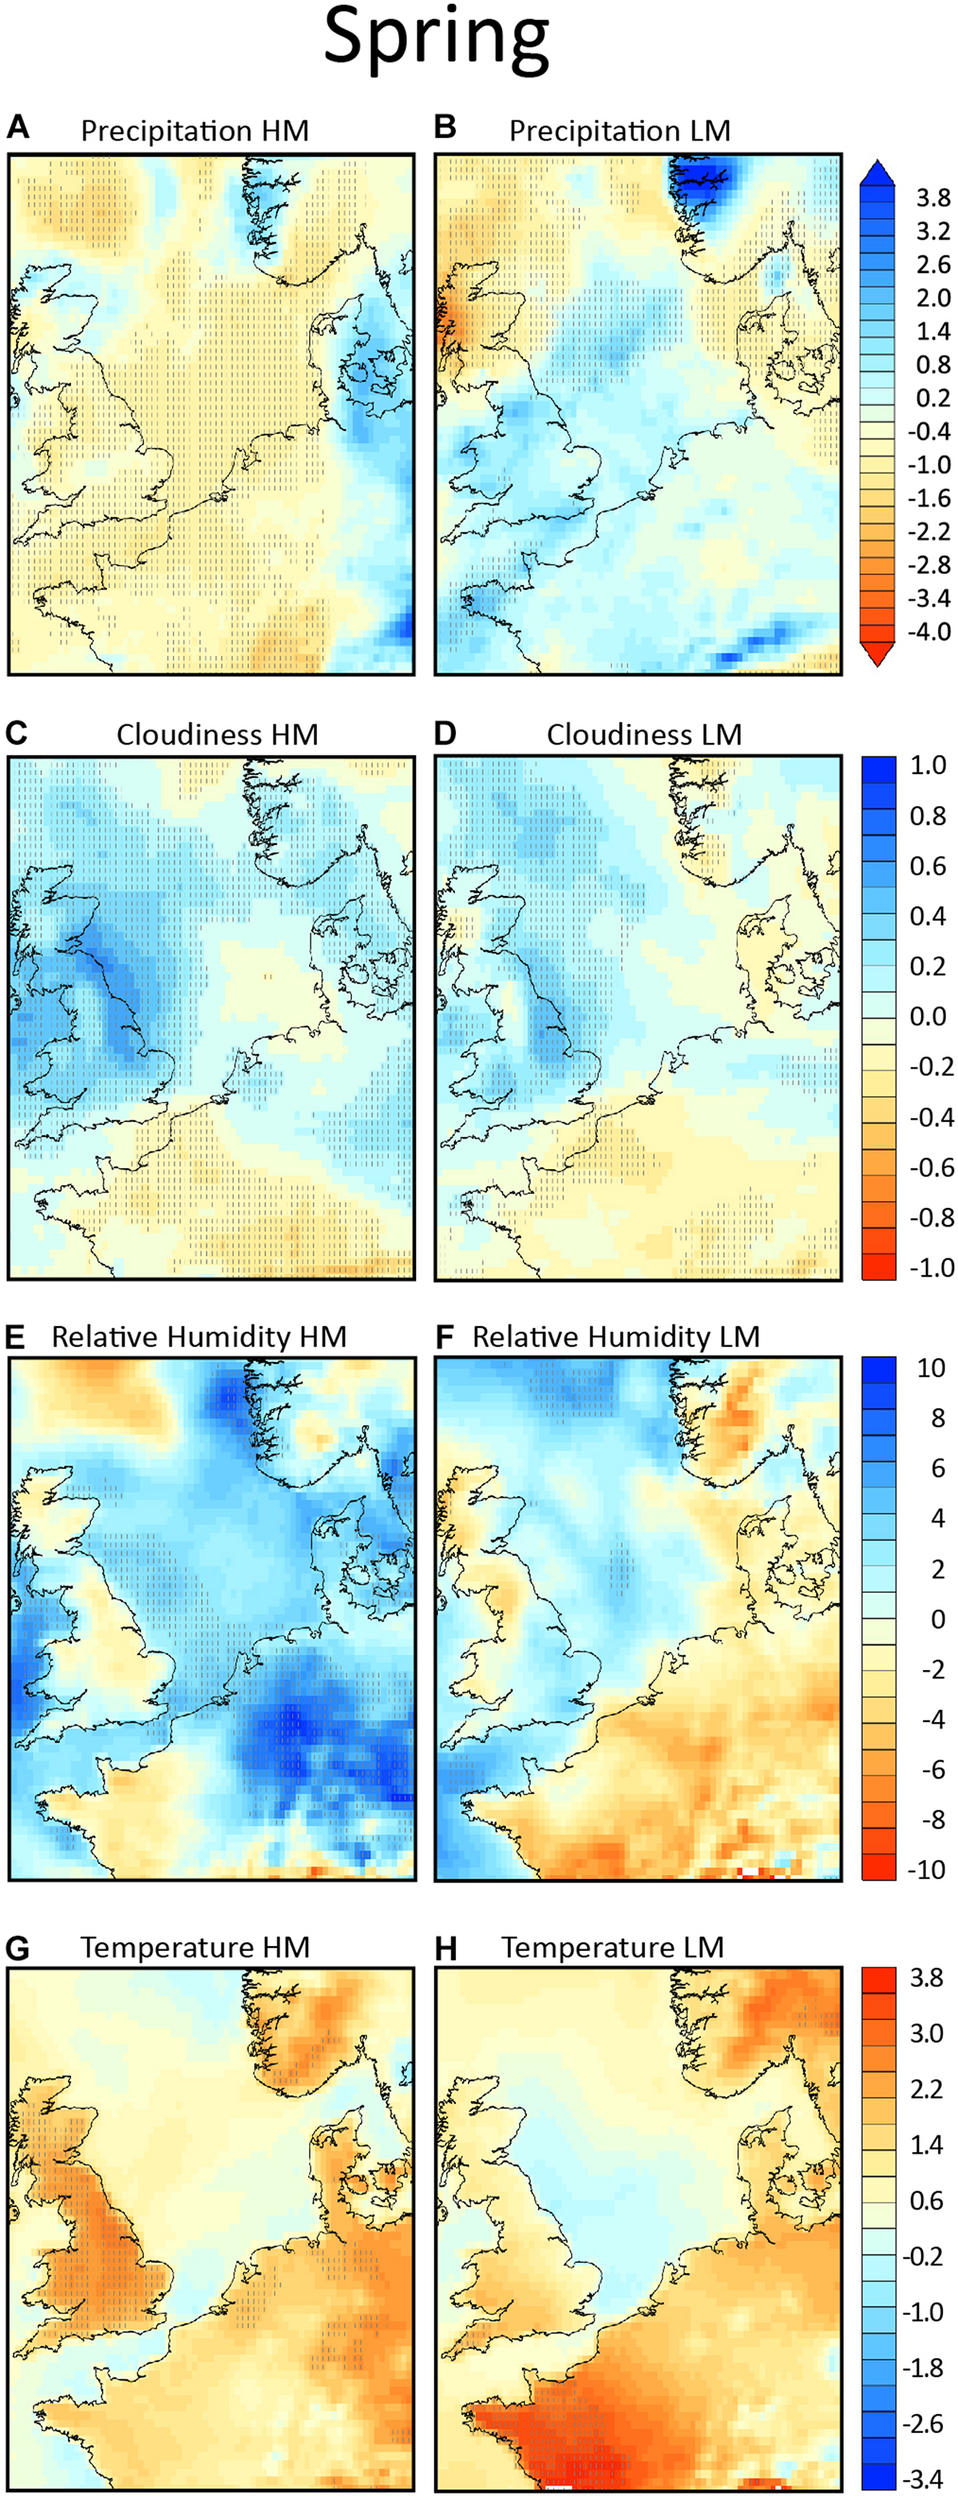
Composites of anomalies from climatology in spring, in the left column for the high migration nights (HM) and in the right column for the low migration nights (LM). In panels (A,B) the total precipitation (in mm) is shown, in panels (C,D) the total cloud cover (units from –1 to +1), in panels (E,F) the relative humidity (in %) and in panels (G,H) the 2 m temperature field (in °K). Areas exceeding the 95% confidence level are hatched.
FIGURE 7
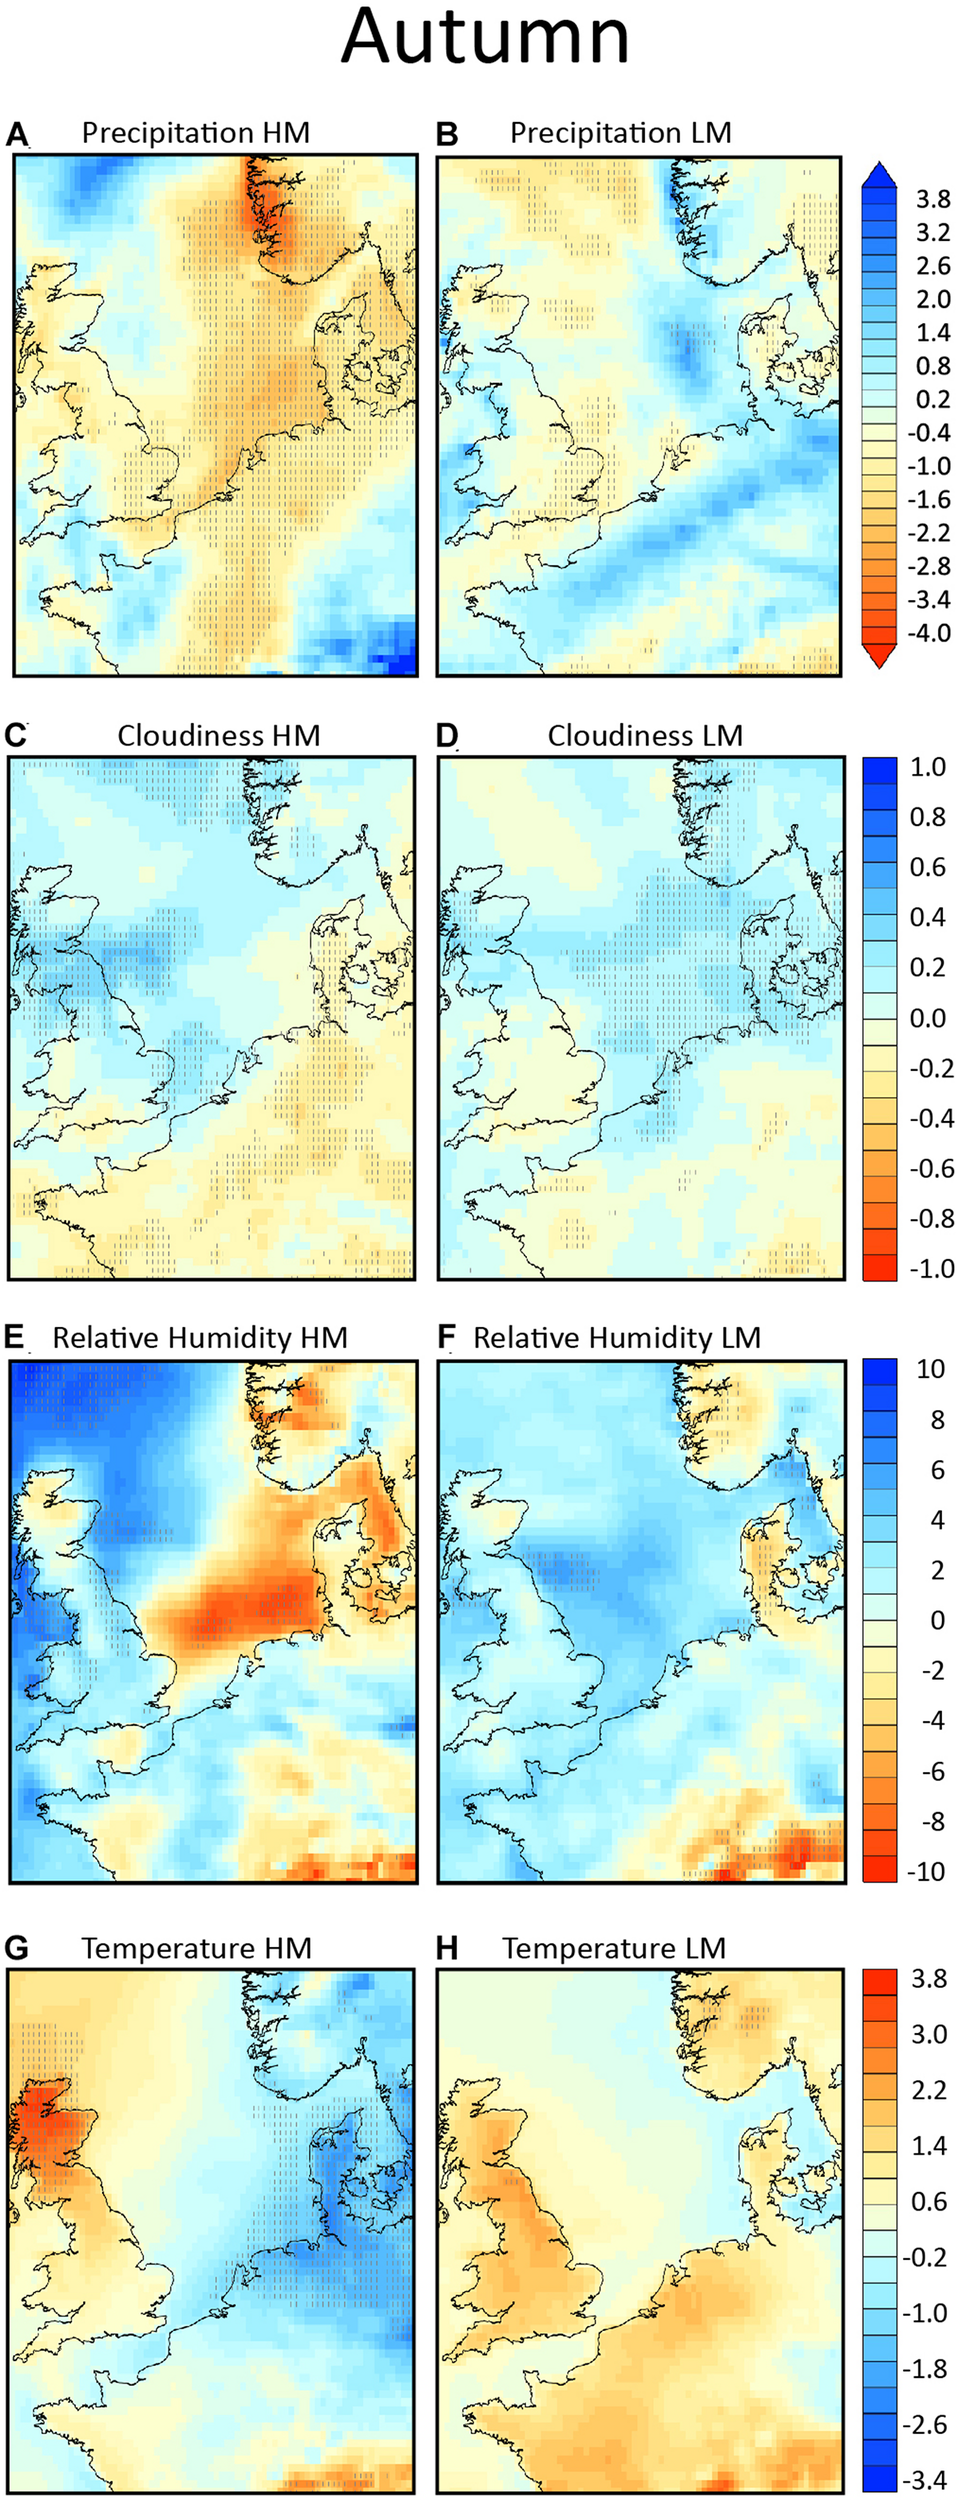
Composites of anomalies from climatology in autumn, in the left column for the high migration nights (HM) and in the right column for the low migration nights (LM). In panels (A,B) the total precipitation (in mm) is shown, in panels (C,D) the total cloud cover (units from –1 to +1), in panels (E,F) the relative humidity (in %) and in panels (G,H) the 2 m temperature field (in °K). Areas exceeding the 95% confidence level are hatched.
FIGURE 8
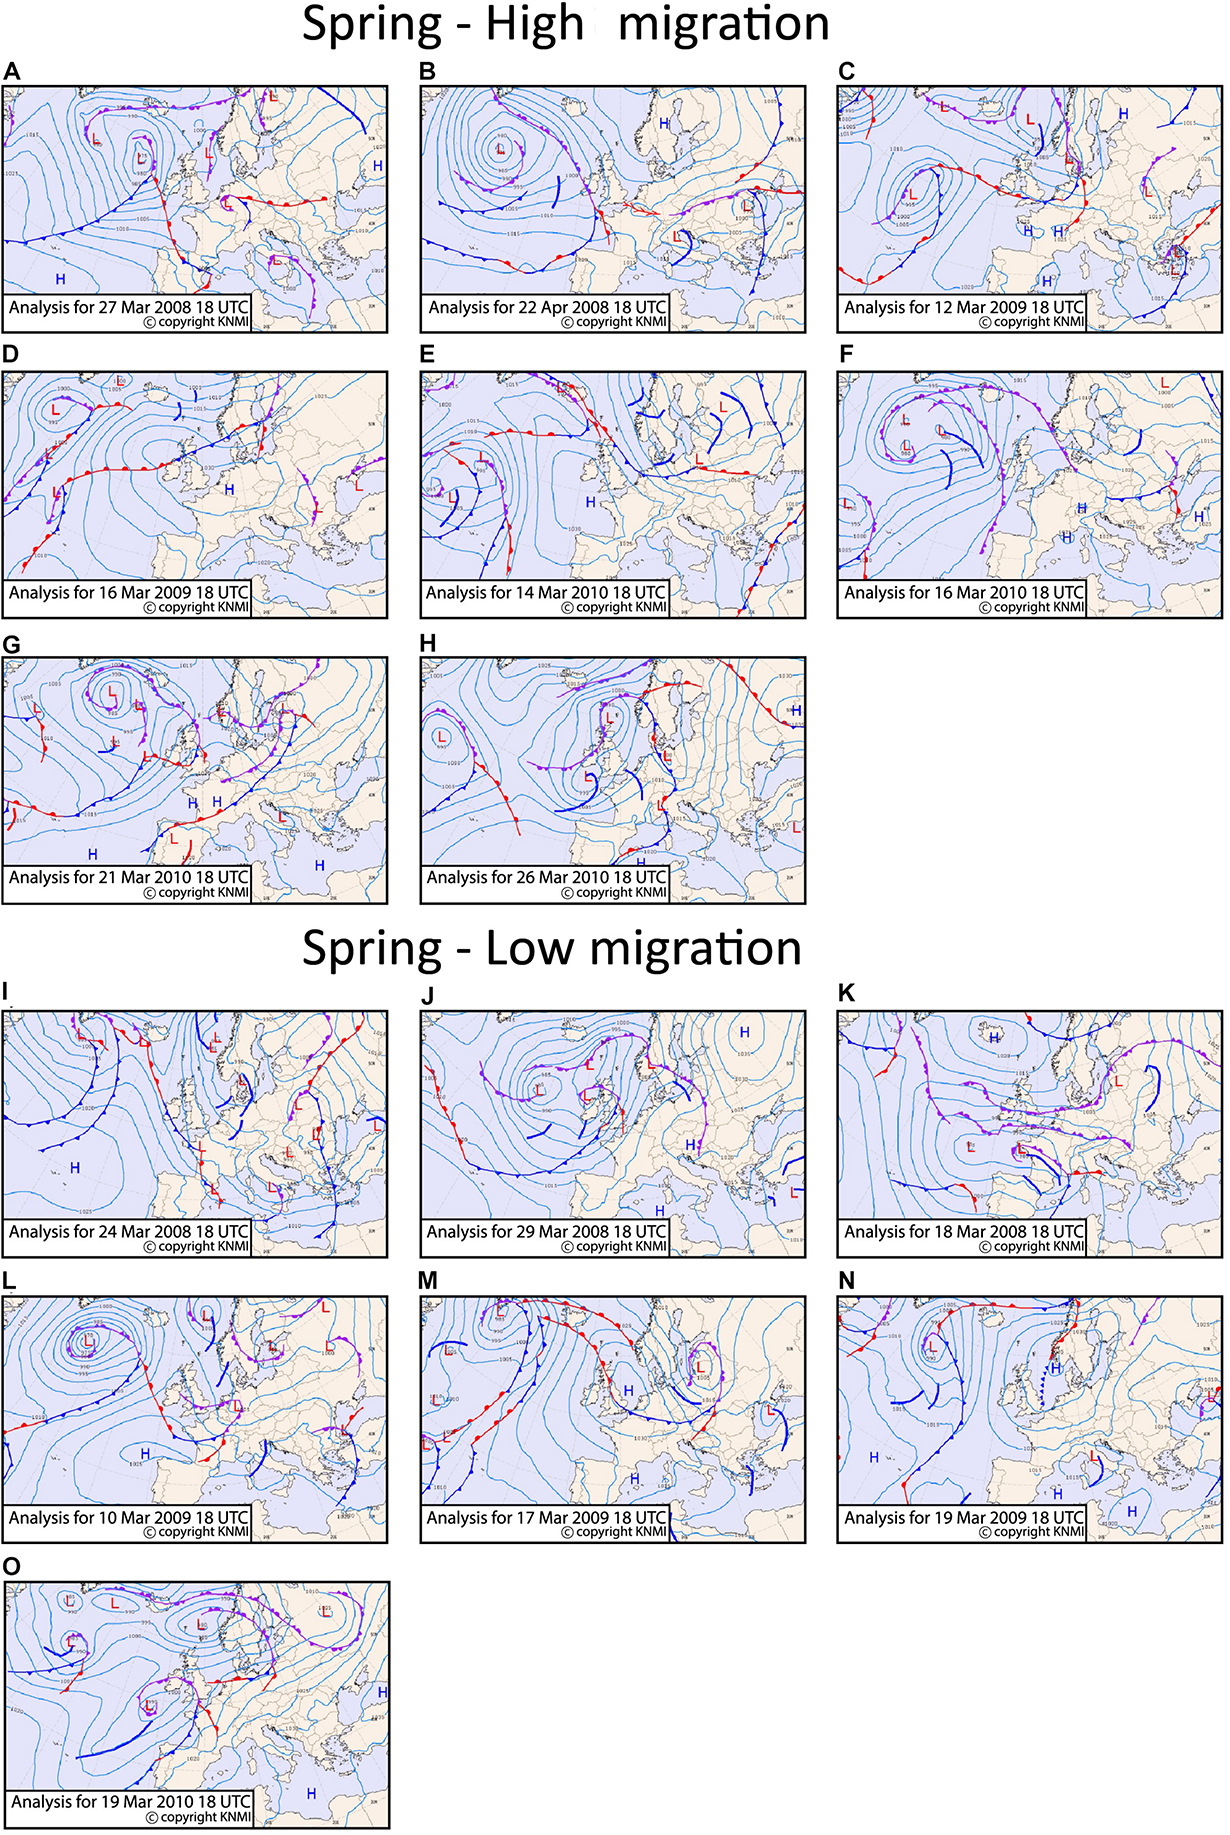
Surface pressure and frontal systems for the high migration nights (A–H) and the low migration nights (I–O) for spring at 18:00 UTC. The figures are extracted from KNMI data center. The position of the core of a low pressure system is indicated with an “L” and of a high pressure system with an “H.” The cold fronts are indicated as lines in blue color, the warm fronts in red color and the occluded fronts in purple color. The side where the symbols are drawn on the front lines indicate the direction of the front’s movement. The thick blue lines indicate troughs.
FIGURE 9
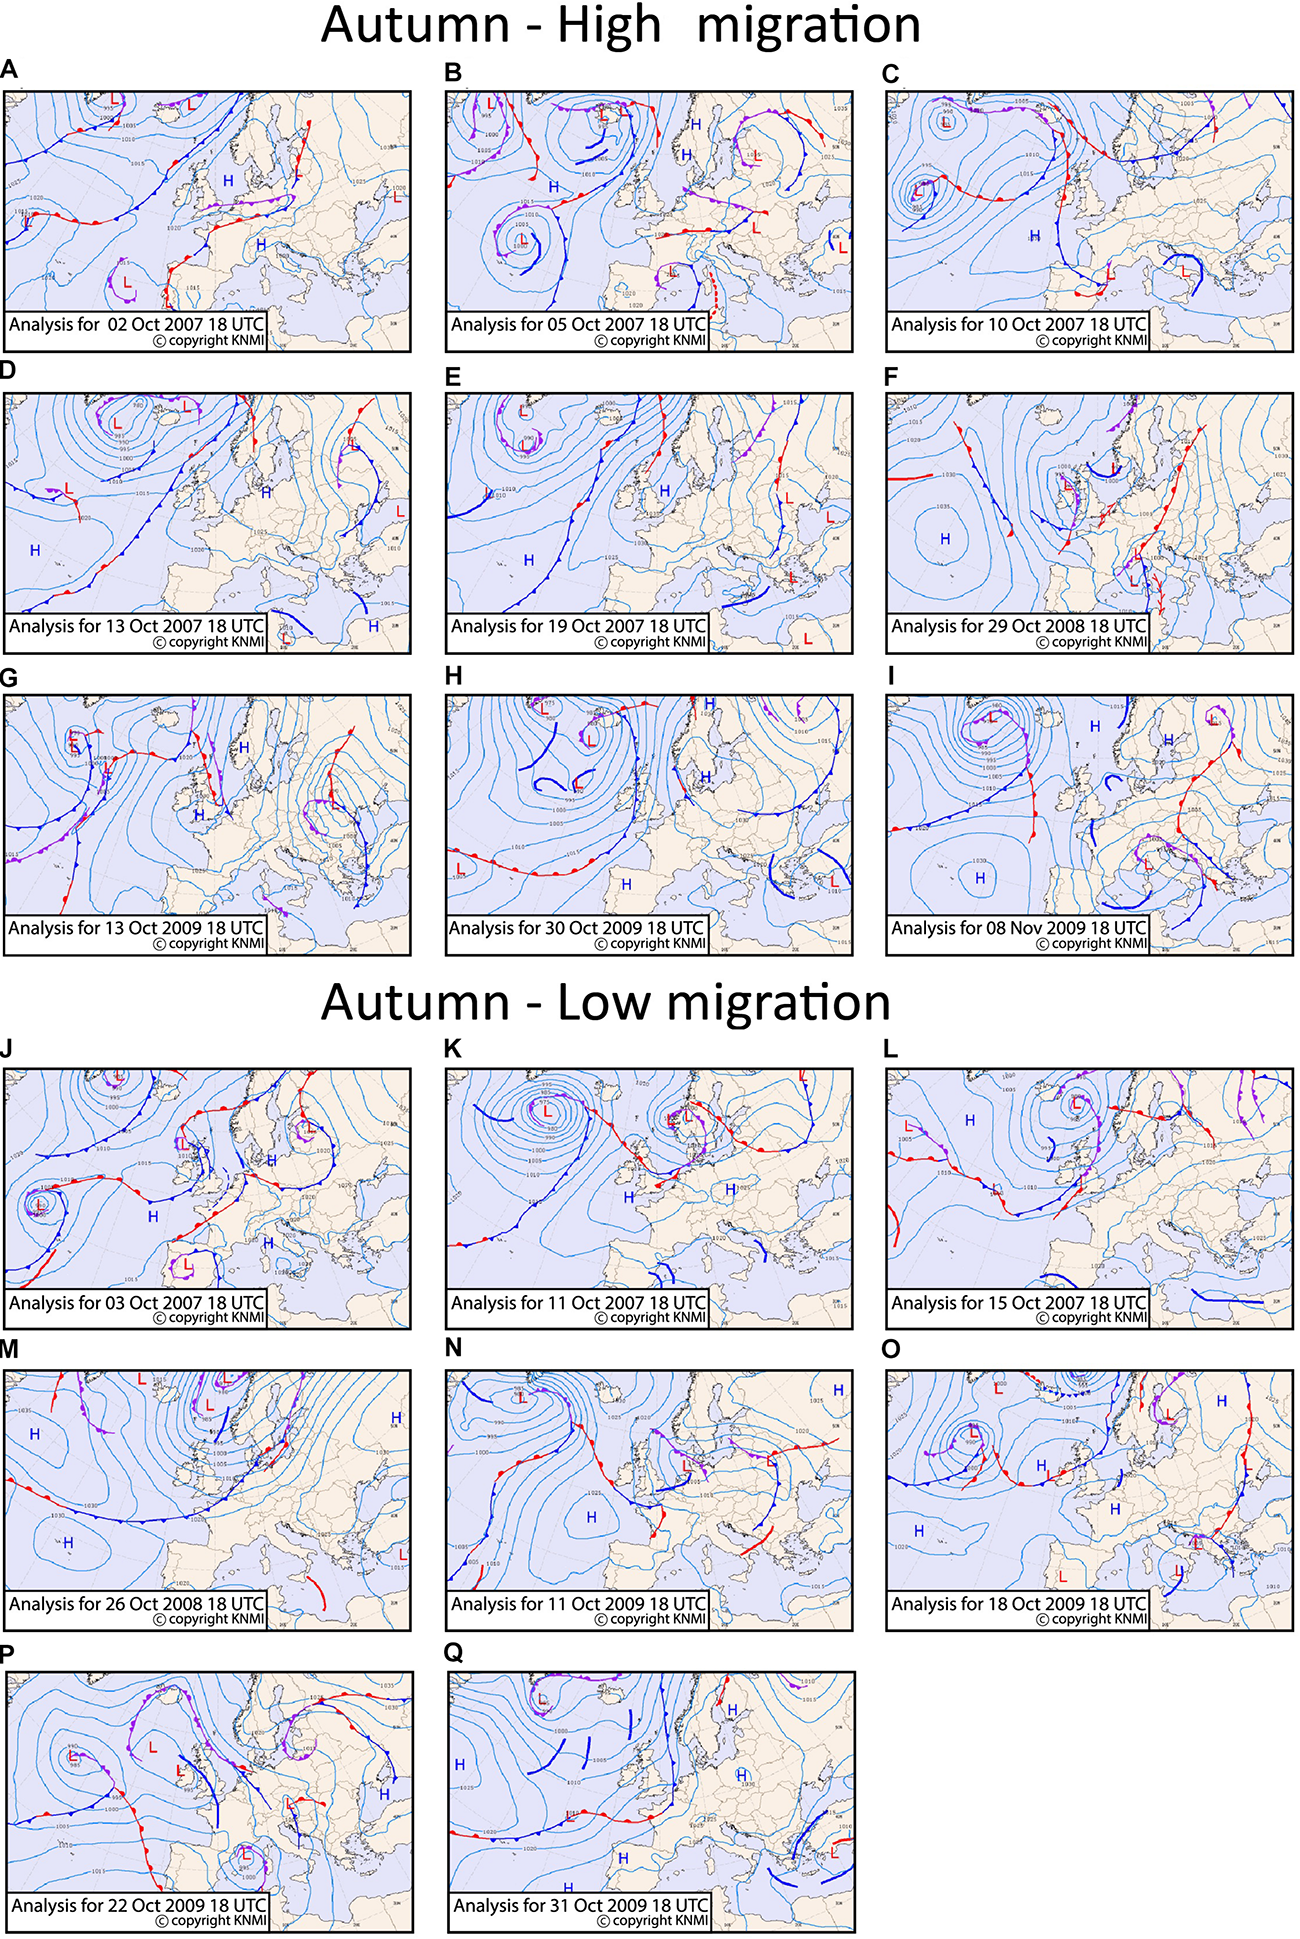
Surface pressure and frontal systems for the high migration nights (A–I) and the low migration nights (J–Q) for autumn at 18:00 UTC. The figures are extracted from KNMI data center. The position of the core of a low pressure system is indicated with an “L” and of a high pressure system with an “H.” The cold fronts are indicated as lines in blue color, the warm fronts in red color and the occluded fronts in purple color. The side where the symbols are drawn on the front lines indicate the direction of the front’s movement. The thick blue lines indicate troughs.
The monthly climatology per grid point for spring and autumn migration was calculated as the monthly means from 18:00 to 06:00 UTC for the years 1989–2018. The emphasis of the current work is given on the relation between the synoptic weather conditions and bird migration. In order to understand the biological relevance of the synoptic wind directions though, the local wind directions at the radar site are first assessed and discussed in the context of bird headings and track directions measured by the radar. Afterward, the synoptic wind conditions are explored in conjunction with the bird headings and track directions on days of high and low migration. The synoptic wind conditions are computed by the intensities of the zonal and meridional wind vectors and the composites are the averages of the nightly means. In order to calculate the anomalies from climatology for MSLP, precipitation, geopotential height, relative humidity, cloud cover and temperature, the monthly climatology was subtracted from the selected nightly mean for each variable of interest. Then the spatio-temporal composite of the anomalies was calculated as the mean for the selected high and low migration nights, respectively. Additionally, the day-by-day surface pressure and frontal systems maps that are shown and discussed in the following sections are extracted from the Royal Netherlands Meteorological Institute (KNMI) and are taken at 18:00 of each day.
To assess whether the anomalies were statistically different from climatology, we applied the Welch’s t-test for unequal variances and unequal sample sizes (Ahad and Yahaya, 2014). The test computes the mean and variance of the nightly values of the high (or low) migration nights and compares those to the nightly values of all 30 years of climatology, for the selected migration month, for each grid cell separately in the synoptic maps. If the p-value of each grid cell is below a selected threshold, then the null hypothesis can be rejected and the value in that grid cell is assumed significantly different from climatology. The selected threshold in this work was the 95% confidence level (p-value ≤ 0.05).
For the analysis of the meteorological data in this study we used CDO, Ferret and Python data visualization and analysis tools.
Regional Climatic Conditions
Here we provide a very brief overview of the climatic conditions in the region to issue the appropriate context for interpreting anomalies in synoptic conditions in relation to bird migration. In Spring climatologically dry and stable conditions dominate the southern United Kingdom and the southern North Sea as the passage of synoptic systems and frontal activity that is responsible for most of the large scale precipitation is less frequent and the sea is still too cold to induce local convection as it approaches the land (Manola et al., 2019). Most high pressure systems come from the Azores via the United Kingdom to Iceland or Scandinavia. With calm weather the levels of relative humidity and low cloudiness depend strongly on the atmospheric temperature. The sea surface temperature is at its lowest point of the year. In periods with south- or southwesterly winds, the relatively warm air condenses from the cold sea with fog and low clouds as a result.
In autumn and winter, storm tracks with low pressure and frontal systems are most active over the United Kingdom, the North Sea and Scandinavia/Denmark and the Low countries (Woth et al., 2006). The prevailing winds are westerlies and southwesterlies, the atmospheric conditions are very variable and the frequent passing of the frontal systems often bring a lot of rain.
Results
Spring
Surface Winds and Bird Tracks
On nights of high migration intensity in spring, the average winds are southwesterly (61.47° ± 53.8°, r = 0.55, p = 0.08) and the track direction (79.75° ± 28°, r = 0.87, p < 0.001) and bird headings (84.47° ± 22.3°, r = 0.92, p < 0.001) point toward east and are significantly concentrated around the mean (Figure 2A). Considering the suggested departure locations and migratory axes in the North Sea basin, winds on high migration nights support migration from southern United Kingdom toward Netherlands as well as from the southern Europe toward Scandinavia on nights with intense migration activity. However, on nights with low migration intensity the winds are on average easterlies, but not signficant due to high variability in wind direction (267.67° ± 70°, r = 0.25, p = 0.7). The track directions (153.43° ± 68°, r = 0.26, p = 0.6) and bird headings (173° ± 68°, r = 0.25, p = 0.7) are also highly variable and on average point toward south (Figure 2B). The high variability of wind on low migration nights can also be seen in the synoptic winds map in Figure 2D, as the averaging of the different wind directions results in low intensity winds of rather unclear directions.
Pressure Systems and Fronts
In spring the MSLP composite of the high migration nights is characterized by an extended ridge of high pressure from Spain into Central Europe (Figure 4A), bringing overall dry conditions over most parts of Western and Central Europe, the North Sea and southern United Kingdom. The anomalies do not differ significantly from regional climatology, indicating that the climatic conditions for this region are supportive of migration over the North Sea in the study region. Along the western flank of this ridge, over the North Sea and southeastern United Kingdom the winds have a southerly or southwesterly component (Figure 2C). It should be noted that at the mid-latitudes the winds blow approximately parallel to the isobars, having the low pressure to their left in the Northern hemisphere. The surface pressure and frontal systems for all high and low migration days are shown in Figure 8. When the surface pressure, that on average creates the favoring wind conditions seen in Figure 2C, is studied individually for each of the high migration nights we observe several different patterns: (1) high pressure observed over the southern United Kingdom and the Dutch coast on three nights (see pressure isobars in Figures 8B,D,F), (2) the study site at sea is positioned between low and high pressure systems on three nights (see isobars and the location of the core of the high and low pressure systems indicated with H or L, respectively (Figures 8C,E,G,H) and (3) a low pressure system observed over the North Sea on one night (Figure 8A). The individual high migration nights are characterized by the general absence of frontal systems over the coast of Netherlands, apart from the 14th of March 2010 when a long but weak and dry cold front passed over the North Sea (Figure 8E).
On the other hand, the composite of the low migration nights shows a non-significant low surface pressure anomaly over the southern North Sea, that leaves the coast of Netherlands close to the climatological average surface pressure (Figure 4B). The anomalies over sea and potential departure areas do not differ significantly from regional climatology. Among the low migration nights, the Dutch coast is positioned during three nights over low pressure systems (Figures 8I,J,L), during two nights between high and low pressure systems (Figures 8K,O), and during two nights over high pressure systems (Figures 8M,N). During all low migration nights a front (warm, cold or occluded) or a trough passes over the coast of Netherlands or the southern United Kingdom.
Precipitation, Relative Humidity, Cloudiness and Temperature
In high migration nights potential departure locations in the United Kingdom arrival locations on continental Europe, as well as the North Sea are considerably drier compared to the monthly climatological conditions (Figure 6A), and considerably wetter in the low migration nights (Figure 6B). The dry anomalies during the high migration nights are statistically significant over almost the entire area (hatched areas in Figure 6), while the wet anomalies during the low migration nights over the areas of interest are non-significant. When the individual days are examined (not shown) it is observed that during all high migration nights the conditions are dry, while during low migration nights rain occurs in at least one of the areas of interest for each night.
Cloud cover is closely related to precipitation, but can also occur independently. Neutral to negative non-statistically significant anomalies in cloudiness over the Dutch coast, in Figures 6C,D are consistent with the absence of rain during the high migration. Areas of statistically significant increased cloudiness compared to climatology over southern United Kingdom indicates that the birds might also fly into cloudy, but dry skies. The above indicate the partly decoupled behavior between cloudiness and precipitation (as they don’t necessarily co-occur), while they also indicate a secondary role of cloudiness in the bird’s migration decisions.
As precipitation and relative humidity are closely intercorrelated, especially under unstable atmospheric conditions, we examine whether the birds appear to respond to relative humidity as they might use it as an early indicator for rain. Relative humidity over southern United Kingdom does not differ signficantly from the local climatology on high migration nights, but is significantly higher over the coast of Netherlands (Figure 6E). During low migration nights the pattern is reversed, with somewhat higher (non-significant) relative humidity over southern United Kingdom and lower over Netherlands (Figure 6F). Surface temperature is also not signficantly different over the entire continental region of the map during both high and low migration nights (Figures 6G,H).
Autumn
Surface Winds and Bird Tracks
On nights of high migration intensity the prevailing winds at the radar location were easterlies (277.05° ± 26.9°, r = 0.88, p = 0.01), while headings (217.57° ± 11.4°, r = 0.97, p = 0.02) and track directions (227° ± 11.4°, r = 0.97, p < 0.001) were toward southwest. During nights of low migration intensity the winds blew on average from the west (84.47° ± 0.39°, r = 0.92, p < 0.001), while the mean track direction toward southeast (148.48° ± 0.38°, r = 0.92, p = 0.01) and the mean heading (185.27° ± 0.43°, r = 0.9, p = 0.02) toward south. The local wind directions were more concentrated around mean on nights of low migration intensity nights. On nights with high migration the track directions and headings were more concentrated around their mean value, compared to nights with low migration activity.
Overall, the synoptic winds in autumn (Figures 3C,D) were favorable for crossing between Netherlands and United Kingdom on nights of high migration. However, the average track directions and headings suggest that the majority of tracks recorded by the radar were moving more to the SW and indicating birds flying predominantly parallel to the coast rather than crossing directly to the United Kingdom at the radar location.
Pressure Systems and Fronts
Nights of high migration are characterized by an elongated high-pressure anomaly centered over southwest Scandinavia, extending to the British Isles (Figure 5A). The 500 hPa geopotential height (the contour lines of Figure 5A), shows an upper ridge from the United Kingdom into Scandinavia. This will lead to mostly northeasterly or easterly winds over southern Scandinavia, Denmark and Netherlands, confirmed in Figure 3C. The MSLP anomaly is statistically significant over the entire area of interest (over sea and the potential departure area). The pressure anomaly reaches a maximum of 12 hPa near the potential departure area. High pressure systems are observed over the Dutch coast on almost all the high migration intensity nights (Figures 9A–E,G–I), resulting in the averaged easterly winds seen in Figure 3C over Netherlands. A lack of frontal systems is apparent over the Dutch coast and southwest Scandinavia. An exception is the 30th of October 2009 where a front passes over the North Sea between Netherlands and Denmark (Figure 9H), though that systems was dry and did not render any precipitation. During October 29, 2008 and November 8, 2009 (Figure 9F,I, respectively), a trough over the North Sea result in some mild precipitation.
On the other hand, the composite of the low migration intensity nights is characterized by a zonal flow with a slight southwest-northeast angle. This spatial pattern characterizes also the Autumn North Europe climatology. The MSLP anomalies are quite low and non-significant, while some positive 500 hPa anomalies are seen west of the Iberian Peninsula and along northwest Europe (Figure 5B). A close look into the individual low migration days (Figures 9J–Q) shows that frontal systems pass during all low migration nights, either over Netherlands, North Sea, or potential departure areas (Denmark and Southwestern Scandinavia), indicating that the passing of fronts hinders migration.
Precipitation, Relative Humidity, Cloudiness and Temperature
In autumn during nights of high migration very little to no rain falls over the regions of the potential departure areas of the southern North Sea (Netherlands, Denmark, and south Scandinavia). The composite of the negative precipitation anomalies in these areas are statistically significant (Figure 7A). On the contrary, on all low migration nights precipitation is higher than expected in these areas (Figure 7B). During high migration nights, in agreement with the absence of rain over the coast of Denmark and continental Europe low cloudiness is observed, but over central North Sea the cloudiness is somewhat higher than the local monthly climatology (Figure 7C). During low migration, cloudiness is generally higher than in climatology and anomalies are statistically significant (Figure 7D), as rainfall occurs during those nights. Over the North Sea relative humidity is quite low on high migration nights and neutral to high, but non-statistically significant during low migration, while it remains low over Denmark and high over Netherlands both during high and low migration (Figures 7E,F). The surface temperature was statistical significantly colder than in climatology during nights of high migration both over sea and land over Denmark and Netherlands (Figure 7G). The colder temperature is related to the upper ridge seen in the 500 hPa geopotential height from the United Kingdom into Scandinavia that drives northeasterly winds which advect cold air from northeastern Scandinavia. During low migration nights the temperature was warmer over land and similar to climatology over the sea (Figure 7H).
Summary and Discussion
Using 3 years of bird migration data measured off the Dutch coast, we revealed differences in the synoptic weather conditions occurring during high and low migration intensity nights in spring and autumn.
Nights of high migration intensities for both spring and autumn were characterized by prevailing high pressure systems, with a general absence of passing fronts and precipitation over sea and the probable departure areas over land. Generally, a high-pressure system is associated with dry and stable atmospheres, clear skies and mild winds. On the contrary, nights of low migration were characterized as nights with rain, often with passing fronts and overall low pressure. In spring a t-test shows that the positive surface pressure anomalies over sea and departure areas were not statistically significant, while in autumn the positive anomalies were significant. This suggests that the favoring migration conditions in spring are rather close to the average surface pressure climatology for that season, but in autumn more special conditions are required compared to the average climatology. The MSLP anomalies during low migration nights both in autumn and spring were not statistically significant, suggesting either a weak coupling between synoptic pressure systems and nights of low migration, or a combination of nights with unfavorable synoptic conditions for migration and nights of resting and feeding that might be decoupled from the synoptic pressure systems.
Our study shows that conditions free of precipitation support mass migration events. However, when using radar to measure migration it should be taken into consideration that during rain the ability of the radar to detect biological targets might be reduced and therefore the number of birds flying during rain may be underestimated. Nevertheless, even considering a potential underestimate of bird numbers, our findings are similar to previous studies indicating that rain strongly suppresses migration (Alerstam and Bauer, 1973; Lyuleeva, 1973) and is an important predictor variable for bird migration (Erni et al., 2002; Van Belle et al., 2007).
In spring, prevailing winds at the radar location, as well as in the whole region generally had a supporting direction for nocturnal migrants, which has previously been shown in this region (Kemp et al., 2013). During autumn nights with high migration the average winds at the radar location were tailwinds for the birds who could have been migrating between Netherlands and United Kingdom, while the majority of birds on high migration nights were migrating toward the southwest and thus experiencing sidewind component stronger than the tailwind on those nights. On nights with low migration intensity, winds at the radar location were predominantly headwinds in both seasons, indicating that tailwind is an important factor supporting migration, as also shown in numerous other studies (Liechti et al., 2000; Erni et al., 2002; Schmaljohann et al., 2009; Sjöberg et al., 2015). While the majority of migration happens within the lowest 1000 m of altitude in the mid-latitudes (Kemp et al., 2013; Bruderer et al., 2018), birds have also been observed flying higher to optimize wind support, especially in spring when beneficial wind at high altitudes are frequent (Dokter et al., 2013; Kemp et al., 2013). In such cases, high flying migrants would go undetected by the radar.
Since cloudiness is often linked to precipitation, it is observed here that birds prefer clear skies, although occasions of cloudiness during high migration flows also occur in our data. Interestingly warm south southwesterly winds which support migration in spring may also result in fog and low clouds generated by the condensation of warm air over the sea, creating poor visibility conditions. Studies have shown that birds might attempt to migrate above fog or clouds during overcast or rainy nights (Emlen, 1974; Panuccio et al., 2019). However, the occurrence of such behavior may not be detected by the radar if birds fly above the vertical detection range.
Although the absolute anomalies of the temperature and relative humidity are rather high in the analysis, the anomalies are not consistent for the two seasons. For example during high migration nights the anomalies of surface temperature over the areas of interest are positive in spring and negative in autumn. This suggests that the birds rather respond to factors that correlate with these variables and themselves exert only a secondary role, in agreement with Richardson (1978, 1990). The selection for cold temperature has been previously suggested as an indicator of deteriorating conditions and therefore as a signal for migration (Alerstam, 1990), but this suggestion cannot be verified in the current study.
Our selection of peak nights of migration above the 90th percentile per season resulted in high migration nights occurring in March and October. While we do not have information on the species in our study, the timing of these nights suggests that they may be generally representative of short to medium distance migrants in the region. Packmor et al. (2020) for example showed that night to night departure decisions of a short and medium distance migratory passerine was influenced by tailwinds and change in barometric pressure, while these weather factors did not influence departure decisions of a long distance migrants. However, in order to determine whether differential response to weather among and perhaps even within species results in peak migration over the North Sea occurring predominantly in early spring or late autumn requires further research integrating information on fluxes, species composition and regional synoptic conditions.
Our overall conclusion is that peak nights of bird migration over the North Sea are favored by the existence of high-pressure systems and the absence of fronts and are hindered by low-pressure systems and precipitation, in agreement with Geil et al. (1974), Richardson (1978), and Shamoun-Baranes et al. (2017). Winds on high migration nights in spring are tailwinds (southwesterlies), while in autumn they were sidewinds (easterlies). These patterns are similar to those observed in other studies in the region over land (Åkesson and Hedenström, 2000; Erni et al., 2002; Van Belle et al., 2007). In order better understand how environmental factors influence the spatio-temporal heterogeneity in migratory systems and improve our capacity to model them we recommend integrating complementary measurement and modeling techniques and covering longer periods of time where feasible (Shamoun-Baranes et al., 2010; Bauer et al., 2017). Incorporating information on species composition will significantly advance the comprehension of the potentially different responses to weather. Predictive models could integrate the synoptic scale perspective, considering the atmospheric conditions in departure areas of migrants, as well as atmospheric conditions en route in comparison to regional climatology. These advancements will consequently enhance our ability to predict migration flows and will allow us to build effective warning systems to reduce human wildlife conflicts such as risk of collisions with aircrafts (van Gasteren et al., 2019) or wind turbines.
Statements
Data availability statement
The datasets analyzed in this manuscript are not publicly available. Requests to access the datasets should be directed to IM, i.manola@vu.nl.
Author contributions
IM, JS-B, and MB developed the idea for this work. IM and MB analyzed and made the figures. All the authors have contributed in writing the text of this work.
Funding
This work is part of the Open Technology Programme, project “Interactions between birds and offshore wind farms: drivers, consequences and tools for mitigation” (project number 17083), financed by NWO Domain Applied and Engineering Sciences, in collaboration with the following private and public partners: Rijkswaterstaat and Gemini Windpark as well as the project “External drivers of spatial and temporal dynamics of the bird movement over the North Sea” funded by Gemini Windpark.
Acknowledgments
The authors would like to thank the colleagues of the Department of Theoretical and Computational Ecology (IBED-TCE) in the Institute for Biodiversity and Ecosystem Dynamics of University of Amsterdam for the fruitful discussions. Radar data on bird movement were collected in a program which was led by Karen Krijgsveld and commissioned by “NoordzeeWind” [as part of the Monitoring and Evaluation Program of OWEZ (MEP-NSW)].
Conflict of interest
RF was employed by the company Bureau Waardenburg BV, Ecology and Landscape. The remaining authors declare that the research was conducted in the absence of any commercial or financial relationships that could be construed as a potential conflict of interest.
References
1
Agostinelli C. Lund U. (2017). R package ‘circular’: Circular Statistics (version 0.4-93). URL https://r-forge.r-project.org/projects/circular/.
2
Ahad N. A. Yahaya S. S. S. (2014). “Sensitivity analysis of welch’st-test,” in AIP Conference Proceedings, (Maryland: American Institute of Physics), Vol. 1605:888–893.
3
Åkesson S. Hedenström A. (2000). Wind selectivity of migratory flight departures in birds.Behav. Ecol. Sociobiol.47140–144. 10.1007/s002650050004
4
Alerstam T. (1990). Bird migration.Cambridge, UK: Cambridge University Press.
5
Alerstam T. (2011). Optimal bird migration revisited.J. Ornithol.1525–23. 10.1007/s10336-011-0694-1
6
Alerstam T. Bauer C. A. (1973). A radar study of the spring migration of the crane (Grus grus) over the southern Baltic area.Vogelwarte271–16.
7
Andueza M. Arizaga J. Belda E. J. Barba E. (2013). The role of extrinsic and intrinsic factors on the departure decisions of a long-distance migratory passerine.Ardeola6059–73. 10.13157/arla.60.1.2012.59
8
Aschwanden J. Stark H. Peter D. Steuri T. Schmid B. Liechti F. (2018). Bird collisions at wind turbines in a mountainous area related to bird movement intensities measured by radar.Biol. Conserv.220228–236. 10.1016/j.biocon.2018.01.005
9
Bauer S. Chapman J. W. Reynolds D. R. Alves J. A. Dokter A. M. Menz M. M. H. et al (2017). From agricultural benefits to aviation safety: realizing the potential of continent-wide radar networks.BioScience67912–918. 10.1093/biosci/bix074
10
Bauer S. Shamoun-Baranes J. Nilsson C. Farnsworth A. Kelly J. F. Reynolds D. R. et al (2019). The grand challenges of migration ecology that radar aeroecology can help answer.Ecography42861–875. 10.1111/ecog.04083
11
Brabant R. Vanermen N. Stienen E. W. Degraer S. (2015). Towards a cumulative collision risk assessment of local and migrating birds in North Sea offshore wind farms.Hydrobiologia75663–74. 10.1007/s10750-015-2224-2
12
Bradarić M. Bouten W. Fijn R. Krijgsveld K. Shamoun-Baranes J. (2020). Winds at departure shape seasonal patterns of nocturnal bird migration over the North Sea.J. Avian. Biol.10.1111/jav.02562
13
Bruderer B. Peter D. Korner-Nievergelt F. (2018). Vertical distribution of bird migration between the Baltic Sea and the Sahara.J. Ornithol.159:0123456789. 10.1007/s10336-017-1506-z
14
Bruderer B. Underhill L. G. Liechti F. (1995). Altitude choice by night migrants in a desert area predicted by meteorological factors.Ibis13744–55. 10.1111/j.1474-919x.1995.tb03218.x
15
Chapman J. W. Nilsson C. Lim K. S. Bäckman J. Reynolds D. R. Alerstam T. (2016). Adaptive strategies in nocturnally migrating insects and songbirds: contrasting responses to wind.J. Anim. Ecol.85115–124. 10.1111/1365-2656.12420
16
Dokter A. M. Shamoun-Baranes J. Kemp M. U. Tijm S. Holleman I. (2013). High Altitude Bird Migration at Temperate Latitudes: A Synoptic Perspective on Wind Assistance.PLoS One81–8. 10.1371/journal.pone.0052300
17
Emlen S. T. (1974). “Problems in identifying bird species by radar signature analyses: intra-specific variability,” in The biological aspects of the bird/aircraft collision problem, ed Edn, ed.GauthreauxS. A. (Carolina: U.S. Air Force Office of Scientific Research), 509–524.
18
Erni B. I Liechti F. Underhill L. G. Bruderer B. (2002). Wind and rain govern the intensity of nocturnal bird migration in central Europe-a log-linear regression analysis.Ardea90155–166.
19
Fijn R. C. Krijgsveld K. L. Poot M. J. M. Dirksen S. (2015). Bird movements at rotor heights measured continuously with vertical radar at a Dutch offshore wind farm.Ibis157558–566. 10.1111/ibi.12259
20
Gauthreaux S. A. Jr. Michi J. E. Belser C. G. (2005). “The temporal and spatial structure of the atmosphere and its influence on bird migration strategies,” in Birds of two worlds: the ecology and evolution of migration Baltimore: The, edsGreenbergR.MarraP. P. (Maryland: Johns Hopkins University Press), 182–194.
21
Geil S. Rabøl J. Noer H. (1974). Forecast Models for Bird Migration in Denmark.Report from the Danish Defence Research Establishment, Copenhagen: University of Copenhagen.
22
Haest B. Hüppop O. Bairlein F. (2018). The influence of weather on avian spring migration phenology: What, where and when?Global Change Biol.245769–5788. 10.1111/gcb.14450
23
Haest B. Hüppop O. van de Pol M. Bairlein F. (2019). Autumn bird migration phenology: A potpourri of wind, precipitation and temperature effects.Global Change Biol.254064–4080. 10.1111/gcb.14746
24
Hersbach H. Dee D. (2016). ERA5 reanalysis is in production, ECMWF Newsletter 147.Reading, UK: ECMWF.
25
Horton K. G. Van Doren B. M. Stepanian P. M. Farnsworth A. Kelly J. F. (2016). Where in the air? Aerial habitat use of nocturnally migrating birds.Biol. Lett.12:20160591. 10.1098/rsbl.2016.0591
26
Hüppop O. Dierschke J. Exo K. M. Fredrich E. Hill R. (2006). Bird migration studies and potential collision risk with offshore wind turbines.Ibis14890–109. 10.1111/j.1474-919x.2006.00536.x
27
Hüppop O. Hüppop K. (2011). Bird migration on Helgoland: The yield from 100 years of research.J. Ornithol.152(1 Suppl.), 25–40. 10.1007/s10336-011-0705-2
28
Kemp M. U. Shamoun-Baranes J. Dokter A. M. van Loon E. Bouten W. (2013). The influence of weather on the flight altitude of nocturnal migrants in mid-latitudes.Ibis155734–749. 10.1111/ibi.12064
29
Krijgsveld K. L. Fijn R. C. Japink M. van Horssen P. Heunks C. Collier M. P. et al (2011). Effect studies Offshore Wind Farm Egmond aan Zee. Final report on fluxes, flight altitudes and behaviour of flying birds.Report nr 10-219/OWEZ_R_231_T1_20111110_flux&flight, Netherlands: Culemborg.
30
Krijgsveld K. L. Lensink R. Schekkerman H. Wiersma P. Poot M. J. M. Meesters E. H. W. G. et al (2005). Baseline studies North Sea wind farms?: fluxes, flight paths and altitudes of flying birds 2003 - 2004.Rapport 05-041. Bureau Waardenburg bv, Netherlands: Culemborg.
31
Lack D. (1959). Migration across the sea.Ibis101374–399. 10.1111/j.1474-919X.1959.tb02395.x
32
Lack D. (1963a). Migration across the Southern North Sea studied by radar part 4.Autumn. The Ibis1051–54. 10.1111/j.1474-919x.1963.tb02473.x
33
Lack D. (1963b). Migration across the southern North Sea studied by radar part 5. Movement in August, winter and spring, and conclusion.Ibis105461–492. 10.1111/j.1474-919x.1963.tb01587.x
34
Liechti F. Klaassen M. Bruderer B. (2000). Predicting migratory flight altitudes by physiological migration models.Auk117205–214. 10.1093/auk/117.1.205
35
Liu M. Swanson D. L. (2015). Stopover duration, movement patterns and temporary home ranges of fall migrant yellow-rumped warblers Setophaga coronata in native and anthropogenic woodlands of the Northern Prairie region, USA.J. Avian Biol.46452–461. 10.1111/jav.00672
36
Lyuleeva D. S. (1973). Features of swallow biology during migration. Bird Migrations: Ecological and Physiological Factors.London: John Wiley, 218–272.
37
Manola I. Steeneveld G. J. Uijlenhoet R. Holtslag A. A. (2019). Analysis of urban rainfall from hourly to seasonal scales using high-resolution radar observations in the Netherlands.Int. J. Climatol.40822–840. 10.1002/joc.6241
38
May R. Reitan O. Bevanger K. Lorentsen S. H. Nygård T. (2015). Mitigating wind-turbine induced avian mortality: sensory, aerodynamic and cognitive constraints and options.Renew. Sustain. Ener. Rev.42170–181. 10.1016/j.rser.2014.10.002
39
McLaren J. D. Shamoun-Baranes J. Bouten W. (2012). Wind selectivity and partial compensation for wind drift among nocturnally migrating passerines.Behav. Ecol.231089–1101. 10.1093/beheco/ars078
40
Newton I. (2007). Weather-related mass-mortality events in migrants.Ibis149453–467. 10.1111/j.1474-919X.2007.00704.x
41
Packmor F. Klinner T. Woodworth B. K. Eikenaar C. Schmaljohann H. (2020). Departure decisions in songbirds following different migration strategies: Do long-distance migrants depart earlier and more independently of weather conditions than medium-distance migrants?Move. Ecol.8:6.
42
Panuccio M. Dell’Omo G. Bogliani G. Catoni C. Sapir N. (2019). Migrating birds avoid flying through fog and low clouds.Int. J. Biometeorol.63231–239. 10.1007/s00484-018-01656-z
43
R Core Team (2018). R: A Language and Environment for Statistical Computing.Europa: R Core Team.
44
Richardson W. J. (1978). Timing and amount of bird migration in relation to weather: a review.Oikos30224–272. 10.2307/3543482
45
Richardson W. J. (1990). “Timing of bird migration in relation to weather: updated review,” in, ed Edn, ed.GwinnerE. (Berlin: Springer-Verlag), 78–101. 10.1007/978-3-642-74542-3_6
46
Schaub M. Liechti F. Jenni L. (2004). Departure of migrating European robins, Erithacus rubecula, from a stopover site in relation to wind and rain.Anim. Behav.67229–237.
47
Schmaljohann H. Liechti F. Bruderer B. (2009). Trans-Sahara migrants select flight altitudes to minimize energy costs rather than water loss.Behav. Ecol. Sociobiol.631609–1619. 10.1007/s00265-009-0758-x
48
Shamoun-Baranes J. Bouten W. van Loon E. E. (2010). Integrating meteorology into research on migration.Integr. Comp. Biol.50280–292. 10.1093/icb/icq011
49
Shamoun-Baranes J. Liechti F. Vansteelant W. M. (2017). Atmospheric conditions create freeways, detours and tailbacks for migrating birds.J. Comp. Physiol. A203509–529. 10.1007/s00359-017-1181-9
50
Shamoun-Baranes J. van Gasteren H. (2011). Atmospheric conditions facilitate mass migration events across the North Sea.Anim. Behav.81691–704. 10.1016/j.anbehav.2011.01.003
51
Shamoun-Baranes J. van Loon E. Liechti F. Bouten W. (2007). Analyzing the effect of wind on flight: pitfalls and solutions.J. Exp. Biol.21082–90. 10.1242/jeb.02612
52
Sjöberg S. Alerstam T. Åkesson S. Schulz A. Weidauer A. Coppack T. et al (2015). ‘Weather and fuel reserves determine departure and flight decisions in passerines migrating across the Baltic Sea’, Animal Behaviour.Elsevier Ltd10459–68. 10.1016/j.anbehav.2015.02.015
53
Thaxter C. B. Ross-Smith V. H. Willem B. (2019). Avian vulnerability to wind farm collision through the year: Insights from lesser black-backed gulls (Larus fuscus) tracked from multiple breeding colonies.J. Appl. Ecol.562410–2422. 10.1111/1365-2664.13488
54
Van Belle J. Shamoun-Baranes J. Van Loon E. Bouten W. (2007). An operational model predicting autumn bird migration intensities for flight safety.J. Appl. Ecol.44864–874. 10.1111/j.1365-2664.2007.01322.x
55
van Gasteren H. Krijgsveld K. L. Klauke N. Leshem Y. Metz I. C. Skakuj M. et al (2019). Aeroecology meets aviation safety: early warning systems in Europe and the Middle East prevent collisions between birds and aircraft.Ecography42899–911. 10.1111/ecog.04125
56
Woth K. Weisse R. Von Storch H. (2006). Climate change and North Sea storm surge extremes: an ensemble study of storm surge extremes expected in a changed climate projected by four different regional climate models.Ocean Dynam.563–15. 10.1007/s10236-005-0024-3
Summary
Keywords
bird migration, synoptic weather, North Sea, radar observations, radar data
Citation
Manola I, Bradarić M, Groenland R, Fijn R, Bouten W and Shamoun-Baranes J (2020) Associations of Synoptic Weather Conditions With Nocturnal Bird Migration Over the North Sea. Front. Ecol. Evol. 8:542438. doi: 10.3389/fevo.2020.542438
Received
12 March 2020
Accepted
09 September 2020
Published
07 October 2020
Volume
8 - 2020
Edited by
Stuart Peter Sharp, Lancaster University, United Kingdom
Reviewed by
Adriaan Dokter, The Cornell Lab of Ornithology, United States; Heiko Schmaljohann, Carl von Ossietzky University of Oldenburg, Germany
Updates
Copyright
© 2020 Manola, Bradarić, Groenland, Fijn, Bouten and Shamoun-Baranes.
This is an open-access article distributed under the terms of the Creative Commons Attribution License (CC BY). The use, distribution or reproduction in other forums is permitted, provided the original author(s) and the copyright owner(s) are credited and that the original publication in this journal is cited, in accordance with accepted academic practice. No use, distribution or reproduction is permitted which does not comply with these terms.
*Correspondence: Iris Manola, i.manola@vu.nl; manola.irida@gmail.com
This article was submitted to Behavioral and Evolutionary Ecology, a section of the journal Frontiers in Ecology and Evolution
Disclaimer
All claims expressed in this article are solely those of the authors and do not necessarily represent those of their affiliated organizations, or those of the publisher, the editors and the reviewers. Any product that may be evaluated in this article or claim that may be made by its manufacturer is not guaranteed or endorsed by the publisher.