 Stephen E. Greiman1*
 Joseph A. Cook2
 Timothy Odom1Katelyn Cranmer1
 Schuyler W. Liphardt2
 Damian M. Menning3Sarah A. Sonsthagen3
 Sandra L. Talbot3
- 1Department of Biology, Georgia Southern University, Statesboro, GA, United States
- 2Department of Biology, Museum of Southwestern Biology, University of New Mexico, Albuquerque, NM, United States
- 3US Geological Survey, Alaska Science Center, Anchorage, AK, United States
Interest in gut microbial community composition has exploded recently as a result of the increasing ability to characterize these organisms and a growing understanding of their role in host fitness. New technologies, such as next generation amplicon (16S rRNA) sequencing, have enabled identification of bacterial communities from samples of diverse origin (e.g., fecal, skin, genital, environmental, etc.). Relatively little work, however, has explored the feasibility of utilizing historical samples (e.g., museum archived samples) of varying age, quality, and preservation type. Because natural history collections span multiple decades, these biorepositories have the potential to provide fundamental historical baselines to measure and better understand biodiversity on a changing planet. Utilizing even a small proportion of museum specimens could provide a means of sampling past microbial communities, allowing for direct comparison to contemporary communities and more complete understanding of dynamic shifts through time. We examined the feasibility of obtaining 16S rRNA amplicon microbiome data from whole gastrointestinal tracts (GIs) of shrews of varying age and preservation method, including 5 freshly collected shrew GIs immediately fixed in liquid nitrogen (LN2), 10 ten-year old shrew GIs frozen at −20°C (whole animal), and 10 shrews of varying ages (4 from 1968, 1 from 1980, 1 from 2001, 1 from 2004, 1 from 2007, 1 from 2011 and 2 from 2013) fixed and stored whole in 70% ethanol. Not surprisingly, results of 16S rDNA amplicon sequencing reveal significantly different bacterial communities between different preservation techniques and age of samples. Ten-year old frozen samples had bacterial communities most similar to freshly collected (LN2) samples, while the bacterial communities of both were significantly different from the 70% ethanol preserved samples of various ages. Amongst those preserved in 70% ethanol, age of samples also influenced bacterial community composition. Additionally, we compare results of OTU based and ASV based analyses. Looking ahead, field collectors and museums should develop and adopt best practices related to frozen preservation to ensure adequate material for future microbiome investigations.
Introduction
Natural history collections are fundamental resources for the discovery and documentation of biodiversity and now serve as primary informatics resources for understanding the history and future of the biosphere (e.g., Hoberg et al., 2013; McLean et al., 2016). These resources have historically been used for biodiversity discovery and morphological comparisons of vertebrate and invertebrate organisms (Hope et al., 2018; Jones et al., 2019; Meineke et al., 2019). Accelerating environmental change world-wide and new advances in sample use have repurposed portions of these collections to addressing new questions in emerging fields (e.g., isotope work based on specimens) (Schindel and Cook, 2018). The advent of genomic sequencing technologies, for example, demonstrated that many historical samples can be valuable to large scale phylogenomic and phylogeographic works (Holmes et al., 2016). Even given the large increase in museum specimen use for genomic sequencing, limited work has focused on characterizing the microbial communities associated with these archived host specimens (Heindler et al., 2018).
Host associated microbial communities, or microbiomes, have proven to be a vital component in fitness. For example, bacteria of the gastrointestinal tract play a large role in the organism’s health, physiology, and long-term evolution (Datta et al., 2018; Amato et al., 2019; Nobs et al., 2019; Youngblut et al., 2019; Zeevi et al., 2019). Gastrointestinal samples available within natural history collections have the potential to provide temporal or spatial assessments of microbial communities, especially important for interpreting the impact of environmental perturbations. Given that the microbial composition of an organism is affected by the properties of the host’s environment (e.g., temperature, precipitation, pollution, diet), comparisons of historical and contemporary samples provides a basis for modeling potential future changes, including possible impacts to host health (Giatsis et al., 2015; Jin et al., 2017; Rothschild et al., 2018).
To date, a single study has examined gastrointestinal microbiomes of museum archives (Heindler et al., 2018) using DNA metabarcoding to identify the prey and microbiomes of trematomid fishes. They found limited overlap in microbiome composition between contemporary and museum samples of three Trematomus species archived in either formaldehyde or ethanol; however, they hypothesized that differences could reflect actual biological shifts in the gut microbiome of these fishes. Heindler et al. (2018) emphasized that further extensive studies are needed to confirm that shift in microbial composition over time. Herein, we expand on assessing the use of natural history collections for gastrointestinal tract (GIs) microbiome characterization to small mammals in the genus Sorex (shrews).
The genus Sorex (Eulipotyphla: Soricidae) is one of the most diverse (more than 75 species worldwide) genera of mammals (Bannikova et al., 2018; Burgin et al., 2018). Soricid shrews are widely distributed, occupying most terrestrial habitats throughout the Palearctic and Nearctic regions, consuming a considerable quantity of invertebrates (ranging from worms to arthropods), and hosting a diverse array of helminth parasites (Greiman et al., 2018). Their extremely high metabolism requires them to eat almost continuously, otherwise they are at risk of dying from starvation within hours. This voracious appetite likely leads to their diverse helminth communities. As such, they are highly susceptible to rapid tissue degradation following death, and therefore, must be processed quickly to insure proper identification of their helminth communities and bacterial microbiomes. Given multi-species interactions across trophic levels in the Northern Hemisphere, shrews provide direct insights into processes governing larger ecosystems, and have been useful for recognizing how climate change has facilitated repeated invasions of northern systems, movement between continents, and cyclical secondary contact among vertebrate and invertebrate taxa (Waltari et al., 2007; Haukisalmi et al., 2010; Hope et al., 2015). Given their efficacy for modeling future impacts of environmental change, maximizing the use of historical archived samples is critical to building baselines not only for these small mammals, but also for the community of organisms living on and within them, including their microbial communities. Therefore, the aims of this study were twofold: (1) to assess the feasibility of obtaining usable 16S rRNA amplicon microbiome data from whole GIs of shrews of varying age and preservation method that can be compared directly to sequence data of contemporary samples and (2) to begin to outline best practices for preservation of future collections of natural history samples to maximize their use for symbiont community surveys.
Materials and Methods
Sample Collection
Twenty-four whole GI tracts from shrews of two closely related species (Sorex monticola and Sorex cinereus) were sampled from museum specimens from the Museum of Southwestern Biology at the University of New Mexico in Albuquerque (Supplementary Table S1). This included 5 freshly collected shrew GIs immediately fixed in liquid nitrogen (LN2), 10 ten-year old shrew GIs frozen at −20°C (whole animal), and 10 shrews of varying ages (4 from 1968, 1 from 1980, 1 from 2001, 1 from 2004, 1 from 2007, 1 from 2011 and 2 from 2013) fixed and stored whole in 70% ethanol. Museum sample preservation varied, with preserved GIs: 1) still within the shrew host originally fixed in 95% ethanol, and then moved to 70% ethanol for long term storage at room temperature; 2) flash frozen after removal from host with storage in liquid nitrogen; or 3) still within the shrew host frozen and stored at −20°C. To insure that shrew tissues (GI tracts) were of good quality for microbial identification, live shrews were collected by pitfall trapping, with pitfall traps checked every 3 h during the day, and 6 h overnight, to prevent tissue degradation. For older samples, shrews were preserved whole, with the GI tract still within the organism, and therefore, they were not reliant on individual processing times that could result in tissue degradation. Additionally, when the GI tract was removed from the body cavity by author SEG, it was examined for tissue degradation to insure only quality samples were processed.
DNA Extraction
GI tracts were aseptically removed from within the animal or vial using UV sterilized and bleached (10%) micro-forceps and dissection scissors and placed into a sterile glass Petri dish. GI tracts were straightened within the Petri dish, cut in half, and opened using sterile fine dissection scissors under a dissecting microscope. DNA was extracted from opened GI tracts using the ZR Fecal DNA MiniPrepTM kit (Zymo Research, Irvine, CA) following the manufacturer’s instructions with minor changes; including, only 750 μL (instead of recommended 800 μL) of sample mixture and Fecal DNA Binding buffer added to the Zymo-Spin IIC Column to avoid overloading; and the use of 150 μL of Elution Buffer instead of recommended 100 μL. Each half of the GI tract from an individual shrew was extracted separately to avoid overloading spin columns, and the intestinal content of each half was scraped using sterile forceps into the lysis tube. Following DNA extraction, DNA eluted from each GI half (≈150 μL each) was combined into a single sterile microcentrifuge tube. Samples within the ZR BashingBeadTM lysis tube were lysed by bead bashing for ≈30 min using the TissueLyser II (Qiagen, Hilden, Germany). Eluted DNA (2 μL from each sample) was quantified using the QubitTM dsDNA Broad Range Assay Kit (Thermo Fisher Scientific, Waltham, MA). Following quantification, each sample (if possible) was standardized to 50 ng/μL.
DNA Library Preparation and Sequencing
Libraries were prepared for sequencing on an Illumina platform (Illumina Inc., San Diego, CA). DNA extracts were amplified by PCR in triplicate using 16S V4 region universal primers (515F Turner et al., 1999; reverse primer Kozich et al., 2013). Positive and negative controls were used to verify PCR reactions. The positive control (herein referred to as a mock community) used was ZymoBIOMICS Microbial Community Standard II (Zymo Research, Irvine, CA) and the negative controls included a blank DNA extraction of just elution buffer library amplified in triplicate and a water blank library amplified in triplicate. PCR amplifications and library preparation were carried out following the protocol outlined by Greiman et al. (2018). Libraries were sequenced on an Illumina MiSeq (paired-end reads; 2 × 250 bp with two 8 bp index reads; 15% PhiX). Machine-processed sequencing output has been deposited under BioProject: PRJNA605349, SRA accessions: SRR11038924–11038940.
Data Analysis (OTU)
For OTU based analyses paired-end reads were processed and analyzed using mothur software package (v 1.37.3) (Schloss et al., 2009) by following the MiSeq SOP analysis pipeline (Kozich et al., 2013). Paired-reads were assembled into contigs. Primer sequences were removed and contigs with ambiguous bases and over 300 bp in length were removed. Duplicate contigs were merged. Contigs were aligned to SILVA version 123 database and filtered to remove overhangs at each end and poorly aligned reads (Quast et al., 2013; Yilmaz et al., 2014). Duplicate contigs were again merged. Contigs were further clustered allowing 2 nucleotide differences between contigs to reduce noise. Chimeric sequences were identified and removed using the VSEARCH algorithm through mothur (Rognes et al., 2016). Assembled reads were classified using the Bayesian classifier utilizing the SILVA reference and taxonomy file. Following classification the sequencing error rate was assessed in mothur using the seq.error command of just the positive control mock community. Following classification and error rate assessment, contigs were clustered into operational taxonomic units (OTUs) using the cluster.split command, which uses taxonomic information to split the reads into bins and then clusters within each bin. To obtain weighted and unweighted unifrac distances, a distance matrix was generated using the dist.seqs command in mothur followed by generation of a neighbor joining tree utilizing the clearcut command (Sheneman et al., 2006). Unifrac distances were obtained using the unifrac.unweighted and unifrac.weighted command in mothur.
Errors are inherently associated with amplification, sequencing, and mapping of reads to OTUs, making it difficult to distinguish between noise and rare OTUs. To avoid this, reads were filtered and normalized using the web-based program Calypso (Zakrzewski et al., 2017) as follows: rare taxa, those that have less than 0.01 percent relative abundance across all samples, were removed; data were normalized using the total sum normalization and square root transformed (Hellinger transformation) (Legendre and Borcard, 2018).
Data analysis and visualization were completed using Calypso, which utilizes different R packages. Shannon diversity (alpha diversity statistic) indices were calculated for both preservation method and sample age and compared using the non-parametric Wilcoxon Rank test. Phylum abundances were visualized using clustered bar plots. Multivariate permutational MANOVA (Adonis) tests were run on both weighted and unweighted Unifrac distance matrices to test for differences in microbiome beta diversity between both preservation method and sample age, and tested for homogeneity of variance using PERMDISP2 as implemented in the R package vegan through the betadisper() function (Oksanen et al., 2017). Beta diversity by sample age and preservation type was visualized using both principal coordinate analysis plots and hierarchical clustering (heatmap) based on both weighted and unweighted Unifrac distances. Univariate non-parametric Kruskal-Wallis tests were used to determine the major phyla that were significantly more/less abundant based on preservation technique and age of sample.
Data Analysis (ASV)
For Amplicon Sequence Variant (ASV) based analyses paired-end reads were processed and analyzed using DADA2 software package (v 1.16.1) by following the DADA2 pipeline tutorial (v 1.16.1) (Callahan et al., 2016). Quality profiles of the forward and reverse reads were plotted and analyzed to determine how best to filter and trim the sequences. Forward and reverse reads were filtered and trimmed as follows; primer sequences were trimmed using the trimLeft command, maximum number of expected errors for both forward and reverse reads were set at 3, and low quality tails were removed using trunLen command set at 160 bp for both forward and reverse reads. Error rates were estimated based on machine learning, using the commands errF and errR and then plotted to ensure quality data. Following error rate assessment ASVs were inferred through the core sample inference algorithm of forward and reverse reads separately. Paired reads were then merged and chimeras detected and removed. Taxonomy was assigned using the DECIPHER R package (Wright, 2016) and the SILVA reference library. To remove likely contaminants, based on negative controls, we implemented the decontam R package (Davis et al., 2018).
Data analysis and visualization of ASVs were almost identical to the above description for OTUs with one minor difference. MANOVAs, PERMDISP2 analyses, and hierarchical clustering analyses were run using both Bray-Curtis and Jaccard distances instead of Unifrac distances (as was done with OTUs).
Results
Illumina Sequencing and OTU Identification
Over 2.7 million paired reads were obtained across the 24 whole GI tract samples and the positive and negative controls. Of the >2.7 million sequences, 1,185,054 passed mothur filtering/quality criteria (Supplementary Table S2). Filtered sequences fell within 10,504 total OTUs; however, after removal of rare taxa and data normalization, there remained 186 unique OTUs. Mothur estimated the error rate, which was based on the positive control mock community, to be 0.024%.
ASV Identification
Of the >2.7 million sequences, 1,609,584 passed DADA2 filtering and after removal of contaminants through the decontam R package, a total of 1,427,067 reads were remaining, as 7 ASVs were removed through the decontamination process (1 Enterobacterales, 1 unknown bacteria, 2 Rhizobiales, 2 Burkholderiales and 1 Campylobacterales) (Supplementary Table S3). Filtered and decontaminant-free sequences fell within 2,857 ASVs; however, after removal of rare taxa and data normalization there remained 205 unique ASVs.
Microbiome Composition (OTU Based)
Among only the contemporary samples, a substantial amount of inherent variability in the microbial composition of the complete GI tract was detected. Even so, the community consisted of only a handful of dominant phyla; most abundant were the Tenericutes, Firmicutes, Epsilonbacteraeota, Proteobacteria, and Actinobacteria, while 11 other phyla comprised a much smaller portion of the diversity (Figure 1; Supplementary Figure S1). All samples shared the same 5 major phyla, however, their abundances varied significantly across sample age (Kruskal-Wallis: Epsilonbacteraeota P = 0.0027, FDR = 0.023; Tenericutes P = 0.0052, FDR = 0.023; Firmicutes P = 0.02, FDR = 0.05; Proteobacteria P = 0.024, FDR = 0.05) (Figure 1 and Supplementary Figure S1). When considering sample age, >40 year old ethanol preserved samples had significantly more Proteobacteria than contemporary samples in LN2 (Kruskal-Wallis: P < 0.05); contemporary samples in LN2 and 10 year old samples at −20°C had significantly more Epsilonbacteraeota than all ethanol preserved samples (Kruskal-Wallis: p < 0.05); >40 year old samples had significantly fewer Firmicutes than contemporary samples (Kruskal-Wallis: P < 0.05), while 10 year old samples at −20°C had fewer Firmicutes than >10 year old ethanol preserved samples (Wilcoxon rank: P < 0.005); lastly, contemporary samples and 10 year old frozen samples had significantly greater numbers of Tenericutes than >6 year old ethanol samples (Wilcoxon rank: P < 0.05), and 10 year old frozen samples had significantly greater numbers of Tenericutes than >40 year old samples (Wilcoxon rank: P < 0.005) (Figure 2). Alpha diversity (Shannon diversity index) of the whole GI tract microbial communities did not vary amongst sample age or preservation type at the bacterial OTU level, however, alpha diversity did vary significantly amongst sample age and preservation type at the bacterial phyla level (Figure 3).
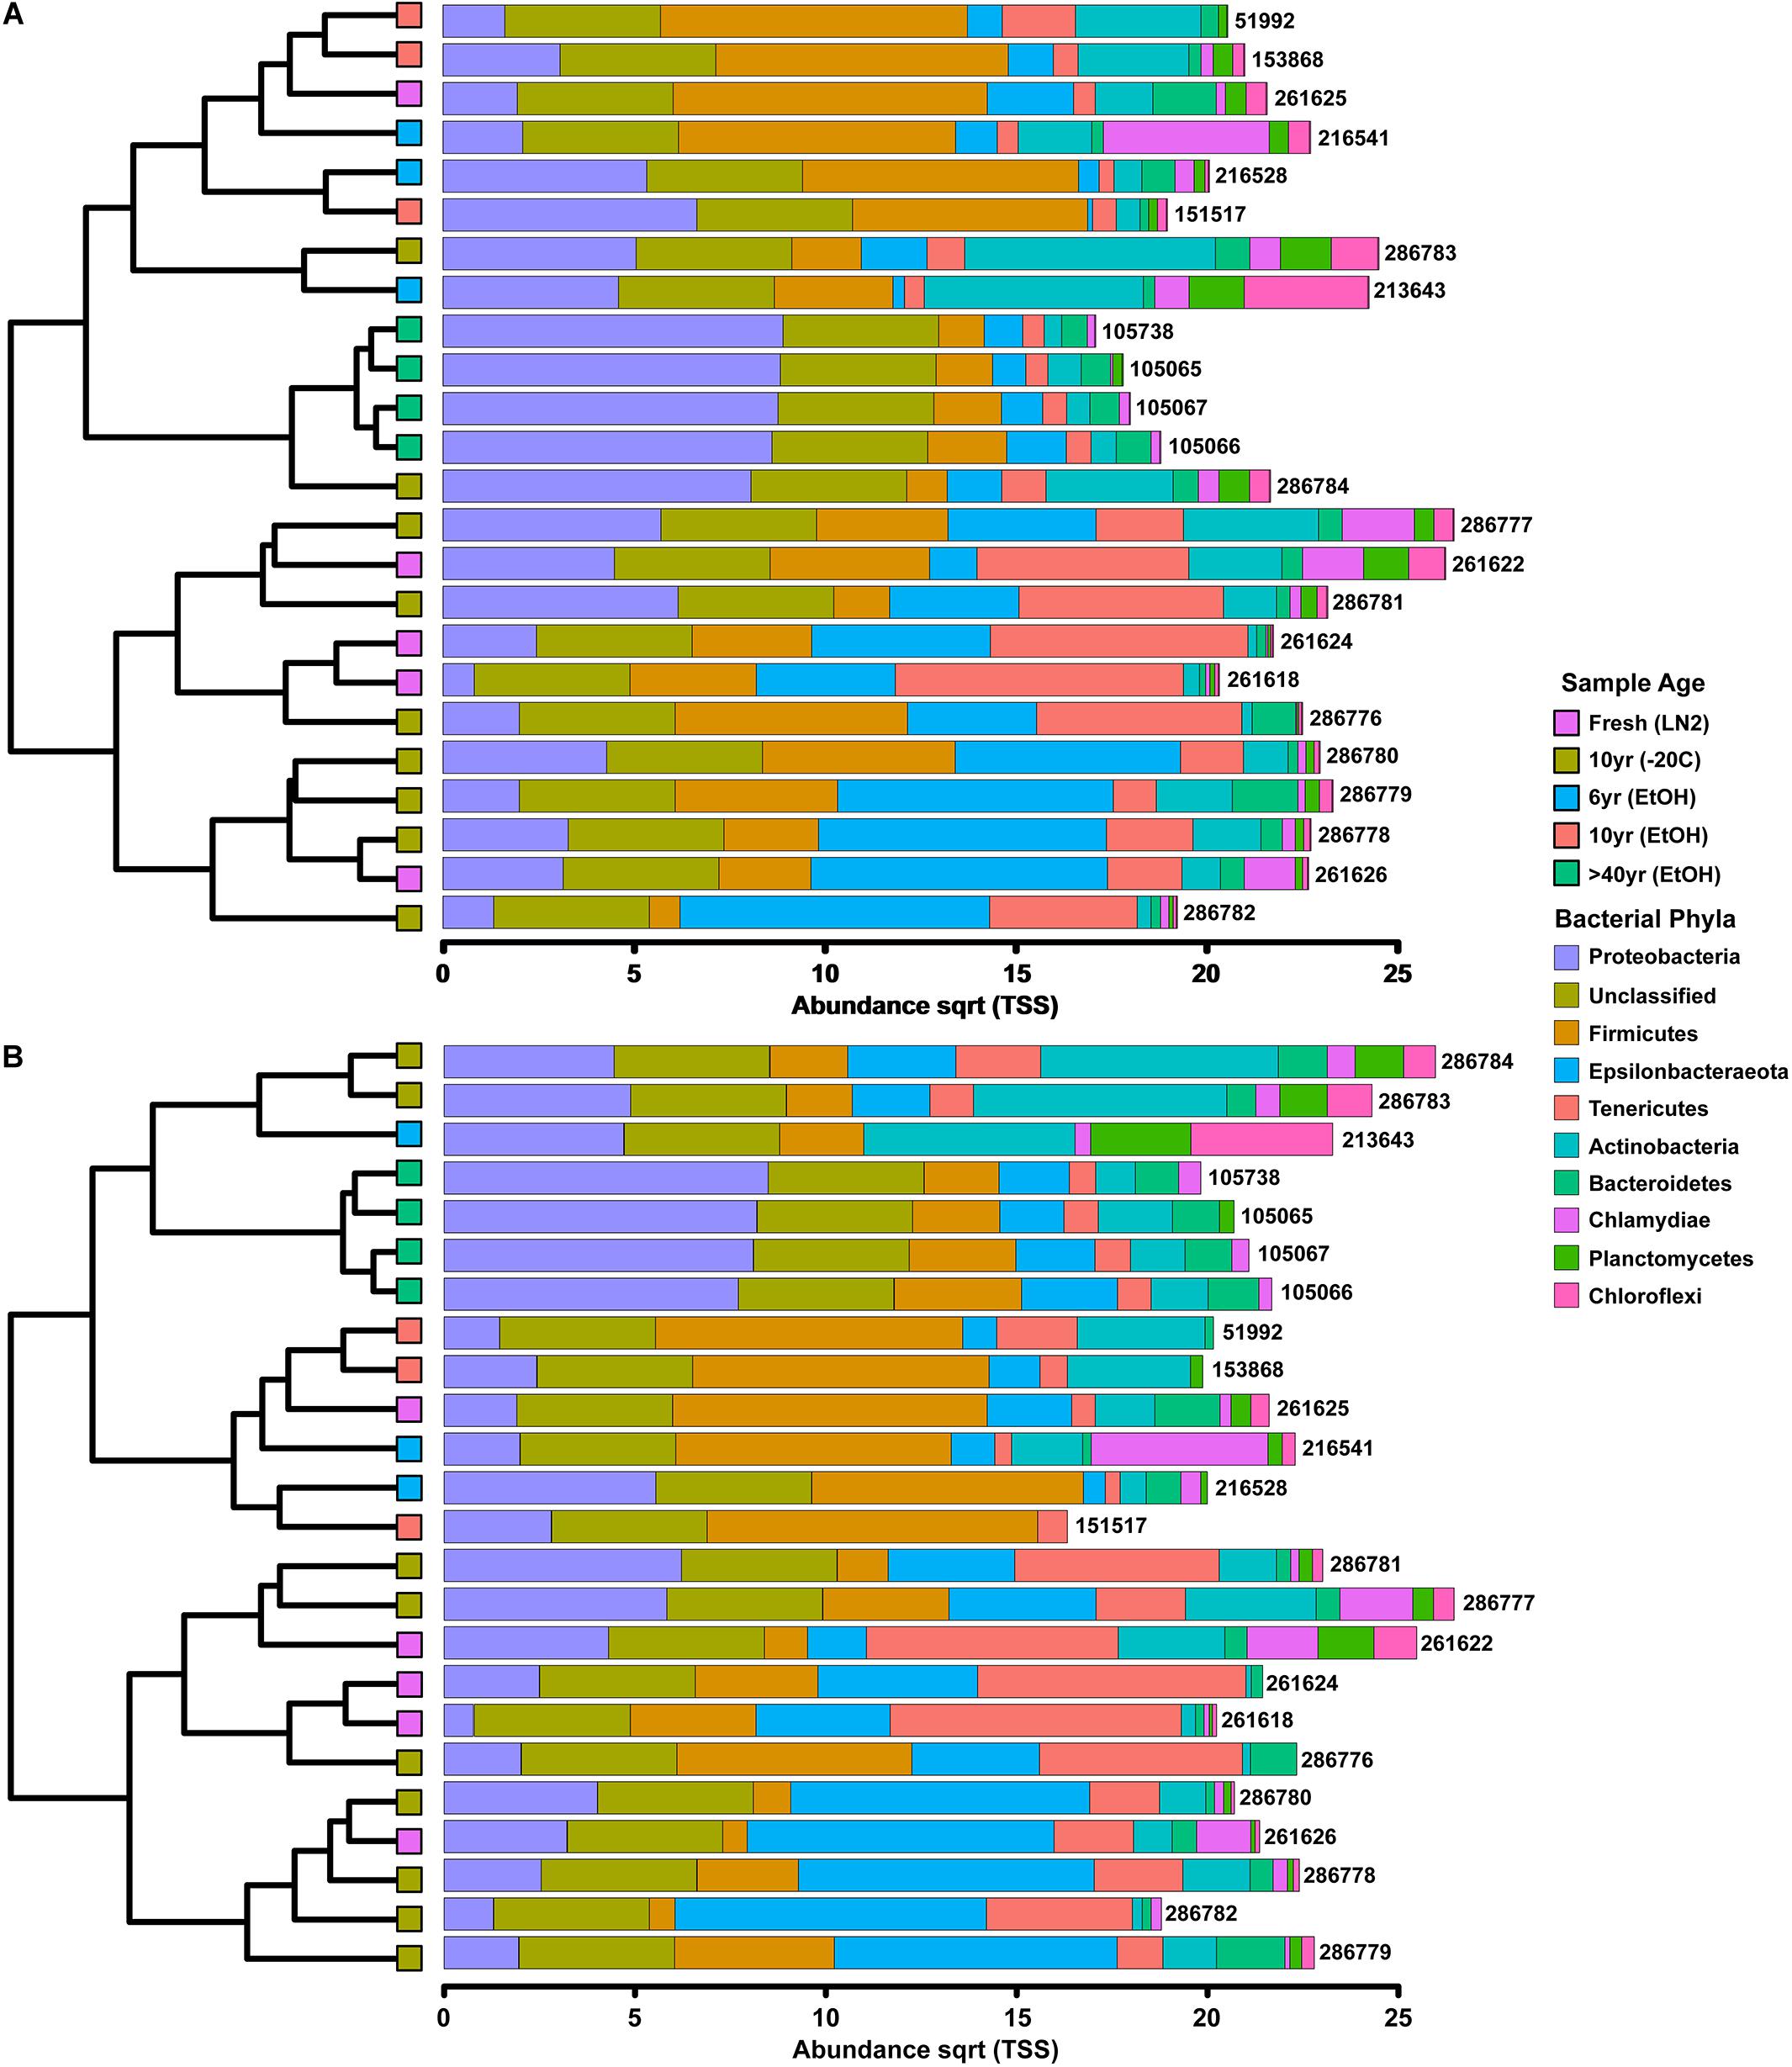
Figure 1. Clustered-bar charts (A) depicting phyla level (top 10) variation in gut microbiota composition across sample age based on OTUs and (B) depicting phyla level (top 10) variation in gut microbiota composition across sample age based on ASVs.
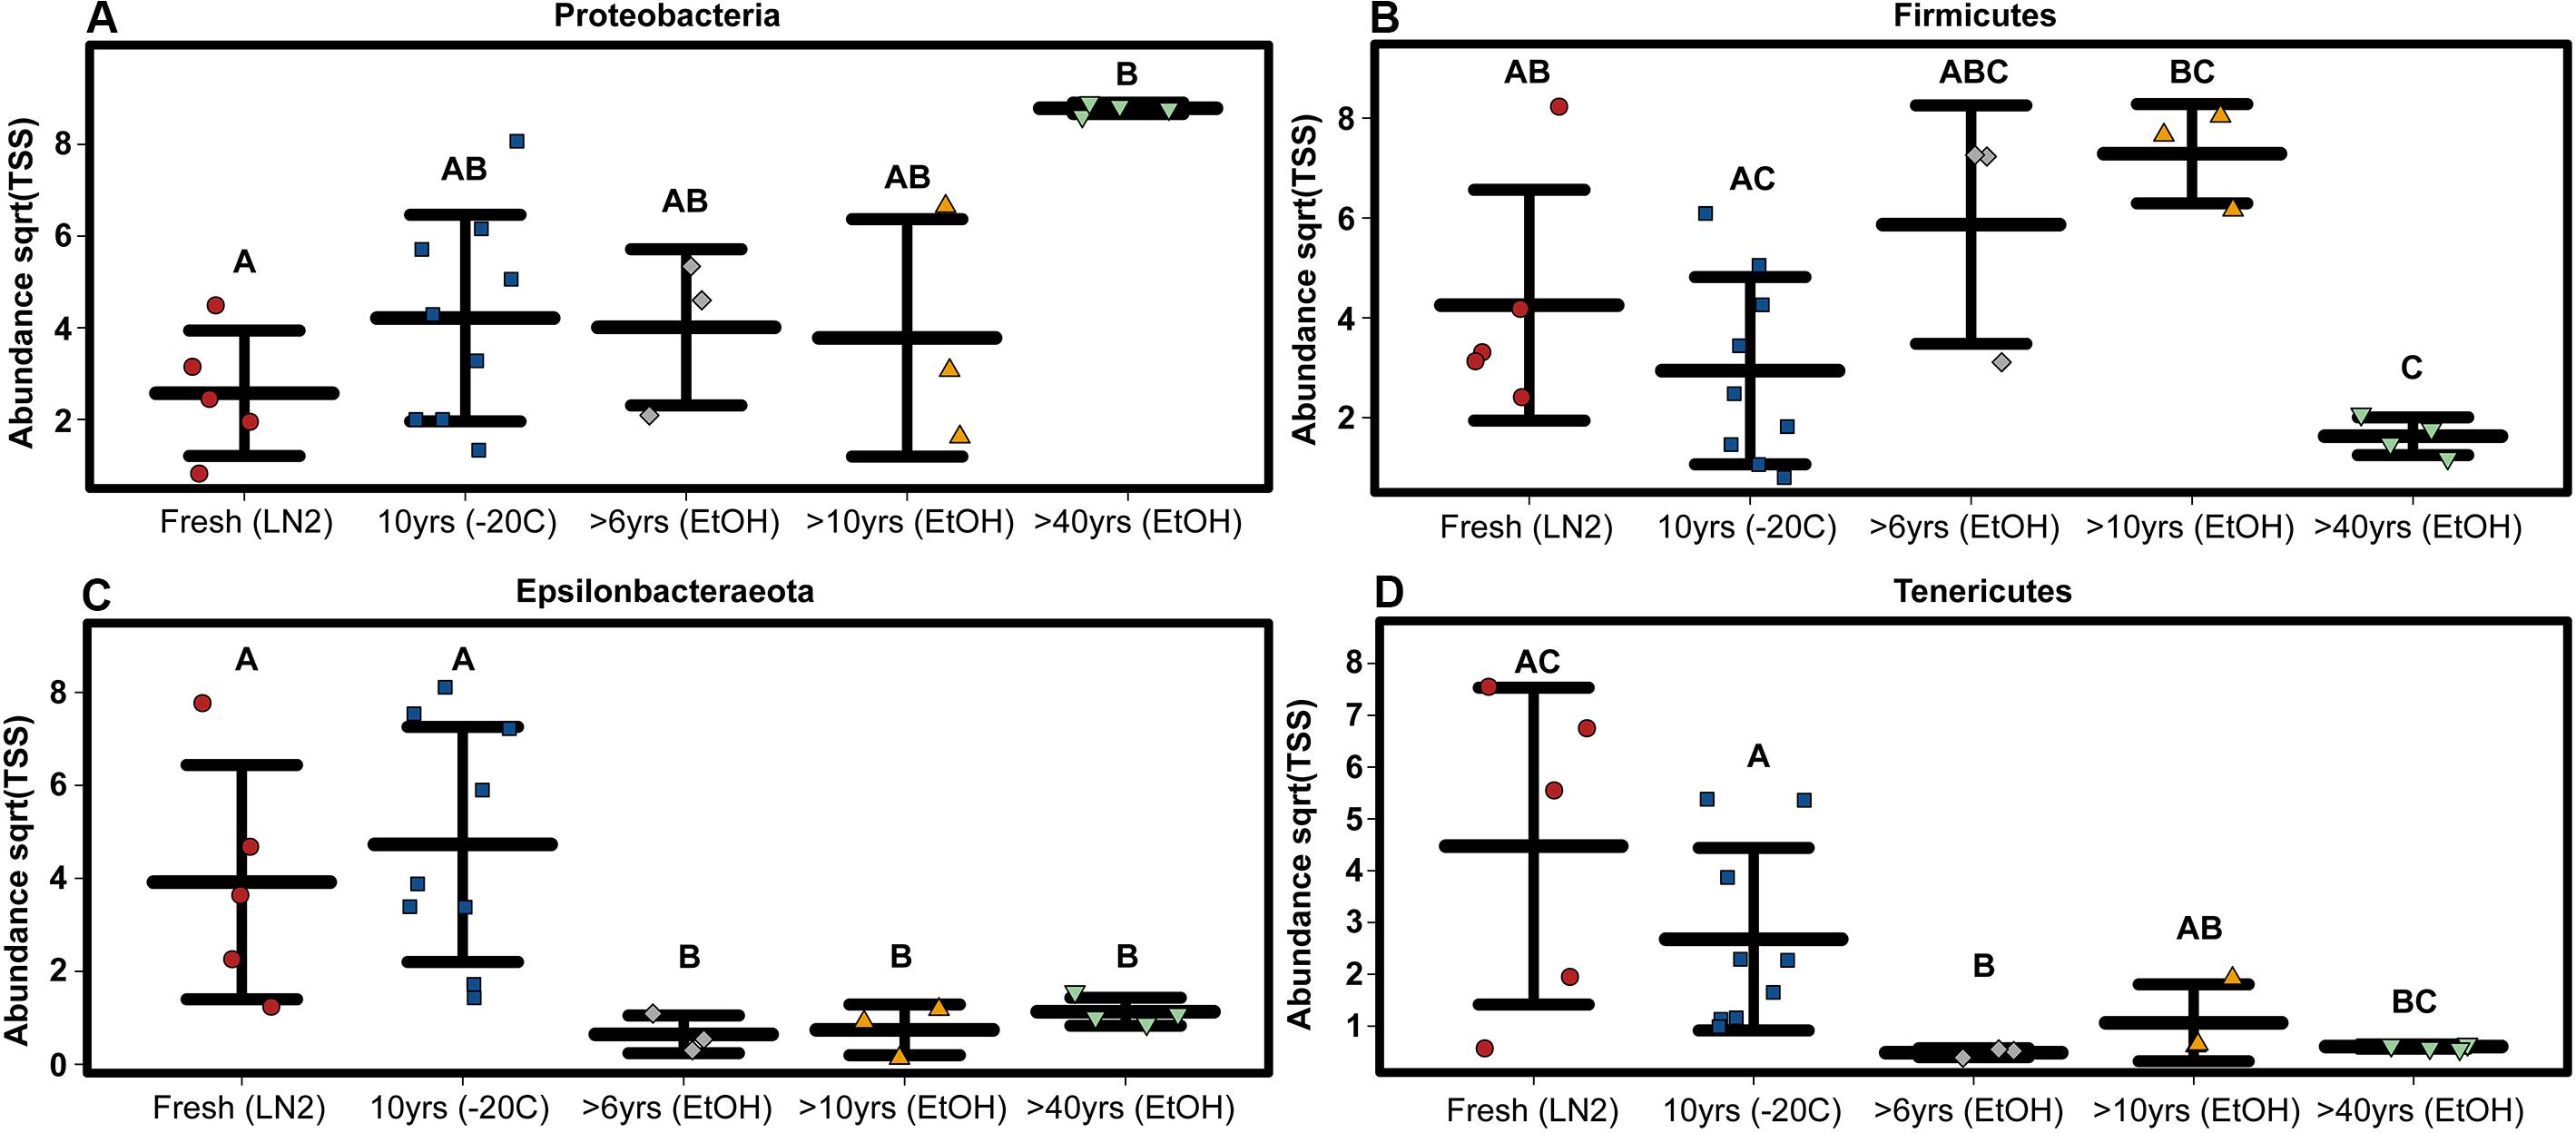
Figure 2. OTU based variation in phylum abundance across sample age for (A) Proteobacteria, (B) Firmicutes, (C) Epsilonbacteraeota, and (D) Tenericutes. Significant differences based on non-parametric Kruskal-Wallis tests (P < 0.05) are indicated by letters above the strips.
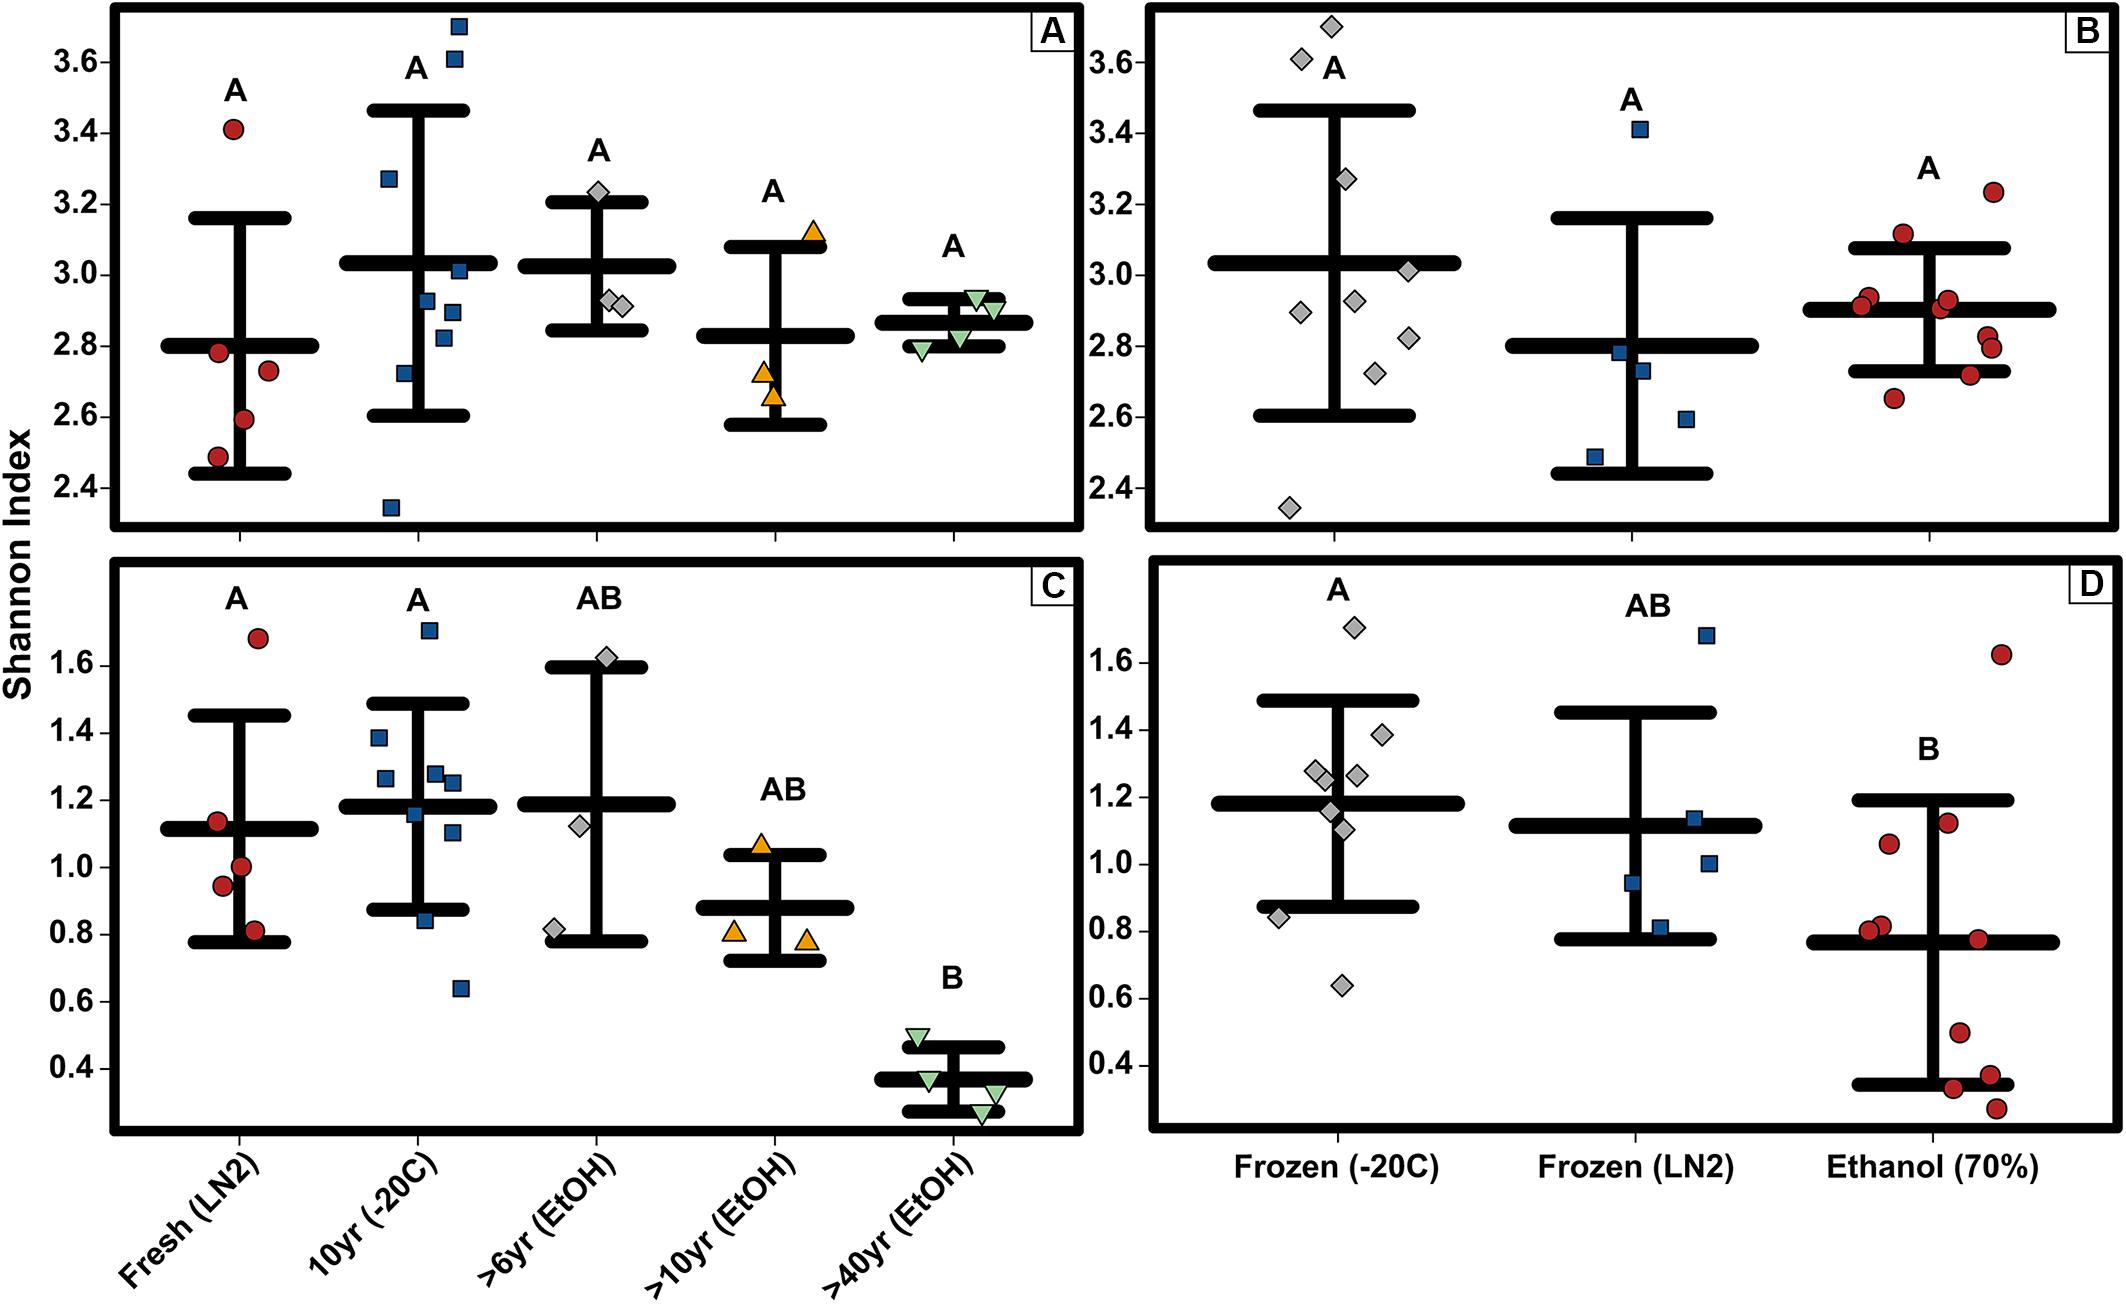
Figure 3. Alpha diversity strip charts constructed based on OTUs showing (A) bacterial OTU level Shannon diversity for sample age, (B) bacterial OTU level Shannon diversity for sample preservation type, (C) bacterial phyla level Shannon diversity for sample age, and (D) bacterial phyla level Shannon diversity for sample preservation type. Significant differences based on non-parametric Kruskal-Wallis tests (P < 0.05) are indicated by letters above the strips.
Microbiome Composition (ASV Based)
Composition of the bacterial community across samples did not vary greatly between OTUs and ASVs; the 5 major phyla identified by OTUs were the same based on ASVs (Figure 1). However, there were a few minor differences. First, alpha diversity (Shannon diversity index) of the whole GI tract microbial communities did not vary amongst sample age or preservation type at the bacterial ASV level or the bacterial phyla level, whereas it was significantly different at the bacterial phyla level based on OTUs. Second, only three of the same four phyla identified by OTUs to be significantly different across age groups were significantly different based on ASVs (Kruskal-Wallis: Epsilonbacteraeota P = 0.0029, FDR = 0.026; Tenericutes P = 0.0077, FDR = 0.046; Proteobacteria P = 0.02, FDR = 0.05) (Figure 4). Abundances of Firmicutes were not significantly different across age groups (P = 0.073, FDR = 0.13). Additionally, there were slight differences in what groups had significantly different abundances of these three phyla for ASVs compared to OTUs. When considering sample age, >40 year old ethanol preserved samples had significantly more Proteobacteria than contemporary samples in LN2 and 10 year old samples at −20°C (Kruskal-Wallis: P < 0.05); contemporary samples in LN2 and 10 year old samples at −20°C had significantly more Epsilonbacteraeota than all ethanol preserved samples, except between LN2 and >40 years ethanol samples (Kruskal-Wallis: p < 0.05); lastly, contemporary samples and 10 year old frozen samples had significantly greater numbers of Tenericutes than >6 year old ethanol samples (Wilcoxon rank: P < 0.05), and 10 year old frozen samples had significantly greater numbers of Tenericutes than >40 year old samples (Wilcoxon rank: P < 0.005) (Figure 4).
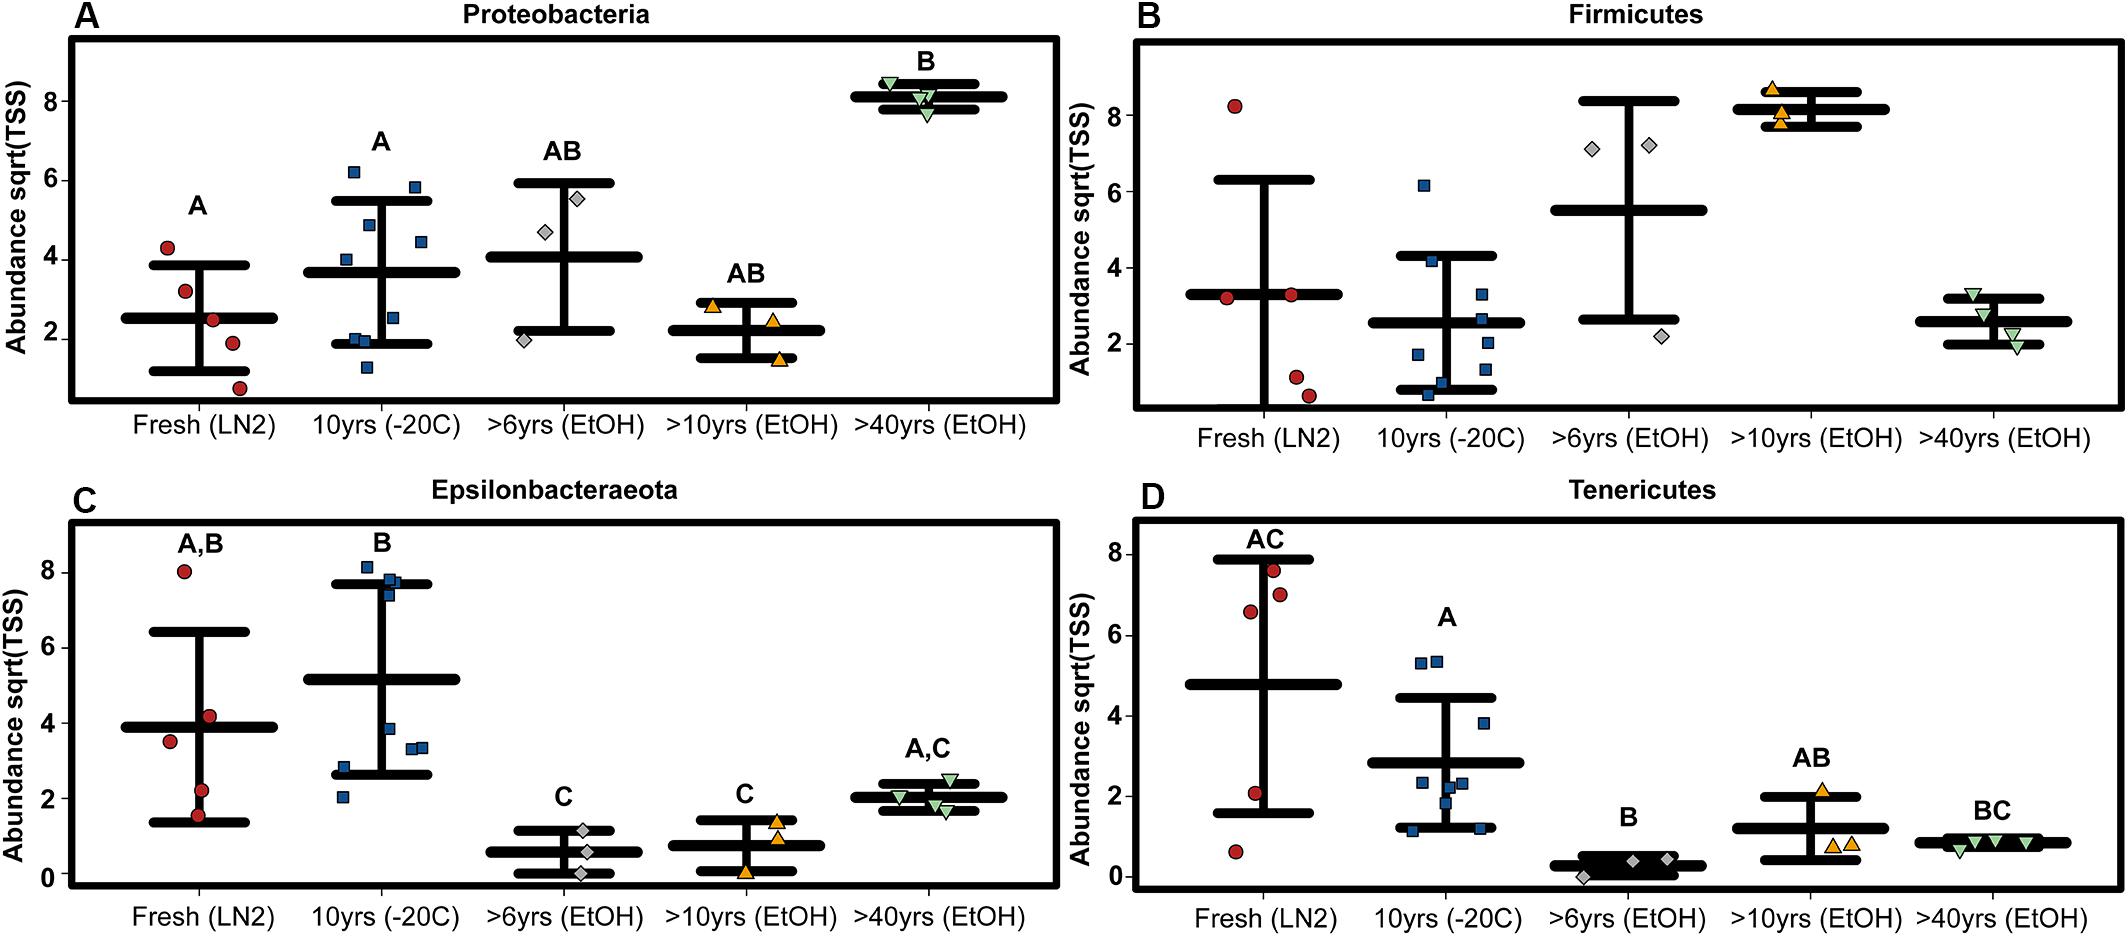
Figure 4. ASV based variation in phylum abundance across sample age for (A) Proteobacteria, (B) Firmicutes, (C) Epsilonbacteraeota, and (D) Tenericutes. Significant differences based on non-parametric Kruskal-Wallis tests (P < 0.05) are indicated by letters above the strips.
Beta Diversity Measurement (OTU Based)
Adonis multivariate analysis (analogous to PERMANOVA) performed on weighted Unifrac distances showed that GI microbial community composition varied based on sample age (r2 = 0.391, P < 0.001) and preservation type (r2 = 0.208, P < 0.005). A test for homogeneity of variance was significant for sample age (PERMDISP2: P < 0.001), but not sample preservation (PERMDISP2: P > 0.05), indicating that, at least for sample age, differences in bacterial communities could be due to differences in within-group dispersions instead of variation in centroid position (Figure 5A). Unweighted Unifrac distances were also significantly different based on sample age (r2 = 0.267, P < 0.001) and preservation type (r2 = 0.119, P < 0.005). However, similar to weighted Unifrac distances, a test for homogeneity of variance was significant for sample age (PERMDISP2: P < 0.001), but not sample preservation (PERMDISP2: P > 0.05) (Figure 5B). Therefore, it is possible that significant differences in bacterial community composition amongst sample ages is partially a result of high within-group variation, especially for fresh and 10-year old frozen samples. Hierarchical clustering utilizing both weighted and unweighted Unifrac distances based on sample age further iterate high within group variation (Figure 6). There appears to be less within group variation for >6 and >10-year old ethanol samples based on unweighted Unifrac distances (Figure 6A) compared with weighted Unifrac distances (Figure 6B).
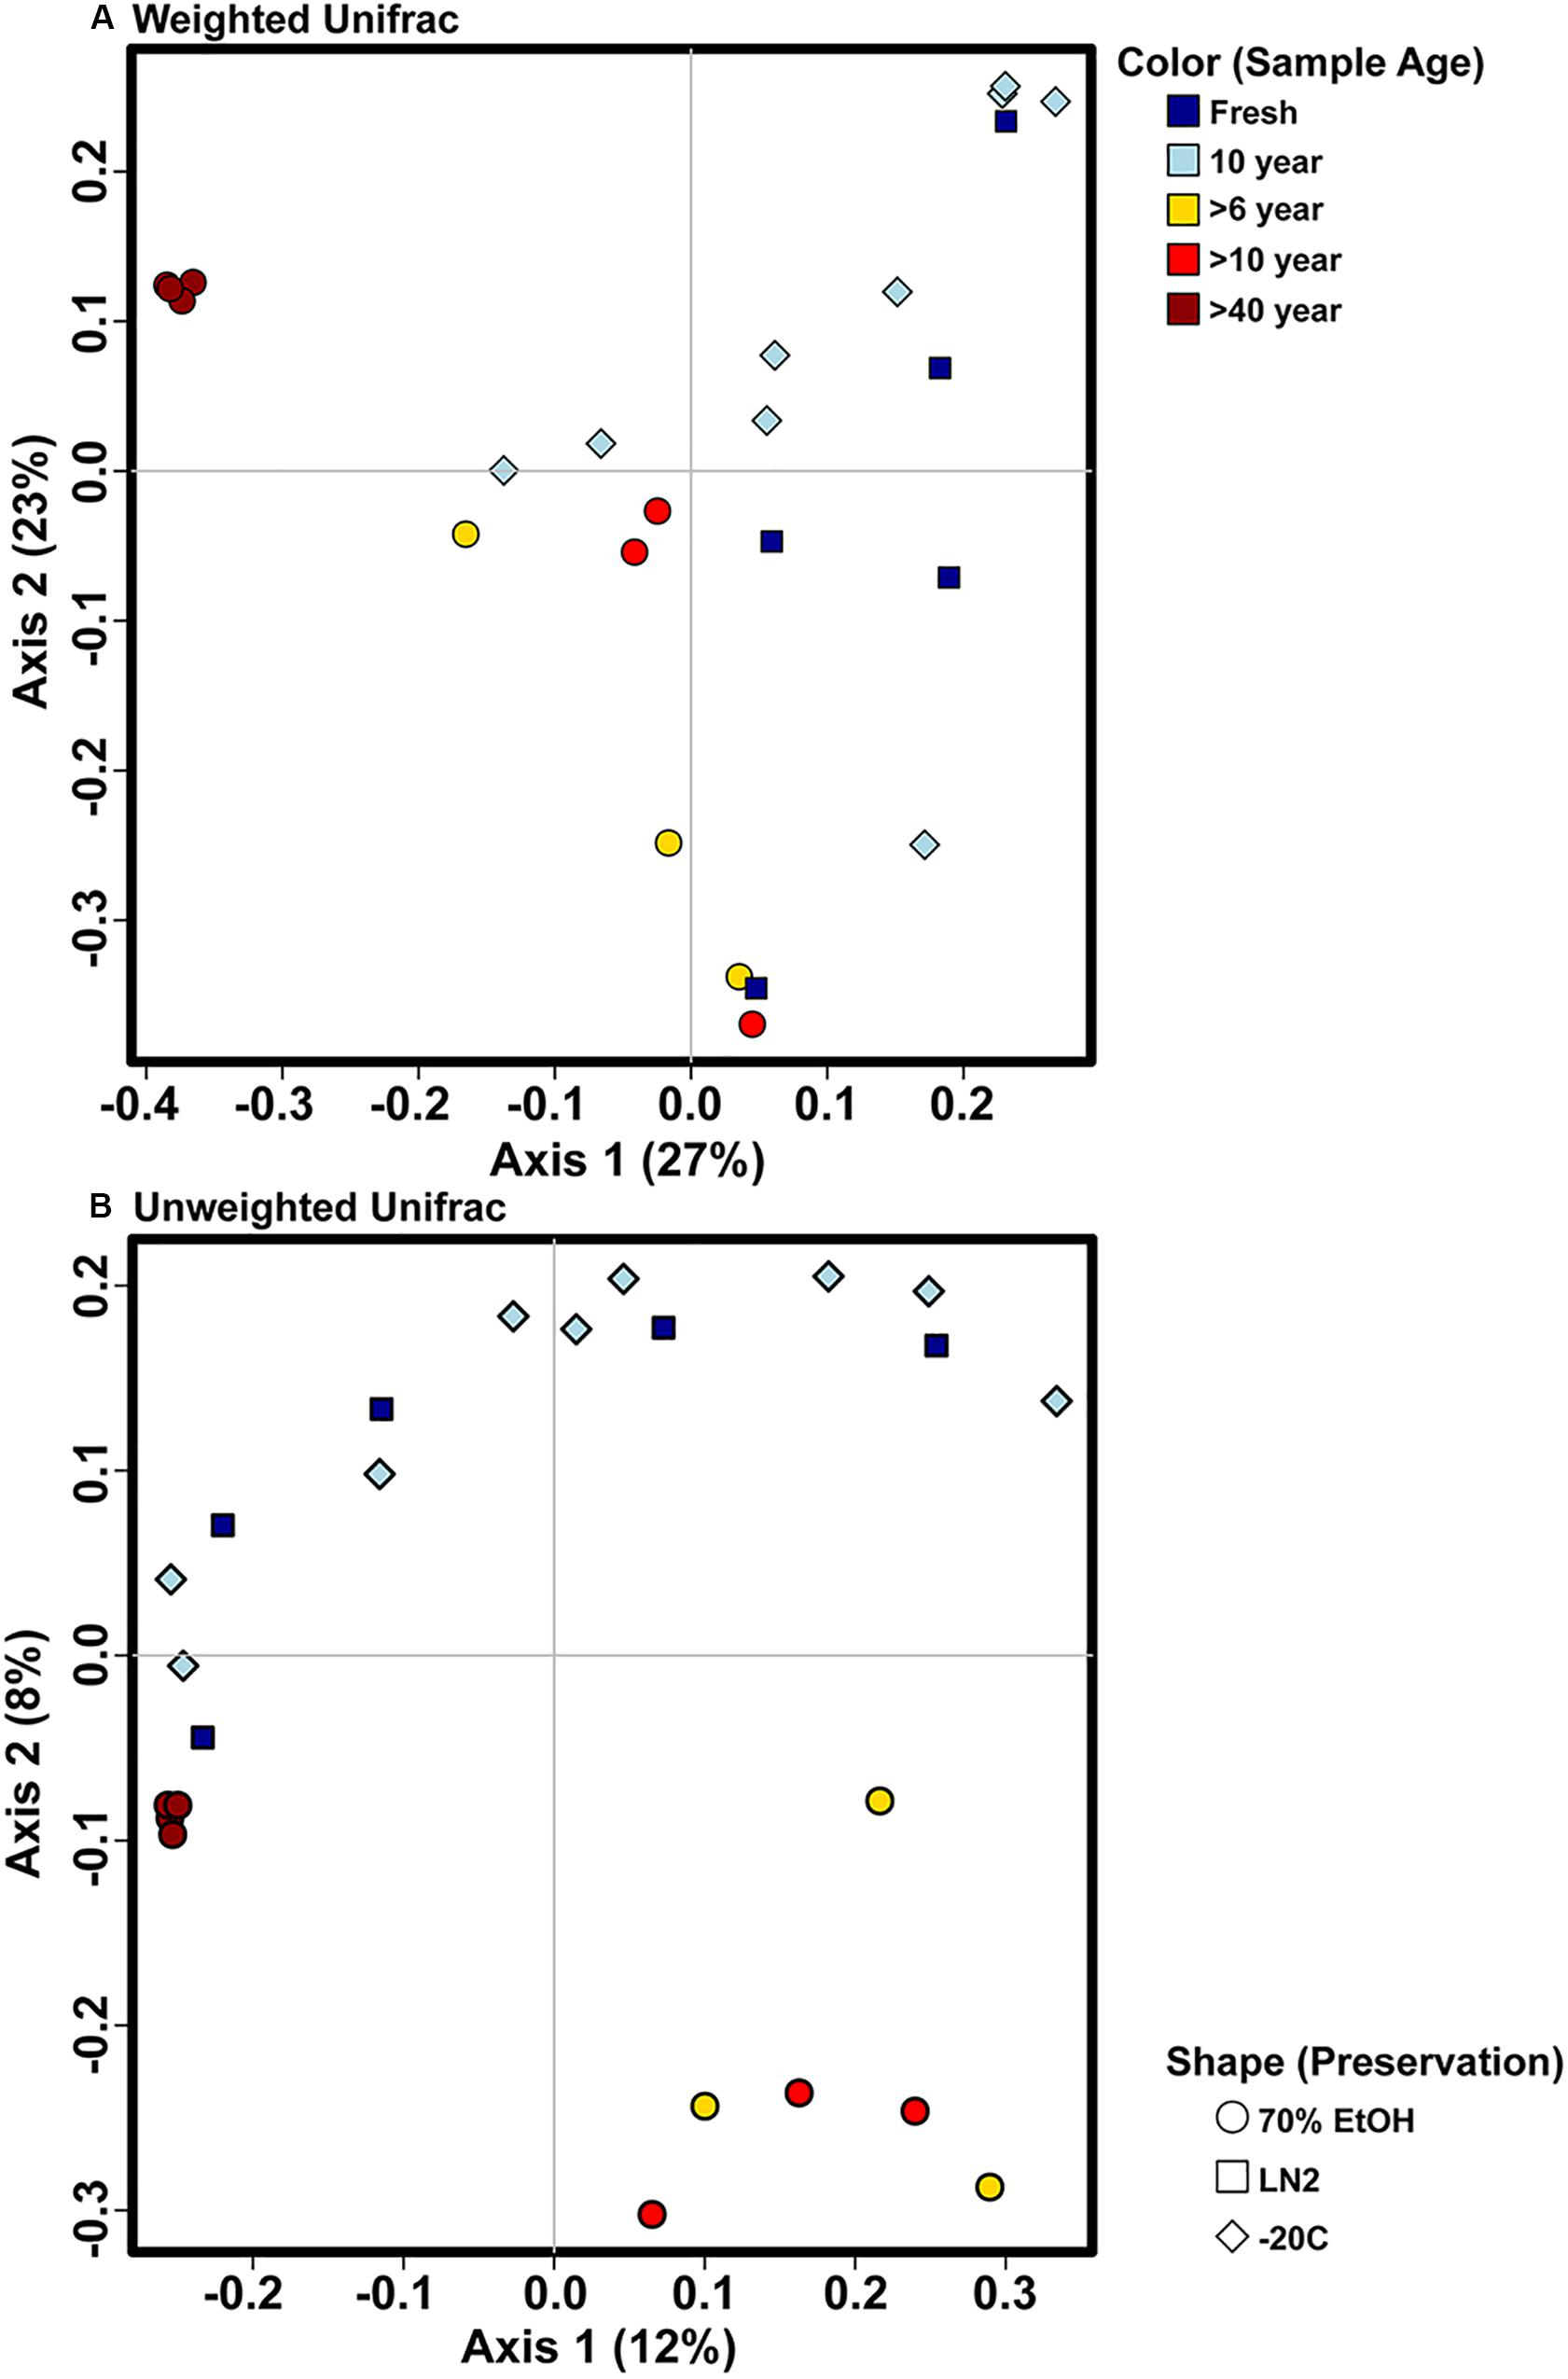
Figure 5. Principal coordinate analysis plots of OTU based (A) weighted and (B) unweighted Unifrac distances depicting bacterial beta diversity of intestinal samples of varying age and preservation. Color indicates the sample age, while shape indicates the preservation type.
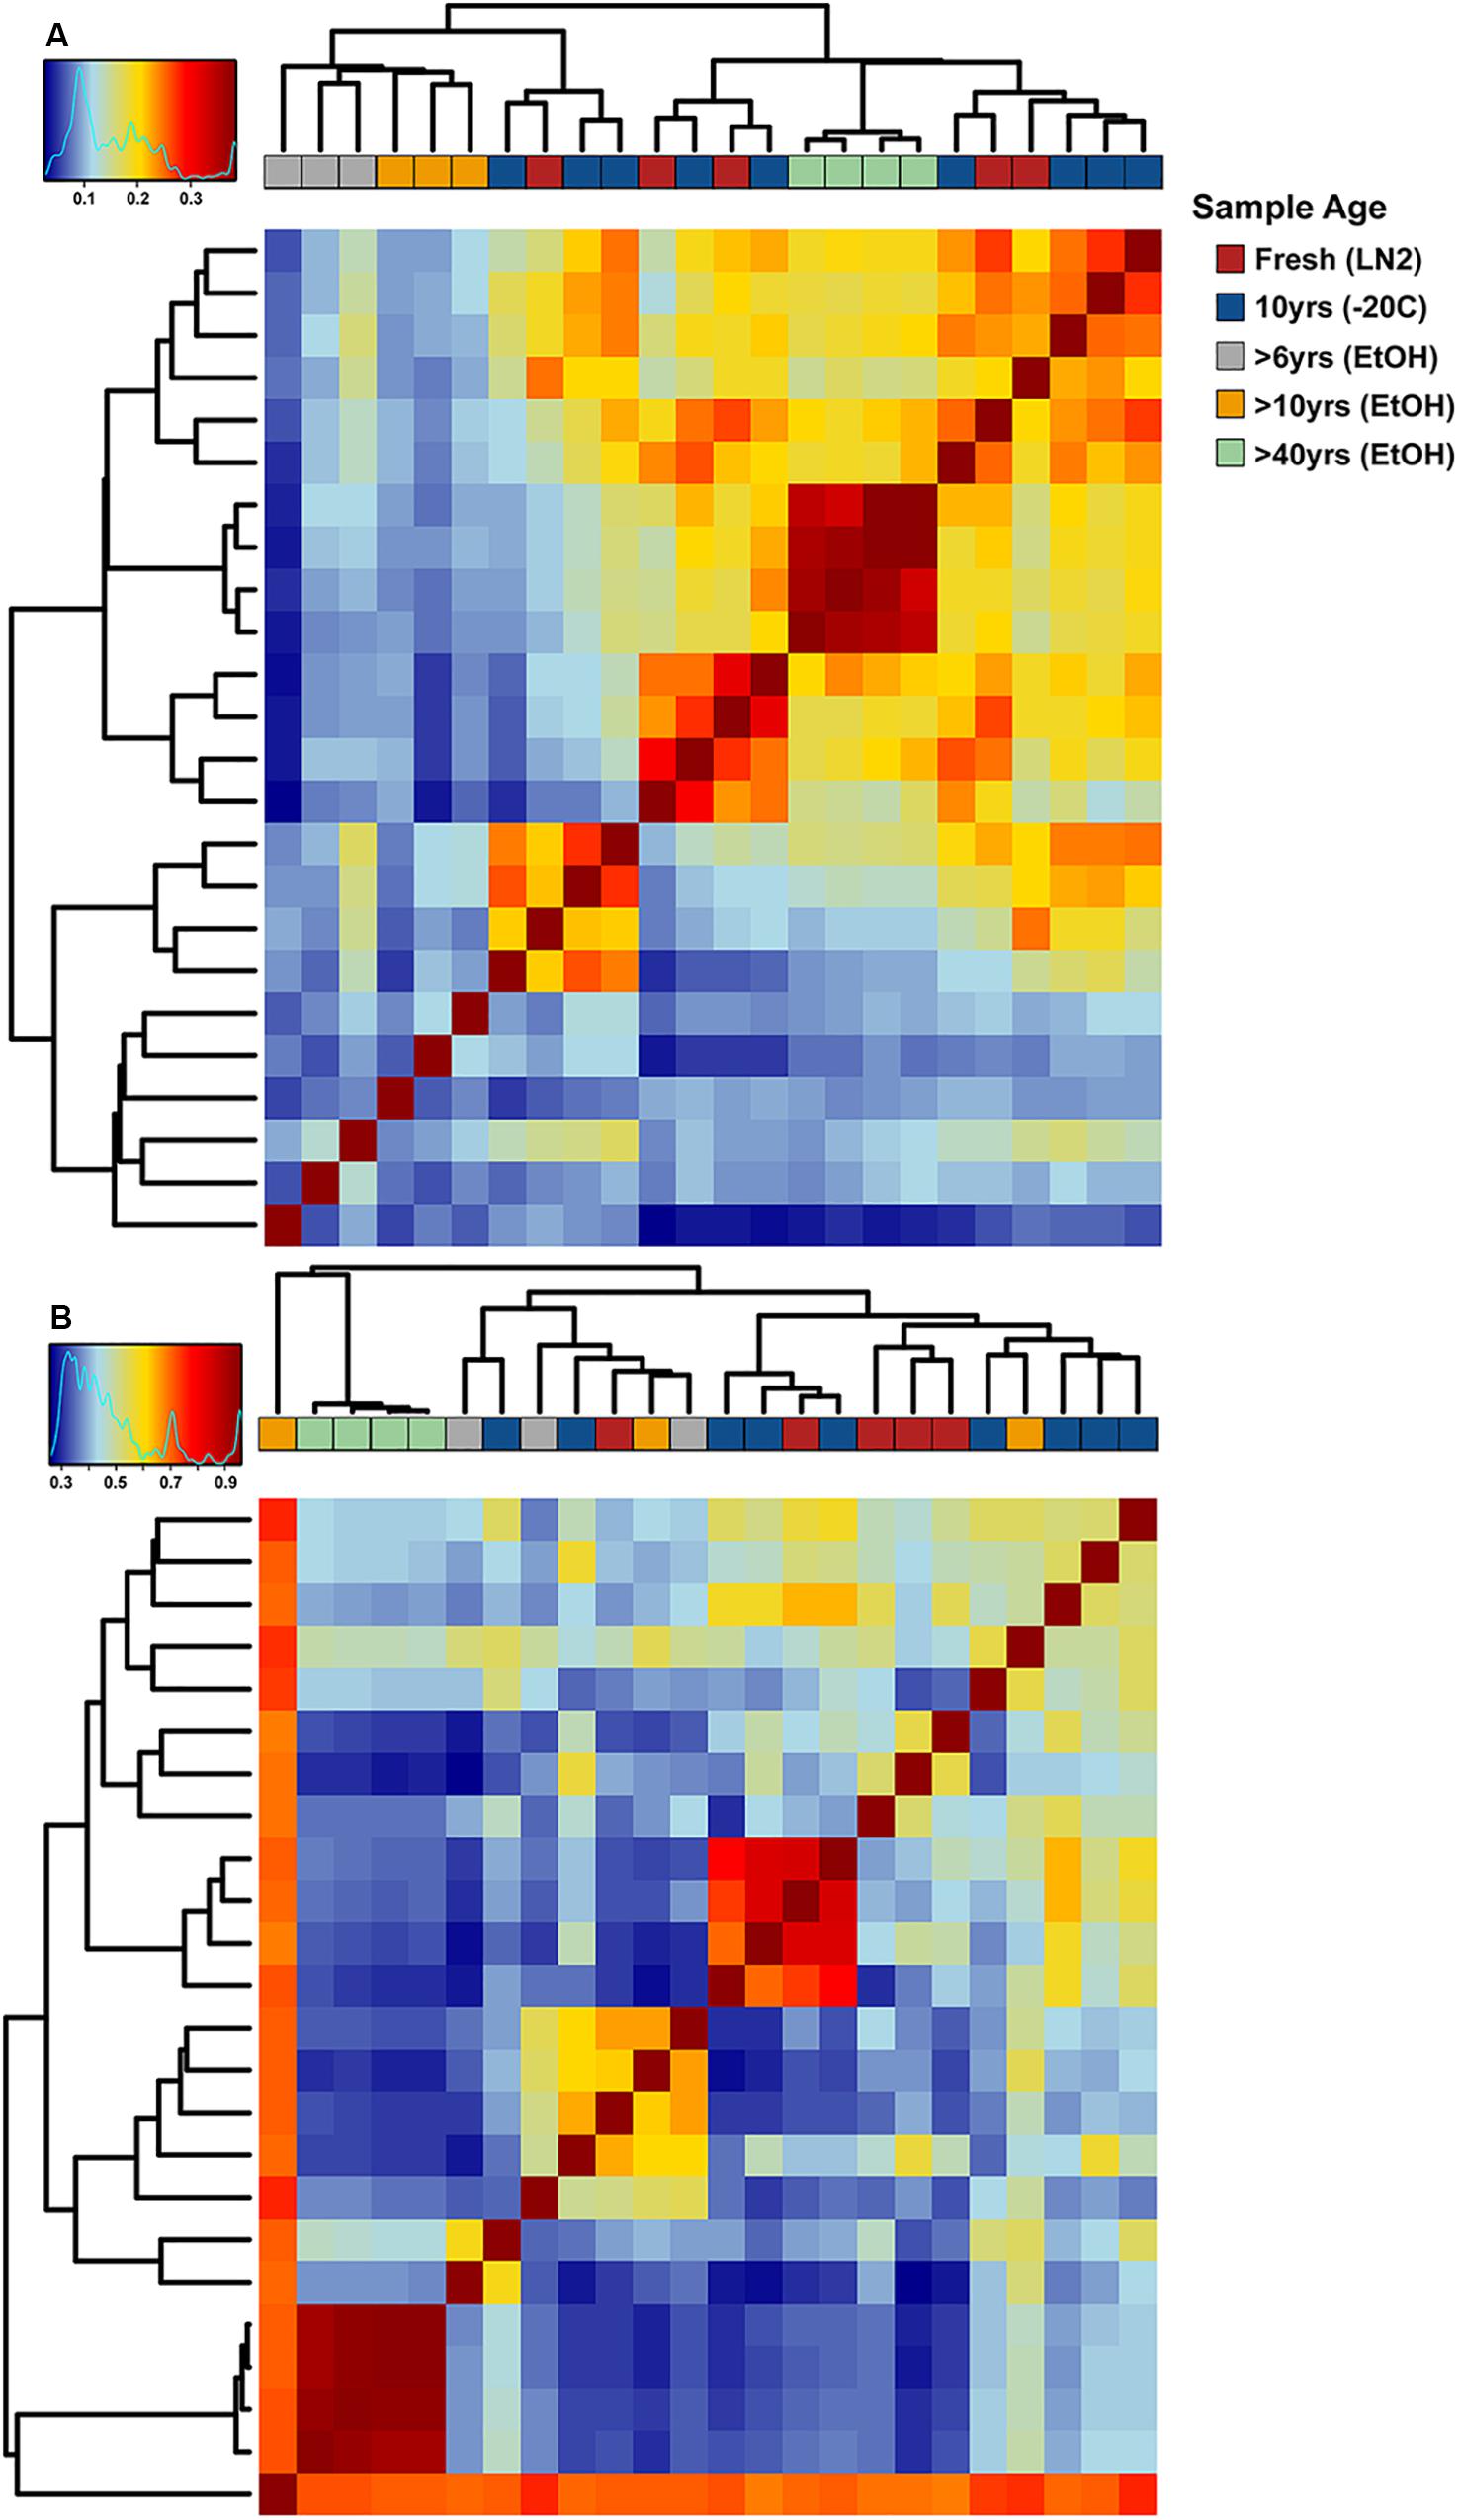
Figure 6. Hierarchical clustering-based heat maps of OTU based (A) unweighted and (B) weighted Unifrac distances depicting bacterial beta diversity of intestinal samples of varying age. Dendrograms depict relatedness of samples based on intestinal bacterial community composition at the OTU level, heat map indicates level of relatedness, where red indicates a positive correlation and blue a negative correlation.
Beta Diversity Measurement (ASV Based)
There were no major differences in the beta-diversity analyses between OTU based and ASV based analyses (Figures 5, 7). Adonis multivariate analysis performed on Bray-Curtis distances showed that GI microbial community composition varied based on sample age (r2 = 0.465, P < 0.001) and preservation type (r2 = 0.237, P < 0.001). A test for homogeneity of variance was significant for sample age (PERMDISP2: P = 0.006), but not sample preservation (PERMDISP2: P = 0.246), indicating that, at least for sample age, differences in bacterial communities could be due to differences in within-group dispersions instead of variation in centroid position (Figure 7A). Jaccard distances were also significantly different based on sample age (r2 = 0.404, P < 0.01) and preservation type (r2 = 0.201, P < 0.001). Similar to Bray-Curtis distances, a test for homogeneity of variance was significant for sample age (PERMDISP2: P < 0.001), but not sample preservation (PERMDISP2: P = 0.456) (Figure 7B). It is possible that significant differences in bacterial community composition amongst sample ages is partially a result of high within-group variation, especially for fresh and 10-year old frozen samples. Hierarchical Clustering utilizing both Bray-Curtis and Jaccard distances based on sample age further iterate high within group variation (Figure 8).
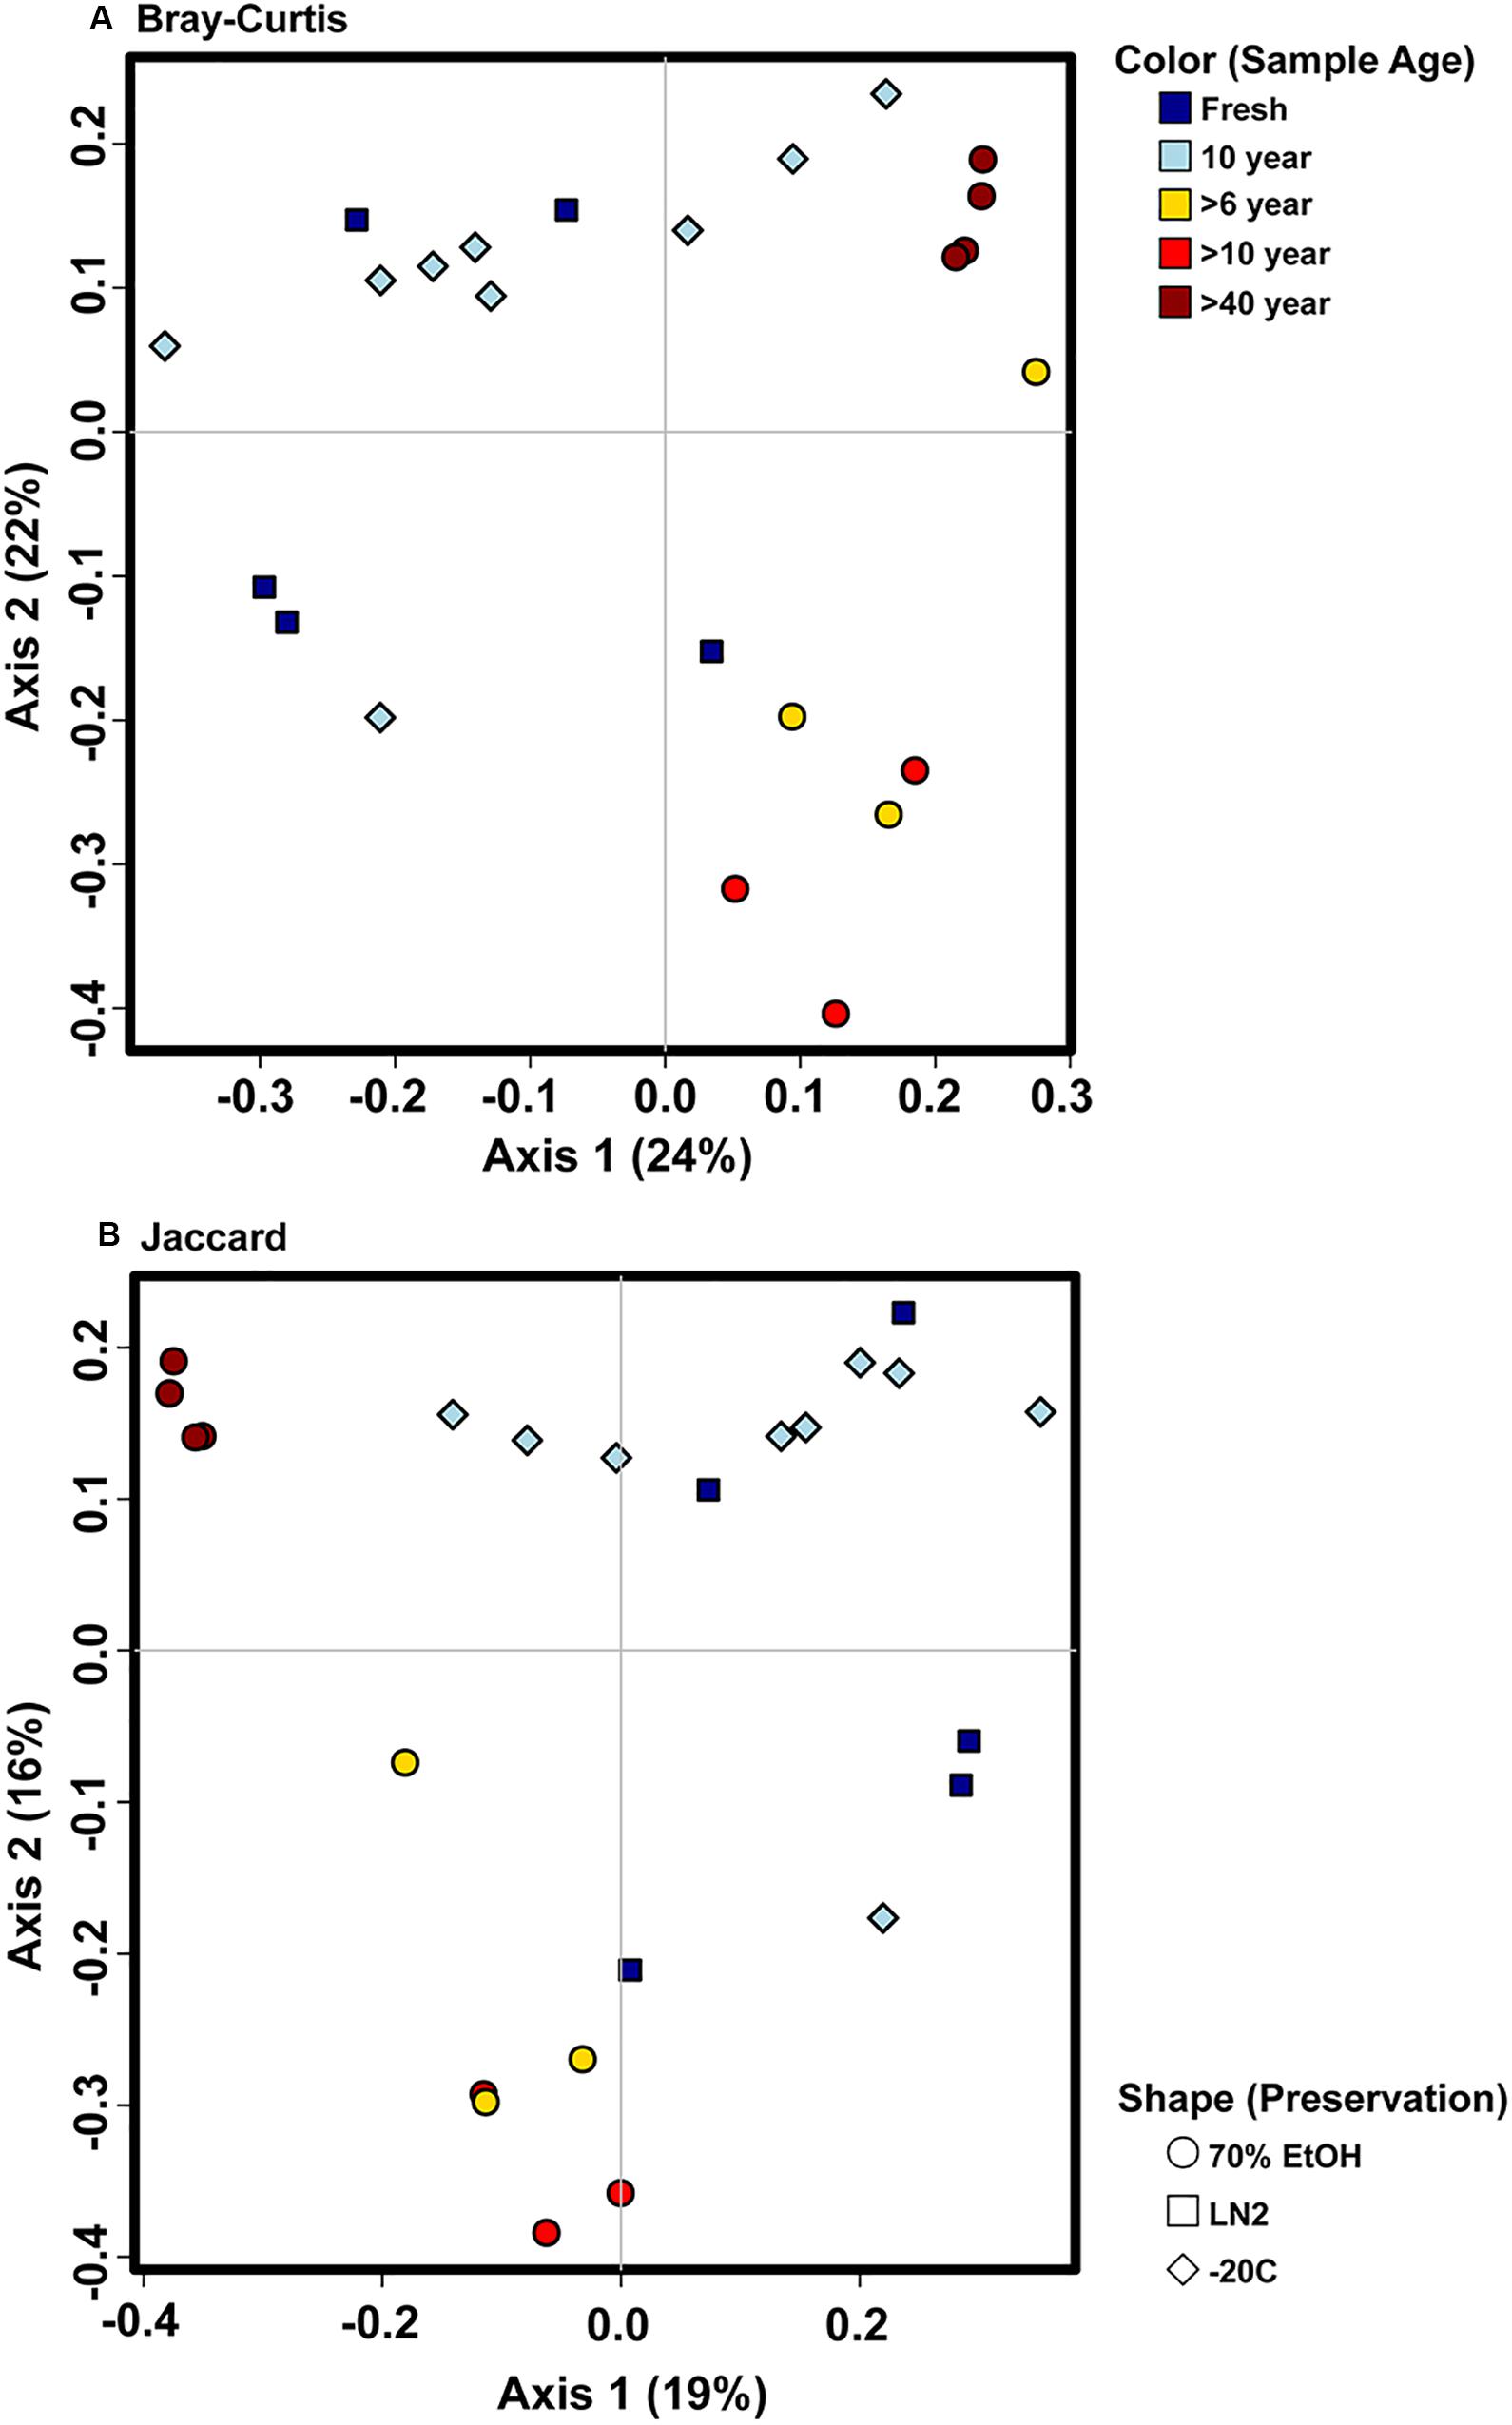
Figure 7. Principal coordinate analysis plots of ASV based (A) Bray-Curtis and (B) Jaccard distances depicting bacterial beta diversity of intestinal samples of varying age and preservation. Color indicates the sample age, while shape indicates the preservation type.
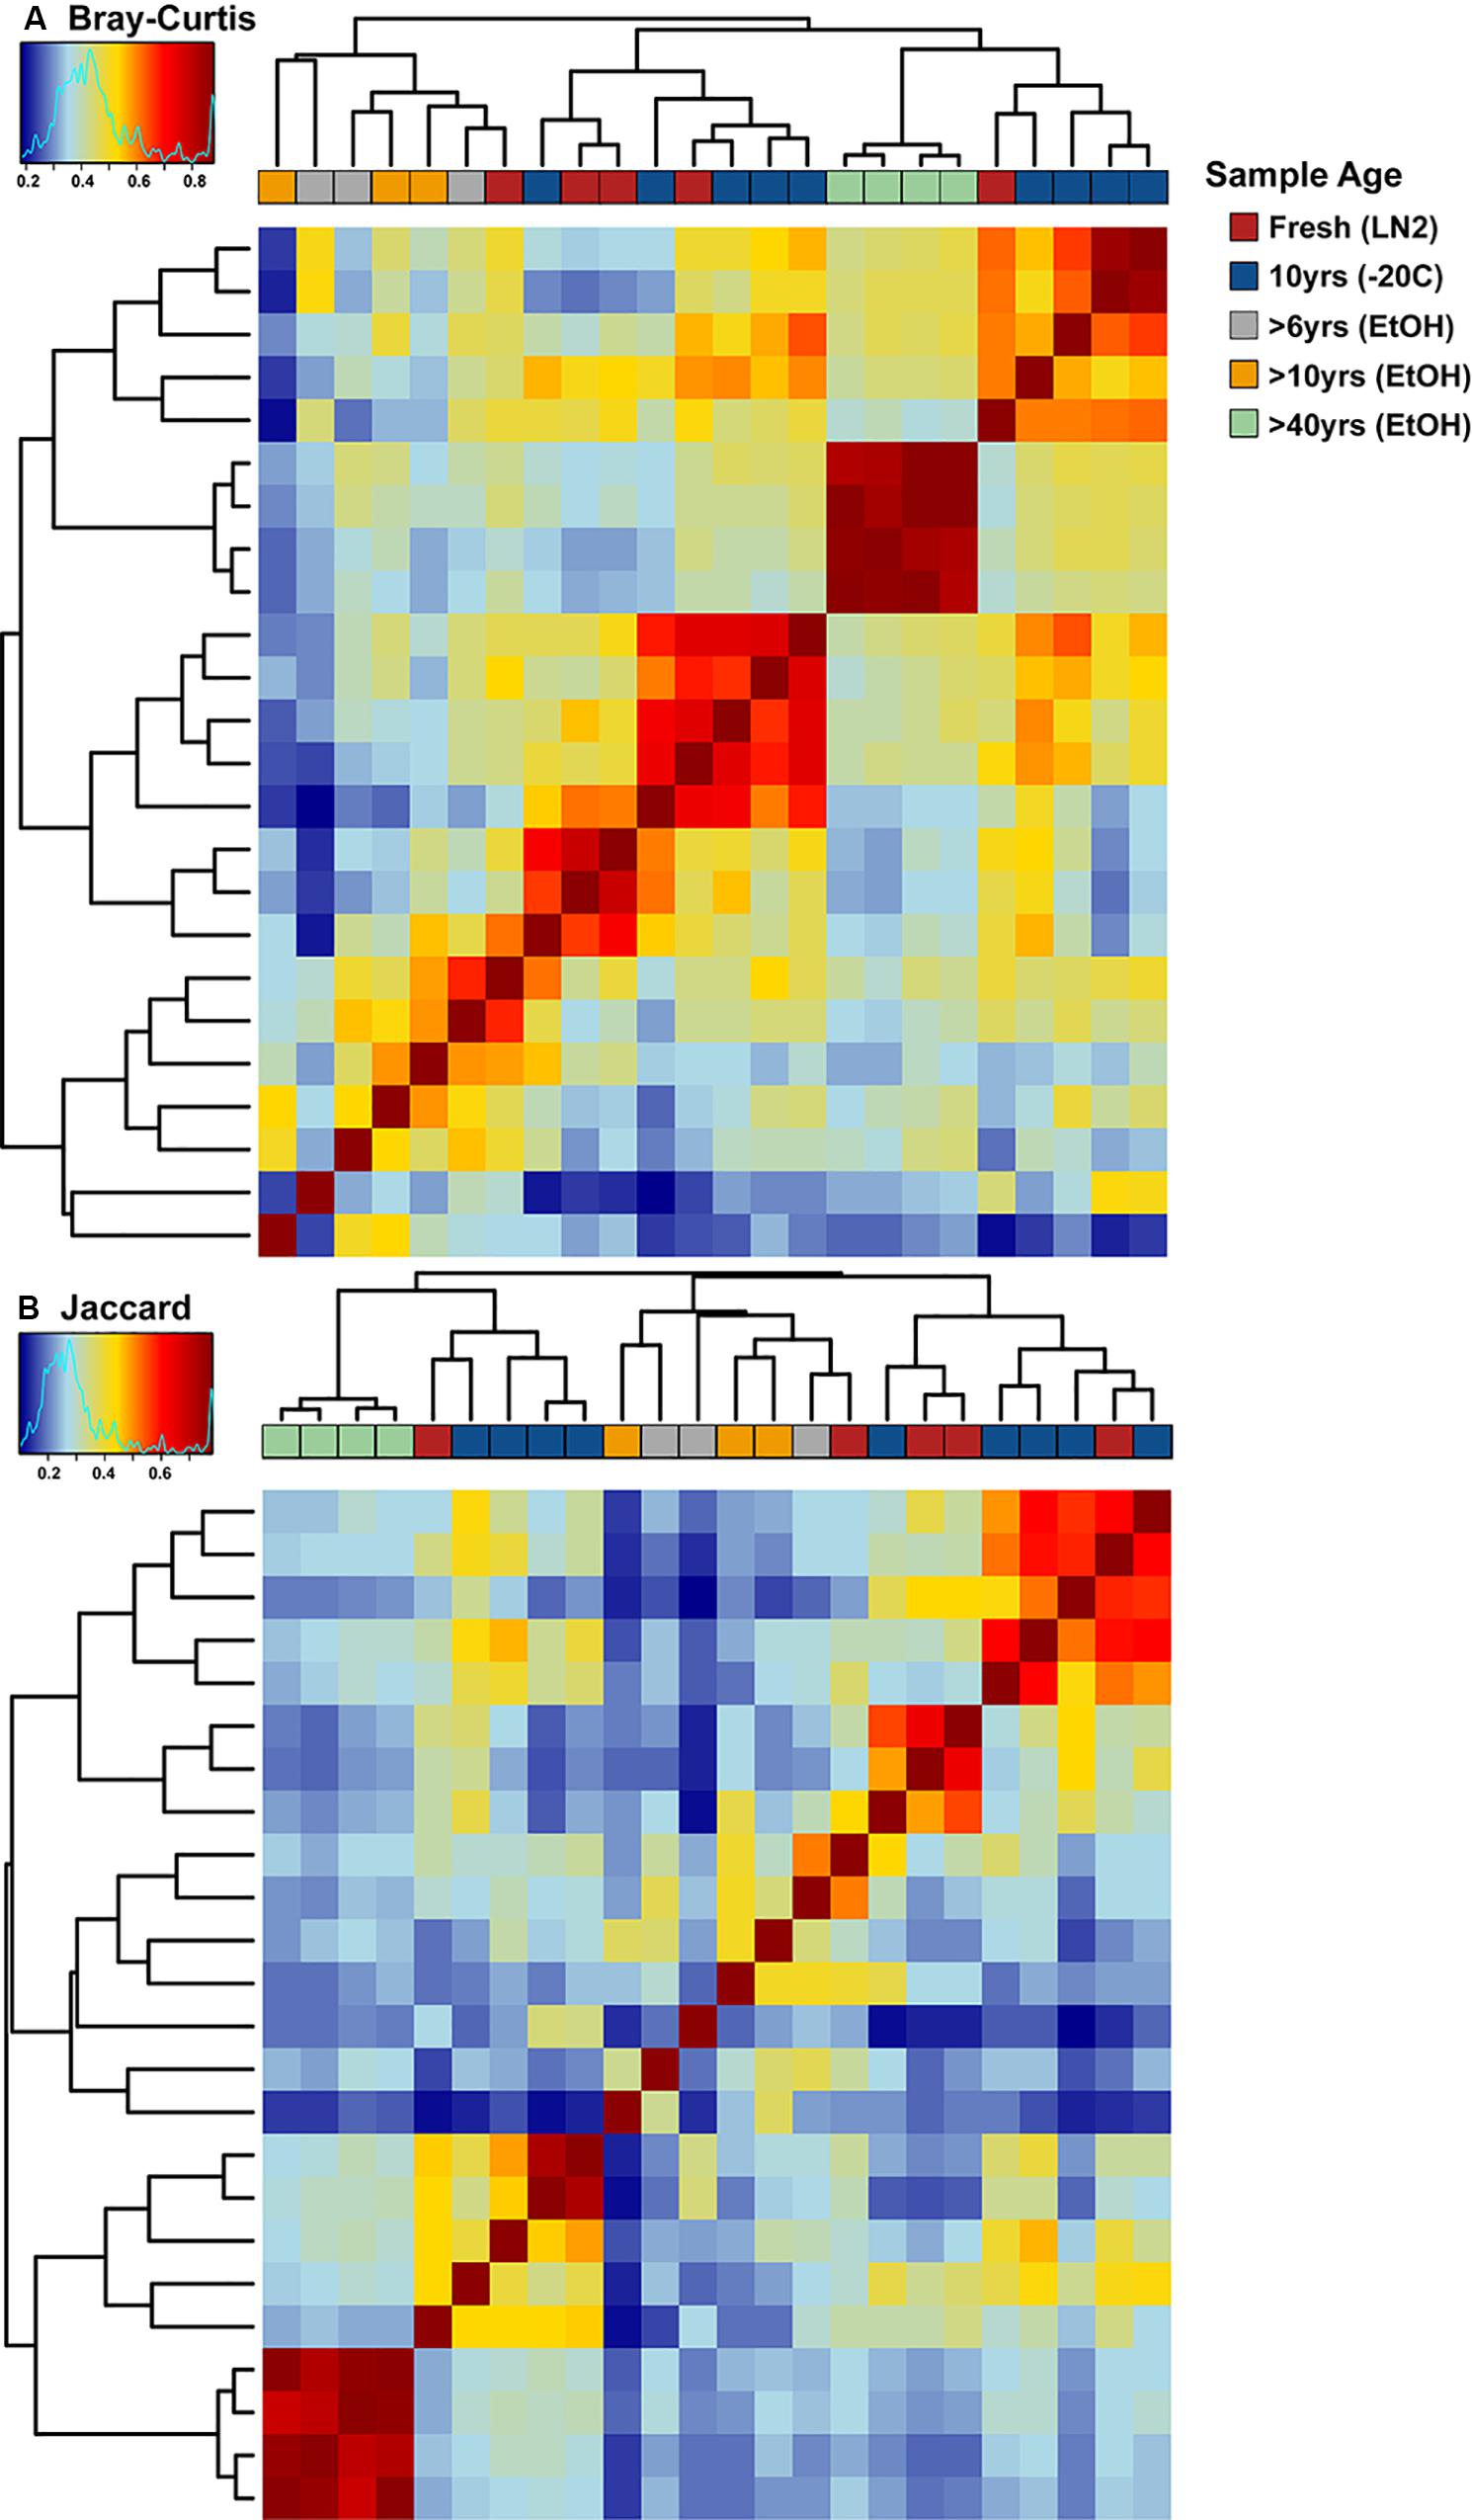
Figure 8. Hierarchical clustering-based heat maps of ASV based (A) Bray-Curtis and (B) Jaccard distances depicting bacterial beta diversity of intestinal samples of varying age. Dendrograms depict relatedness of samples based on intestinal bacterial community composition at the ASV level, heat map indicates level of relatedness, where red indicates a positive correlation and blue a negative correlation.
Discussion
Natural history collections have demonstrated massive potential for expanding our knowledge of global biodiversity, but only recently have their use expanded to documenting microbial symbionts of larger vertebrate and invertebrate hosts (Miller et al., 2020). In this study, we assessed the feasibility of obtaining 16S rRNA microbial amplicon sequence data from mammalian GIs stored within natural history collections and compared OTU and ASV based analyses. Both ASV and OTU based analyses came to similar conclusions, with minor differences related to phyla-level abundances and alpha diversity values. ASVs found no significant differences in Shannon diversity indices across age groups, while OTUs identified significantly fewer phyla in >40 year old ethanol preserved samples. ASVs may be the best analytical choice, given they have been found to be more reproducible and reusable across studies, as they are not arbitrary in their clustering of taxa based on some similarity threshold (Callahan et al., 2017). Similar to Heindler et al. (2018), we successfully obtained microbial sequence data from museum samples of varying age and preservation. The 16S rRNA microbial sequence data from ethanol preserved shrew GIs ranging in age from 6 to 50 years old resulted in significantly different bacterial communities compared with contemporary samples. Data on the bacterial community composition of 10-year old frozen (−20°C) samples proved to be most similar to contemporary samples fixed in LN2 (Figures 5–8). The overall profile of bacterial phyla, especially for our contemporary samples, is similar to one of the two shrews sampled in the only other published study of microbiomes from freshly captured shrews, with minor differences (Knowles et al., 2019; Figure 1). Knowles et al. (2019) found that the gut bacterial community of Sorex araneus from Lithuania consisted of ∼50% Proteobacteria, 15% Tenericutes and then a mix of other phyla (including a significant proportion of Firmicutes). However, Knowles did not separate the Proteobacteria and Epsilonbacteraeota. The Class Epsilonproteobacteria was originally part of the Proteobacteria, but recently was proposed as an independent phylum (Epsilonbacteraeota) based on genomic data (Waite et al., 2017). Subsequently, Waite et al. (2018) proposed to rename Epsilonbacteraeota to Campylobacterota. Therefore, in our work (and based on the Silva database) the Epsilonproteobacteria were placed in the phylum Epsilonbacteraeota, further reducing the overall proportion of Proteobacteria within our samples. Knowles et al. (2019) sequenced a second shrew species, Sorex minutus, which had a GI microbiome dominated by Firmicutes. This difference in gut bacterial composition was attributed mostly to the large differences in diet between S. araneus and S. minutus.
Similar to our study, Knowles et al. (2019) DNA-extracted the whole GIs of their shrew samples, thus obtaining a more complete picture of the gut microbiome. This is only possible given the small size of shrews and the presence of a simple gut. Larger “small” mammals, like many rodents, have more complex GIs consisting of a defined small intestine, cecum, and large intestine, and therefore it is less feasible to extract the entire GI tract. Given that different sections of the GI tract harbor different bacterial symbionts, it’s highly recommended that subsections of the upper and lower small intestine, and upper and lower large intestine are sampled for microbial characterization (e.g., Zhao et al., 2015; Wilkinson et al., 2017; Crespo-Piazuelo et al., 2018).
Although we found significant differences in the gut microbial community of museum archived samples compared with contemporary samples, these differences may reflect more than simply preservation bias. A substantial number of studies have shown that environmental conditions can impact the intestinal microbiome (e.g., Giatsis et al., 2015; Jin et al., 2017; Rothschild et al., 2018). Unfortunately, it would be impossible to control for all abiotic and biotic factors that can contribute to microbiome variation in a natural setting over such a long period of time. To reduce variation, 15 of our 24 samples were collected from exactly the same location, and only a month apart. This includes our contemporary samples fixed in LN2 (collected in August 2016) and our 10 year old frozen samples (collected in September 2009). For the >40-year old samples in our study, there was little among sample variation (i.e., in-group variation; n = 4) in microbial communities (especially compared with contemporary or even 10-year old frozen samples). Low in-group variation may reflect loss of diversity over time in preserved specimens or contamination from preservative fluid that tended to homogenize microbiomes. Expanded analyses across a greater number of samples and over longer time periods, in addition to sequencing preservative fluid, may provide a means for unraveling the relative low variability among these historical microbiomes and better controlling for abiotic or biotic conditions that could also impact microbial composition.
Natural history collections are vital resources for revealing past patterns of global biodiversity (Galbreath et al., 2019). However, past surveys are not enough to predict the future impacts that anthropogenic environmental change will have on current distributions of these organisms, and therefore contemporary specimen-based surveys remain necessary. This is especially important for documenting vertebrate/invertebrate symbioses, like bacterial microbiomes. To maximize the utility of contemporary specimen-based surveys, we need to consider the “holistic specimen” (Cook et al., 2016). For example, with mammals, it is important to not only collect and preserve traditional voucher specimens with cryopreserved tissues, but also collect data and samples on its diet (e.g., direct examination, stomach/GI metagenomics profiling, or stable isotopes), symbionts (e.g., viruses, bacteria, fungi, protozoans, helminths), environmental conditions, etc., Collection of the “holistic specimen” allows for deeper understanding of multi-species level community dynamics. This is critical for unraveling the roles intestinal microbes play within a host and its environment. For example, helminth-microbe interactions are becoming a key area of research interest (Cortés et al., 2019) and having direct helminth samples and data associated with individual host samples within natural history repositories, provides the means for unraveling these complex natural interactions across time and space (Galbreath et al., 2019).
Conclusion and Recommendations
While our main goal was to examine the feasibility of accurately characterizing the gut microbiome of shrews from museum archived samples, it is clear that samples collected from freshly captured shrews that were immediately frozen in LN2 provided superior results, followed by samples held frozen (whether still retained in the host, or presumably if frozen separately, but this was not tested). Therefore, future sampling efforts should consider the long-term preservation of gut samples, even if just a section of the GI tract can be subsampled. However, as mentioned above, different sections of the GI from small to large intestine have varying bacterial associations, and therefore multiple subsections along the GI tract should be taken to maximize our understanding of the GI tract microbial community. This can be best accomplished by fixing and storing GI tract samples separate from the host voucher, in either liquid nitrogen or at −80°C. If that is not possible the next best option would be to remove and immediately freeze the GI tract (at −20°C or colder), as our 10-year old frozen samples were most similar to fresh samples frozen in LN2. Although we did not test microbial DNA-stabilizing preservatives, like DNA/RNA shield (Zymo Research, Irvine, CA), it is important to note that future studies should look at the suitability of storing gut samples in these preservatives and later freezing at −80°C or −20°C when possible as an alternative to flash freezing in LN2.
As shown elsewhere (e.g., Choo et al., 2015; Debelius et al., 2016; Ingala et al., 2018; Hagan et al., 2019), a diverse set of factors can influence community composition of gut microbiomes, including, but not limited to, DNA extraction type, sample type (fecal, intestinal, etc.), preservation, and sequence run. Our study explored age and type of preservation and we also observed bacterial community composition differences across samples potentially complicating the rigorous and biologically informative comparisons amongst gut microbiomes. Fresh gut samples preserved in liquid nitrogen and 10-year old samples frozen at −20°C had similar bacterial community composition, however, they differed significantly from all samples preserved in 70% ethanol, regardless of age (when using unweighted Unifrac distances; Figures 4, 5). The >40 year-old samples had the lowest microbe diversity and community composition differed substantially from all other preserved samples (Figure 3). We also observed substantial intra-group variation in community composition, especially within fresh and 10 year-old frozen samples. Standardizing field sampling and preservation methodologies (Ingala et al., 2018) help ensure biologically informative comparative analyses. Overall, we were able to obtain quality 16S rRNA sequence data from museum archived samples preserved in 70% ethanol up to 50 years old (the oldest samples included in our study). However, the resulting bacterial communities reconstructed from the sequence data proved to be significantly different between our archived samples and contemporary samples. It is therefore difficult to make direct comparisons across samples; however, sequencing the microbiomes of the fluid used to preserve specimens (i.e., ethanol) may provide insights into the source microbiomes of potential contaminants and these could be removed in silico to allow further insights and comparison across sample types. Future works sequencing a larger number of samples of varying ages is necessary for stronger comparisons. Lastly, it has also been found that although preservation technique can alter the microbial community composition, assessing this does not always rise to the level of obscuring individual identity; therefore, use of older archived museum samples for microbiome analyses can still be feasible and provide a much deeper temporal sampling framework to studies (Blekhman et al., 2016).
Data Availability Statement
Machine-processed sequencing output obtained in this study can be found in the NCBI SRA under BioProject PRJNA605349. The link to the United States Geological Survey data release is provided in Greiman et al. (2020).
Ethics Statement
The animal study was reviewed and approved by IACUC, University of New Mexico I18014.
Author Contributions
SG, JC, SL, DM, SS, and ST conceived and designed the study. SG, TO, KC, SL, DM, and SS aided in data acquisition and analysis. SG and JC led writing the manuscript. All authors contributed to the overall content of the manuscript and read and approved the final manuscript.
Funding
This project was funded in part by a National Science Foundation Postdoctoral Fellowship in Biology (1523410) awarded to Stephen Greiman, NSF 1258010 and 0415668, and by the United States Geological Survey.
Conflict of Interest
The authors declare that the research was conducted in the absence of any commercial or financial relationships that could be construed as a potential conflict of interest.
Acknowledgments
We thank the Museum of Southwestern Biology for the specimen loan and the original collectors for permanently preserving these materials for the benefit of other scientists. We thank B. Pierson for data archival and metadata production. Any use of trade, firm, or product names is for descriptive purposes only and does not imply endorsement by the United States Government.
Supplementary Material
The Supplementary Material for this article can be found online at: https://www.frontiersin.org/articles/10.3389/fevo.2020.555386/full#supplementary-material
References
Amato, K. R., Sanders, J. G., Song, S. J., Nute, M., Metcalf, J. L., Thompson, L. R., et al. (2019). Evolutionary trends in host physiology outweigh dietary niche in structuring primate gut microbiomes. ISME J. 13, 576–587. doi: 10.1038/s41396-018-0175-170
Bannikova, A. A., Chernetskaya, D., Raspopova, A., Alexandrov, D., Fang, Y., Dokuchaev, N., et al. (2018). Evolutionary history of the genus Sorex (Soricidae, Eulipotyphla) as inferred from multigene data. Zool. Scripta 47, 518–538. doi: 10.1111/zsc.12302
Blekhman, R., Tang, K., Archie, E. A., Barreiro, L. B., Johnson, Z. P., Wilson, M. E., et al. (2016). Common methods for fecal sample storage in field studies yield consistent signatures of individual identity in microbiome sequencing data. Sci. Rep. 6:31519.
Burgin, C. J., Colella, J. P., Kahn, P. L., and Upham, N. S. (2018). How many species of mammals are there? J. Mammal. 99, 1–14. doi: 10.1093/jmammal/gyx147
Callahan, B. J., McMurdie, P. J., and Holmes, S. P. (2017). Exact sequence variants should replace operational taxonomic units in marker-gene data analysis. ISME J. 11, 2639–2643. doi: 10.1038/ismej.2017.119
Callahan, B. J., McMurdie, P. J., Rosen, M. J., Han, A. W., Johnson, A. J. A., and Holmes, S. P. (2016). DADA2: high-resolution sample inference from Illumina amplicon data. Nat. Methods 13, 581–583. doi: 10.1038/nmeth.3869
Choo, J. M., Leong, L. E. X., and Rogers, G. B. (2015). Sample storage conditions significantly influence faecal microbiome profiles. Sci. Rep. 5:16350. doi: 10.1038/srep16350
Cook, J. A., Greiman, S. E., Agosta, S. J., Anderson, R. P., Arbogast, B. S., Baker, R. J., et al. (2016). Transformational principles for NEON sampling of mammalian parasites and pathogens: a response to Springer and colleagues. BioScience 66, 917–919. doi: 10.1093/biosci/biw123
Cortés, A., Peachey, L. E., Jenkins, T. P., Scotti, R., and Cantacessi, C. (2019). Helminths and microbes within the vertebrate gut – not all studies are created equal. Parasitology 146, 1371–1378. doi: 10.1017/S003118201900088X
Crespo-Piazuelo, D., Estellé, J., Revilla, M., Criado-Mesas, L., Ramayo-Caldas, Y., Óvilo, C., et al. (2018). Characterization of bacterial microbiota compositions along the intestinal tract in pigs and their interactions and functions. Sci. Rep. 8:12727. doi: 10.1038/s41598-018-30932-30936
Datta, M. S., Almada, A. A., Baumgartner, M. F., Mincer, T. J., Tarrant, A. M., and Polz, M. F. (2018). Inter-individual variability in copepod microbiomes reveals bacterial networks linked to host physiology. ISME J. 12, 2103–2113. doi: 10.1038/s41396-018-0182-1
Davis, N. M., Proctor, D. M., Holmes, S. P., Relman, D. A., and Callahan, B. J. (2018). Simple statistical identification and removal of contaminant sequences in marker-gene and metagenomics data. Microbiome 6:226. doi: 10.1186/s40168-018-0605-602
Debelius, J., Song, S. J., Vazquez-Baeza, Y., Xu, Z. Z., Gonzalez, A., and Knight, R. (2016). Tiny microbes, enormous impacts: what matters in gut microbiome studies? Genome Biol. 17:217. doi: 10.1186/s13059-016-1086-x
Galbreath, K. E., Hoberg, E. P., Cook, J. A., Armién, B., Bell, K. C., Campbell, M. L., et al. (2019). Building an integrated infrastructure for exploring biodiversity: field collections and archives of mammals and parasites. J. Mammal. 100, 382–393. doi: 10.1093/jmammal/gyz048
Giatsis, C., Sipkema, D., Smidt, H., Heilig, H., Benvenuti, G., Verreth, J., et al. (2015). The impact of rearing environment on the development of gut microbiota in tilapia larvae. Sci. Rep. 5:18206. doi: 10.1038/srep18206
Greiman, S. E., Cook, J. A., Tkach, V. V., Hoberg, E. P., Menning, D. M., Hope, A. G., et al. (2018). Museum metabarcoding: a novel method revealing gut helminth communities of small mammals across space and time. Int. J. Parasitol. 48, 1061–1070. doi: 10.1016/j.ijpara.2018.08.001
Greiman, S. E., Pierson, B. J., Menning, D. M., Sonsthagen, S. A., and Talbot, S. L. (2020). Shrew (Sorex sp.) Gut Contents Identified by DNA Metabarcoding, North America, 1968-2016. Reston, VA: U.S. Geological Survey. doi: 10.5066/P9YH4C20
Hagan, R. W., Hofman, C. A., Hübner, A., Reinhard, K., Schnorr, S., and Lewis, C. M. Jr., et al. (2019). Comparison of extraction methods for recovering ancient microbial DNA from paleofeces. Am. J. Phys. Anthropol. 171, 275–284. doi: 10.1002/ajpa.23978
Haukisalmi, V., Hardman, L. M., Foronda, P., Feliu, C., Laakkonen, J., Niemimaa, J., et al. (2010). Systematic relationships of hymenolepidid cestodes of rodents and shrews inferred from sequences of 28S ribosomal RNA. Zool. Scripta 39, 631–641. doi: 10.1111/j.1463-6409.2010.00444.x
Heindler, F. M., Christiansen, H., Frédérich, B., Dettaï, A., Lepoint, G., Maes, G. E., et al. (2018). Historical DNA metabarcoding of the prey and microbiome of trematomid fishes using museum samples. Front. Ecol. Evol. 6:151. doi: 10.3389/fevo.2018.00151
Hoberg, E. P., Kutz, S. J., Cook, J. A., Galaktionov, K., Haukisalmi, V., Henttonen, H., et al. (2013). “Parasites in terrestrial, freshwater and marine systems,” in Arctic Biodiversity Assessment- Status and Trends in Arctic Biodiversity, ed. H. Meltofte (Akureyi: Conservation of Arctic Flora and Fauna, Arctic Council), 476–505.
Holmes, M. W., Hammond, T. T., Wogan, G. O. U., Walsh, R. E., LaBarbera, K., Wommack, E. A., et al. (2016). Natural history collections as windows on evolutionary processes. Mol. Ecol. 25, 864–881. doi: 10.1111/mec.13529
Hope, A. G., Sandercock, B. K., and Malaney, J. L. (2018). Collection of scientific specimens: benefits for biodiversity sciences and limited impacts on communities of small mammals. BioScience 68, 35–42. doi: 10.1093/biosci/bix141
Hope, A. G., Waltari, E., Malaney, J. L., Payer, D. C., Cook, J. A., and Talbot, S. L. (2015). Arctic biodiversity: increasing richness accompanies shrinking refugia for a cold-associated tundra fauna. Ecosphere 6, 1–67. doi: 10.1890/ES15-00104.1
Ingala, M. R., Simmons, N. B., Wultsch, C., Krampis, K., Speer, K. A., and Perkins, S. L. (2018). Comparing microbiome sampling methods in a wild mammal: fecal and intestinal samples record different signals of host ecology, evolution. Front. Microbiol. 9:803. doi: 10.3389/fmicb.2018.00803
Jin, Y., Wu, S., Zeng, Z., and Fu, Z. (2017). Effects of environmental pollutants on gut microbiota. Environ. Pollut. 222, 1–9. doi: 10.1016/j.envpol.2016.11.045
Jones, K. E., Angielczyk, K. D., and Pierce, S. E. (2019). Stepwise shifts underlie evolutionary trends in morphological complexity of the mammalian vertebral column. Nat. Commun. 10:5071. doi: 10.1038/s41467-019-13026-13023
Knowles, S. C. L., Eccles, R. M., and Baltrûnaitë, L. (2019). Species identity dominates over environment in shaping the microbiota of small mammals. Ecol. Lett. 22, 826–837. doi: 10.1111/ele.13240
Kozich, J. J., Westcott, S. L., Baxter, N. T., Highlander, S. K., and Schloss, P. D. (2013). Development of a dual-index sequencing strategy and curation pipeline for analyzing amplicon sequence data on the MiSeq Illumina sequencing platform. Appl. Environ. Microbiol. 79, 5112–5120. doi: 10.1128/AEM.01043-1013
Legendre, P., and Borcard, D. (2018). Box–Cox-chord transformations for community composition data prior to beta diversity analysis. Ecography 41, 1820–1824. doi: 10.1111/ecog.03498
McLean, B. S., Bell, K. C., Dunnum, J. L., Abrahamson, B., Colella, J. P., Deardorff, E. R., et al. (2016). Natural history collections-based research: progress, promise, and best practices. J. Mammal. 97, 287–297. doi: 10.1093/jmammal/gyv178
Meineke, E. K., Davies, T. J., Daru, B. H., and Davis, C. C. (2019). Biological collections for understanding biodiversity in the Anthropocene. Phil. Transact. R. Soc. B. Biol. Sci. 374:20170386. doi: 10.1098/rstb.2017.0386
Miller, S. E., Barrow, L. N., Ehlman, S. M., Goodheart, J. A., Greiman, S. E., Lutz, H. L., et al. (2020). Building natural history collections for the twenty-first century and beyond. BioScience 70, 674–687. doi: 10.1093/biosci/biaa069
Nobs, S. P., Tuganbaev, T., and Elinav, E. (2019). Microbiome diurnal rhythmicity and its impact on host physiology and disease risk. EMBO Rep. 20:e47129. doi: 10.15252/embr.201847129
Oksanen, J., Blanchet, F. G., Friendly, M., Kindt, R., Legendre, P., McGlinn, D., et al. (2017). vegan: Community Ecology Package. v. 2.4-5. Available online at: https://cran.r-project.org/package=vegan (accessed July 21, 2020).
Quast, C., Pruesse, E., Yilmaz, P., Gerken, J., Schweer, T., Yarza, P., et al. (2013). The SILVA ribosomal RNA gene database project: improved data processing and web-based tools. Nucleic Acids Res. 41, D590–D596. doi: 10.1093/nar/gks1219
Rognes, T., Flouri, B., Nichols, B., Quince, C., and Mahe, F. (2016). VSEARCH: a versatile open source tool for metagenomics. PeerJ 4:e2584. doi: 10.7717/peerj.2584
Rothschild, D., Weissbrod, O., Barkan, E., Kurilshikov, A., Korem, T., Zeevi, D., et al. (2018). Environment dominates over host genetics in shaping human gut microbiota. Nature 555, 210–215. doi: 10.1038/nature25973
Schindel, D. E., and Cook, J. A. (2018). The next generation of natural history collections. PLoS Biol. 16:e2006125. doi: 10.1371/journal.pbio.2006125
Schloss, P. D., Westcott, S. L., Ryabin, T., Hall, J. R., Hartmann, M., Hollister, E. B., et al. (2009). Introducing mothur: open-source, platform-independent, community-supported software for describing and comparing microbial communities. Appl. Environ. Microbiol. 75:7537. doi: 10.1128/AEM.01541-1549
Sheneman, L., Evans, J., and Foster, J. A. (2006). Clearcut: a fast implementation of relaxed neighbor joining. Bioinformatics 22, 2823–2824. doi: 10.1093/bioinformatics/btl478
Turner, S., Pryer, K. M., Miao, V. P. W., and Palmer, J. D. (1999). Investigating deep phylogenetic relationships among cyanobacteria and plastids by small subunit rRNA sequence analysis1. J. Eukaryotic Microbiol. 46, 327–338. doi: 10.1111/j.1550-7408.1999.tb04612.x
Waite, D. W., Vanwonterghem, I., Rinke, C., Parks, D. H., Zhang, Y., Takai, K., et al. (2017). Comparative genomic analysis of the class Epsilonproteobacteria and proposed reclassification to Epsilonbacteraeota (phyl. nov.). Front. Microbiol. 8:682. doi: 10.3389/fmicb.2017.00682
Waite, D. W., Vanwonterghem, I., Rinke, C., Parks, D. H., Zhang, Y., Takai, K., et al. (2018). Addendum: comparative genomic analysis of the class Epsilonproteobacteria and proposed reclassification to Epsilonbacteraeota (phyl. nov.). Front. Microbiol. 9:772. doi: 10.3389/fmicb.2018.00772
Waltari, E., Hoberg, E. P., Lessa, E. P., and Cook, J. A. (2007). Eastward Ho: Phylogeographical perspectives on colonization of hosts and parasites across the Beringian nexus. J. Biogeography 34, 561–574. doi: 10.1111/j.1365-2699.2007.01705.x
Wilkinson, T. J., Cowan, A. A., Vallin, H. E., Onime, L. A., Oyama, L. B., Cameron, S. J., et al. (2017). Characterization of the microbiome along the gastrointestinal tract of growing turkeys. Front. Microbiol. 8:1089. doi: 10.3389/fmicb.2017.01089
Wright, E. S. (2016). Using DECIPHER v2.0 to analyze big biological sequence data in R. R. J. 8, 352–359.
Yilmaz, P., Parfrey, L. W., Yarza, P., Gerken, J., Pruesse, E., Quast, C., et al. (2014). The SILVA and “All-species Living Tree Project (LTP)” taxonomic frameworks. Nucleic Acids Res. 42, D643–D648. doi: 10.1093/nar/gkt1209
Youngblut, N. D., Reischer, G. H., Walters, W., Schuster, N., Walzer, C., Stalder, G., et al. (2019). Host diet and evolutionary history explain different aspects of gut microbiome diversity among vertebrate clades. Nat. Commun. 10:2200. doi: 10.1038/s41467-019-10191-10193
Zakrzewski, M., Proietti, C., Ellis, J. J., Hasan, S., Brion, M.-J., Berger, B., et al. (2017). Calypso: a user-friendly web-server for mining and visualizing microbiome-environment interactions. Bioinformatics (Oxford, England) 33, 782–783. doi: 10.1093/bioinformatics/btw725
Zeevi, D., Korem, T., Godneva, A., Bar, N., Kurilshikov, A., Lotan-Pompan, M., et al. (2019). Structural variation in the gut microbiome associates with host health. Nature 568, 43–48. doi: 10.1038/s41586-019-1065-y
Keywords: Museum-collections, microbiome, 16S rRNA, Sorex, contemporary
Citation: Greiman SE, Cook JA, Odom T, Cranmer K, Liphardt SW, Menning DM, Sonsthagen SA and Talbot SL (2020) Microbiomes From Biorepositories? 16S rRNA Bacterial Amplicon Sequencing of Archived and Contemporary Intestinal Samples of Wild Mammals (Eulipotyphla: Soricidae). Front. Ecol. Evol. 8:555386. doi: 10.3389/fevo.2020.555386
Received: 28 April 2020; Accepted: 14 August 2020;
Published: 10 September 2020.
Edited by:
Rodney L. Honeycutt, Pepperdine University, United StatesReviewed by:
Melissa R. Ingala, American Museum of Natural History, United StatesRobert D. Bradley, Texas Tech University, United States
At least a portion of this work is authored by Damian M. Menning, Sarah A. Sonsthagen and Sandra L. Talbot on behalf of the U.S. Government and, as regards Dr. Menning, Dr. Sonsthagen, Dr. Talbot, and the U.S. Government, is not subject to copyright protection in the United States. Foreign and other copyrights may apply. This is an open-access article distributed under the terms of the Creative Commons Attribution License (CC BY). The use, distribution or reproduction in other forums is permitted, provided the original author(s) and the copyright owner(s) are credited and that the original publication in this journal is cited, in accordance with accepted academic practice. No use, distribution or reproduction is permitted which does not comply with these terms.
*Correspondence: Stephen E. Greiman, c2dyZWltYW5AZ2VvcmdpYXNvdXRoZXJuLmVkdQ==