 Lucie Němcová
 Silvia Marková
 Petr Kotlík
- 1Laboratory of Developmental Biology, Institute of Animal Physiology and Genetics of the Czech Academy of Sciences, Liběchov, Czechia
- 2Laboratory of Molecular Ecology, Institute of Animal Physiology and Genetics of the Czech Academy of Sciences, Liběchov, Czechia
The bank vole has become an important species for the study of gene expression changes underlying evolutionary adaptation, within-host dynamics and resistance to pathogens, or response to pollutants. RT–qPCR is an optimized method for the rapid and accurate measuring gene expression, but it relies on the use of reference genes (RGs) as endogenous controls to normalize mRNA levels of the target genes. Contrary to the common practice, the expression level of the housekeeping genes traditionally used as RGs cannot be assumed stable across different species and experimental settings. Furthermore, compared to model laboratory species, there are potentially additional sources of variation when collecting gene expression data from natural populations with unknown genetic and environmental backgrounds. Thus, rigorous determination of RGs in natural populations of the bank vole was necessary to facilitate gene expression studies in this emerging model species. Therefore, we evaluated the expression variation of 10 RG candidates in spleen samples of bank voles spanning a broad latitudinal range across Europe, using four approaches. Ube2d2a, Ppia, and Tbp were consistently identified as the least variable genes, followed by Rn18s, Ywhaz, and Rplp0. The combinations Ube2d2a and Ppia or Ube2d2a and Tbp were identified to be sufficient for the normalization. In contrast, the traditional housekeeping genes Actb, Gapdh, Sdha, and Tuba1a displayed large expression variation and are not recommended as internal controls. Our results underscore the need of a systematic evaluation of appropriate RGs to each particular experimental system and provide a useful starting point for further studies.
Introduction
Regulatory variation in gene expression is increasingly being recognized as a major determinant of phenotypic variation (Lai et al., 2008; Fraser, 2013; Sandkam et al., 2015; Lin et al., 2017). However, the role of regulatory changes in the evolution of natural populations has not been firmly established, in part because the majority of gene expression studies have been conducted with model organisms in controlled laboratory settings (Nuzhdin et al., 2004; Fraser et al., 2010; Lin et al., 2017). Such studies explore the effect of genotype and physiological state of the organism on gene expression, but their generality is limited by the restricted range of genotypes and phenotypes available in laboratory populations (Lai et al., 2008). There is therefore great, but theretofore underutilized potential for understanding evolution and other biological phenomena such physiology, immunology, parasitology and toxicology, by the study of gene expression in natural populations (Townsend et al., 2003).
The real time quantitative reverse transcription-PCR (RT-qPCR) is an optimized method for the rapid and accurate measuring of gene expression, which provides means to compare the expression levels of target genes in individual samples, including validation of high-throughput gene expression profiles (VanGuilder et al., 2008). To obtain reliable patterns of gene expression in a given setting using RT-qPCR, it is important to minimize the influence of technical or experimentally induced variation (Pfaffl, 2004; Huggett et al., 2005). Therefore, normalization of target gene expression is typically performed by using one or multiple reference genes (RGs) as an endogenous control (Bustin, 2002). Most often, genes involved in maintaining cellular structure and homeostasis, the so-called housekeeping genes (Eisenberg and Levanon, 2013), serve that purpose, because they are expected to be expressed at constant levels across tissues (Pfaffl, 2004). However, the use of such genes without prior evaluation can lead to inaccurate results and erroneous conclusions about real biological effects (Bustin, 2002; Kozera and Rapacz, 2013). Further, compared to laboratory animals, there are potentially additional sources of variation in natural populations (Huang and Agrawal, 2016), due to genetic background differences or environmental heterogeneity (Harrison et al., 2012; Lenz, 2015), and careful selection of RGs is therefore critical.
The bank vole (Clethrionomys glareolus) is a small rodent with broad distribution in Europe (Deffontaine et al., 2005; Filipi et al., 2015), ranging approximately from 40°N in Calabria in Italy to 69°N in Lapland in Finland and Norway, between where it spans a broad variation in altitude and climate (Johannesen and Mauritzen, 1999; Torre and Arrizabalaga, 2008). The bank vole displays one of the most complex geographical patterns of population structure in any small mammal studied to date (Pedreschi et al., 2019), likely as the result of isolation and adaptation of populations during and after the glacial periods of the Pleistocene (Deffontaine et al., 2005; Kotlík et al., 2014; Filipi et al., 2015). While suitable glacial refugia for the bank vole have persisted in southern Mediterranean regions of Europe and in the vicinity of the major mountain ranges (such as the Carpathians), facilitating population divergence and accumulation of genetic diversity, recurrent founder events during end-glacial colonization of northern areas resulted in a reassortment and/or reduction of diversity away from the refugial areas (Marková et al., 2020). The broad range and complex history made the bank vole one of the key mammals used in genetic studies of the response to climate change at the end of the last glaciation (Wójcik et al., 2010; Colangelo et al., 2012; Kotlík et al., 2018; Marková et al., 2020) including local adaptation to environmental heterogeneity (Kotlík et al., 2014; Strážnická et al., 2018). Additionally, bank vole is an important zoonotic reservoir of various emerging pathogens such as Puumala orthohantavirus (PUUV) (Khalil et al., 2019; Madriéres et al., 2019) Ljungan virus (Hauffe et al., 2010) and cowpox virus (Franke et al., 2017), with significant differences in the level of host immune-related gene expression reported between bank voles from PUUV endemic and non-endemic regions of Europe (Guivier et al., 2014).
Over the past years, several traditional housekeeping (e.g., Actb, Gapdh, Rn18s, or Tuba1a) have been used for RT-qPCR data normalization in the bank vole in order to assess gene expression patterns implicated in the susceptibility to PUUV infection (Dubois et al., 2018; Müller et al., 2019), in the cellular response to the chronic exposure to ionizing radiation (Mustonen et al., 2018) or environmental heavy metal contamination (Świergosz-Kowalewska and Holewa, 2007; Zarzycka et al., 2016; Mikowska et al., 2018), and to measure PUUV viral RNA load in bank vole tissues (Guivier et al., 2014). However, the common RGs may show high expression variability in different tissues or experimental settings and other genes may thus present suitable alternatives (Hernandez-Santana et al., 2016). In a recent study (Dvořáková et al., 2020), two RGs (Ppia and Rn18s) showing low expression variance across several individuals were used to reveal the possible role in environmental adaptation for the gene expression regulation of bank vole globin genes (Dvořáková et al., 2020). However, to date, there has been no report on a rigorous statistical identification of stably expressed RGs in the bank vole or a related species. Therefore, we selected a set of commonly used as well as non-traditional RG candidates (Supplementary Table S1) and evaluated their expression variation among bank vole samples chosen to represent the species’ geographical range and variation in population history across Europe (Figure 1), by using a suite of mathematical and statistical algorithms, i.e., geNorm (Vandesompele et al., 2002), NormFinder (Andersen et al., 2004), BestKeeper (Pfaffl et al., 2004), and the comparative ΔCq method (Silver et al., 2006). The results support that traditional RGs may be outperformed by other candidates. Our study thus underscores the importance of evaluating RGs for each experimental system and provides a useful starting point for further studies in the bank vole.
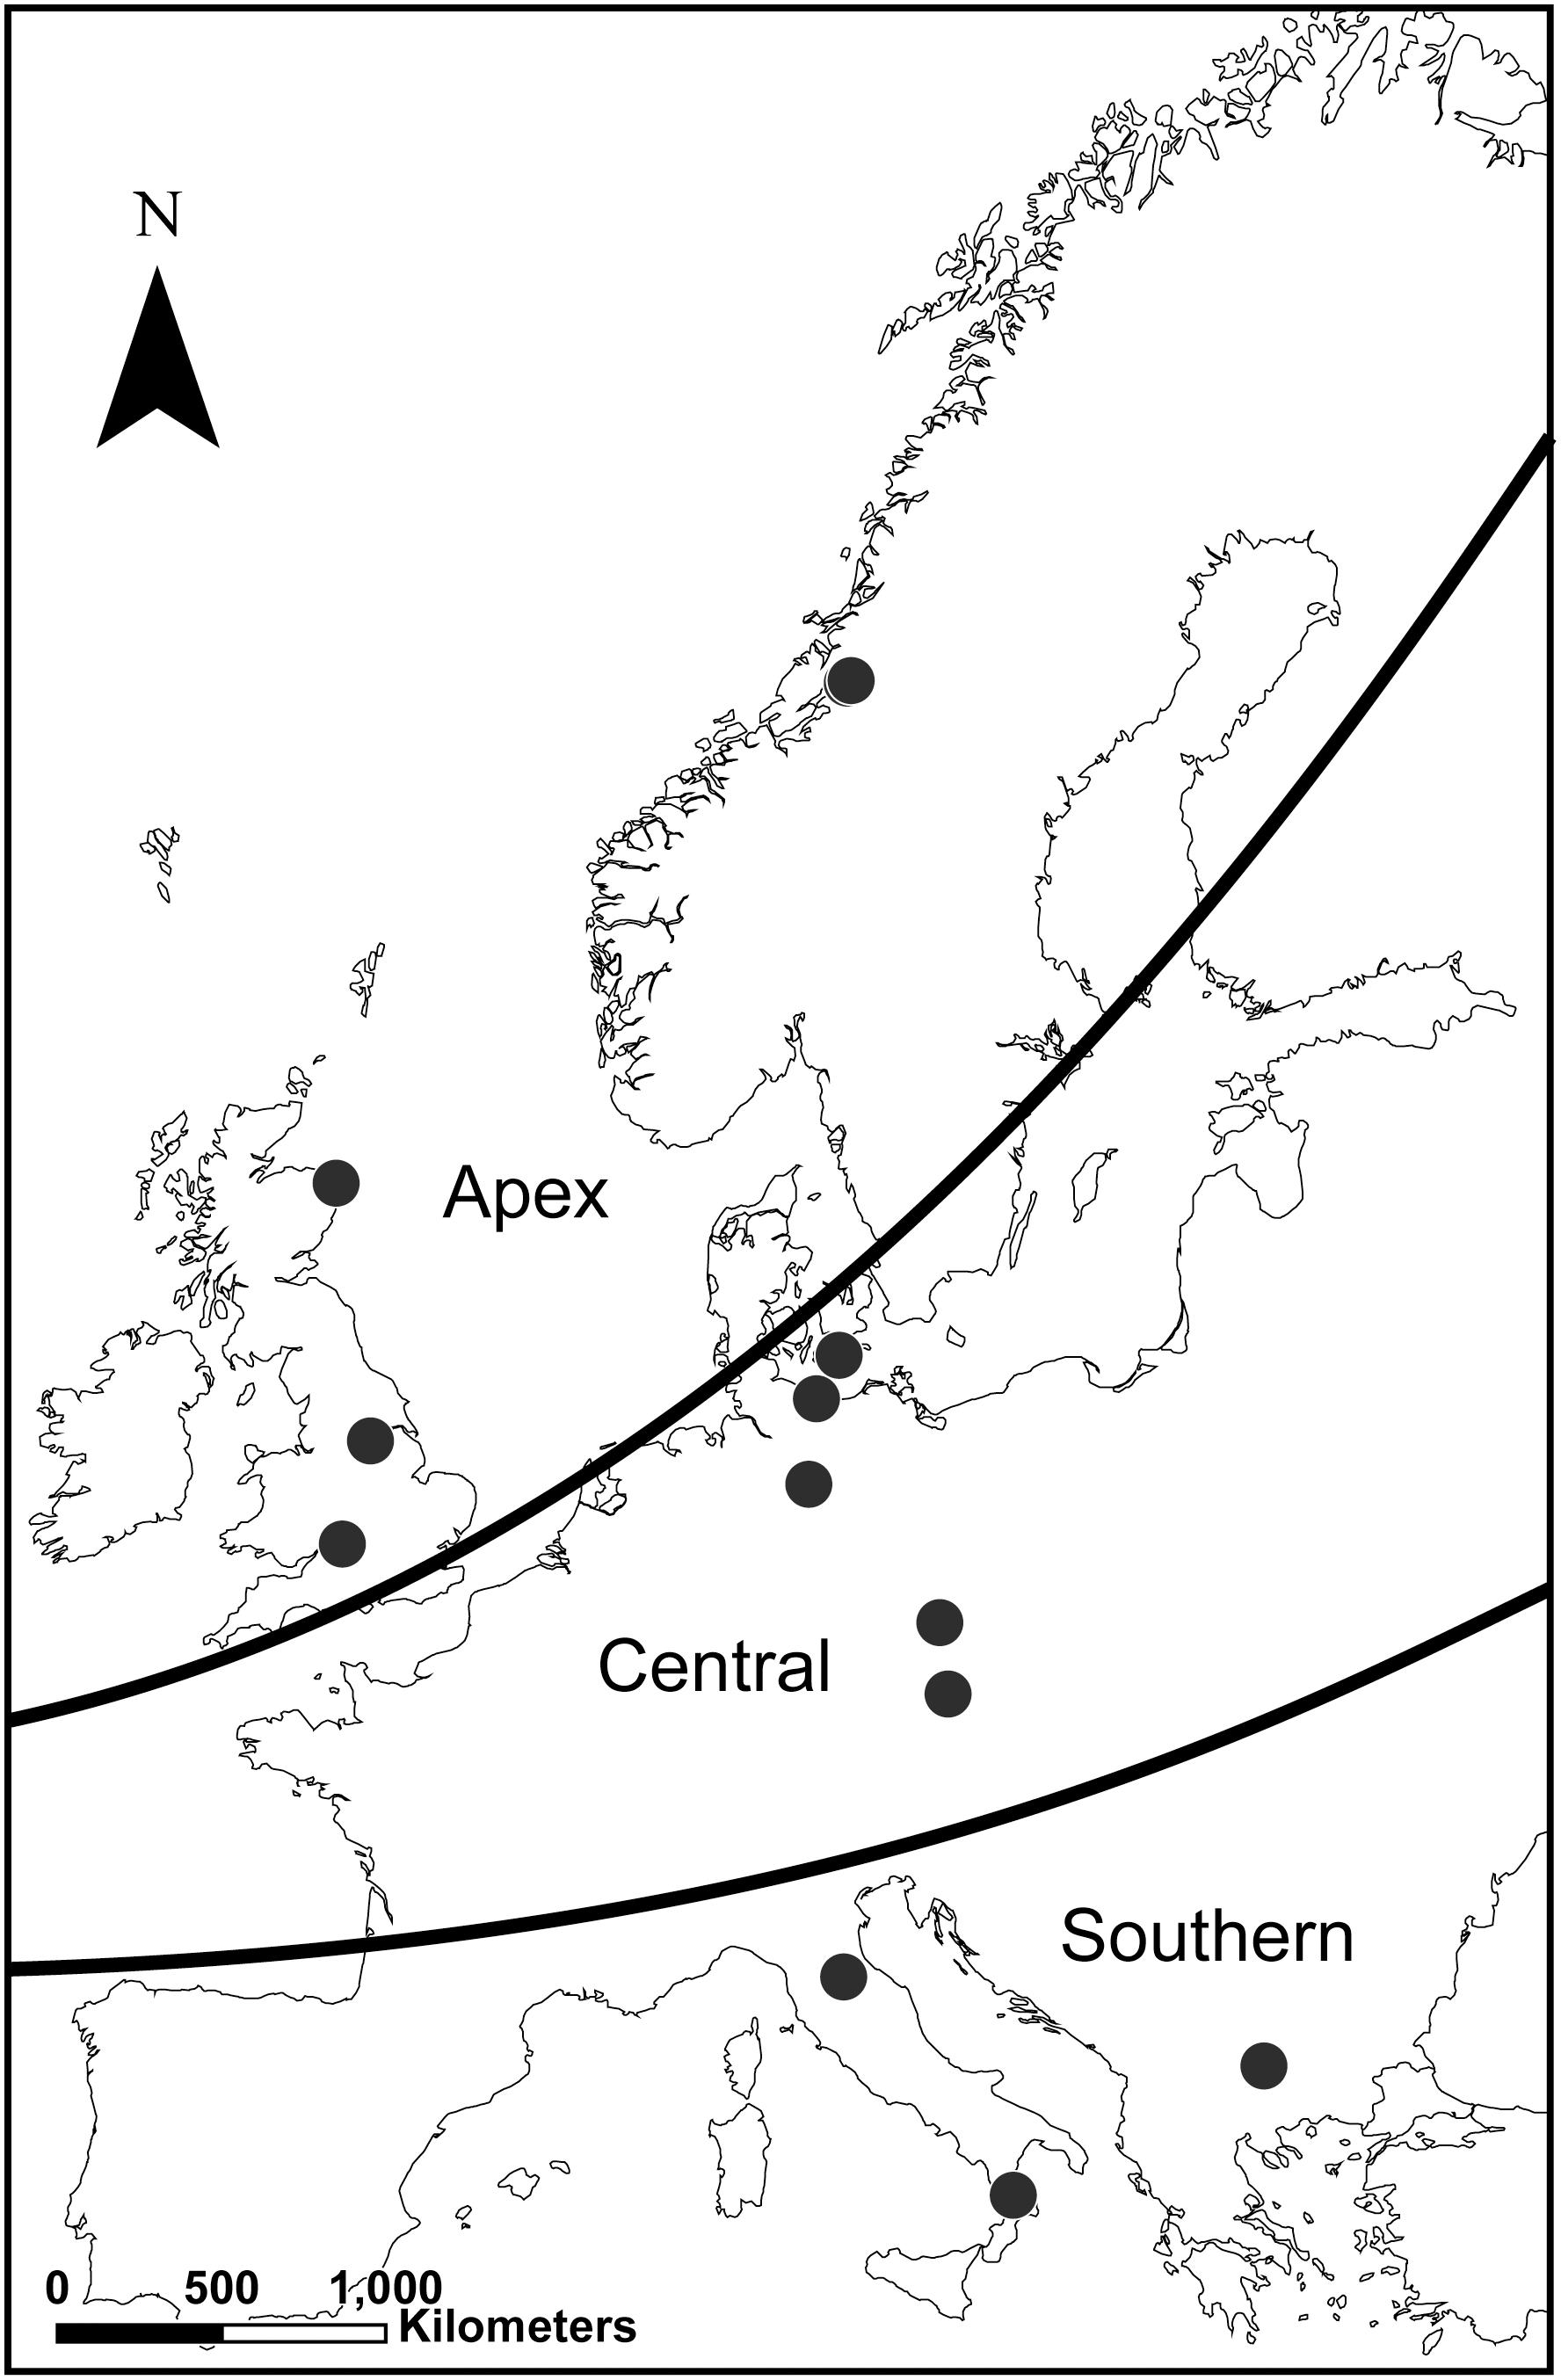
Figure 1. Geographical origin of the bank vole samples (n = 21). Map shows the geographic origin of the samples in the three latitudinal zones: southern refugial (n = 6), which includes the areas of glacial refugia in the Mediterranean region, northern apex (n = 7), which includes Great Britain and Fennoscandia as the apex areas of the northward end-glacial colonization; and central (n = 8), which has a mixed history of glacial survival and post-glacial colonization. Geographically proximate sampling sites may overlap (see Supplementary Table S2 for details).
Materials and Methods
Samples
The study used spleen samples (n = 21) of male (n = 10) and female (n = 11) bank voles from 13 localities across the species’ broad latitudinal range in Europe (Figure 1 and Supplementary Table S2). The samples were available from previous genetic studies and represented the three latitudinal zones identified based on the combined information from phylogenetic analyses of mitochondrial DNA sequences (Filipi et al., 2015) and clustering of genomic data (Marková et al., 2020): southern refugial (n = 6), which includes the areas of glacial refugia in the Mediterranean region, northern apex (n = 7), which includes Great Britain and Fennoscandia as the apex areas of the northward end-glacial colonization; and central (n = 8), including samples from the area between southern and northern regions, which has a mixed history of glacial survival and post-glacial colonization (Filipi et al., 2015; Marková et al., 2020).
RNA Isolation and Quality Control
Spleens stored in RNAlater (Qiagen, Hilden, Germany) at −20°C were carefully examined and only tissue of medium size with no apparent necrotic foci or cysts were used. Approximately 0.05 mg of tissue was homogenized on ice with a T10 ULTRA-TURAX homogenizer (IKA, Staufen, Germany). Total RNA was extracted using the RNeasy Protect Mini Kit (Qiagen), followed by RNase-Free DNase I treatment. The RNA concentration was measured with a NanoDropTM 1000 spectrophotometer (Thermo Fisher Scientific, Waltham, Massachusetts, United States) and the RNA integrity evaluated with an Agilent 2100 Bioanalyzer using the Agilent RNA 6000 Pico Kit (Agilent Technologies, Santa Clara, CA). The resulting RNA of each samples was diluted to the final concentration of 5 ng/μl, aliquoted and stored at –80°C until the analyses.
Real-Time RT–qPCR
A total of 10 genes, namely actin, beta (Actb); glyceraldehyde-3-phosphate dehydrogenase (Gapdh); peptidylprolyl isomerase A (Ppia); succinate dehydrogenase complex, subunit A, flavoprotein (Fp) (Sdha); 18S ribosomal RNA (Rn18s); Rplp0 ribosomal protein, large, P0 (Rplp0); TATA box binding protein (Tbp); tubulin, alpha 1A (Tuba1a); ubiquitin-conjugating enzyme E2D 2A (Ube2d2a); and tyrosine 3-monooxygenase/tryptophan 5-monooxygenase activation protein, zeta polypeptide (Ywhaz) were compared. This included traditional housekeeping genes (e.g., Actb, Gapdh, Rn18s, Tbp, or Tuba1a; Eisenberg and Levanon, 2013; Kozera and Rapacz, 2013) as well as less commonly used, but promising RG candidates (e.g., Ube2d2a or Ppia; Li et al., 2017), and comprised different functional classes (Supplementary Table S1) in order to minimize the chance that the genes were co-regulated and low variation in expression levels between them reflected a parallel directional change rather than stable expression levels. Primers were designed for each gene by using the Oligo 7 software (Molecular Biology Insight, Inc., Colorado Springs, CO, United States) based on the bank vole transcriptome assembly (Kotlík et al., 2018), primarily targeting the exon-exon boundaries or spanning an exon junction (Supplementary Table S3).
One-step RT-qPCR was performed in a RotorGene 3000 cycler (Corbett Research, Mortlake, NSW, Australia) using the Qiagen OneStep RT-PCR Kit. The reactions were set up in a total volume of 10 μl and contained 2 μl of 5 × reaction buffer, 0.4 μl of dNTP mix (10 nM of each), 0.2 μl of forward and reverse primers (20 nM; IDT, Leuven, Belgium), 0.0625 μl RNasine (20 U/ml; Promega, Madison, Wisconsin, United States), 0.4 μl of enzyme mix, 0.4 μl of EvaGreen Dye, 20 × in Water (Biotium, CA), 2 μl of diluted RNA (5 ng/μl) and RT-PCR Grade Water to the total volume of 10 μl.
All reactions were carried out in triplicates and non-template controls were included in all RT-qPCR runs. Amplifications were performed using 0.1 ml strip tubes and caps (Qiagen) placed in the 72-well rotor. The RT-qPCR program consisted of reverse transcription at 50°C for 30 min, initial denaturation at 95°C for 15 min, followed by PCR cycles consisting of denaturation at 94°C for 15 s, annealing at temperature specific for each set of primers (Supplementary Table S3) for 15 s and extension at 72°C for 20 s; and final extension at 72°C for 5 min. Fluorescence data were acquired at the end of each extension step. The specificities of the RT-qPCR products were verified by a melting curve analysis tool of the Rotor-Gene Q Series Software, version 2.3.1, and by gel electrophoresis on a 1.5% agarose gel and stained with GoodView Nucleic Acid Stain (SBS Genetech, Beijing, China). The amplification of the desired PCR product was confirmed by Sanger sequencing (Macrogen, Amsterdam, Netherlands) and BLAST comparison against the National Center for Biotechnology Information (NCBI)1 database.
Data Processing
The fluorescence data were processed with the Rotor-Gene Q Series Software v. 6.1 (Corbett Research), which uses the second derivative of raw fluorescence values (the slope of the amplification curve) to help calculate both the efficiency (E) of each reaction and the take-off point at which the exponential phase of amplification begins, taken to represent the quantification cycle (Cq) value (Mccurdy et al., 2008; Bustin et al., 2009; Camacho Londoño and Philipp, 2016). For comparison, quantification cycle values were also determined by manually setting a threshold line in the linear fluorescence scale, hereafter referred to as Ct values to differentiate them from the Cq values obtained by the second derivative method (Mccurdy et al., 2008). As RefFinder (Xie et al., 2012) only takes quantification cycle values without the possibility to input E values, corrected Cq and Ct values were calculated by using the formula Cq × (logE/log2). The Cq and Ct values were transformed to linear scale relative expression quantities (RQ) required by geNorm (Vandesompele et al., 2002) and NormFinder (Andersen et al., 2004), by using the formula E(control Cq–sample Cq) (Livak and Schmittgen, 2001; Mccurdy et al., 2008), with the sample with the lowest mean Cq or Ct value used as a control (De Spiegelaere et al., 2015). Relative quantity calculations based on the Ct data were also performed by assuming 100% efficiency for all individual reactions by setting E at 2 (Livak and Schmittgen, 2001). Outliers, that is replicates whose amplification efficiency or relative expression clearly deviated from the sample mean, were not included in the calculations.
The Cq and Ct values were used with BestKeeper (Pfaffl et al., 2004) while the RQs were an input to geNorm (Vandesompele et al., 2002) and NormFinder (Andersen et al., 2004) and were also analyzed with the ΔCq method (Silver et al., 2006).
Gene Expression Variation Analysis
The geNorm algorithm calculates the expression stability value (M) for each gene based on the average pairwise variation (V) of that gene with all the other genes, and determines the number of genes needed for normalization by calculating the pairwise variation (Vn/Vn+1) between two sequential sets containing an increasing number of genes (Vandesompele et al., 2002).
NormFinder is a Microsoft Office Excel ad-in implementing a mathematical model-based variance estimation algorithm to evaluate the overall variation of the genes in the sample as well as variation between the sample subgroups, in order to identify the genes with minimal estimated intragroup as well as intergroup variation (Andersen et al., 2004).
BestKeeper, a Microsoft Office Excel-based tool, ranks the genes based on the average deviation (AD) and the coefficient of variance (CV) of their Cq or Ct values across individuals, and estimates the Pearson’s correlation coefficient (r) and the probability (P) value for the correlation between each gene and the BestKeeper Index (BKI) represented by the geometric mean of all genes (Pfaffl et al., 2004).
The ΔCq method is based on the assumption that the ΔCq value between the two genes remains constant in different individuals when both genes are stably expressed (Silver et al., 2006).
Finally, RefFinder (Xie et al., 2012) is a web-based tool2 integrating the results of all the four methods for a comprehensive ranking. Unlike the stand-alone versions of the programs, RefFinder only takes quantification cycle values as input, without the possibility to input E values, and efficiency corrected and non-corrected Cq and Ct values were therefore used in order to assess any differences in the ranking caused by using the efficiency corrected versus non-corrected values.
Results
RNA Quality and Assay Efficiency and Specificity
The average RNA concentration and the optical density ratio of A260/280 were 112.02 ± 39.9 (SD) ng/μl and 1.98 ± 0.06, respectively. The Bioanalyzer electropherogram for each sample showed a clear presence of two peaks expected for the two large rRNA species (18S and 28S), without any evidence of degraded products, and the average RNA Integrity Number was 8.92 ± 0.5. The agarose gel electrophoresis and melting curve analysis revealed that all primer pairs amplified a single PCR product with the expected size, and the sequence analysis and BLAST comparison confirmed the amplicons as the genes targeted by the primers.
Amplification Efficiency and Gene Expression Levels
A summary of the estimated qPCR amplification efficiency and expression level variation for each gene is provided in Supplementary Table S4. The mean amplification efficiency (i.e., the ratio of the number of target gene molecules at the end of a PCR cycle divided by the number of target molecules at the start of the PCR cycle) ranged between 1.66 and 1.92 and the mean Cq values between 8.27 and 25.62 (Figure 2). The Rn18s gene showed the most abundant transcript levels (Cq of 7.3–9.2), while the Actb gene showed the lowest expression (Cq of 23.7–29.6). The largest dispersion of Cq values of 5.9 cycle was observed for Actb (Figure 2) and the lowest for Rn18s and Sdha (1.9 cycle for both).
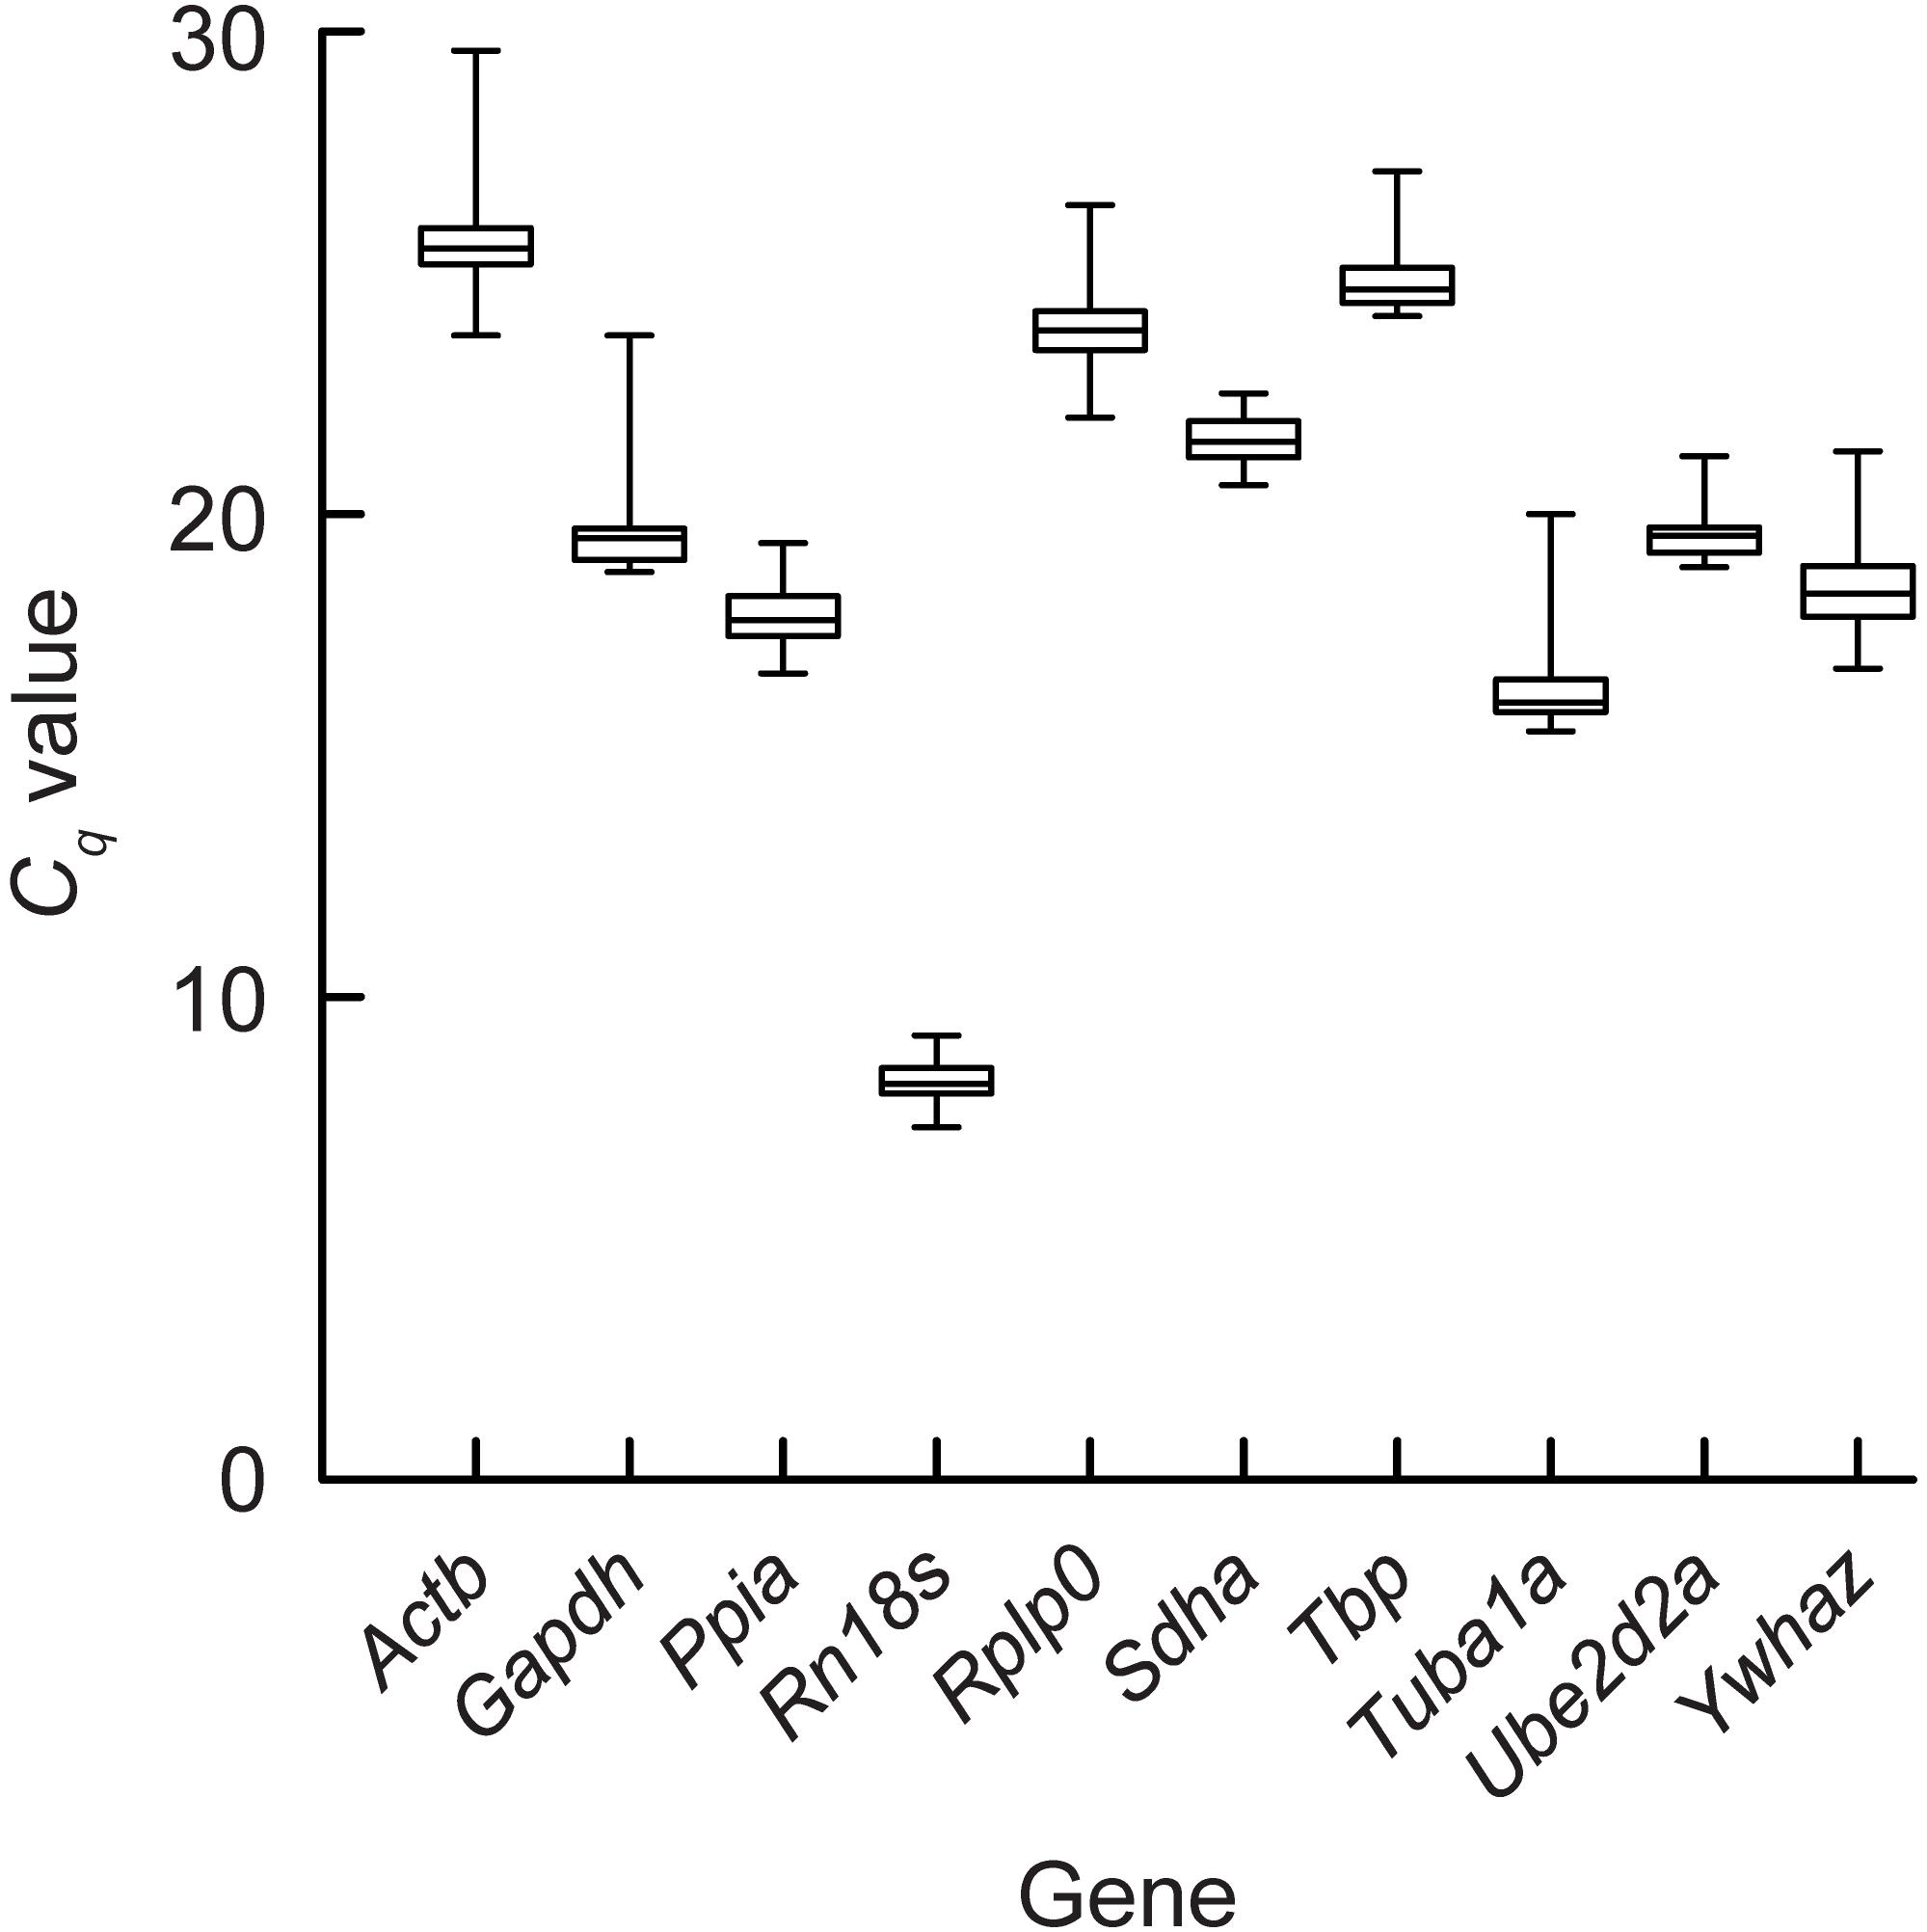
Figure 2. Gene expression levels of the bank vole genes. The box plot represents the interquartile range, the median and the maximum and minimum quantification cycle (Cq) values of for each gene.
Gene Expression Stability
The M values of gene expression stability among the bank vole samples (n = 21) calculated by geNorm varied slightly depending on whether the second derivative (Cq) or threshold cycle (Ct) data was used and whether 100% efficiency was assumed for all reactions or not (Figure 3A). However, all ten genes had an M value below 1.5 (Table 1 and Figure 3A), which is the recommended cut-off for a gene to be considered stably expressed (Vandesompele et al., 2002). Ube2d2a, Ppia, Tbp and Rn18s had the lowest M values based on Cq data and Ube2d2a, Ppia, and Rn18s remained among the four most stable genes also based on Ct data, regardless of the assumed reaction efficiency (Figure 3A). The highest M values were consistently obtained for Gapdh and Sdha (Figure 3A). The Vn/Vn+1 values were always lower than the recommended cut-off threshold of 0.15 (Vandesompele et al., 2002), indicating that the combination of the two top ranking genes, Ube2d2a and Ppia, is appropriate to use for normalization (Figure 3B).
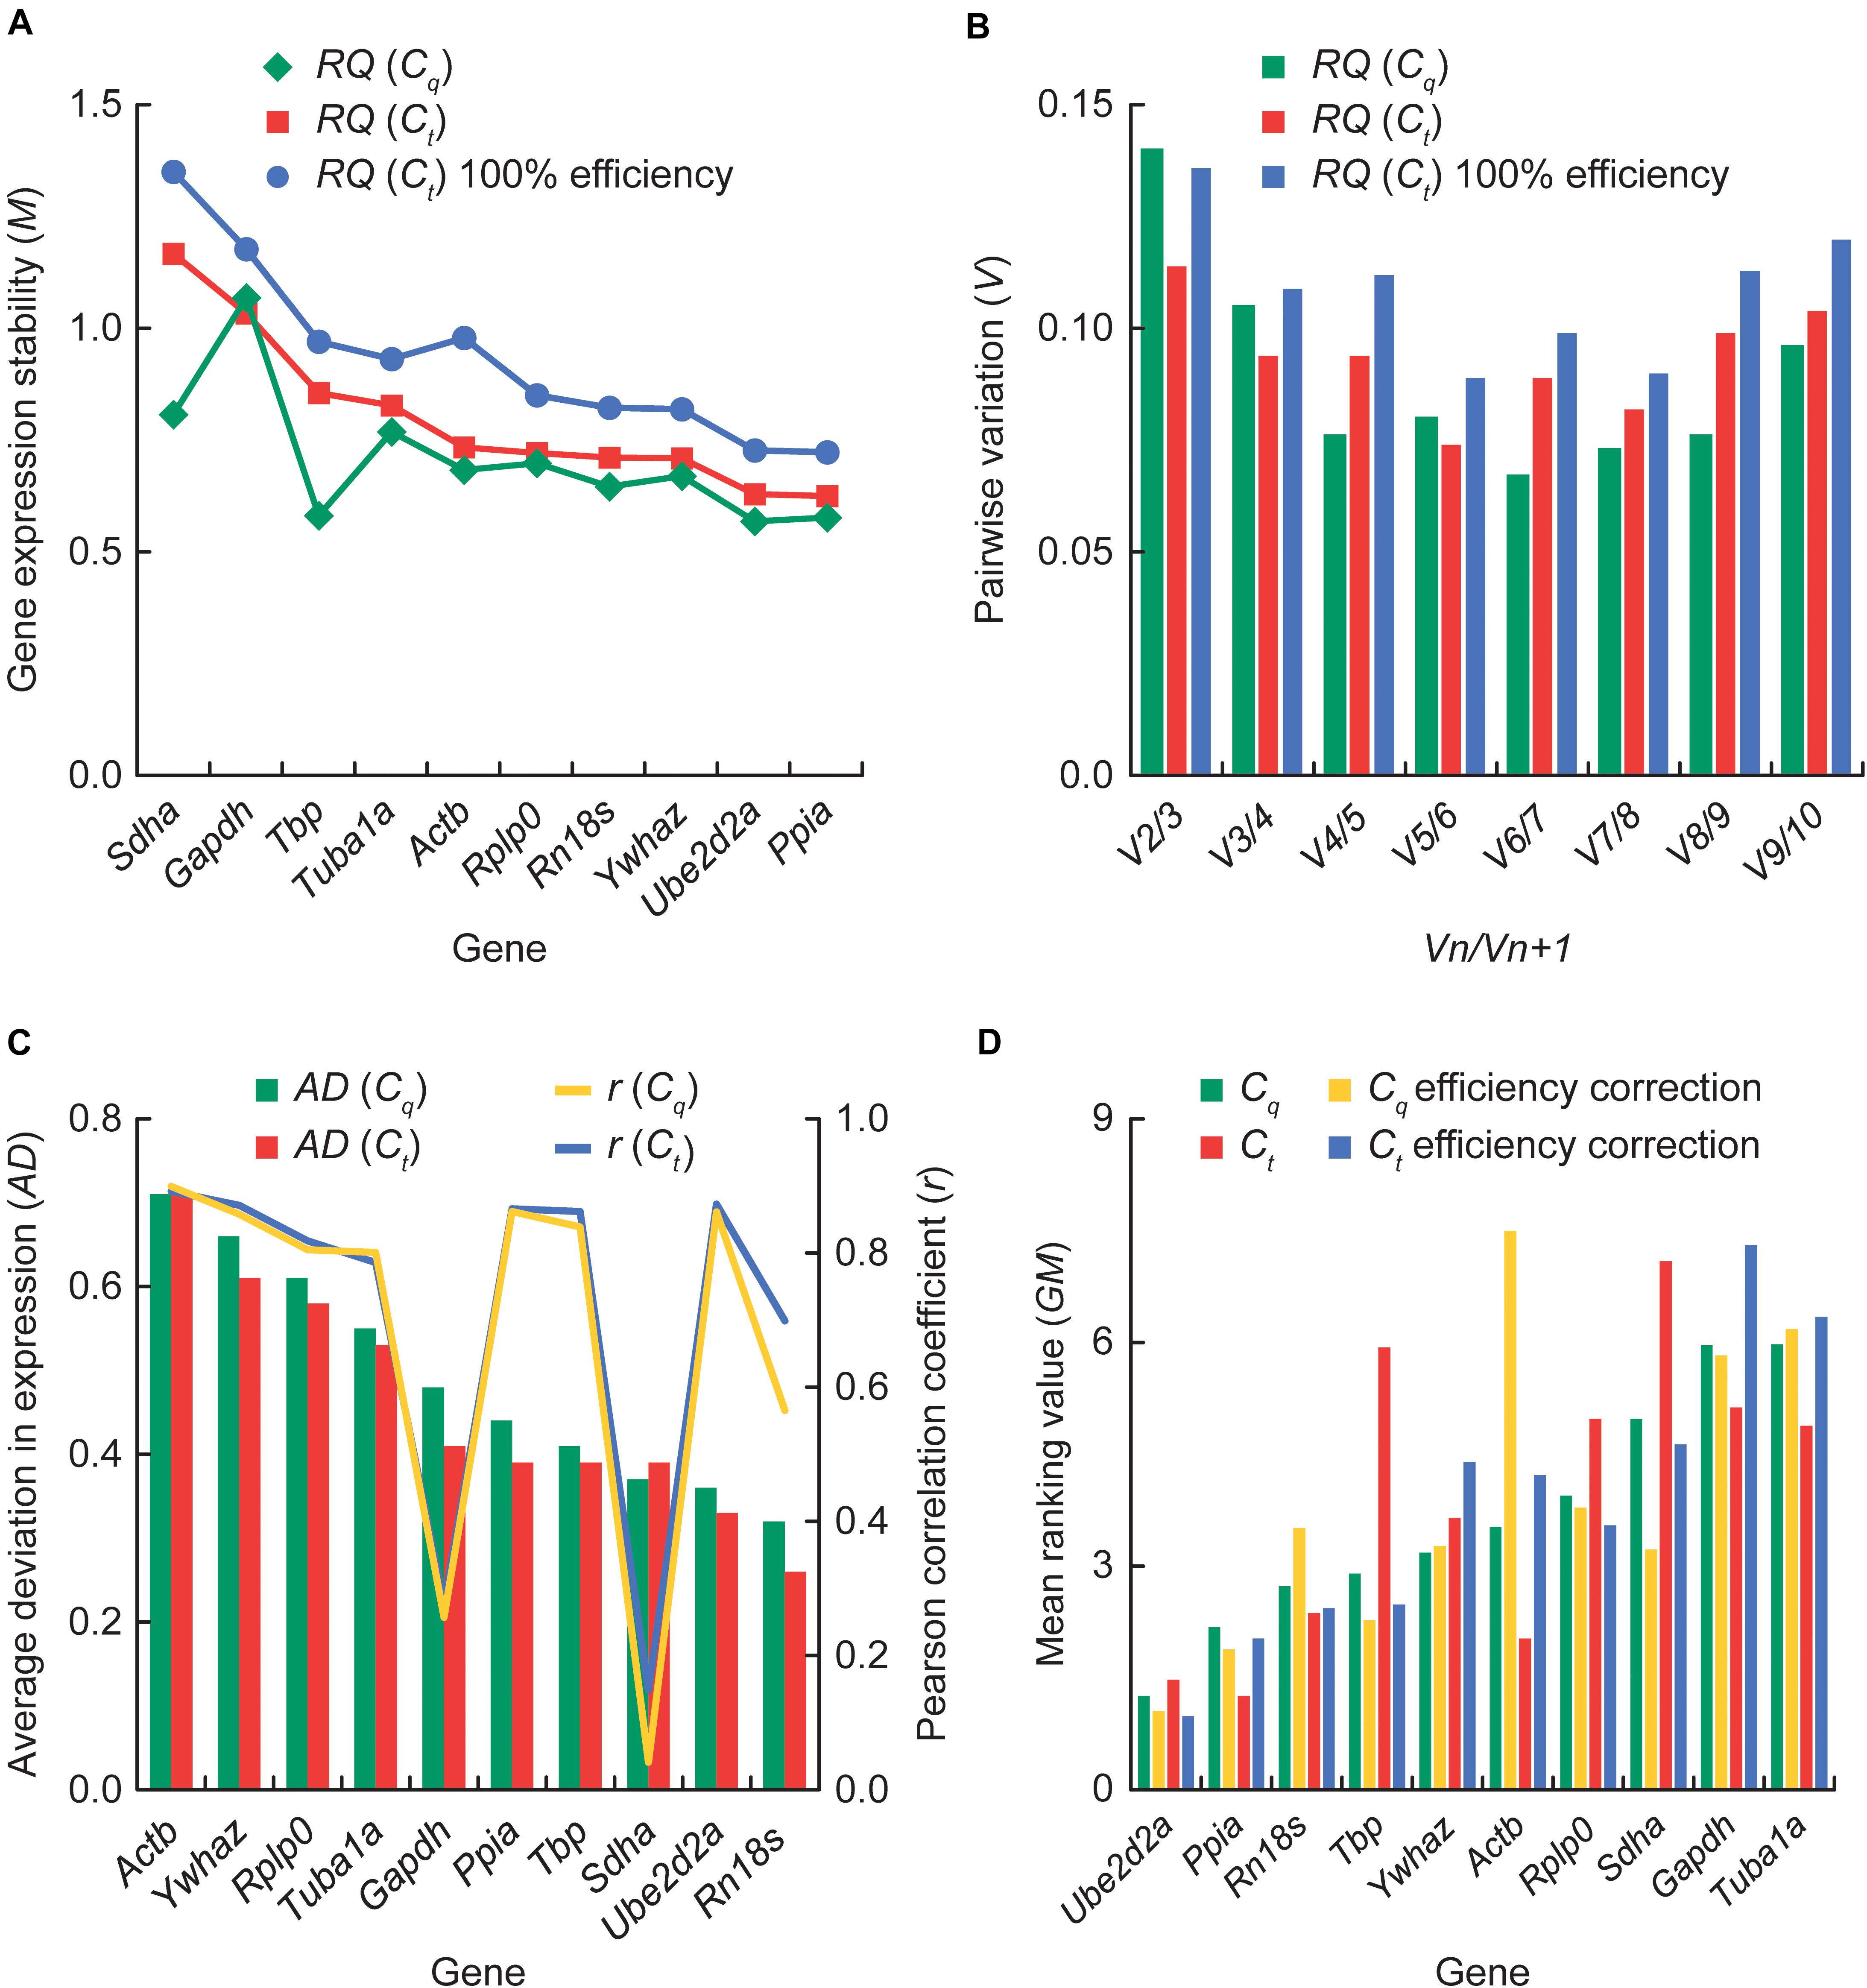
Figure 3. Gene expression stability analysis. (A) The average expression stability (M) calculated with geNorm, with the more stable genes toward the right-hand end of the graph. For comparison, results based on the relative quantity (RQ) estimated from the second derivative (Cq) data are shown along with those based on the threshold cycle (Ct) data assuming either reaction-specific or 100% qPCR efficiency. (B) Pairwise variation (Vn/Vn+1) calculated with geNorm for two sequential sets containing an increasing number of genes. A value below 0.15 indicates that the addition of another gene has no significant effect in data normalization. (C) BestKeeper ranking by decreasing average deviation (AD) in gene expression values. Pearson correlation coefficient (r) of the expression level of each gene with the BestKeeper Index (the geometric average of all genes) is also shown. For comparison, results based on the Cq data are shown along with those based on the Ct data. (D) Comprehensive ranking with RefFinder by the geometric mean of the ranking weights assigned to each gene based on the results from geNorm, NormFinder, BestKeeper, and the ΔCq method. Results based on efficiency corrected and non-corrected Cq and Ct values are shown for comparison.
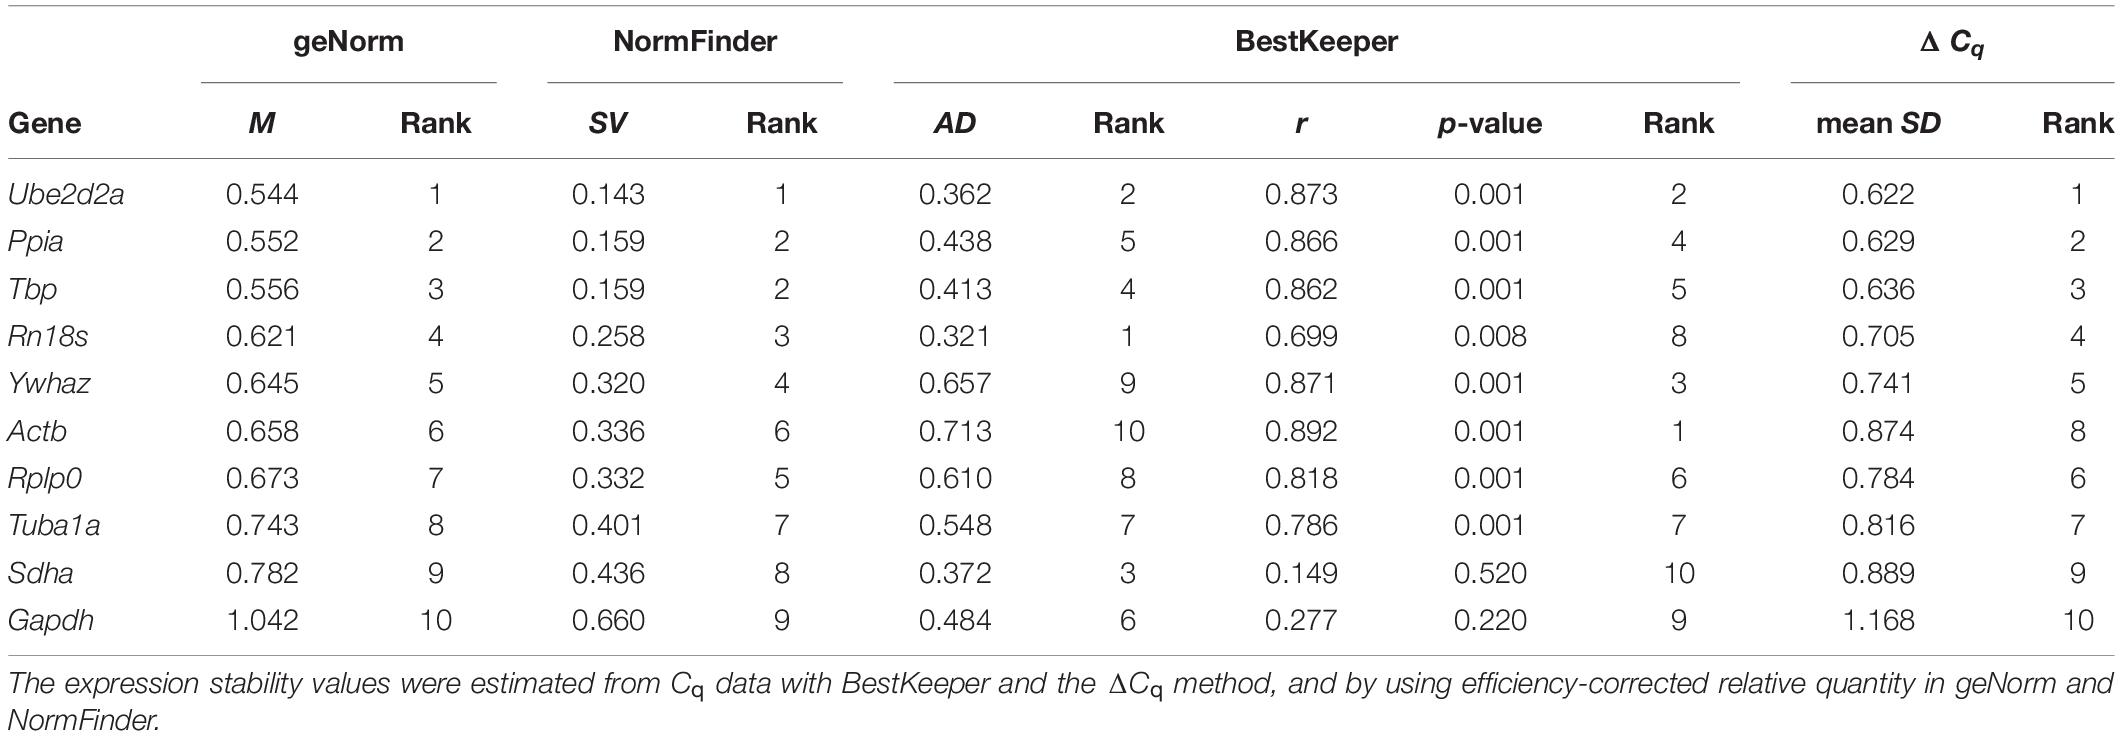
Table 1. Gene expression variation and ranking of the bank vole genes.
Ube2d2a, Ppia, Tbp, and Rn18s had the lowest SVs and therefore ranked as the four most stable genes in the NormFinder analysis (Table 1), including across the sample subgroups defined by gender (males n = 10; females n = 11) and latitude (northern apex n = 7, central n = 8, southern refugial n = 6), respectively (Supplementary Tables S5, S6), whereas Gapdh and Sdha consistently were at the end of the rankings (Table 1 and Supplementary Tables S5, S6). The grouped analysis by gender suggested Ppia and Ube2d2a or Ppia and Tbp (depending on the RQ estimate used) as the two best genes with minimal intergroup and intragroup expression variation, whereas Tbp and Ube2d2a were consistently the best pair outperforming any single gene when grouped by the latitudinal zone (Supplementary Tables S5, S6).
The AD values of all genes calculated by BestKeeper were below 1 (Figure 3C), indicating low enough variation for the subsequent analysis. Rn18s and Ube2d2a had consistently the lowest AD, followed by Sdha, Tbp, and Ppia in both Cq (Supplementary Table S7) and Ct analyses (Supplementary Table S8), although in a different order, whereas Actb and Ywhaz consistently showed the highest AD (Figure 3C). Tbp, Sdha and Ube2d2a had the lowest CVs (Supplementary Tables S7, S8). All genes were significantly correlated (P < 0.01) with the BKI, with the exception of Gapdh and Sdha (Figure 3C and Supplementary Tables S7, S8).
The lowest levels of deviation in the comparative ΔCq analysis were observed for Ube2d2a, Ppia, Tbp, and Rn18s, regardless of whether Cq or Ct data were used, whereas Gapdh, Sdha and Actb showed consistently the highest deviation (Table 1 and Supplementary Figure S1; results derived from Ct values not shown).
Based on the geometric mean of the rankings given by each method, RefFinder indicated that Ube2d2a and Ppia were the two overall most stable genes and these results did not differ between the analyses using efficiency corrected and non-corrected Cq and Ct values as input (Figure 3D). For the non-corrected Cq and efficiency corrected Ct, the best two genes were followed by Rn18s and Tbp, for the efficiency corrected Cq by Tbp and Sdha, and for the non-corrected Ct by Actb and Rn18s. In contrast, Tuba1a, Gapdh and Sdha were overall worst ranked (Figure 3D).
Discussion
It is becoming increasingly evident that RGs commonly used in RT-qPCR experiments may show considerable expression variation (Hernandez-Santana et al., 2016; Jo et al., 2019). Furthermore, when studying gene expression in wild populations there are additional sources of variation due to the natural heterogeneity of the sample (Kozera and Rapacz, 2013; Huang and Agrawal, 2016). In this study we have identified two strong pairs of RGs for the use in RT-qPCR studies of the bank vole, an emerging model species for evolutionary and epidemiological studies (Marková et al., 2020).
Although we did not find absolute consensus between the different approaches, gene rankings were similar and three genes were characterized by high expression stability needed to provide the correct normalization, despite the natural heterogeneity of the sample and regardless of the gene expression measure used and whether the efficiency correction was applied or not. Specifically, Ube2d2a, Ppia, and Tbp were identified as the three most stably expressed genes by GeNorm, NormFinder and the ΔCq method, and ranked as three of the top five genes by BestKeeper. A pairwise variation analysis in geNorm further indicated Ube2d2a and Ppia to be a combination sufficient for the normalization. When considering gender and latitudinal zone as sources of variation (Andersen et al., 2004), NormFinder again suggested Ube2d2a, Ppia, Tbp, and Rn18s as the most stable genes, with the best two-gene combinations supported by multiple RQ estimates being those of Ube2d2a and Ppia and Ube2d2a and Tbp, respectively.
Although not traditional housekeeping genes, the function and expression stability of Ube2d2a and Ppia are likely not tissue specific to spleen in the bank vole. Both genes show low tissue specificity in other rodents and in humans (Ryffel et al., 1991; Jensen et al., 1995; Wing et al., 1996; Kim et al., 2014), and they play important roles in cell signaling related to post-translational modification and transcription activation, respectively, which are conserved across different cell types and species (Jensen et al., 1995; Wing et al., 1996; Guo et al., 2016). A recent study of a different mammalian model, yaks, found Ube2d2a and Ppia to be stably expressed across heart, liver, spleen, lung, kidney and skin tissues (Li et al., 2017). From the consistency of our results, it is clear that Ube2d2a and Ppia present higher expression stability in our system than some of the commonly used RGs, i.e., Actb, Gapdh, Sdha, or Tuba1a, and should be considered suitable alternatives. These results support that common RGs may show high expression variability in some tissues or experimental settings and other genes may thus present better RGs (Hernandez-Santana et al., 2016; Li et al., 2017). A possible explanation for a higher expression variation of a housekeeping gene in some tissues is that alternative genes carry the same basal “housekeeping” functions in different tissues (Zhang et al., 2015).
The remaining three genes (Rn18s, Rplp0, and Ywhaz) showed good stability values and may also make suitable RGs under certain experimental conditions. For example, because of the high abundancy of ribosomal RNA transcripts in most cells (O’Neil et al., 2013), Rn18s can serve as RG when analyzing levels of highly expressed target genes to ensure similar reaction kinetics (Vandesompele et al., 2002).
Our results are largely concordant with a recent study of Dvořáková et al. (2020), which compared the expression levels of six genes in a small number of bank voles and identified Ppia and Rn18s as low variance RGs. Interestingly, significant differences in the expression levels of the highly expressed bank vole globin genes (mean Cq of 12) were only found when data were normalized to Rn18s but not to Ppia (Dvořáková et al., 2020), supporting the importance of similar transcript levels between the RGs and target genes (Vandesompele et al., 2002).
The fact that the genes show stable expression levels in a sample of bank voles from across Europe suggests they may fit as RGs for a broad range of geographical settings. The robustness of the results with respect to the quantification cycle measure (second derivative or threshold) and reaction efficiency assumptions (reaction-specific versus 100%) indicates these genes are also likely to perform well with different protocols and laboratory setups.
The findings of our study are based on data from spleen, which was the available tissue in our broad geographical sampling, but we recognize that it may not be fully representative of every tissue. Despite this limitation, we anticipate that the selected RGs will be applicable to studies addressing a broad range of biological and biomedical problems. The transcription in spleen responds to various physiological and pathological processes, which makes it a suitable tissue for broad range of studies including immunology, toxicology, parasitology and physiology (Guivier et al., 2014; Rossow et al., 2014; Dubois et al., 2018; Dvořáková et al., 2020). The fact that it is a hematopoietic organ in rodents (Brodsky et al., 1966) makes spleen particularly well-suited also for gene expression studies of erythroid and other hematopoietic genes, including globin genes with important ecological and evolutionary functions (Kotlík et al., 2014; Dvořáková et al., 2020).
Taken together, our results highlight the need of a systematic evaluation of appropriate RGs for each study system. Our approach has identified Ube2d2a and Ppia or Ube2d2a and Tbp as the best combinations of RGs in a naturally heterogeneous sample of bank voles while some of the traditional housekeeping genes, such as Actb, Gapdh, Sdha, and Tuba1a, have shown lower stability, and therefore we cannot recommend their use for normalization. It remains unclear to what extent this result applies to other tissues, and researchers planning qPCR gene-expression experiments in the bank vole should make every effort to evaluate the RGs in their particular setting. In this regard, the findings of our study should provide a valuable starting point for such effort.
Data Availability Statement
The raw data supporting the conclusions of this article will be made available by the authors, without undue reservation, to any qualified researcher.
Author Contributions
LN, SM, and PK designed the study and wrote the manuscript. LN and SM carried out the experiments. LN analyzed the data. All authors contributed to the article and approved the submitted version.
Funding
This work was supported by funding to PK from the Czech Science Foundation (Grant No. 20-11058S), Ministry of Education, Youth and Sports of the Czech Republic (project EXCELLENCE CZ.02.1.01/0.0/0.0/15_003/0 000460 OP RDE), and by the institutional support (RVO 67985904).
Conflict of Interest
The authors declare that the research was conducted in the absence of any commercial or financial relationships that could be construed as a potential conflict of interest.
Acknowledgments
Petra Šejnohová provided expert technical assistance and Ahmed Gad read the manuscript and offered helpful suggestions.
Supplementary Material
The Supplementary Material for this article can be found online at: https://www.frontiersin.org/articles/10.3389/fevo.2020.562065/full#supplementary-material
Supplementary Figure 1 | Gene expression stability analysis using the ΔCq method.
Supplementary Table 1 | The genes analyzed.
Supplementary Table 2 | Geographical origin of the bank vole samples across Europe.
Supplementary Table 3 | Primers used for RT-qPCR.
Supplementary Table 4 | Summary of variation in the qPCR amplification efficiency (E) and quantification cycle values Cq, Ct, and efficiency-corrected Ct for each gene.
Supplementary Table 5 | Gene ranking based on stability values (SVs) from grouped analysis with NormFinder using efficiency-corrected relative quantities (RQs) derived from the Cq data as input.
Supplementary Table 6 | Gene ranking based on stability values (SVs) from grouped analysis with NormFinder using relative quantities (RQs) derived from the Ct data and assuming either reaction-specific or 100% efficiencies of qPCR.
Supplementary Table 7 | Expression stability analysis with BestKeeper based on the Cq data, including the pairwise correlation of each gene with the BestKeeper Index.
Supplementary Table 8 | Expression stability analysis with BestKeeper based on the Ct data, including the pairwise correlation of each gene with the BestKeeper Index.
Footnotes
References
Andersen, C. L., Jensen, J. L., and Ørntoft, T. F. (2004). Normalization of real-time quantitative reverse transcription-PCR data: a model-based variance estimation approach to identify genes suited for normalization, applied to bladder and colon cancer data sets. Cancer Res. 64, 5245–5250. doi: 10.1158/0008-5472
Brodsky, I., Dennis, L. H., Kahn, S. B., and Brady, L. W. (1966). Normal mouse erythropoiesis. I. The role of the spleen in mouse erythropoiesis. Cancer Res. 26, 198–201.
Bustin, S. A. (2002). Quantification of mRNA using real-time reverse transcription PCR (RT-PCR): trends and problems. J. Mol. Endocrinol. 29, 23–39. doi: 10.1677/jme.0.0290023
Bustin, S. A., Benes, V., Garson, J. A., Hellemans, J., Huggett, J., Kubista, M., et al. (2009). The MIQE guidelines: minimum information for publication of quantitative real-time PCR experiments. Clin. Chem. 55, 611–622. doi: 10.1373/clinchem.2008.112797
Camacho Londoño, J., and Philipp, S. E. (2016). A reliable method for quantification of splice variants using RT-qPCR. BMC Mol. Biol. 17:8. doi: 10.1186/s12867-016-0060-1
Colangelo, P., Aloise, G., Franchini, P., Annesi, F., and Amori, G. (2012). Mitochondrial DNA reveals hidden diversity and an ancestral lineage of the bank vole in the Italian peninsula. J. Zool. 287, 41–52. doi: 10.1111/j.1469-7998.2011.00884.x
De Spiegelaere, W., Dern-Wieloch, J., Weigel, R., Schumacher, V., Schorle, H., Nettersheim, D., et al. (2015). Reference gene validation for RT-qPCR, a note on different available software packages. PLoS One 10:e0122515. doi: 10.1371/journal.pone.0122515
Deffontaine, V., Libois, R., Kotlík, P., Sommer, R. S., Nieberding, C., Paradis, E., et al. (2005). Beyond the Mediterranean peninsulas: evidence of central European glacial refugia for a temperate forest mammal species, the bank vole (Clethrionomys glareolus). Mol. Ecol. 14, 1727–1739. doi: 10.1111/j.1365-294X.2005.02506.x
Dubois, A., Castel, G., Murri, S., Pulido, C., Pons, J. B., Benoit, L., et al. (2018). Bank vole immunoheterogeneity may limit Nephropatia Epidemica emergence in a French non-endemic region. Parasitology 145, 393–407. doi: 10.1017/S0031182017001548
Dvořáková, V., Horníková, M., Němcová, L., Marková, S., and Kotlík, P. (2020). Regulatory variation in functionally polymorphic globin genes of the bank vole: a possible role for adaptation. Front. Ecol. Evol. 7:514. doi: 10.3389/fevo.2019.00514
Eisenberg, E., and Levanon, E. Y. (2013). Human housekeeping genes, revisited. Trends Genet. 29, 569–574. doi: 10.1016/j.tig.2013.05.010
Filipi, K., Marková, S., Searle, J. B., and Kotlík, P. (2015). Mitogenomic phylogenetics of the bank vole Clethrionomys glareolus, a model system for studying end-glacial colonization of Europe. Mol. Phylogenet. Evol. 82, 245–257. doi: 10.1016/j.ympev.2014.10.016
Franke, A., Ulrich, R. G., Weber, S., Osterrieder, N., Keller, M., Hoffmann, D., et al. (2017). Experimental cowpox virus (CPXV) infections of bank voles: exceptional clinical resistance and variable reservoir competence. Viruses 9:391. doi: 10.3390/v9120391
Fraser, H. B. (2013). Gene expression drives local adaptation in humans. Genome Res. 23, 1089–1096. doi: 10.1101/gr.152710.112
Fraser, H. B., Moses, A. M., and Schadt, E. E. (2010). Evidence for widespread adaptive evolution of gene expression in budding yeast. Proc. Natl. Acad. Sci. U.S.A. 107, 2977–2982. doi: 10.1073/pnas.0912245107
Guivier, E., Galan, M., Henttonen, H., Cosson, J. F., and Charbonnel, N. (2014). Landscape features and helminth co-infection shape bank vole immunoheterogeneity, with consequences for Puumala virus epidemiology. Heredity 112, 274–281. doi: 10.1038/hdy.2013.103
Guo, M., James, A. W., Kwak, J. H., Shen, J., Yokoyama, K. K., Ting, K., et al. (2016). Cyclophilin A (CypA) plays dual roles in regulation of bone anabolism and resorption. Sci. Rep. 6, 1–10. doi: 10.1038/srep22378
Harrison, P. W., Wright, A. E., and Mank, J. E. (2012). The evolution of gene expression and the transcriptome-phenotype relationship. Semin. Cell Dev. Biol. 23, 222–229. doi: 10.1016/j.semcdb.2011.12.004
Hauffe, H. C., Niklasson, B., Olsson, T., Bianchi, A., Rizzoli, A., and Klitz, W. (2010). Ljungan virus detected in bank voles (Myodes glareolus) and yellow-necked mice (Apodemus flavicollis) from northern Italy. J. Wildl. Dis. 46, 262–266. doi: 10.7589/0090-3558-46.1.262
Hernandez-Santana, Y. E., Ontoria, E., Gonzalez-García, A. C., Quispe-Ricalde, M. A., Larraga, V., Valladares, B., et al. (2016). The challenge of stability in high-throughput gene expression analysis: comprehensive selection and evaluation of reference genes for BALB/c mice spleen samples in the Leishmania infantum infection model. PLoS One 11:e0163219. doi: 10.1371/journal.pone.0163219
Huang, Y., and Agrawal, A. F. (2016). Experimental evolution of gene expression and plasticity in alternative selective regimes. PLoS Genet. 12:1006336. doi: 10.1371/journal.pgen.1006336
Huggett, J., Dheda, K., Bustin, S., and Zumla, A. (2005). Real-time RT-PCR normalisation; strategies and considerations. Genes Immun. 6, 279–284. doi: 10.1038/sj.gene.6364190
Jensen, J. P., Bates, P. W., Yang, M., Vierstra, R. D., and Weissman, A. M. (1995). Identification of a family of closely related human ubiquitin conjugating enzymes. J. Biol. Chem. 270, 30408–30414. doi: 10.1074/jbc.270.51.30408
Jo, J., Choi, S., Oh, J., Lee, S. G., Choi, S. Y., Kim, K. K., et al. (2019). Conventionally used reference genes are not outstanding for normalization of gene expression in human cancer research. BMC Bioinform. 20:245. doi: 10.1186/s12859-019-2809-2
Johannesen, E., and Mauritzen, M. (1999). Habitat selection of grey-sided voles and bank voles in two subalpine populations in southern Norway. Ann. Zool. Fennici. 36, 215–222. doi: 10.2307/23735729
Khalil, H., Ecke, F., Evander, M., Bucht, G., and Hörnfeldt, B. (2019). Population dynamics of bank voles predicts human Puumala hantavirus risk. Ecohealth 16, 545–557. doi: 10.1007/s10393-019-01424-4
Kim, H. S. H. J., Na, J. I. J. Y., Min, B. W., Na, J. I. J. Y., Lee, K. H., Lee, J. H., et al. (2014). Evaluation of protein expression in housekeeping genes across multiple tissues in rats. Korean J. Pathol. 48, 193–200. doi: 10.4132/KoreanJPathol.2014.48.3.193
Kotlík, P., Marková, S., Konczal, M., Babik, W., and Searle, J. B. (2018). Genomics of end-pleistocene population replacement in a small mammal. Proc. R. Soc. B Biol. Sci. 285:20172624. doi: 10.1098/rspb.2017.2624
Kotlík, P., Marková, S., Vojtek, L., Stratil, A., Slechta, V., Hyršl, P., et al. (2014). Adaptive phylogeography: functional divergence between haemoglobins derived from different glacial refugia in the bank vole. Proceedings. Biol. Sci. 281:20140021. doi: 10.1098/rspb.2014.0021
Kozera, B., and Rapacz, M. (2013). Reference genes in real-time PCR. J. Appl. Genet. 54, 391–406. doi: 10.1007/s13353-013-0173-x
Lai, Z., Kane, N. C., Zou, Y., and Rieseberg, L. H. (2008). Natural variation in gene expression between wild and weedy populations of Helianthus annuus. Genetics 179, 1881–1890. doi: 10.1534/genetics.108.091041
Lenz, T. L. (2015). Transcription in space - environmental vs. genetic effects on differential immune gene expression. Mol. Ecol. 24, 4583–4585. doi: 10.1111/mec.13356
Li, M., Wu, X., Guo, X., Bao, P., Ding, X., Chu, M., et al. (2017). Identification of optimal reference genes for examination of gene expression in different tissues of fetal yaks. Czech. J. Anim. Sci. 62, 426–434. doi: 10.17221/75/2016-CJAS
Lin, H. Y., Liu, Q., Li, X., Yang, J., Liu, S., Huang, Y., et al. (2017). Substantial contribution of genetic variation in the expression of transcription factors to phenotypic variation revealed by eRD-GWAS. Genome Biol. 18:192. doi: 10.1186/s13059-017-1328-6
Livak, K. J., and Schmittgen, T. D. (2001). Analysis of relative gene expression data using real-time quantitative PCR and the 2-ΔΔCT method. Methods 25, 402–408. doi: 10.1006/meth.2001.1262
Madriéres, S., Castel, G., Charbonnel, N., Vulin, J., and Marianneau, P. (2019). The needs for developing experiments on reservoirs in hantavirus research: accomplishments, challenges and promises for the future. Viruses 11:664. doi: 10.3390/v11070664
Marková, S., Horníková, M., Lanier, H. C., Henttonen, H., Searle, J. B., Weider, L. J., et al. (2020). High genomic diversity in the bank vole at the northern apex of a range expansion: the role of multiple colonizations and end-glacial refugia. Mol. Ecol. 29, 1730–1744. doi: 10.1111/mec.15427
Mccurdy, R. D., Mcgrath, J. J., and Mackay-Sim, A. (2008). Validation of the comparative quantification method of real-time PCR analysis and a cautionary tale of housekeeping gene selection. Gene Ther. Mol. Biol. 12, 15–24.
Mikowska, M., Dziublińska, B., and Świergosz-Kowalewska, R. (2018). Variation of metallothionein I and II gene expression in the bank vole (Clethrionomys glareolus) under environmental zinc and cadmium exposure. Arch. Environ. Contam. Toxicol. 75, 66–74. doi: 10.1007/s00244-017-0485-7
Müller, A., Baumann, A., Essbauer, S., Radosa, L., Krüger, D. H., Witkowski, P. T., et al. (2019). Analysis of the integrin β3 receptor for pathogenic orthohantaviruses in rodent host species. Virus Res. 267, 36–40. doi: 10.1016/j.virusres.2019.04.009
Mustonen, V., Kesäniemi, J., Lavrinienko, A., Tukalenko, E., Mappes, T., Watts, P. C., et al. (2018). Fibroblasts from bank voles inhabiting Chernobyl have increased resistance against oxidative and DNA stresses. BMC Cell Biol. 19:17. doi: 10.1186/s12860-018-0169-9
Nuzhdin, S. V., Wayne, M. L., Harmon, K. L., and McIntyre, L. M. (2004). Common pattern of evolution of gene expression level and protein sequence in Drosophila. Mol. Biol. Evol. 21, 1308–1317. doi: 10.1093/molbev/msh128
O’Neil, D., Glowatz, H., and Schlumpberge, M. (2013). Ribosomal RNA depletion for efficient use of RNA-seq capacity. Curr. Protoc. Mol. Biol. Chap. 4:Unit4.19. doi: 10.1002/0471142727.mb0419s103
Pedreschi, D., García-Rodríguez, O., Yannic, G., Cantarello, E., Diaz, A., Golicher, D., et al. (2019). Challenging the European southern refugium hypothesis: species-specific structures versus general patterns of genetic diversity and differentiation among small mammals. Glob. Ecol. Biogeogr. 28, 262–274. doi: 10.1111/geb.12828
Pfaffl, M. W. (2004). “Quantification strategies in real-time RT-PCR,” in A-Z of Quantitative PCR, ed. S. A. Bustin (La Jolla, CA: International University Line), 87–112.
Pfaffl, M. W., Tichopad, A., Prgomet, C., and Neuvians, T. P. (2004). Determination of stable housekeeping genes, differentially regulated target genes and sample integrity: BestKeeper - Excel-based tool using pair-wise correlations. Biotechnol. Lett. 26, 509–515. doi: 10.1023/B:BILE.0000019559.84305.47
Rossow, H., Forbes, K. M., Tarkka, E., Kinnunen, P. M., Hemmilä, H., Huitu, O., et al. (2014). Experimental infection of voles with Francisella tularensis indicates their amplification role in tularemia outbreaks. PLoS One 9:e108864. doi: 10.1371/journal.pone.0108864
Ryffel, B., Woerly, G., Greiner, B., Haendler, B., Mihatsch, M. J., and Foxwell, B. M. (1991). Distribution of the cyclosporine binding protein cyclophilin in human tissues. Immunology 72, 399–404.
Sandkam, B., Young, C. M., and Breden, F. (2015). Beauty in the eyes of the beholders: colour vision is tuned to mate preference in the Trinidadian guppy (Poecilia reticulata). Mol. Ecol. 24, 596–609. doi: 10.1111/mec.13058
Silver, N., Best, S., Jiang, J., and Thein, S. L. (2006). Selection of housekeeping genes for gene expression studies in human reticulocytes using real-time PCR. BMC Mol. Biol. 7:33. doi: 10.1186/1471-2199-7-33
Strážnická, M., Marková, S., Searle, J. B., and Kotlík, P. (2018). Playing hide-and-seek in beta-globin genes: gene conversion transferring a beneficial mutation between differentially expressed gene duplicates. Genes 9:492. doi: 10.3390/genes9100492
Świergosz-Kowalewska, R., and Holewa, I. (2007). Cadmium, zinc and iron interactions in the tissues of bank vole Clethrionomys glareolus after exposure to low and high doses of cadmium chloride. Biometals 20, 743–749. doi: 10.1007/s10534-006-9037-8
Torre, I., and Arrizabalaga, A. (2008). Habitat preferences of the bank vole Myodes glareolus in a Mediterranean mountain range. Acta Theriol. 53, 241–250. doi: 10.1007/BF03193120
Townsend, J. P., Cavalieri, D., and Hartl, D. L. (2003). Population genetic variation in genome-wide gene expression. Mol. Biol. Evol. 20, 955–963. doi: 10.1093/molbev/msg106
Vandesompele, J., De Preter, K., Pattyn, F., Poppe, B., Van Roy, N., De Paepe, A., et al. (2002). Accurate normalization of real-time quantitative RT-PCR data by geometric averaging of multiple internal control genes. Genome Biol. 3:research0034.1. doi: 10.1186/gb-2002-3-7-research0034
VanGuilder, H. D., Vrana, K. E., and Freeman, W. M. (2008). Twenty-five years of quantitative PCR for gene expression analysis. Biotechniques 44, 619–626. doi: 10.2144/000112776
Wing, S. S., Bédard, N., Morales, C., Hingamp, P., and Trasler, J. (1996). A novel rat homolog of the Saccharomyces cerevisiae ubiquitin-conjugating enzymes UBC4 and UBC5 with distinct biochemical features is induced during spermatogenesis. Mol. Cell. Biol. 16, 4064–4072. doi: 10.1128/mcb.16.8.4064
Wójcik, J. M., Kawałko, A., Marková, S., Searle, J. B., and Kotlík, P. (2010). Phylogeographic signatures of northward post-glacial colonization from high-latitude refugia: a case study of bank voles using museum specimens. J. Zool. 281, 249–262. doi: 10.1111/j.1469-7998.2010.00699.x
Xie, F., Xiao, P., Chen, D., Xu, L., and Zhang, B. (2012). miRDeepFinder: a miRNA analysis tool for deep sequencing of plant small RNAs. Plant Mol. Biol. 80, 75–84. doi: 10.1007/s11103-012-9885-2
Zarzycka, M., Gorowska-Wojtowicz, E., Tworzydlo, W., Klak, A., Kozub, K., Hejmej, A., et al. (2016). Are aryl hydrocarbon receptor and G-protein-coupled receptor 30 involved in the regulation of seasonal testis activity in photosensitive rodent—the bank vole (Myodes glareolus)? Theriogenology 86, 674–686. doi: 10.1016/j.theriogenology.2016.02.019
Keywords: housekeeping genes, latitude, Myodes glareolus, RT-qPCR, natural populations
Citation: Němcová L, Marková S and Kotlík P (2020) Gene Expression Variation of Candidate Endogenous Control Genes Across Latitudinal Populations of the Bank Vole (Clethrionomys glareolus). Front. Ecol. Evol. 8:562065. doi: 10.3389/fevo.2020.562065
Received: 14 May 2020; Accepted: 24 September 2020;
Published: 21 October 2020.
Edited by:
Bregje Wertheim, University of Groningen, NetherlandsReviewed by:
Ben-Yang Liao, National Health Research Institutes, TaiwanJing Yang, Shanxi Agricultural University, China
Copyright © 2020 Němcová, Marková and Kotlík. This is an open-access article distributed under the terms of the Creative Commons Attribution License (CC BY). The use, distribution or reproduction in other forums is permitted, provided the original author(s) and the copyright owner(s) are credited and that the original publication in this journal is cited, in accordance with accepted academic practice. No use, distribution or reproduction is permitted which does not comply with these terms.
*Correspondence: Petr Kotlík, a290bGlrQGlhcGcuY2FzLmN6
†These authors have contributed equally to this work