 Andreas Wagner1,2,3*
- 1Institute of Evolutionary Biology and Environmental Studies, University of Zurich, Zurich, Switzerland
- 2Swiss Institute of Bioinformatics, Lausanne, Switzerland
- 3Santa Fe Institute, Santa Fe, NM, United States
Exaptations are adaptive traits that do not originate de novo but from other adaptive traits. They include complex macroscopic traits, such as the middle ear bones of mammals, which originated from reptile jaw bones, but also molecular traits, such as new binding sites of transcriptional regulators. What determines whether a trait originates de novo or as an exaptation is unknown. I here use simple information theoretic concepts to quantify a molecular phenotype’s potential to give rise to new phenotypes. These quantities rely on the amount of genetic information needed to encode a phenotype. I use these quantities to estimate the propensity of new transcription factor binding phenotypes to emerge de novo or exaptively, and do so for 187 mouse transcription factors. I also use them to quantify whether an organism’s viability in one of 10 different chemical environment is likely to arise exaptively. I show that informationally expensive traits are more likely to originate exaptively. Exaptive evolution is only sometimes favored for new transcription factor binding, but it is always favored for the informationally complex metabolic phenotypes I consider. As our ability to genotype evolving populations increases, so will our ability to understand how phenotypes of ever-increasing informational complexity originate in evolution.
Introduction
Evolution creates many traits from previously existing traits rather than de novo. This notion is as old as Charles Darwin’s Origin of Species, where Darwin pointed to examples that include the lungs of vertebrates, which are homologous to the swim bladders of fish, and respiratory organs of some barnacles, which he thought evolved from egg-retaining structures he called ovigerous frenae (Darwin, 1872, p 176–177). Multiple morphological examples like these were already known in the nineteenth century, and during the twentieth century, numerous molecular examples were also discovered. They include the crystallins, proteins that allow eye lenses to refract light. Many of them are co-opted from proteins that include metabolic enzymes and heat shock proteins (Piatigorsky and Wistow, 1989; Piatigorsky, 1998). Other examples include the regulatory circuits formed by Hox genes, which pattern the main body axis in many organisms and have been co-opted for multiple other purposes, among them vertebrate limb development (True and Carroll, 2002). Since the late twentieth century such co-opted traits have been called exaptations (Gould and Vrba, 1982).
Not all exaptations are created equal. Some exaptations require substantial change of an ancestral trait, like the change that transform a forelimb into a bat’s wing. Others, like crystallins, require as little change as expressing a gene in a new location like the eye lens. Yet others may require no genetic change at all. Examples include enzymes that catalyze not just one main reaction but multiple side reactions, such as antibiotic resistance proteins that cleave one “native” antibiotic and multiple others (Khersonsky and Tawfik, 2010). Such latent beneficial traits only require the right (antibiotic containing) environment to become adaptive, illustrating that environmental change can play an important role in the origin of exaptations.
Many co-opted traits are bifunctional, serving their old, and a new role simultaneously. For example, the fore-and hind-limbs of flying squirrels (Pteromyini) have been altered to help support the patagium, the membrane that allows these animals to glide between trees. At the same time, these limbs still allow walking and running (Thorington and Santana, 2007). Some such bifunctional intermediates undergo further refinement or secondary adaptation (Gould and Vrba, 1982). Take feathers, which probably originated to keep a body warm (Norell and Xu, 2005). Their shape and structure needed to be transformed before birds could fly, such that modern pennaceous feathers serve their new role in flight better than their original role in thermal insulation. In yet other traits, secondary adaptation causes a complete loss of the original role. A molecular example is the lactalbumin protein, which helps mammals synthesize lactose. It derives from lysozyme, an ancient enzyme, but has completely lost its original bacteriocidal function (Qasba and Kumar, 1997). Another example involves the middle ear bones that transduce sound in mammals but are derived from reptile jaw bones. One of them is the incus, which is derived from the quadrate bone of the reptilian upper jaw. In therapsids—extinct reptiles that include the ancestors of today’s mammals—the quadrate functioned both as part of the jaw joint and as part of the auditory system, but has since lost its original function in the jaw joint (Fay et al., 2004; Luo, 2007). Most exaptations will have such bifunctional intermediates, because the simultaneous loss of an old phenotype and gain of a new phenotype is more difficult and rare than a gradual shift between phenotypes. I will thus focus on the transition between a trait and a bifunctional intermediate.
The importance of exaptations in biological evolution has been defended largely on the basis of known examples. However, it would be useful to quantify how likely any one trait is to originate de novo or as an exaptation from another trait. And it would be useful to compare traits in this regard. Is it harder to evolve the Panda’s thumb from a sesamoid bone, or our inner ear bones from a reptilian jaw? Questions like this cannot currently be answered for morphological traits, because their genetic basis is too complex, involving hundreds of genes with poorly understood interactions. However, the answer may be within reach for simpler, molecular phenotypes whose genetic basis is better understood, and that can originate even on the short time scales of laboratory evolution. Examples include a cell’s ability to thrive in novel chemical environments, or to regulate genes in new ways (Blount et al., 2008; Dhar et al., 2011, 2013; de Visser and Krug, 2014; Palmer et al., 2015; Toll-Riera et al., 2016).
Building on previous work (Wagner, 2017), I here suggest a method to quantify a phenotype’s likelihood to evolve de novo. I apply the method to two simple kinds of molecular phenotype. The first of them is the ability of transcription factors to bind short DNA sequences, which is essential for gene regulation. The evolution of new transcription factor binding sites helps bring forth novel traits as different as new color phenotypes (Gompel et al., 2005) and novel body structures (Prud’homme et al., 2007; Guerreiro et al., 2013).
The ability of a DNA sequence to bind a transcription factor is one of the simplest molecular phenotypes. It may evolve de novo or exaptively, from a binding site for a different transcription factor. For example, during the evolution of vertebrate αA-crystallin from a small heat shock protein, a transcription factor binding site known as a heat shock element was transformed into a binding site for the transcription factor Pax6, which helps drive crystallin expression in the eye lens (Cvekl et al., 2017). In the evolution of various cancers, mutations transform binding sites for the CCAAT-enhancer-binding protein (CEBP) into binding sites for multiple other transcription factors (Melton et al., 2015). Examples like these constitute the perhaps simplest possible molecular exaptations. Below I quantify from experimental DNA binding data how likely de novo or exaptive origins of new binding phenotypes are for 187 mouse transcription factors (Badis et al., 2009; Weirauch et al., 2014).
The second kind of novel phenotypes I study are metabolic phenotypes. More specifically, I study a metabolism’s ability to sustain life—to synthesize all essential biomass molecules—in chemical environments that contain a novel source of carbon and energy. This ability comes about through changes in the metabolic genotype that specifies which enzyme-catalyzed reactions can take place in a metabolism. I take advantage of powerful and experimentally validated computational methods to predict metabolic phenotypes from genotypes (Edwards et al., 2001; Segre et al., 2002; Papp et al., 2004; Price et al., 2004; Feist et al., 2007). With these methods, I study whether metabolic phenotypes are more likely to originate de novo or exaptively. More generally, I show how information theory can help quantify the potential of a trait to originate de novo or exaptively. And I show that this potential strongly depends on the kind of trait considered.
Materials and Methods
Transcription Factor Binding Data
I analyze a genotype space of 48 DNA molecules of length eight nucleotides and within this space those molecules bound by at least one of 187 mouse transcription factors. I use binding data from the UniPROBE (Newburger and Bulyk, 2009) (104 transcription factors) and the CIS-BP databases (Weirauch et al., 2014) (83 transcription factors) data bases. This data is based on high-throughput DNA binding experiments reported in Badis et al. (2009) and Weirauch et al. (2014), and was previously used in an analysis of DNA binding landscapes (Aguilar-Rodriguez et al., 2017). The data set includes a transcription factor if (i) its binding has been measured on two different kinds of protein binding micro arrays, and if (ii) it binds a sufficient number of sequences to permit an analysis of nucleotide interactions in binding. In addition, each factor to be included must bind at least one sequence with an E-score exceeding 0.45 (Aguilar-Rodriguez et al., 2017). The E-score is a proxy for a factor’s relative binding affinity to a site. It is related to the Wilcoxon Mann Whitney test statistic, and ranges between −0.5 and +0.5 (strongest binding) (Badis et al., 2009). Because binding sites with E > 0.35 are associated with a low false discovery rate of transcription factor binding (FDR = 0.001), I here consider a site bound by any one factor if its E-score exceeds 0.35. I consider a non-palindromic binding site and its reverse complement as distinct sites.
Metabolic Network Analysis
My analysis begins with a small “universe” of 51 possible biochemical reactions from E. coli central carbon metabolism (Supplementary Figure S1), and with 10 different chemically minimal environments that differ only in the sole carbon and energy source they contain. While six of the 51 reactions are essential for the operation of central carbon metabolisms in all these environments, the presence of the remaining 45 reactions can vary without affecting viability in at least some environments (Hosseini et al., 2015). I focus on these 45 reactions, and thus analyze a metabolic genotype space whose 245 members encode metabolic reaction networks that are formed by all possible subsets of the 45 variable reactions (Hosseini et al., 2015). I define viability as the ability to synthesize those 13 biomass precursors (Supplementary Figure S1) that are the starting points for the biosyntheses of some 60 biomass molecules that are essential to free-living microbes like E. coli, including 20 amino acids and four DNA nucleotide building blocks (Stryer, 1995; Noor et al., 2010). The carbon sources that distinguish the 10 minimal environments are acetate, α-ketoglutarate, fumarate, fructose, glucose, glutamate, lactate, malate, pyruvate, and succinate (Hosseini et al., 2015). I note that a metabolism viable on any one carbon source may be viable on other carbon sources as well (Barve and Wagner, 2013; Hosseini and Wagner, 2016).
Concepts
My approach focuses on the amount of genetic information that a genotype needs to harbor in order to specify or “encode” a phenotype, in the sense that the expression of this information produces the phenotype. All phenotypic traits are encoded by genotypes in some genotype space (Figure 1A). I will denote the size of this space by the number of genotypes |G| in it. If every phenotype was specified by a single genotype, it would be trivial to quantify the amount of information needed to encode it. However, this is not the case. First, the same phenotype P (for example, an enzyme with a specific fold and catalytic activity) is typically specified by many genotypes. I denote the set of these genotypes by GP. Second, the same genotype can also specify multiple phenotypes (Lipman and Wilbur, 1991; Schuster et al., 1994; Keefe and Szostak, 2001; Rodrigues and Wagner, 2009; Araya et al., 2012; Roscoe et al., 2013; Greenbury et al., 2014; Payne and Wagner, 2014).
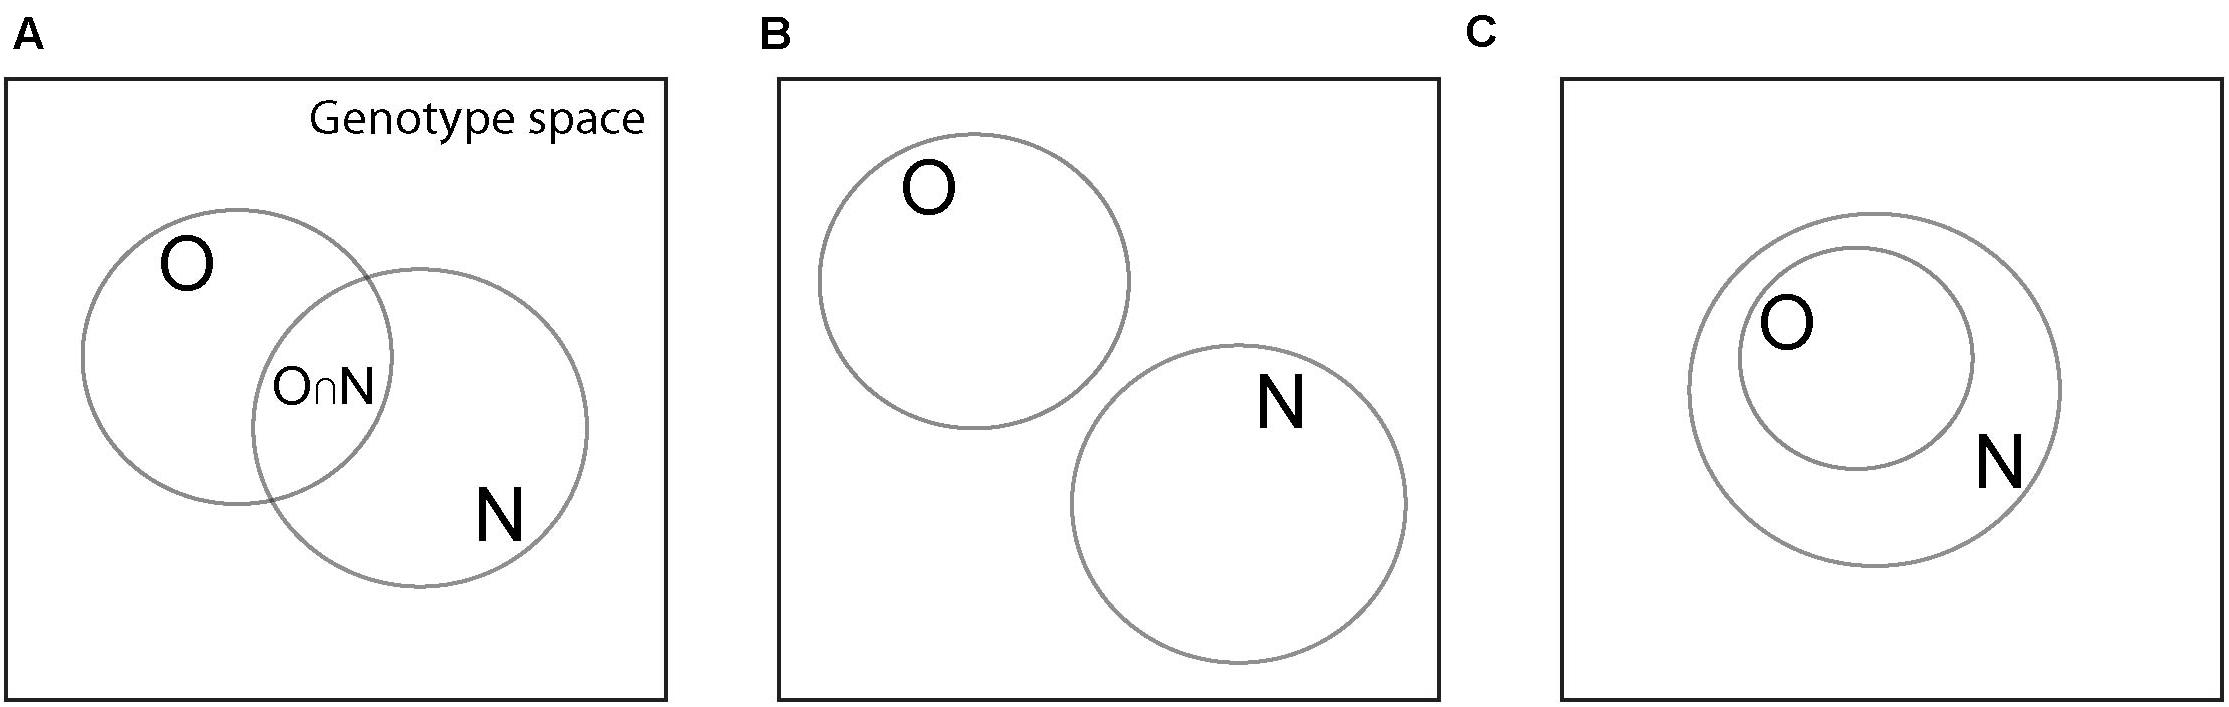
Figure 1. Various possible relationships among sets of genotypes with the same phenotype. Large squares symbolize genotype space, circles correspond to sets of genotypes with the same phenotype, which can be either an old phenotype PO (set O), or a new phenotype PN (set N). (A) The two genotype sets have a non-empty intersection (denoted by O∩N), which is the main scenario I consider. (B) The two genotype sets have an empty intersection (pON = 0), which makes exaptation unlikely or impossible. (C) The set of genotypes with the old phenotype PO is a subset of that with the new phenotype PN. In this case, the new phenotype is an inevitable, possibly latent by-product of the old phenotype.
The genotypes encoding any one phenotype P occupy some fraction p = |GP|/|G| of genotype space. The quantity IP:=−log2(p) = log2|G|−log2|GP| can be viewed as the difference in Shannon entropy of two random variables that assume values g ∈ G with probability 1|G| and g ∈ GP with probabilities 1|GP|, respectively (Cover and Thomas, 2006; Wagner, 2017). (log2(x) denotes the binary logarithm of x). In various contexts, quantities analogous to IPare called self-information, functional information, surprisal, and (biological) complexity (Adami et al., 2000; Carothers et al., 2004; Cover and Thomas, 2006; Wagner, 2017). I here refer to IP as the informational complexity of the phenotype P (Adami et al., 2000; Carothers et al., 2004; Wagner, 2017). It ranges from a minimum of zero in the (extreme and trivial) case of p=1, i.e., every genotype encodes the phenotype, to log2(|G|) if only one genotype in genotype space encodes the phenotype. The more genotypes encode a phenotype, the smaller is the informational complexity of this phenotype.
I will here focus on pairs of phenotypes, an old (ancestral) phenotype (PO) and a new (derived) phenotype (PN) that may emerge as an exaptation from the old phenotype or originate de novo. I will denote the fraction of genotype space that is occupied by genotypes encoding these two phenotypes as pO and pN, respectively. The amount of information that is needed to specify the new phenotype de novo is given by IN = −log2(pN). I want to compare this quantity to the amount of information needed if the new phenotype is to originate in an organism that already has the old phenotype. To compute the latter quantity, we can restrict ourselves to those genotypes that already encode the old phenotype PO, which occupy a fraction pO of genotype space. Among these genotypes, some fraction will also have the new phenotype, and I will denote this fraction as pON (Figure 1A). The amount of additional information required to encode phenotype PN is equivalent to the proportion of genotypes with both old and new phenotypes, among all genotypes with the old phenotype. It is given by:
and is related to a Kullback-Leibler distance, an elementary quantity from information theory (Cover and Thomas, 2006; Wagner, 2017).
To compare the amount of information needed for a de novo and an exaptive origin of PN, we can compute the difference:
If this difference is positive, then more information is needed to specify the new phenotype de novo rather than starting from the old phenotype. In this sense, it is easier to evolve this phenotype from an existing phenotype. I note that IN is the maximum value that ΔIex can assume, because Iex≥0. That is, the maximal informational benefit that an old phenotype can provide for the origin of a new phenotype can be no greater than the amount of information needed to specify the new phenotype itself de novo. One can thus normalize ΔIex, dividing it by IN to yield:
This quantity will assume the maximal value of ΔIex,n = 1when it is informationally maximally advantageous to specify the new phenotype from the old phenotype, compared to specifying it de novo. To interpret the possible values of ΔIex and ΔIex,n, a number of special cases need to be distinguished that the following examples will illustrate. I will restrict myself to pON > 0 (Figure 1A), because it is most relevant for the exaptive origin of new phenotypes, and will not discuss the case where pON = 0 (Figure 1B). I will also discuss the special case where all genotypes encoding the old phenotype encode the new phenotype as well (Figure 1C).
Results
Transcription Factor Binding Sites
The experimental technology of protein binding microarrays can identify all short DNA sequences in a genotype space that a given transcription factor can bind (Badis et al., 2009; Weirauch et al., 2014). Briefly, this technology quantifies the binding of transcription factors to more than 104 different oligonucleotides of a given length immobilized on a microarray. The resulting data is already available for thousands of transcription factors (Badis et al., 2009; Newburger and Bulyk, 2009; Weirauch et al., 2014). I here analyze previously published data for the binding of 187 different mouse transcription factors to each such sequence in a genotype space of 48 = 65,536 DNA sequences (Badis et al., 2009; Weirauch et al., 2014; Aguilar-Rodriguez et al., 2017).
In the genotypes space of mouse transcription factors I study, individual transcription factors bind between 103 and 2,933 sites, implying that between −log2(2933/48) = 4.48 and −log2(103/48) = 9.31 bits (depending on the transcription factor) need to be specified to encode a transcription factor binding phenotype (Wagner, 2017). Among all (187 × 186)/2 = 17,391 possible pairs of transcription factors, these sets of binding sites overlap, i.e., pON > 0 for the vast majority (84.2%, 14,645) of factor pairs. For these pairs, it is possible to transform one binding phenotype into another without transitioning through a site that is bound by a third factor or by no factor.
Figure 2A shows histograms of ΔIex and ΔIex,n(inset). The distributions are slightly platykurtic, i.e., with fewer values around the mean, and fewer very large, and small values than expected from a normal distribution (red line). The values of ΔIex range from −5.8 bits to +7.5 bits, with a slight excess of large values. Specifically, ΔIex lies between +5.8 and +7.5 bits (ΔIex > −minΔIex) for 70 TF pairs. Evolving a new binding specificity exaptively is especially advantageous for these TF pairs.
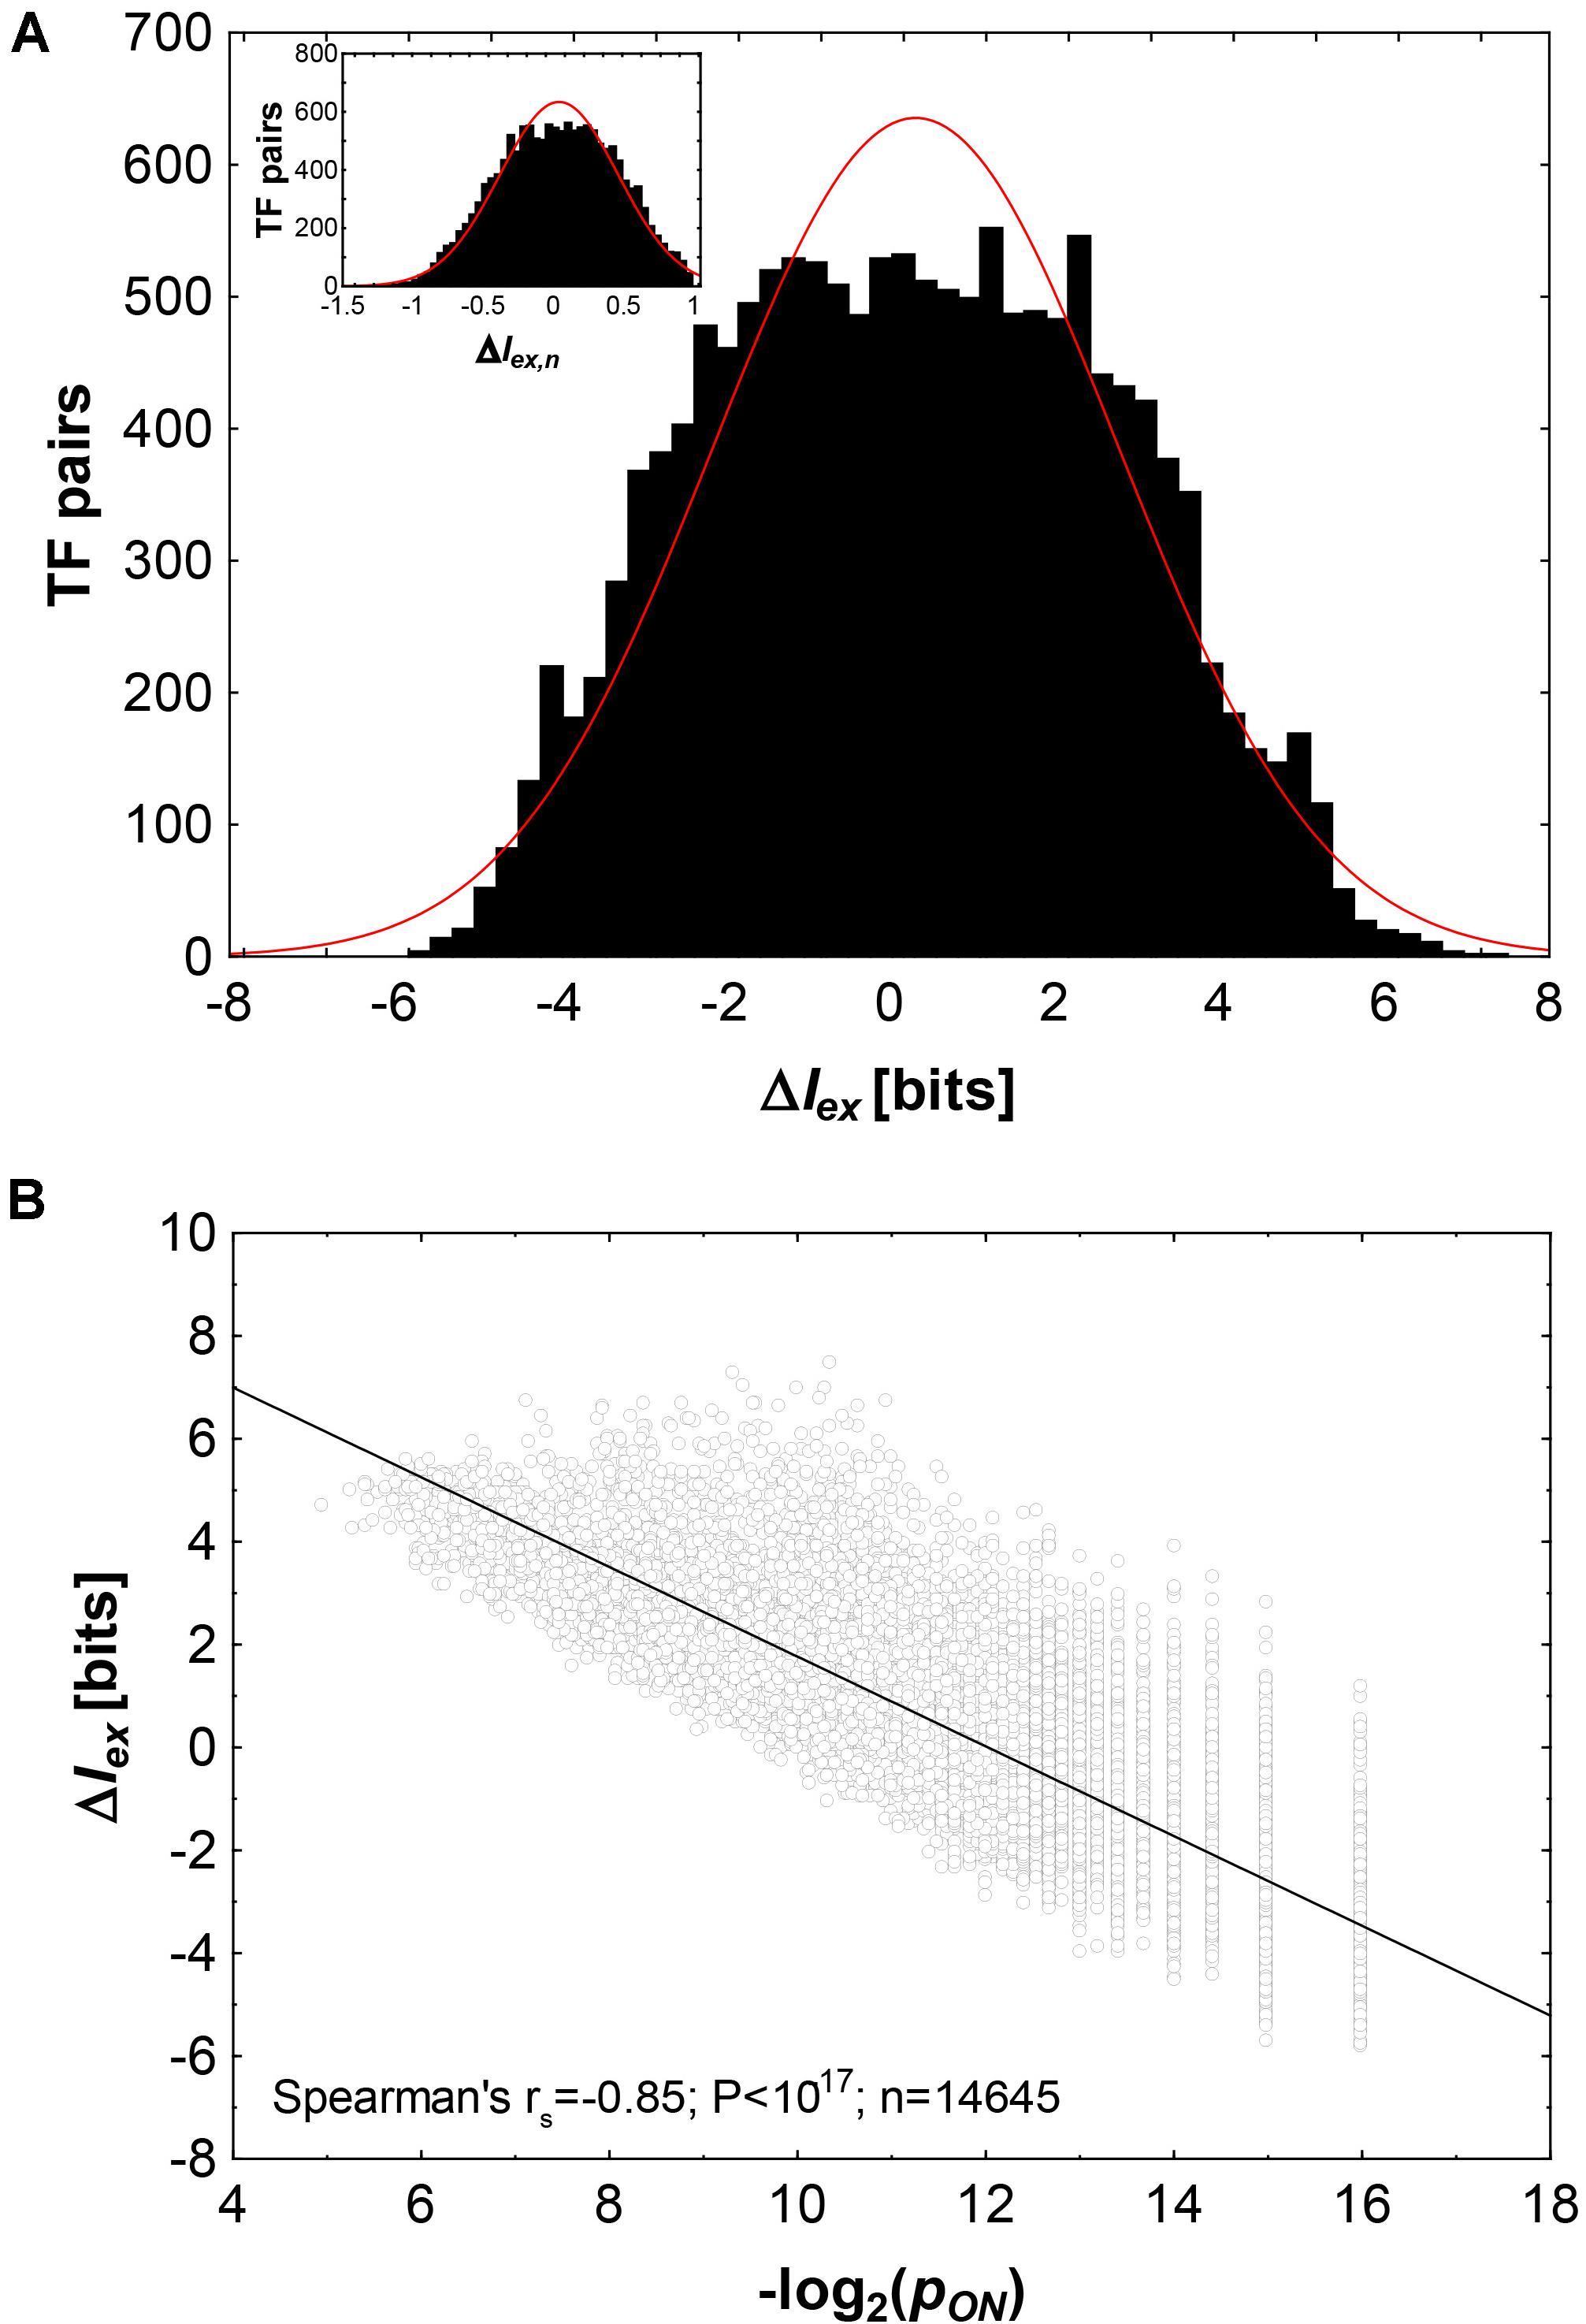
Figure 2. The informational cost of exaptation in transcription factor binding phenotypes. (A) Histogram of ΔIex (in bits) and ΔIex,n (inset) for 14,645 pairs of transcription factors where pON > 0. The red line shows a Gaussian distribution. (B) ΔIex (in bits) as a function of the negative binary logarithm of pON, the fraction of genotypes (transcription factor binding sites) that can bind both factors in a pair. The black line is a linear regression line.
It is useful to distinguish three cases according to the sign of ΔIex, beginning with ΔIex > 0. Consider the transformation of binding sites for SOX1, a transcription factor important in neurogenesis, into that for the related factor SRY (sex-determining region Y), which plays a role in gonad development (Guth and Wegner, 2008). For these DNA binding phenotypes, ΔIex = 4.62(ΔIex,n = 0.79). This means that evolving a binding site for SRY from one for SOX1 requires 4.62 fewer bits—more than the information encoded in two base pairs—than evolving it de novo. The reason is that the set of binding sites for the two transcription factors overlap substantially. Specifically, 42% (701) of the 1,670 of binding sites of SOX1 are also binding sites for SRY.
SRY and SOX1 are from the same gene family (Guth and Wegner, 2008), and their high value of ΔIex is not a coincidence: Sets of binding sites overlap to the greatest extent for transcription factor pairs that originated through gene duplication (Weirauch et al., 2014). Some of the highest values of ΔIex come from such pairs. Among them are the genes encoding the odd-skipped-related transcription factors OSR1 and OSR2, which are involved in kidney, heart and palate development, and are duplicates with 65% amino acid sequence identity (Zhang et al., 2011). Evolving binding specificity for OSR2 from a binding site of OSR1 has ΔIex = 6.45, i.e., it requires 6.45 fewer bits than evolving such specificity de novo. This value is not much lower than the information content of IN = 7.45 for an OSR1 binding site itself (ΔIex,n = 0.89), indicating that most of the information encoding an OSR2-binding phenotype is already encoded in an OSR1-binding phenotype.
A second case is ΔIex < 0, which means that it requires less information to evolve the new binding specificity de novo than from the old binding specificity. This will be the case if few DNA molecules can bind both transcription factors, such that pON is very small compared to pO and pN, which means that the amount of additional information Iex to specify the new phenotype is very large.
One example involves the cell cycle regulators E2F3 and ARID3A (AT-rich interactive domain-containing protein 3A), members of a transcription factor family involved in hematopoiesis (Lees et al., 1993). ΔIex = −5.4 bits for the evolution of E2F3 from ARID3A binding sites, whereas it takes only IN = 4.8 bits to specify a binding site for E2F3 de novo. It follows that Iex = 10.2 bits, and that ΔIex,n = −1.13, that is, it costs 113% more to evolve E2F3 binding from ARID3A binding than to evolve it de novo. The reason is that only two of the 2,372 E2F3 binding sites are also binding sites for ARID3A (Iex = −log(2/2372) = 10.21). Starting from an ARID3A binding phenotype, much additional information is needed to evolve a binding site for E2F3.
More generally, as the fraction pONof genotypes that encode both phenotypes declines (and thus, as −log2pON increases), ΔIexalso declines (Figure 2B). The two quantities are highly correlated (Spearman’s rs between −log2pON and ΔIex: rs = −0.85, p < 10–17, n = 14,645).
In a third scenario, ΔIex≈0. That is, it is about equally likely that a binding site evolves de novo than that it evolves from the old binding sites. Equation (2) shows that this is the case if pOpN≈pON. In other words, ΔIex≈0 if the fraction pONof genotypes that bind both transcription factors is equal to that expected by chance, i.e., if binding sites for the two transcription factors were independently distributed in genotype space. Examples where ΔIex≈0 include ZIC1 (Zinc finger of the cerebellum) and SMAD3 (Mothers against decapentaplegic homolog 3), a regulator of cell proliferation (Zhang et al., 1996; Ali et al., 2012). Here, ΔIex = −0.0046 bits, such that starting from a SMAD3 binding phenotype entails neither a strong advantage or disadvantage in evolving a binding site for ZIC1. Overall, 178 (0.01%) pairs of transcription factors have |ΔIex| < 0.05, and Figure 2A shows that the percentage of such transcription factors is smaller than expected if ΔIex followed a normal or binomial distribution.
Metabolic Phenotypes
Metabolism is a complex network of enzyme-catalyzed chemical reactions that transforms environmental nutrients into small biomass molecules, such as amino acids and nucleotides. A metabolic genotype is that part of a genome’s DNA that encodes all metabolic enzymes. Instead of representing such genotypes directly as DNA, metabolic systems analysis often represents them in a more abstract, reaction-centered way, as the complement of biochemical reactions that an organism’s metabolism can catalyze (Edwards and Palsson, 2000; Schellenberger et al., 2010). This reaction-centered representation is especially appropriate wherever the elementary events of genetic change affect not just single nucleotides, but the presence or absence of enzyme-coding genes, such as in horizontal gene transfer and DNA recombination. Because the metabolic reactions encoded by any one genotype are a subset of a much larger “universe” of biochemical reactions, one can represent any organism’s metabolic genotype as a binary vector whose entries indicates the presence (“1”) or absence (“0”) of specific metabolic reactions (Figure 3A). For tractability, I here analyze the metabolic genotype space of central metabolism, whose 245 members encode metabolic networks that are formed by all possible subsets of 45 chemical reactions that can vary without necessarily abolishing an organism’s viability in some environment (Hosseini et al., 2015). I note that the reaction complement of central carbon metabolisms also varies among organisms in the wild (Danson, 1989; Romano and Conway, 1996; Huynen et al., 1999). If |GP| denotes the total number of genotypes (subsets of chemical reactions) that convey viability in a given environment, then −log2(|GP|/245) quantifies the informational complexity of this viability phenotype. If a specific set of chemical reactions convey viability, then any superset of this set will do so as well (Hosseini et al., 2015).
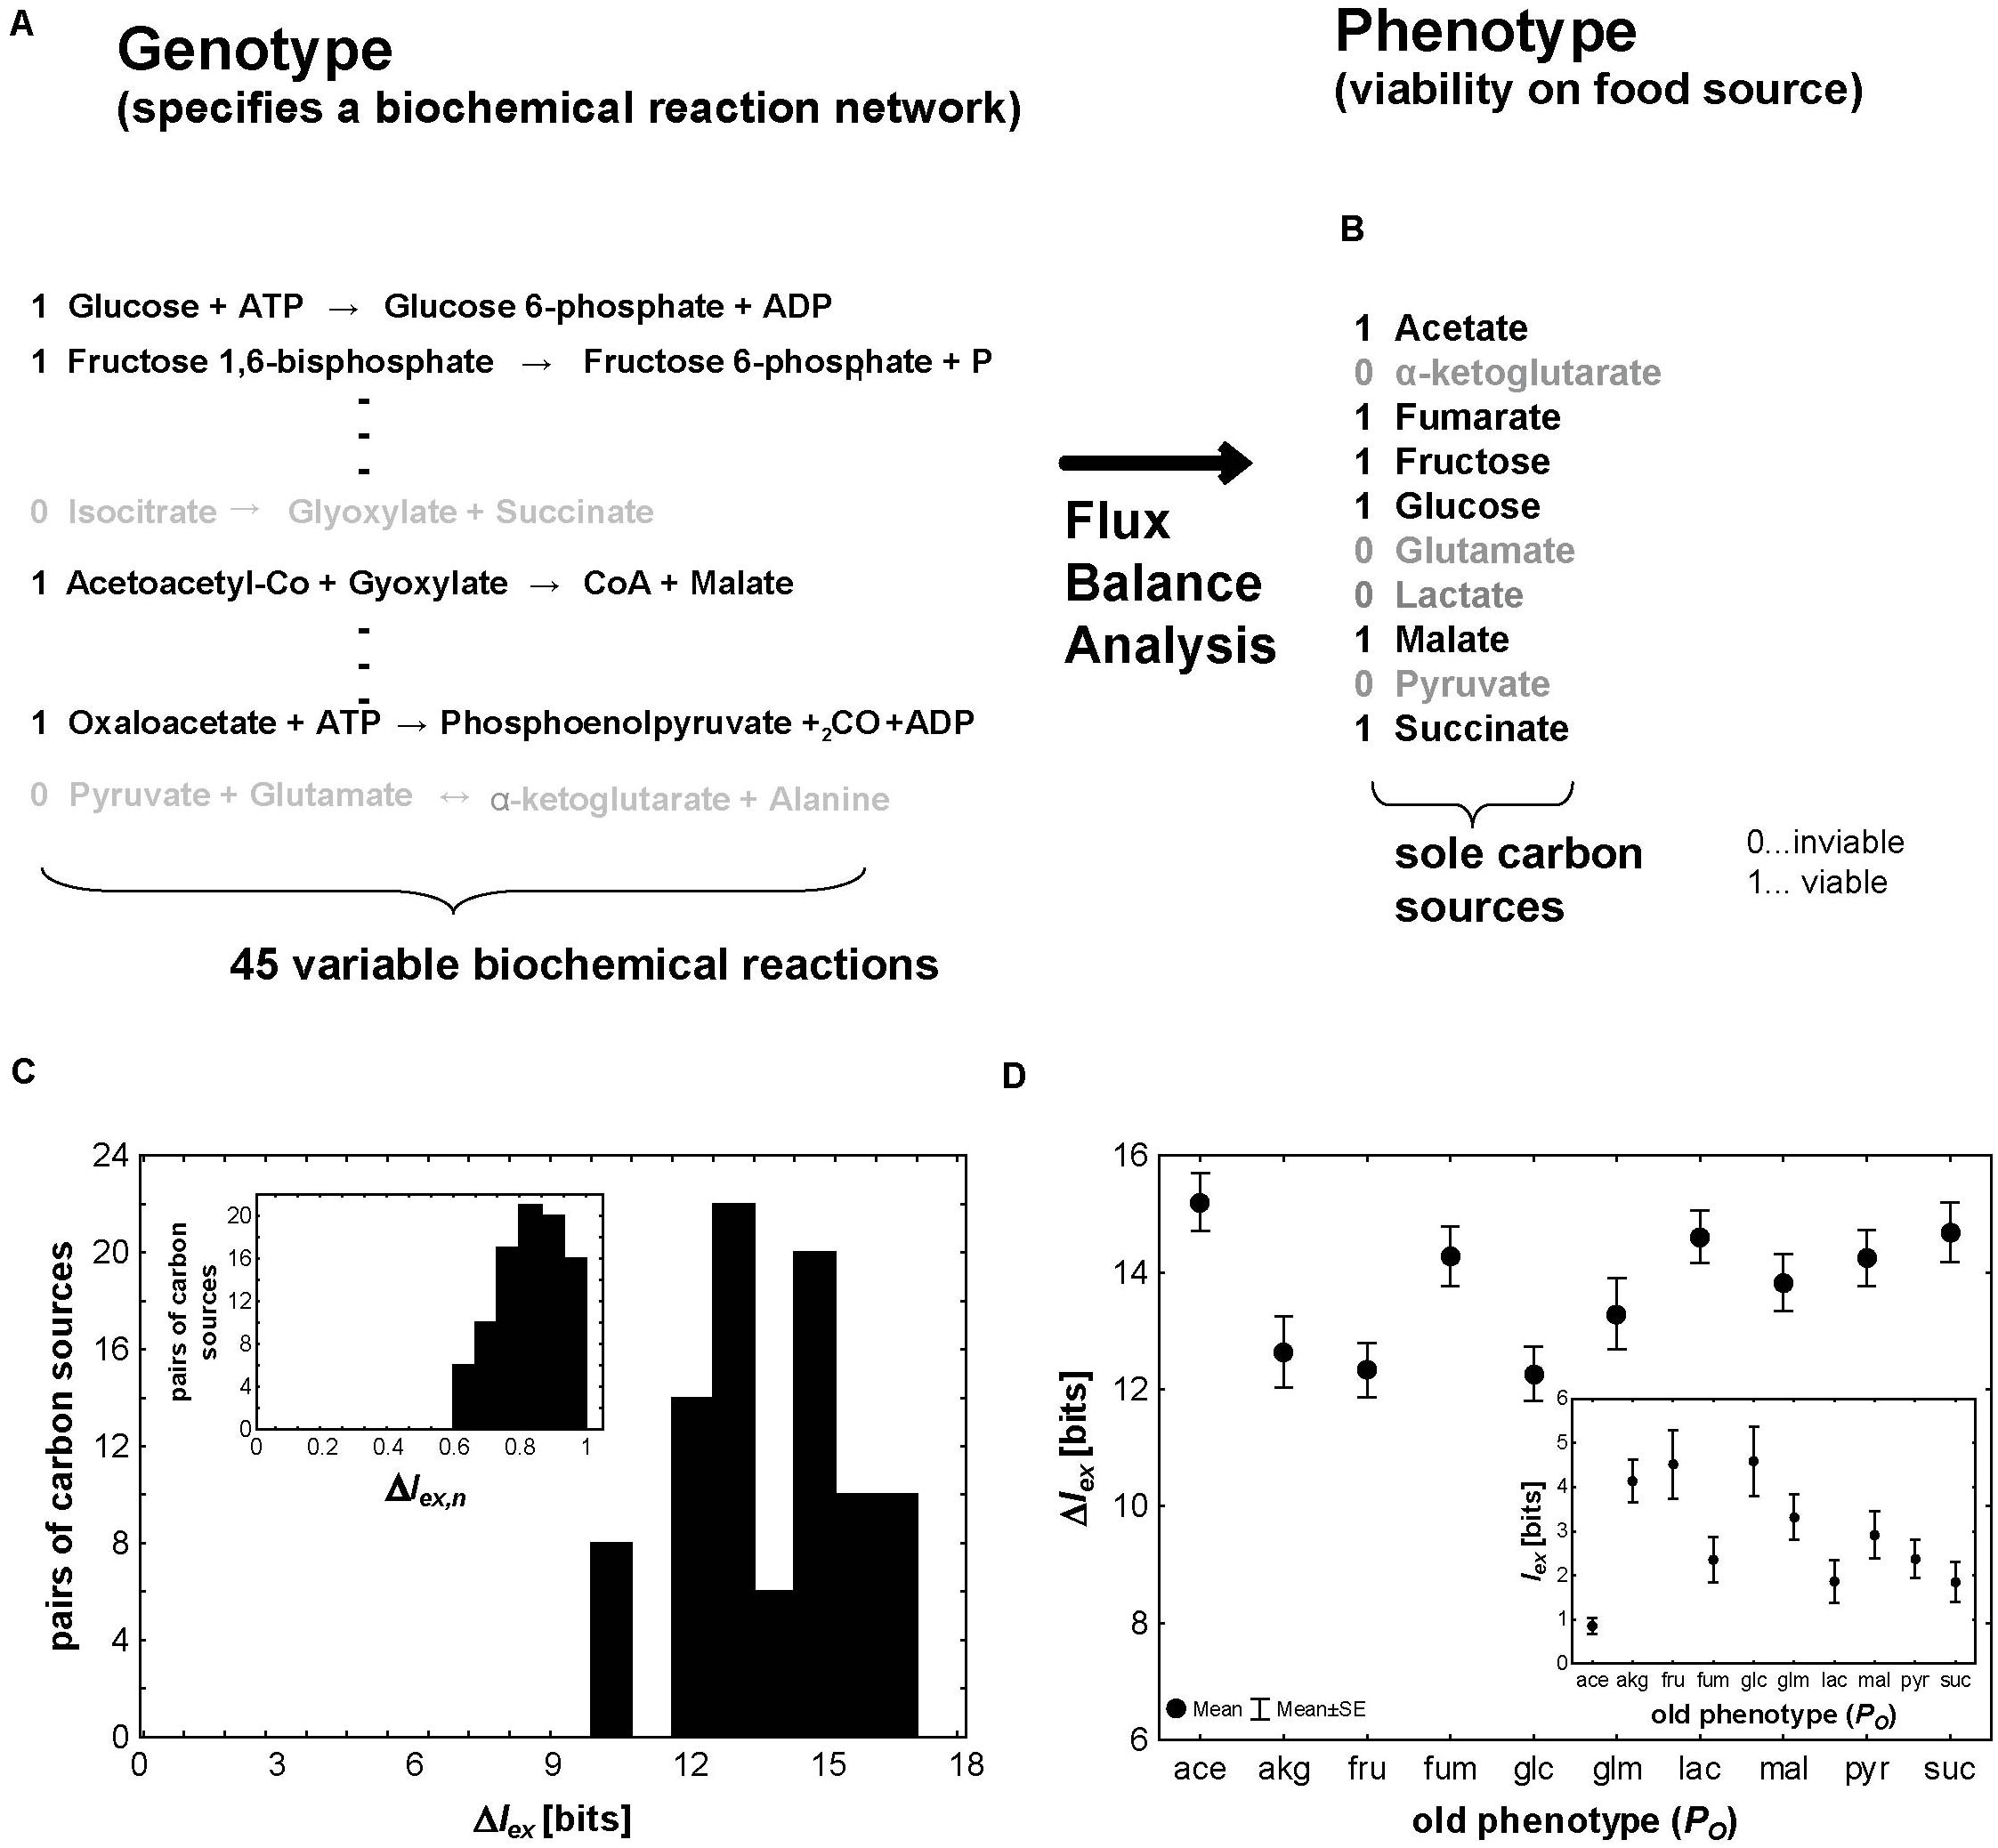
Figure 3. Metabolic exaptations. (A) The genotype encoding a network of metabolic reactions can be represented through the presence (black type, “1”) or absence (gray type, “0”) of individual metabolic reactions, which are represented in this hypothetical example through their stoichiometric equations. In this analysis I consider 45 reactions from central carbon metabolism whose presence can vary and still allow viability. (B) The environments I consider here are chemically minimal environments (Hosseini et al., 2015) that differ only in one of the 10 carbon sources shown here. A carbon source is shown as supporting viability (black type, “1”) if a metabolism can synthesize each of 12 different biomass precursors (Supplementary Figure S1) when this carbon source is the only carbon source. (C) Distribution of ΔIex (in bits) and the normalized ΔIex,n (inset) for the 90 pairs of carbon sources that can be formed by the 10 carbon sources I consider here. (D) Mean (circles) and standard error of the mean (whiskers) for ΔIex (in bits) and Iex (inset) for the nine novel phenotypes that can be formed from each of the 10 old phenotypes shown on the horizontal axis.
Earlier work has used the experimentally validated computational method of flux balance analysis (FBA) to predict metabolic phenotypes for all 245central carbon genotypes (Hosseini et al., 2015). These phenotypes are viability phenotypes. That is, they reflect a metabolism’s ability to produce biomass precursors essential for viability from a single source of carbon and energy, such as glucose (see section “Materials and Methods”). Here I am considering 10 such phenotypes (Figure 3B), namely viability on acetate (ace), α-ketoglutarate (akg), fumarate (fum), fructose (fru), glucose (glc), glutamate (glu), lactate (lac), malate (mal), pyruvate (pyr), and succinate (suc). A new phenotype conveys viability on a new carbon source, and can come about through genetic changes, such as the addition of new enzyme-coding genes to a genome as a result of horizontal gene transfer and recombination (Hosseini et al., 2016).
Between Iglc = 14.47 bits (glucose) and Iace = 21.6 bits (acetate), or, equivalently, metabolic reactions, are necessary to ensure viability on any one of the 10 carbon sources I consider. Figure 3C shows the distributions of ΔIex and ΔIex,n (inset). One noteworthy difference to the transcription factor binding phenotypes I considered above is that both quantities are always greater than zero, regardless of which pair of old and new phenotypes one considers. This means that it always requires more information to specify a new metabolic phenotype de novo than starting from an old phenotype. However, ΔIex still varies broadly, from 9.83 to 16.9 bits. The minimal value of ΔIex = 9.83 bits (Iex = 4.64 bits) holds for the transition from metabolisms viable on α-ketoglutarate to metabolisms viable on glucose. It means that if a metabolism is already viable on α-ketoglutarate, one needs to specify on average 9.83 fewer bits to render it viable on glucose than when specifying a metabolism viable on glucose de novo. For this example, ΔIex,n = 0.68. That is, viability on α-ketoglutarate already provides 68% of the necessary information to specify viability on glucose. At the other extreme is the value of ΔIex = 16.9 (Iex = 0.39) bits, which are necessary for a metabolism viable on succinate to originate from one viable on acetate instead of de novo. The corresponding value of ΔIex,n = 0.98 shows that it is close to maximally advantageous if the new phenotype originates exaptively rather than de novo.
When different new phenotypes are created from the same old phenotype, ΔIex can also vary among these phenotypes. For example, starting out from viability on fructose, the informational advantage of creating any one of the other nine phenotypes exaptively ranges between ΔIex = 9.9 bits (α-ketoglutarate, ΔIex,n = 0.65) and 14.47 bits (glucose, ΔIex,n = 1). Similarly, the amount of additional information Iexone needs to specify to obtain a new phenotype is low for some new phenotypes (malate from fructose: Iex = 3.1 bits) and much higher for others (acetate from fructose: Iex = 8.7 bits). Not surprisingly, the informationally expensive new phenotypes tend to be those that require many biochemical reactions, i.e., the phenotypes that are informationally complex (Spearman’s rs = 0.42 between IN and Iex, and Spearman’s rs = 0.53 between IN and ΔIex; p < 3.6 × 10⁻⁵; n = 90).
Not just the new phenotype, but also the old, original phenotype can influence the informational advantage ΔIex of exaptation and the amount of information that needs to be specified for the new phenotype Iex. Figure 3D shows the means (standard errors) of ΔIex and Iex (inset) for all nine novel phenotypes starting from each of the 10 old phenotypes I consider. The informational advantage of exaptation clearly is greater for some starting phenotypes (e.g., acetate) than for others (glucose). The greater the informational complexity IOof the starting phenotype, the smaller the number of additional bits (reactions) that need to be specified, and the greater the informational advantage of exaptation over de novo evolution of the new phenotype (Spearman’s rs = −0.57 between IO and Iex, and Spearman’s rs = 0.53 between IOand ΔIex; p < 8 × 10⁻⁸; n = 90).
Discussion
My analysis of new phenotype origins is centered on transitions between phenotypes and not genotypes, because most phenotypes are encoded by multiple genotypes. Differences in the genetic information needed to encode a new and an old phenotype are well-suited to understand the likelihood of transitions between specific phenotypes, because they correlate with the amount of genetic change such transitions would require.
I considered two very different classes of phenotypes whose potential to originate exaptively differs. The first is the ability of DNA to bind a specific transcription factor, brought forth by specific sequences of nucleotides on a linear DNA string. The second is a metabolism’s ability to synthesize essential molecules in a specific environment. It is brought forth by a chemical reaction network. A de novo origin is informationally cheaper than an exaptive origin for many transcription factor binding phenotypes. This does not hold for metabolic phenotypes, where an exaptive origin is always cheaper.
The cheaper exaptive origin of metabolic phenotypes has two reasons. The first is that metabolic phenotypes are more complex, even in the simple systems I study, requiring up to 21 bits compared to the maximally 9 bits of transcription factor binding. Second, and more importantly, the two traits have very different architectures. Metabolism can be partitioned into two parts. The first is a conserved core which comprises chemical reactions (enzymes) and pathways that are shared by many organisms, and that are needed for fundamental processes such as biosyntheses and energy conversion. The second is a more variable periphery, which comprises reactions and pathways responsible for viability in specific environments. Viability in new environments is primarily caused by alterations to this periphery (Pal et al., 2005; Bilgin and Wagner, 2012). What is more, as little as one or two reactions in the periphery usually suffice to bring forth viability in a new environment (Bilgin and Wagner, 2012). In other words, novel metabolic phenotypes result from the co-option of a metabolic core for a new role through the addition of novel metabolic reactions. This core-periphery structure has no counterpart in transcription factor binding.
In the transcription factor binding phenotypes I study, two bits correspond to one completely specified nucleotide. In the more abstract, reaction-based representation I use for metabolic phenotypes, one bit corresponds to one biochemical reaction. The two representations are not directly comparable. In a DNA-based representation of metabolic genotypes, every metabolic reaction would require a stretch of DNA that encodes the necessary enzyme, and thus requires much more than one bit of information. [Although the information content of some protein-based phenotypes, such ATP-binding, has been estimated (Keefe and Szostak, 2001; Carothers et al., 2004), this information content is unknown for most enzymes.] However when recombination or horizontal gene transfer are equally or more important than point mutations in creating novel phenotypes, a reaction-centered representation of information may be appropriate. This is indeed frequently the case, and especially in bacteria, where novel metabolic phenotypes often arise through horizontal transfer of enzyme-coding genes into a bacterial genome (Ochman et al., 2000; Pal et al., 2005; Copley, 2009). Importantly, a change in metabolic genotype representation would not affect the central conclusions of my analysis. For example, it would not change the fact that few reaction changes are needed to create new metabolic phenotypes. It would also not change the generally exaptive origin of novel metabolic phenotypes, nor would it change the observation that some phenotypes are informationally more expensive to create than others.
In the model of central carbon metabolism I consider, all central carbon metabolisms viable on fructose are also viable on glucose (Supplementary Results). Thus, viability on glucose is informationally “free”-it requires no additional information (Iex = 0), because it is an inevitable, latent by-product of viability on fructose. Not all latent traits are inevitable, because for many of the phenotypes I consider, only some-but not all-genotypes encode both an old (adaptive) and a new phenotype, that is, they lie in the intersection of the sets of genotypes encoding each trait (Figure 1A). In an organism with such a genotype the new phenotype may be latent. One can quantify the likelihood that an organism with an existing phenotype PO also harbors a “new” and possibly latent phenotype PN as pON/pO, i.e., as the fraction of genotypes encoding O that also encode N.
Latent traits of both kinds-inevitable or not-are especially frequent in metabolism (Khersonsky and Tawfik, 2010; Nam et al., 2012; Barve and Wagner, 2013). They result both from the promiscuous activity of enzymes (Khersonsky and Tawfik, 2010; Nam et al., 2012), and from linear pathways of chemical reactions in parts of metabolism, where the ability to use one nutrient entails the ability to use others downstream of it (Barve and Wagner, 2013; Hosseini and Wagner, 2016). Latent phenotypes can also occur in the transcription factor binding phenotypes I study. Specifically, they are possible for those 84% of transcription factor pairs where pON > 0(Figure 1A), and where regulatory cross-talk between two transcription factors can thus take place. For both metabolic and regulatory traits, the potential for a phenotype PO to harbor a latent phenotype PN varies widely.
The information theoretic framework I use creates concrete predictions. One of them is that phenotypes where ΔIex < 0 should more often originate de novo than by co-option from an existing phenotype PO. This prediction is in principle testable, by analyzing the evolutionary origins of novel transcription factor binding sites through comparative genomics. A second prediction regards the observation that many novel traits-from aerobic respiration and nitrogen fixation to eye lenses and dissected leaves-have originated multiple times in evolution (Vermeij, 2006). All else being equal, I predict that phenotypes with low information content, or with little required additional information when they evolve exaptively, will have originated more often in life’s evolution than informationally more complex phenotypes. A third prediction is that de novo origins should become progressively rarer as phenotypes become more complex, because it is informationally so much cheaper to evolve them as exaptations from existing phenotypes.
One limitation of my analysis is that I do not consider how easily a series of DNA mutations can access the set of genotypes encoding a new phenotype PN from genotypes encoding an old phenotype PO. Both sets of genotypes might be highly fragmented in genotype space, and only some of the subsets encoding phenotype PO may intersect with a set of genotypes encoding PN. If so, exaptive evolution of a new phenotype may be unlikely. For the transcription factor binding phenotypes and the metabolic phenotypes I consider here, this is not the case, because such fragmentation is very limited or non-existent (Hosseini et al., 2015; Aguilar-Rodriguez et al., 2017). Fragmentation may exist for other traits, but a mix of computational analysis and experimental data shows for systems as different as evolving proteins and RNA molecules, regulatory circuits, and genome scale metabolisms, that genotypes encoding the same phenotype do not usually form highly fragmented sets but are instead connected in large networks that reach far through genotype space (Schuster et al., 1994; Schultes and Bartel, 2000; Ciliberti et al., 2007; Hayden et al., 2011; Greenbury et al., 2014; Payne and Wagner, 2014). Where fragmentation exists, it can sometimes be overcome through a combination of genetic drift, high mutation rates, or large population sizes (Weinreich and Chao, 2005; Weissman et al., 2009).
A second limitation is the tacit assumption that all genotypes encoding a phenotype are equivalent, but in practice they are not. For example, the metabolic enzymes encoded by different variants of the same gene may differ in their catalytic rate or thermodynamic stability, and these differences can lead to fitness differences. Unfortunately, we currently lack quantitative fitness data on large enough numbers of genotypes to incorporate such data into any of the examples I discuss. However, when such data become available, the theoretical framework I propose will be able to accommodate it. For example, one can weight different genotypes in calculations of informational complexity according to their likelihood of occurrence in a population, which may depend on their fitness.
A third limitation is that I have focused on systems where genotype space is sufficiently small to be enumerated exhaustively. For informationally more complex phenotypes this is not going to be possible. It is tempting to overcome this limitation through the simplifying assumption that individual system parts—here, nucleotides or biochemical reactions—contribute additively to a phenotype (Adami et al., 2000). However, doing so can lead to substantial underestimates of phenotypic information content (Wagner, 2017). An alternative is to sample sequence space in ways suitable to infer phenotypic complexity. However, statistical methods to do so are still in their infancy (Wagner, 2017). Our dramatically increasing ability to genotype and phenotype large populations of organisms will hopefully prompt the development of such methods. Whether they will ever allow us to apply information theory to phenotypes as complex as our middle ear bones is an open question. But information theory can undoubtedly help us turn the analysis of trait origins into a quantitative science suitable to study phenotypes of ever-increasing complexity.
Data Availability Statement
Publicly available datasets were analyzed in this study. This data can be found here: Cis-BP database: http://cisbp.ccbr.utoronto.ca/; metabolic networks: https://github.com/rzgar/EMETNET.
Author Contributions
AW performed all the research and wrote the manuscript.
Conflict of Interest
The author declares that the research was conducted in the absence of any commercial or financial relationships that could be construed as a potential conflict of interest.
Acknowledgments
I would like to acknowledge support from the European Research Council under Grant Agreement No. 739874, as well as from Swiss National Science Foundation grant 31003A_172887, and the University Priority Research Program in Evolutionary Biology at the University of Zurich.
Supplementary Material
The Supplementary Material for this article can be found online at: https://www.frontiersin.org/articles/10.3389/fevo.2020.564071/full#supplementary-material
References
Adami, C., Ofria, C., and Collirer, T. C. (2000). Evolution of biological complexity. Proc. Natl. Acad. Sci. 97, 4463–4468.
Aguilar-Rodriguez, J., Payne, J. L., and Wagner, A. (2017). 1000 empirical adaptive landscapes and their navigability. Nat. Ecol. Evol. 1:0045.
Ali, R. G., Bellchambers, H. M., and Arkell, R. M. (2012). Zinc fingers of the cerebellum (Zic): transcription factors and co-factors. Int. J. Biochem. Cell Biol. 44, 2065–2068. doi: 10.1016/j.biocel.2012.08.012
Araya, C. L., Fowler, D. M., Chen, W. T., Muniez, I., Kelly, J. W., and Fields, S. (2012). A fundamental protein property, thermodynamic stability, revealed solely from large-scale measurements of protein function. Proc. Natl. Acad. Sci. U S A. 109, 16858–16863. doi: 10.1073/pnas.1209751109
Badis, G., Berger, M. F., Philippakis, A. A., Talukder, S., Gehrke, A. R., Jaeger, S. A., et al. (2009). Diversity and complexity in DNA recognition by transcription factors. Science 324, 1720–1723. doi: 10.1126/science.1162327
Barve, A., and Wagner, A. (2013). A latent capacity for evolutionary innovation through exaptation in metabolic systems. Nature 500, 203–206. doi: 10.1038/nature12301
Bilgin, T., and Wagner, A. (2012). Design constraints on a synthetic metabolism. PLoS One 7:e39903. doi: 10.1371/journal.pone.0039903
Blount, Z. D., Borland, C. Z., and Lenski, R. E. (2008). Historical contingency and the evolution of a key innovation in an experimental population of Escherichia coli. Proc. Natl. Acad. Sci. U S A. 105, 7899–7906. doi: 10.1073/pnas.0803151105
Carothers, J. M., Oestreich, S. C., Davis, J. H., and Szostak, J. W. (2004). Informational complexity and functional activity of RNA structures. J. Am. Chemic. Soc. 126, 5130–5137. doi: 10.1021/ja031504a
Ciliberti, S., Martin, O. C., and Wagner, A. (2007). Robustness can evolve gradually in complex regulatory gene networks with varying topology. PLoS Computat. Biol. 3:e15. doi: 10.1371/journal.pcbi.0030015
Copley, S. D. (2009). Evolution of efficient pathways for degradation of anthropogenic chemicals. Nat. Chemic. Biol. 5, 560–567. doi: 10.1038/nchembio.197
Cvekl, A., Zhao, Y. L., McGreal, R., Xie, Q., Gu, X., and Zheng, D. Y. (2017). Evolutionary origins of Pax6 control of crystallin genes. Genome Biol. Evol. 9, 2075–2092. doi: 10.1093/gbe/evx153
Danson, M. J. (1989). Central metabolism of the archaebacteria: an overview. Can. J. Microbiol. 35, 58–64. doi: 10.1139/m89-009
Darwin, C. (1872). The origin of species by means of natural selection, or the preservation of favored races in the struggle for life (6th ed., reprinted by A.L. Burt, New York). London: John Murray.
de Visser, J. A. G. M., and Krug, J. (2014). Empirical fitness landscapes and the predictability of evolution. Nat. Rev. Genet. 15, 480–490. doi: 10.1038/nrg3744
Dhar, R., Sägesser, R., Weikert, C., and Wagner, A. (2013). Yeast adapts to a changing stressful environment by evolving cross-protection and anticipatory gene regulation. Mol. Biol. Evol. 30, 573–588. doi: 10.1093/molbev/mss253
Dhar, R., Sagesser, R., Weikert, C., Yuan, J., and Wagner, A. (2011). Adaptation of Saccharomyces cerevisiae to saline stress through laboratory evolution. J. Evol. Biol. 24, 1135–1153. doi: 10.1111/j.1420-9101.2011.02249.x
Edwards, J. S., and Palsson, B. O. (2000). The Escherichia coli MG1655 in silico metabolic genotype: Its definition, characteristics, and capabilities. Proc. Natl. Acad. Sci. U S A. 97, 5528–5533. doi: 10.1073/pnas.97.10.5528
Edwards, J. S., Ibarra, R. U., and Palsson, B. O. (2001). In silico predictions of Escherichia coli metabolic capabilities are consistent with experimental data. Nat. Biotechnol. 19, 125–130. doi: 10.1038/84379
Fay, R. R., Manley, G. A., and Popper, A. N. (2004). Evolution of the vertebrate auditory system. Berlin: Springer.
Feist, A. M., Henry, C. S., Reed, J. L., Krummenacker, M., Joyce, A. R., Karp, P. D., et al. (2007). A genome-scale metabolic reconstruction for Escherichia coli K-12 MG1655 that accounts for 1260 ORFs and thermodynamic information. Mol. Syst. Biol. 3, msb4100155. doi: 10.1038/msb4100155
Gompel, N., Prud’homme, B., Wittkopp, P. J., Kassner, V. A., and Carroll, S. B. (2005). Chance caught on the wing: cis-regulatory evolution and the origin of pigment patterns in Drosophila. Nature 433, 481–487. doi: 10.1038/nature03235
Gould, S., and Vrba, E. (1982). Exaptation - a missing term in the science of form. Paleobiology 8, 4–15. doi: 10.1017/s0094837300004310
Greenbury, S. F., Johnston, I. G., Louis, A. A., and Ahnert, S. E. (2014). A tractable genotype–phenotype map modelling the self-assembly of protein quaternary structure. J. R. Soc. Interf. 11:20140249. doi: 10.1098/rsif.2014.0249
Guerreiro, I., Nunes, A., Woltering, J. M., Casaca, A., Novoa, A., Vinagre, T., et al. (2013). Role of a polymorphism in a Hox/Pax-responsive enhancer in the evolution of the vertebrate spine. Proc. Natl. Acad. Sci. U S A. 110, 10682–10686. doi: 10.1073/pnas.1300592110
Guth, S., and Wegner, M. (2008). Having it both ways: Sox protein function between conservation and innovation. Cell. Mol. Life Sci. 65, 3000–3018. doi: 10.1007/s00018-008-8138-7
Hayden, E. J., Ferrada, E., and Wagner, A. (2011). Cryptic genetic variation promotes rapid evolutionary adaptation in an RNA enzyme. Nature 474, 92–95. doi: 10.1038/nature10083
Hosseini, S.-R., and Wagner, A. (2016). The potential for non-adaptive origins of evolutionary innovations in central carbon metabolism. BMC Syst. Biol. 10:97. doi: 10.1186/s12918-016-0343-7
Hosseini, S.-R., Barve, A., and Wagner, A. (2015). Exhaustive analysis of a genotype space comprising 1015 central carbon metabolisms reveals an organization conducive to metabolic innovation. PLoS Computat. Biol. 11:e1004329. doi: 10.1371/journal.pcbi.1004329
Hosseini, S.-R., Martin, O. C., and Wagner, A. (2016). Phenotypic innovation through recombination in genome-scale metabolic networks. Proc. R. Soc. Ser. B 283:20161536. doi: 10.1098/rspb.2016.1536
Huynen, M. A., Dandekar, T., and Bork, P. (1999). Variation and evolution of the citric acid cycle: a genomic perspective. Trends Microbiol. 7, 281–291. doi: 10.1016/s0966-842x(99)01539-5
Keefe, A. D., and Szostak, J. W. (2001). Functional proteins from a random-sequence library. Nature 410, 715–718. doi: 10.1038/35070613
Khersonsky, O., and Tawfik, D. S. (2010). Enzyme promiscuity: A mechanistic and evolutionary perspective. Annu. Rev. Biochem. 79, 471–505. doi: 10.1146/annurev-biochem-030409-143718
Lees, J. A., Saito, M., Vidal, M., Valentine, M., Look, T., Harlow, E., et al. (1993). The retinoblastoma protein binds to a family of E2F transcription factors. Mol. Cell. Biol. 13, 7813–7825. doi: 10.1128/mcb.13.12.7813
Lipman, D., and Wilbur, W. (1991). Modeling neutral and selective evolution of protein folding. Proc. R. Soc. London Ser. B 245, 7–11. doi: 10.1098/rspb.1991.0081
Luo, Z. X. (2007). Transformation and diversification in early mammal evolution. Nature 450, 1011–1019. doi: 10.1038/nature06277
Melton, C., Reuter, J. A., Spacek, D. V., and Snyder, M. (2015). Recurrent somatic mutations in regulatory regions of human cancer genomes. Nat. Genet. 47, 710–716. doi: 10.1038/ng.3332
Nam, H., Lewis, N. E., Lerman, J. A., Lee, D. H., Chang, R. L., Kim, D., et al. (2012). Network context and selection in the evolution to enzyme specificity. Science 337, 1101–1104. doi: 10.1126/science.1216861
Newburger, D. E., and Bulyk, M. L. (2009). UniPROBE: an online database of protein binding microarray data on protein–DNA interactions. Nucl. Acids Res. 37(Suppl. 1), D77–D82.
Noor, E., Eden, E., Milo, R., and Alon, U. (2010). Central carbon metabolism as a minimal biochemical walk between precursors for biomass and energy. Mol. Cell 39, 809–820. doi: 10.1016/j.molcel.2010.08.031
Norell, M. A., and Xu, X. (2005). Feathered dinosaurs. Annu. Rev. Earth Planet. Sci. 33, 277–299. doi: 10.1146/annurev.earth.33.092203.122511
Ochman, H., Lawrence, J., and Groisman, E. (2000). Lateral gene transfer and the nature of bacterial innovation. Nature 405, 299–304. doi: 10.1038/35012500
Pal, C., Papp, B., and Lercher, M. J. (2005). Adaptive evolution of bacterial metabolic networks by horizontal gene transfer. Nat. Genet. 37, 1372–1375. doi: 10.1038/ng1686
Palmer, A. C., Toprak, E., Baym, M., Kim, S., Veres, A., Bershtein, S., et al. (2015). Delayed commitment to evolutionary fate in antibiotic resistance fitness landscapes. Nat. Commun. 6:ncomms8385. doi: 10.1038/ncomms8385
Papp, B., Pal, C., and Hurst, L. D. (2004). Metabolic network analysis of the causes and evolution of enzyme dispensability in yeast. Nature 429, 661–664. doi: 10.1038/nature02636
Payne, J. L., and Wagner, A. (2014). The robustness and evolvability of transcription factor binding sites. Science 343, 875–877. doi: 10.1126/science.1249046
Piatigorsky, J. (1998). Gene sharing in lens and cornea: Facts and implications. Prog. Retin. Eye Res. 17, 145–174. doi: 10.1016/s1350-9462(97)00004-9
Piatigorsky, J., and Wistow, G. J. (1989). Enzyme crystallins : Gene sharing as an evolutionary strategy. Cell 57, 197–199. doi: 10.1016/0092-8674(89)90956-2
Price, N., Reed, J., and Palsson, B. (2004). Genome-scale models of microbial cells: evaluating the consequences of constraints. Nat. Rev. Microbiol. 2, 886–897. doi: 10.1038/nrmicro1023
Prud’homme, B., Gompel, N., and Carroll, S. B. (2007). Emerging principles of regulatory evolution. Proc. Natl. Acad. Sci. U S A. 104, 8605–8612. doi: 10.1073/pnas.0700488104
Qasba, P. K., and Kumar, S. (1997). Molecular divergence of lysozymes and alpha-lactalbumin. Crit. Rev. Biochem. Mol. Biol. 32, 255–306. doi: 10.3109/10409239709082574
Rodrigues, J. F. M., and Wagner, A. (2009). Evolutionary plasticity and innovations in complex metabolic reaction networks. PLoS Computat. Biol. 5:1000613. doi: 10.1371/journal.pcbi.1000613
Romano, A., and Conway, T. (1996). Evolution of carbohydrate metabolic pathways. Res. Microbiol. 147, 448–455. doi: 10.1016/0923-2508(96)83998-2
Roscoe, B. P., Thayer, K. M., Zeldovich, K. B., Fushman, D., and Bolon, D. N. A. (2013). Analyses of the effects of all ubiquitin point mutants on yeast growth rate. J. Mol. Biol. 425, 1363–1377. doi: 10.1016/j.jmb.2013.01.032
Schellenberger, J., Park, J. O., Conrad, T. M., and Palsson, B. O. (2010). BiGG: a Biochemical Genetic and Genomic knowledgebase of large scale metabolic reconstructions. BMC Bioinfor. 11:213. doi: 10.1186/1471-2105-11-213
Schultes, E., and Bartel, D. (2000). One sequence, two ribozymes: Implications for the emergence of new ribozyme folds. Science 289, 448–452. doi: 10.1126/science.289.5478.448
Schuster, P., Fontana, W., Stadler, P., and Hofacker, I. (1994). From sequences to shapes and back - a case-study in RNA secondary structures. Proc. R. Soc. London Ser. B 255, 279–284. doi: 10.1098/rspb.1994.0040
Segre, D., Vitkup, D., and Church, G. (2002). Analysis of optimality in natural and perturbed metabolic networks. Proc. Natl. Acad. Sci. U S A. 99, 15112–15117. doi: 10.1073/pnas.232349399
Thorington, R. W., and Santana, E. M. (2007). How to make a flying squirrel: Glaucomys anatomy in phylogenetic perspective. J. Mammal. 88, 882–896. doi: 10.1644/06-mamm-s-325r2.1
Toll-Riera, M., San Millan, A., Wagner, A., and MacLean, R. C. (2016). The genomic basis of evolutionary innovation in Pseudomonas aeruginosa. PLoS Genet. 12:e1006005. doi: 10.1371/journal.pgen.1006005
True, J. R., and Carroll, S. B. (2002). Gene co-option in physiological and morphological evolution. Annu. Rev. Cell Dev. Biol. 18, 53–80. doi: 10.1146/annurev.cellbio.18.020402.140619
Vermeij, G. J. (2006). Historical contingency and the purported uniqueness of evolutionary innovations. Proc. Natl. Acad. Sci. U S A. 103, 1804–1809. doi: 10.1073/pnas.0508724103
Wagner, A. (2017). Information theory, evolutionary innovations and evolvability. Phil. Trans. R. Soc. B 372:20160416. doi: 10.1098/rstb.2016.0416
Weinreich, D. M., and Chao, L. (2005). Rapid evolutionary escape by large populations from local fitness peaks is likely in nature. Evolution 59, 1175–1182. doi: 10.1554/04-392
Weirauch, M. T., Yang, A., Albu, M., Cote, A. G., Montenegro-Montero, A., Drewe, P., et al. (2014). Determination and inference of eukaryotic transcription factor sequence specificity. Cell 158, 1431–1443. doi: 10.1016/j.cell.2014.08.009
Weissman, D. B., Desai, M. M., Fisher, D. S., and Feldman, M. W. (2009). The rate at which asexual populations cross fitness valleys. Theoret. Populat. Biol. 75, 286–300. doi: 10.1016/j.tpb.2009.02.006
Zhang, Y., Feng, X.-H., Wu, R.-Y., and Derynck, R. (1996). Receptor-associated Mad homologues synergize as effectors of the TGF-β response. Nature 383:168. doi: 10.1038/383168a0
Keywords: innovation, novelty, evolution, molecular, co-option, metabolism, regulation, exaptation
Citation: Wagner A (2020) Information Theory Can Help Quantify the Potential of New Phenotypes to Originate as Exaptations. Front. Ecol. Evol. 8:564071. doi: 10.3389/fevo.2020.564071
Received: 23 June 2020; Accepted: 24 November 2020;
Published: 10 December 2020.
Edited by:
Marshall Abrams, University of Alabama at Birmingham, United StatesReviewed by:
Ard Louis, University of Oxford, United KingdomWilliam Sherwin, University of New South Wales, Australia
Copyright © 2020 Wagner. This is an open-access article distributed under the terms of the Creative Commons Attribution License (CC BY). The use, distribution or reproduction in other forums is permitted, provided the original author(s) and the copyright owner(s) are credited and that the original publication in this journal is cited, in accordance with accepted academic practice. No use, distribution or reproduction is permitted which does not comply with these terms.
*Correspondence: Andreas Wagner, YW5kcmVhcy53YWduZXJAaWV1LnV6aC5jaA==