 K. Mathias Wegner
 Ana Lokmer
 Uwe John
- 1Alfred Wegener Institut – Helmholtz-Zentrum für Polar- und Meeresforschung, Coastal Ecology Section, Bremerhaven, Germany
- 2Laboratoire d’Eco-anthropologie et Ethnobiologie, Muséum National d’Histoire Naturelle, Paris, France
- 3Alfred Wegener Institut – Helmholtz-Zentrum für Polar- und Meeresforschung, Ecological Chemistry Section, Bremerhaven, Germany
- 4Helmholtz Institute for Functional Marine Biodiversity, Oldenburg, Germany
Upon colonizing new habitats, invasive species face a series of new selection pressures as a result of changing abiotic conditions and novel biotic interactions with native species. These new selection pressures can be accommodated by different mechanisms that act on different levels and across different time scales: (1) By changing transcriptomic profiles, species can react by plasticity within individual physiological limitations. (2) Invasive populations can adapt by fixing beneficial genetic variants in response to the newly encountered selection pressures. Here, we compare the genomic and transcriptomic landscapes of two independent invasions of the Pacific Oyster (Crassostrea gigas) into the North Sea. In detail, we combine ddRAD sequencing on the genomic level with RNAseq on the transcriptomic level to reveal outlier loci (SNPs) indicative of adaptation, as well as transcriptomic profiles from a translocation experiment to show immediate physiological reactions between two populations characterizing the two independent invasions. Generally, we found low physical congruence between differentially regulated genes and outlier loci, indicating that different genes are involved on the different time scales. Functionally matching outlier loci and differentially expressed genes were however found for spliceosomal modification of mRNA and particularly for transposon activation, indicating that these variation creating processes might be connected across eco-physiological and evolutionary time scales. By contrasting and identifying functional congruence between population outlier loci and population specific transcriptomic profiles, we can thus reveal a glimpse at the traits and processes characterizing specific mechanisms involved in successful invasions.
Introduction
Species invasions are ideal scenarios to study adaptation to novel environments in nature. They can reveal the real power of natural selection as they reflect the upper boundary of adaptive potential (Moran and Alexander, 2014). While the match of prior adaptations to the new ecological conditions can play a role for invasion success (Curnutt, 2000), more commonly non-indigenous species will be confronted with new environmental conditions upon colonization that represent mismatches with their native habitat and their corresponding ecological niches. Next to high plasticity (Richards et al., 2006; Knop and Reusser, 2012), rapid adaptation to new environmental and ecological conditions can increase fitness and several studies have shown rapid adaptation of fitness relevant traits after colonization (Dlugosch and Parker, 2008). Among others, these included adaptations to climatic conditions (Colautti and Barrett, 2013; Colautti and Lau, 2015) as well as coevolution in novel biotic interactions of hosts and parasites (Kelehear et al., 2012; Weclawski et al., 2013; Wendling and Wegner, 2015; Feis et al., 2016; Goedknegt et al., 2016). In these cases adaptation was deduced from phenotypic differences comparing native and invasive populations (Weclawski et al., 2013) or trajectories along invasions fronts (Kelehear et al., 2012; Colautti and Barrett, 2013; Feis et al., 2016) leaving the underlying adaptive changes on the genetic level unresolved.
While many evolutionary responses of invasive species were discovered in terrestrial and freshwater systems, many non-indigenous species seeding primary species invasions occur in marine, and especially coastal areas (Seebens et al., 2013), owing to increased trade (Hulme, 2009), and aquaculture activities (Molnar et al., 2008). Due to high genetic variability and few limitations to gene flow, adaptive genetic differentiation is difficult to detect in marine species. With the onset of next-generation sequencing, the genomic comparison of native and invasive population opened up the opportunity to reach sufficient genomic coverage to identify genomic regions that contain genetic variants underlying adaptations, also in marine invasions (Bourne et al., 2018).
One approach that is frequently employed in this context is the identification of outlier loci with higher genetic differentiation between native and invasive populations compared to the genome-wide average, and the functional characterization of genes associated with outlier loci suggests that adaptive traits (e.g., immunity, osmoregulation) can be the likely target for adaptation (Bernardi et al., 2016; Forsström et al., 2017; Lin et al., 2017). While native-invasive comparisons can reveal crucial mechanisms facilitating invasion success in general, they miss the specific adaptations to different invaded habitats. Such knowledge is however crucial when trying to assess the role of adaptive potential for the invasive spread within a certain area. It also allows to assess how repeatable adaptive processes during invasions are, and will thus have wider implications on the role of selection in invasion processes. To investigate whether such specific adaptive responses can be traced through different invasions events, we now compare two populations characterizing the independent invasions of the Pacific oyster Crassostrea gigas into the European Waddensea (Moehler et al., 2011). Originating from Japan, C. gigas is one of the most widely used mollusc species in aquaculture (FAO, 2014). And since aquaculture is one of the main sources of biological invasions (Molnar et al., 2008), it is not surprising that C. gigas successfully colonized natural habitats from aquaculture sources worldwide (Ruesink et al., 2005). The European Waddensea experienced at least two highly successful invasions (Reise et al., 2017) that occurred within very similar time frames (Troost, 2010) and thereby offer the opportunity to capitalize on repeated natural invasion experiments into similar habitats (Figure 1). By exploiting the specific natural history of these oyster populations, it was already shown that oysters from both invasions locally adapted to their sympatric communities of pathogenic Vibrio bacteria (Wendling and Wegner, 2015). Genomic comparisons of these Vibrio communities revealed that only few molecular targets were involved on the pathogen side (Wegner et al., 2019). While adaptive genetic divergence of oyster hosts remains unknown, these results may suggest that processes involved in the immune defense might show matching patterns of adaptive divergence.
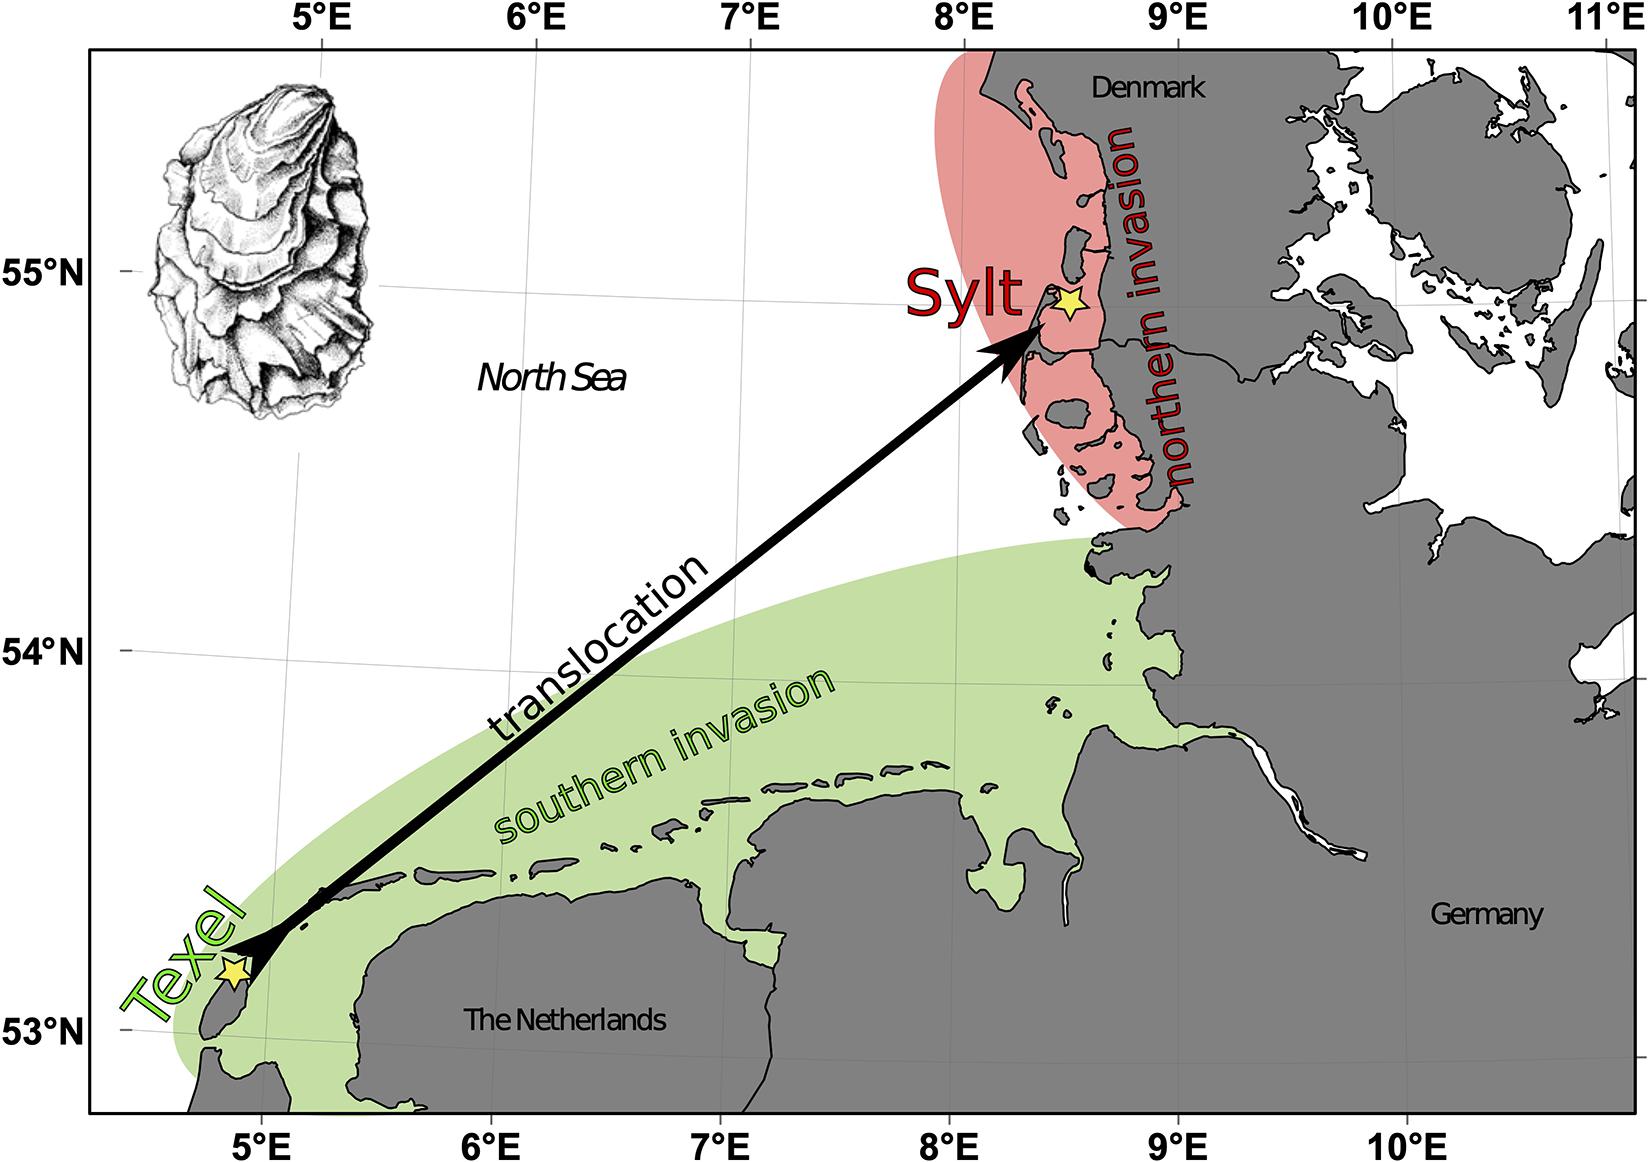
Figure 1. Invasions of Pacific oysters Crassostrea gigas into the Wadden Sea. The southern invasion originated from aquaculture activities in the Oosterschelde and first feral oysters were found on Texel in 1983 (Bruins, 1983). The northern invasion was seeded by aquaculture activities on the island of Sylt where first wild oysters were found in the early 1990ies (Reise et al., 2017). Oysters from both original locations (yellow stars) served as representatives of the two invasion and genome wide differentiation was compared to transcriptomic differentiation of oysters from Texel that were translocated to Sylt.
Here, we now tried to characterize genomic differentiation between both invasions on two different levels representing different invasion time scales. First, we tried to identify outlier single nucleotide polymorphisms (SNPs) on the genomic level with high genetic differentiation representing long term changes based on allele frequency shifts. Outlier analyses target selection from standing genetic variation on the DNA level, and thus depict the adaptation process on a time scale that is probably too long for the initial stages of colonization. During initial colonization, physiological acclimation, phenotypic plasticity and epigenetic modification can buffer adverse environmental effects organisms are exposed to, and we could already show that tissue-specific microbiota can play a decisive role in the initial stages of translocation (Lokmer et al., 2016). On the molecular level these fast responses should also be reflected in gene regulation (i.e., on the transcriptomic level), and several studies investigated the transcriptomic responses of invaders between species (Wellband and Heath, 2017; Romero et al., 2019), between native and invaded regions (Guggisberg et al., 2013; Vogel et al., 2017) or between invasive populations (Feis et al., 2018). Yet, with only few exceptions (Parente et al., 2017) hardly any study actually tried to explicitly link transcriptomic and genomic differentiation in the same invasive species system. To bridge this gap, we also characterized the immediate physiological response on the transcriptomic level by monitoring changes of gene expression in the early stages of the same populations, which were also used in a transplantation experiment investigating the role of the microbiome (Lokmer et al., 2016). By the comparison of the two invasive populations colonizing similar habitats with different omics-techniques we can specifically ask: (1) What are the genomic regions and underlying processes that differentiate the invasions? and 2) to what extent do these processes match those of short term acclimation? We can thus try to link the functional characteristics of short term acclimation to that of long-term adaptation. The combination of both approaches is complementary and can reveal to which degree short-term acclimation (i.e., plasticity via transcription) and long term adaptation fixing alleles in populations target similar processes on the molecular level.
Materials and Methods
Biological Material
The oysters used for this study originated from an experiment investigating the change in oyster associated microbial communities in oysters transplanted from the southern Wadden Sea to the northern Wadden Sea (Lokmer et al., 2016). Oysters (n = 40) from the southern Wadden Sea invasion were collected in de Cocksdorp, Texel, Netherlands (53° 0′ N, 4° 54′ E) and the same number of oysters was collected from the transplantation site (Oddewatt, Sylt, Germany, 55° 1′ N, 8° 26′ E). Half of the oysters were treated with antibiotics to remove parts of the resident microbiota and five oysters from each group were sampled at random on days 1,2,3, and 5 of the experiment (for details see Lokmer et al., 2016). The oysters were dissected immediately after collection. The gills were frozen in the liquid nitrogen and then stored at −80°C. Transcriptomes were sequenced from gill tissues of 46 individuals covering all days of the experiment. To directly compare genomic to transcriptomic differentiation in the same individuals, we randomly chose 10 oysters from each site for ddRAD sequencing (G6, G94, G124,G194, G158, G52, G138, G150, G198, G4 from Texel, G93, G137, G169, G23, G73, G81, G167, G3, G123, G147 from Sylt).
DNA Sequencing
DNA from the 20 oysters was extracted with the DNeasy Blood & Tissue kit (Qiagen, Hilden, Germany) from a piece of gill following the manufacturer’s protocol, and used for double digest restriction site associated DNA sequencing (ddRAD) with library preparation following established protocols (Peterson et al., 2012; Schweyen et al., 2014). In brief, 400ng DNA was digested with PstI and MspI (Thermo Fisher Scientific, Schwerte, Germany) by incubation for 45 min at 37°C, and cleaned using the MinElute Reaction Cleanup Kit (QIAGEN, Hilden, Germany). Matching sequencing adapters (P7- and P5-adapter) including barcodes sequences were ligated to the double digested DNA with T4 DNA Ligase (Eurofins and New England Biolabs, Frankfurt, Germany) at 16°C for 2 h. After clean-up products between 500 and 1000 bp were selected in a two-step bead-based protocol using the AMPure XP kit (Beckman Coulter). The size selected fragments were amplified for 16 cycles using P5 and P7 primers and the quality of the products assessed on an Agilent 2100 Bioanalyzer (Agilent, Santa Clara, CA, United States). The individual indexed samples were pooled and the pooled library was sequenced on an Illumina NextSeq® 500 sequencer in house.
ddRAD Processing
Raw DNA sequence reads were filtered for PCR duplicates with the perl script double_indexing (Schweyen et al., 2014). Subsequently reads were trimmed to a length of 90 bp using a combination of Trimmomatic v 0.32, the perl script preprocess_ddradtags and FastQC v 0.11.3 (Schweyen et al., 2014). Finally, reads with intact barcode sequences in the P5-read were sorted into separate files for corresponding to each sample (Schweyen et al., 2014; Weiss et al., 2018). The software Stacks Version 2.0 Beta 8c (Catchen et al., 2013) was used to process the data with reference genome aligned reads (ref-map). Quality trimmed and de-multiplexed reads were mapped to the reference genome in CLC v12. Mapping parameters were kept at default values (Mismatch costs = 2, Linear gap costs, Map randomly). Mapped reads were exported as SAM-files and used as input files for further reference map (ref-map) calculations in stacks. Within Stacks 4 mismatches between stacks (n = 4) were allowed and a minimum depth of coverage of 6 (m = 6) was required to build a locus. For the population characterization following parameters were used: kernel-smoothing (k) was turned on, allele frequencies, F-statistics [inbreeding coefficient (FIS) and fixation index (FST)] were calculated.
Outlier Analysis
To identify outlier loci showing higher than background genetic differentiation (FST) we used OutFLANK (Whitlock and Lotterhos, 2015). The OutFLANK algorithm uses a subset of loci to infer the distribution of neutral genetic differentiation and fits a χ2 distribution with adjusted degrees of freedom to identify outlier loci outside of this distribution. Simulation studies showed that this method has a lower false positive rate than other outlier detection routines. However, OutFLANK assumes a comparatively flat distribution of FST values across expected heterozygosities, which is commonly observed when many populations are compared. Since in our case only two populations were assayed, FST values at lower heterozygosities tend to be bound by an upper limit that is much smaller than 1, which makes the identification of outlier loci harder for low He values (Figure 2). We therefore tried to identify outlier loci by a sliding window approach with a window size of 0.03 and an increment of 0.01 across expected heterozygosities ranging from 0.1 to 0.5. To minimize the effect of outlier loci on neutral FST estimates, we randomly chose 10% of the loci in each window to calculate the neutral average FSTbar, against which we tried to find outlier loci using a false discovery rate of 0.05. We further tried to identify population specific signatures of selective sweeps. Loci that were near fixation in one population (major allele frequency P > 0.95) but polymorphic in the other (0.3 < P < 0.6) were assumed to represent selective sweeps in the respective population.
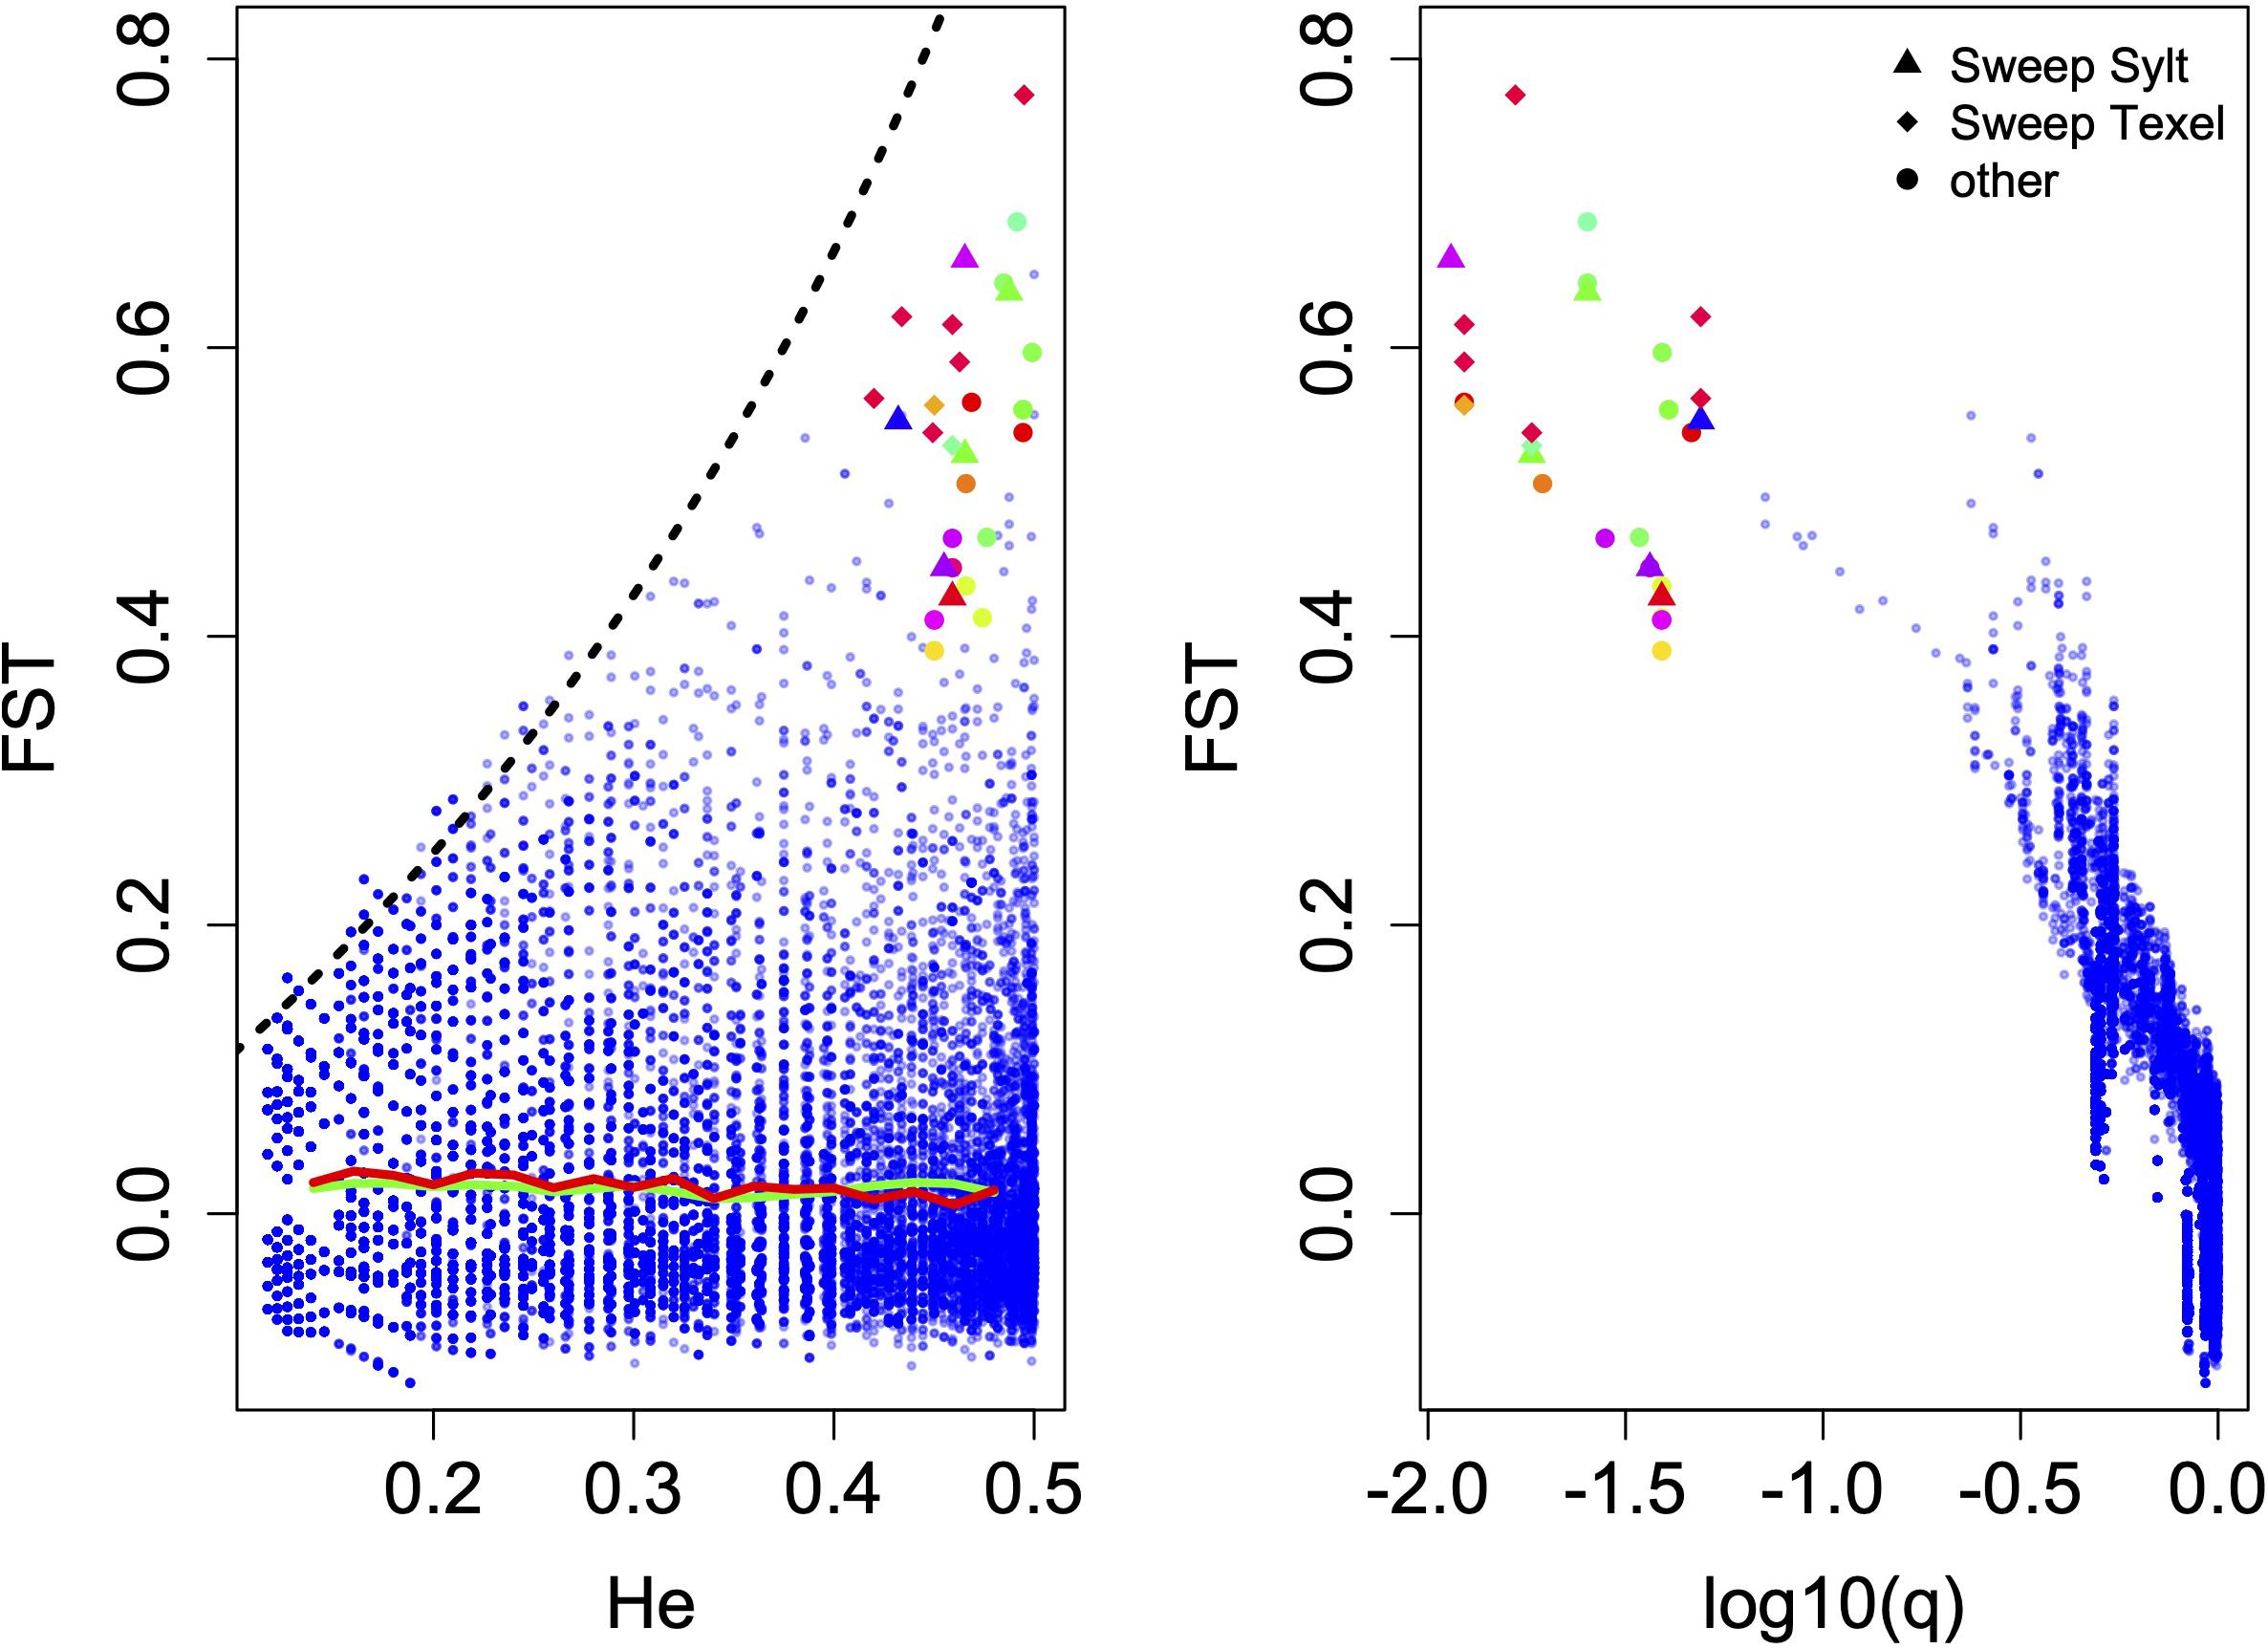
Figure 2. Outlier detection in 36116 SNP loci with He > 0.1. (A) Genetic differentiation as a function of expected heterozygosity (He) and (B) as a function of q. Each blue dot represents one SNP. Genetic differentiation is limited by the theoretical upper bound (black dashed line) at lower heterozygosities and outlier loci were only detected in the range of expected heterozygosities from 0.42 to 0.5. Triangles and diamonds show loci that showed characteristics of selective sweeps in Sylt or Texel, respectively and colors of outlier loci indicate scaffold affiliation of these loci. The green line shows the average FST and the red line the FSTbar value for each sliding window across the He range.
RNA Sequencing
RNA was extracted with TRIzol Reagent (Life Technologies, Carlsbad, CA, United States) following the manufacturer’s protocol. To homogenize the gill tissue, the reagent was added to the frozen samples together with a 5 mm stainless steal bead and a mixture of 2 mm glass beads. The tubes were then placed in pre-cooled TissueLyzer adapters (Qiagen, Hilden, Germany) and bead-beaten at 30 Hz for 2 × 90 s in a ball mill (Retsch, Haan, Germany) following the manufacturer’s protocol. The quality and concentration of the extracted RNA were checked with a NanoDrop ND-1000 spectrophotometer [Peqlab (VWR), Erlangen, Germany] and the RNA was subsequently stored at -80°C. A total of 46 dual-indexed RNA libraries were prepared as described in Shama et al. (2016). Briefly, 1 μg of RNA was processed with the TruSeq Stranded mRNA HT Sample Prep Kit (Illumina, San Diego, CA, United States) and the pooled libraries were sequenced as 75 bp single-end reads in house using an Illumina NextSeq500 sequencer.
RNA Pre-processing and Quality Check of the Sequencing Data
The sequenced RNA libraries were processed as described in Shama et al. (2016) and Feis et al. (2018). Shortly, we used Trimmomatic (Bolger et al., 2014) for trimming and filtering and FastQC for the read quality analysis. In addition, rRNA sequences were removed using SortMeRNA (Kopylova et al., 2012). All four files generated from a single sample on different lanes were merged into a single file before mapping. We mapped the clean RNA reads to the C. gigas genome (v1.30) with STAR aligner (Dobin et al., 2013) using the following parameters: outFilterMismatchNoverLmax = 0.2, outFilterMatchNminOverLread = 0.51, outSJfilterOverhang Min = (30, 12, 12, 12), seedSearchStartLmaxOverLread = 0.51.
Annotation of the Oyster Genome
Preliminary analyses revealed that most of the hits to the genome fell into intergenic regions. As our libraries were poly-A tail enriched, we assumed this was due to an incomplete annotation and 3′ UTR bias. We therefore ran de novo gene prediction with the standalone version of Augustus (Stanke et al., 2006), using our RNA-seq data and available oyster gene structures as external hints following the suggested protocols (Hoff and Stanke, 2019). The predicted genes were then annotated using the standalone version of InterProScan (Jones et al., 2014) with all available modules.
Differential Gene Expression and Gene Ontology Enrichment Analysis
We used the R package GenomicFeatures (Lawrence et al., 2013) to count transcripts grouped by gene in the alignment files. We then analyzed gene expression with the R package DESeq2 (Love et al., 2014). To be able to compare outlier loci from genetic differentiation analyses with differentially expressed genes after translocation between the oyster origins, we put our analytical focus the effect of oyster origin. To further incorporate the temporal dynamics of differential gene regulation, we fitted a model containing origin and antibiotic treatment plus its interaction for each day separately. We included the antibiotic treatment as an effect to account for its potential effect on gene transcription, but we only report genes that were differentially regulated between both origins and discard genes only found significant in the interaction term. The significant genes were selected based on their pi-value (pi ≥ 2), which takes into account both the statistical significance (P value) and the magnitude of fold change (Xiao et al., 2014). We summarized genes that were differentially expressed on at least one day with the R package pheatmap representing each day with a single collumn. We scaled the LFC values per gene, which resulted in the clustering of genes with similar temporal dynamics. Each of these clusters was tested for enriched gene ontology (GO) terms against a gene universe consisting of all the genes that were not filtered out during the differential expression analysis (“independent filtering” in the DESeq2 function). The GO enrichment analysis was performed with the R package topGO (Alexa and Rahnenfuhrer, 2010) and the enriched terms were selected based on the Fisher tests using the “weight01” algorithm, which takes GO ontology structure into account.
Results
Genetic Differentiation and Outlier Loci
Analyses with Stacks2 resulted in a total of 109410 identified SNP loci. Across all loci with expected heterozygosity > 0.1 (n = 36116) we found a weak genetic differentiation of 0.018, matching previous results of differentiation between the two genetic clusters observed in Europe (Rohfritsch et al., 2013; Lallias et al., 2015). FST estimates can be robust when many loci are used, even with only few sampled individuals (Willing et al., 2012). Although, we only used a comparatively small number of individuals for ddRAD sequencing the congruence to previous results suggests that we estimate FST correctly on average, while we might still introduce bias at either end of the distribution. Individual locus FST reached values as high as 0.775 suggesting large variation between individual loci, which could have been shaped by selection. OutFLANK identified a total of 31 outlier loci on 22 scaffolds of the oyster genome assembly (Figure 2). We found six SNPs in each population that showed signatures of selective sweeps. In the Texel samples, these were found on three independent loci, while sweep SNPs in the Sylt samples were represented by four loci. According to our annotation of the reference genome 19 outlier SNPs (38%) from 13 loci were located in coding regions and 7 of them were non-synonymous substitutions (Table 1).
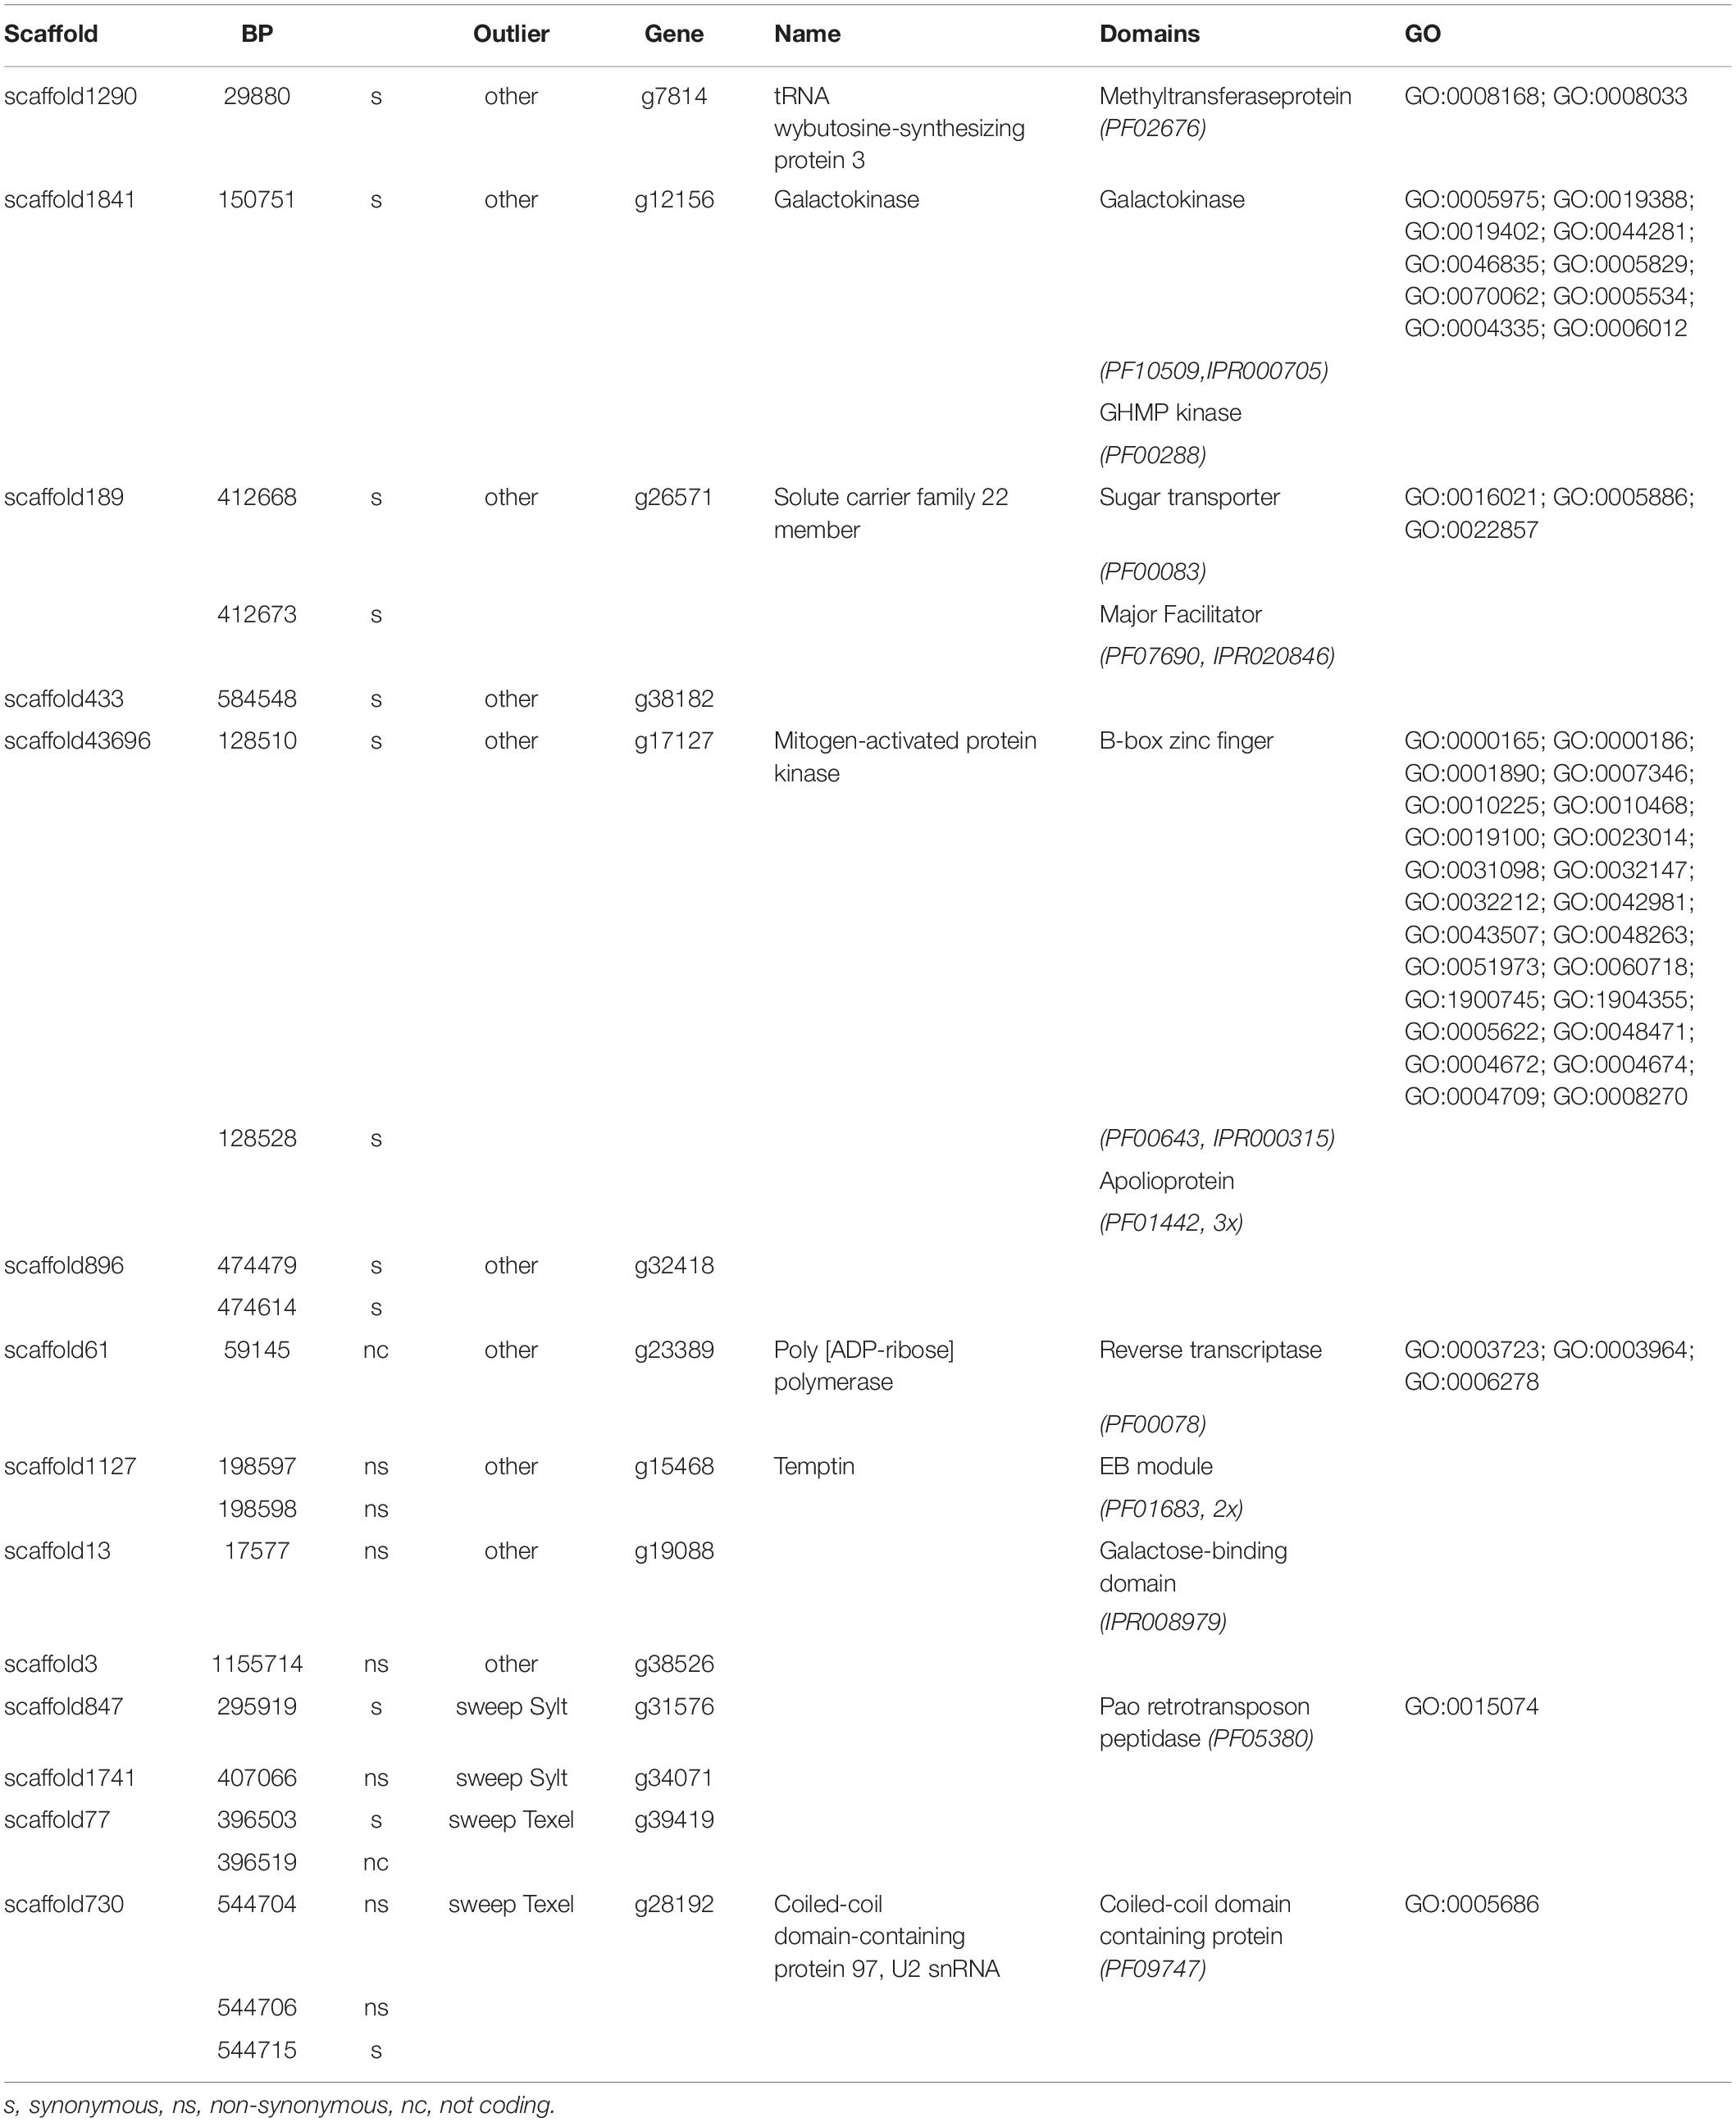
Table 1. Annotation of outlier SNPs within gene regions giving the genomic scaffold and position in bp, substitution type, outlier type and gene annotation with conserved domain signatures and gene ontology.
We could deduce a functional annotations for nine of the 13 genes affected by outlier substitutions. Annotations mainly included metabolic genes and ATP binding (GO:0005524) was the most common term. Furthermore, sugar and especially galactose metabolism showed signs of elevated differentiation between both invasion fronts. Two genes, g23389 with a reverse transcriptase domain and g31576, with a retrotransposon peptidase showed signature viral or mobile genetic element origin and the SNP associated with g31576 was probably also fixed by a selective sweep in the Sylt population. The underlying substitution was however silent, suggesting that this particular SNP was not the direct target of selection (Table 1). Non-synonymous substitutions in general had a comparatively low annotation rate, and we could only annotate two genes with non-synonymous outlier substitutions. One (g15468) showed significant similarity with Temptin, a pheromone used by the marine gastropod Aplysia californica for mate attraction (Cummins et al., 2004). The other (g28192) was characterized as a homolog of Coiled-coil domain-containing protein 97, a U2 small nuclear ribonucleoprotein (snRNP), which is an essential component of the major spliceosomal complex. The two non-synonymous substitutions found in this gene were associated with the signature of a selective sweep in Texel indicating that functional differences in transcript processing might be driven by selection between both oyster invasions (Table 1).
Differential Gene Regulation
Differences between origins regulated considerably more genes than differences in antibiotic treatment. Compared to the 113 differentially expressed genes (DEGs) affected by antibiotics, our analysis revealed a total of 555 DEGs that showed differential expression between the oyster origins (Figure 3 and Supplementary Table 1). Most of these were differentially regulated on day 1 (272 genes). DEG numbers dropped by more than half on the following days (day 2 116 genes, day 3 103 genes, day 5 115 genes). The vast majority of 91% (507 genes) was differentially regulated on a specific day, whereas only 47 genes were found on two days and only three genes were differentially regulated on three separate days while no gene showed consistent significant regulation between origins throughout the whole period. Clustering the expression dynamics revealed seven clusters of genes that showed similar expression patterns over the time course of the experiment (Figure 3). These clusters resembled the temporal specificity of gene regulation with different clusters containing larger proportions of genes significantly regulated on different days. Cluster 6, for example, nearly exclusively contained genes significantly up-regulated on day 1, and may thus represent the immediate response cluster, while cluster 2 mainly contained genes that were significantly down-regulated on day 3 (Figure 3). This suggests that the transcriptomic response to translocation is highly dynamic and affects distinct sets of genes at different points of time.
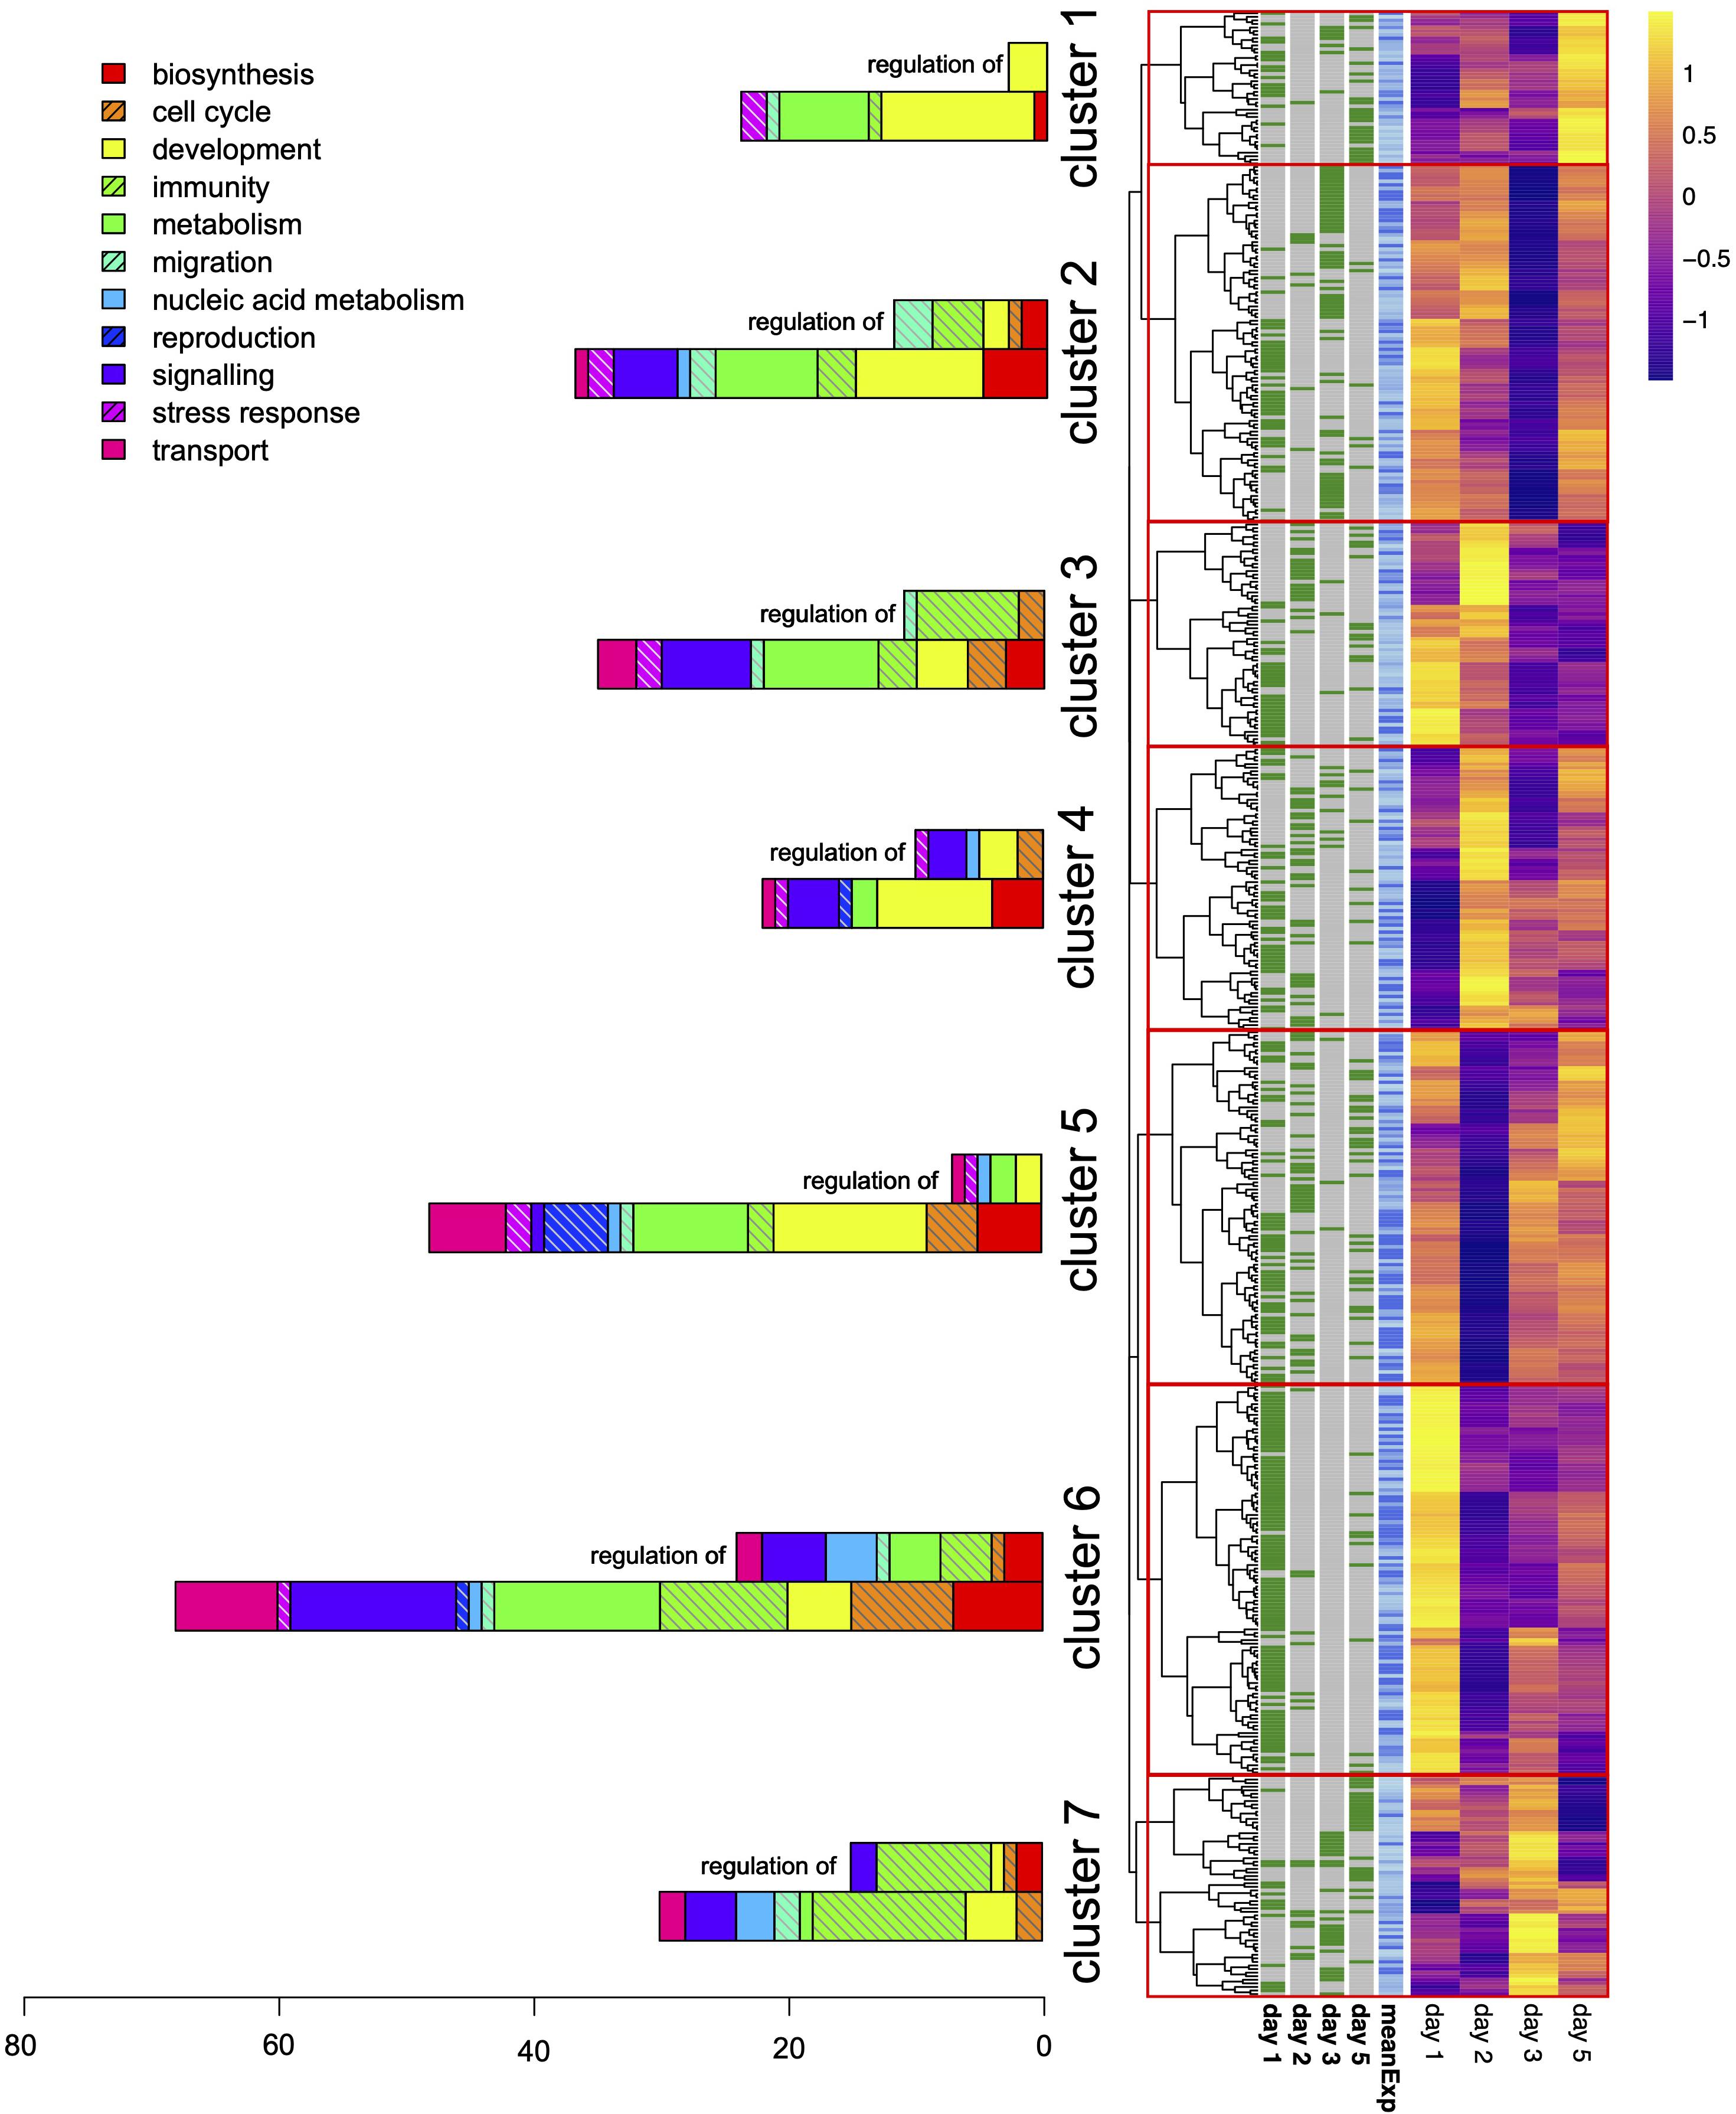
Figure 3. Differentially expressed genes after oyster translocation. The heatmap shows genes differentially expressed between the oyster origins on different days after translocation. Each line represents one of the 555 significantly regulated genes and expression values were standardized by gene showing the temporal dynamics of up- or down regulation of Texel relative to Sylt oysters. The overall mean expression level of each gene is shown in the blue column, and the four collumns left of that indicate on which day a gene was significant. Clustering was performed based on the expression heat map and split clusters on the deepest possible branching point. Bar charts on the left show the number and processes of GO terms enriched within that cluster. GO terms associated with regulation were the most common terms and are therefore in a separate column for each cluster.
Out of the 555 DEGs, we found annotations for indicative functions for 488 genes (89%). Enrichment analyses of the associated GO terms revealed 346 GO terms enriched within clusters, out of which only 17 were detected in more than one cluster or gene, suggesting functional divergence between the transcriptomic clusters and low replication of genes within GO terms. This was also reflected in larger clusters showing higher numbers of GO terms (Figure 3). When grouping these terms into higher order functional categories, we found that GO terms involved in regulation were the most frequent with 82 GO terms followed by developmental and metabolic processes with 56 and 49 enriched GO terms respectively. Since regulatory processes target the other functional categories, we show regulatory GO terms separately with their targeted functional category (Figure 3). Functional diversity of GO terms decreased over time with cluster 6 showing the highest number and functional diversity of genes up-regulated on day 1. Cluster 1, on the other hand, containing genes up-regulated on day 5 only contained few GO processes mainly affecting developmental processes and regulatory processes exclusively targeting development (Figure 3). The immediate response cluster 6 also contained many DEGs involved in signaling, indicating that the immediate response to a new environment induces differential regulation of many processes downstream. This primarily targeted metabolic processes since 36 out of the 42 (85%) of the genes mapping to enriched GO terms also mapped to GO:0008152 “metabolic process,” indicating that metabolic adjustment on multiple pathways was among the first responses to translocation. The proportions of functional categories between clusters did not differ significantly from each other for the majority of categories. While cluster 6 showed a nearly significant increase in signaling GO terms (Fisher’s exact test, P = 0.064), only GO terms involved in immunity showed significant differences for regulatory (Fisher’s exact test: P = 0.016) and non-regulatory immunity GO terms (Fisher’s exact test: P = 0.036). This difference was caused by the high proportion of GO terms mapping to immune processes in cluster 7 (Figure 3). Genes in cluster 7 showed concerted up-regulation on day 3 after translocation. The enrichment in immune processes was however mainly driven by two genes: G23494 a putative Toll-like receptor 6 homolog that mapped to 9 immune processes including bacterial lipoprotein detection and inflammatory responses, and G21355, a receptor-type tyrosine-protein phosphatase C homolog that is involved in as many as 18 processes regulating B- and T-cell immunity in vertebrates. G21355 also mapped to the GO:0006310 – DNA recombination, which was also found for four other genes in this cluster. As mentioned above, most GO terms were only represented by single genes because the term was rare in the annotation of the background genes. Therefore, the comparatively high number of genes involved in DNA recombination deserves special attention. The other genes mapping to DNA recombination were a Gag-Pol polyprotein (G14449) and a Pol polyprotein from a Drosophila transposon of viral origin (G765), two uncharacterized transposase-like proteins (G6845, G14324) and a retropepsin with an integrase domain (G5264). These genes also shared other GO terms like GO:0015074 DNA integration, GO:0006313 transposition and GO:0019076 viral release from cell, suggesting that an increased transpositional activity is an immediate stress response to translocation.
Congruence Between Genomic and Transcriptomic Targets
One of our aims was to investigate whether genes that quickly respond to translocation by differential gene regulation were associated to targets of selection leading to significant shifts in allele frequencies. This kind of congruence can manifest itself on different levels that includes outlier loci found within the same gene or in a gene in close proximity (physical congruence). Out of the 14 genes containing outlier loci none was among the 555 DEGs indicating that transcriptomic variation does not correlate with allele frequency shifts of the underlying gene directly. When looking on the level of assembled parts of the genome (i.e., scaffold-level) we found 9 DEGs that were found on the same scaffold as an outlier SNP. These DEGs were concentrated in clusters 4 and 6 (with four DEGs each), but distance between the outlier SNP and the DEGs was on average 390 kB (range: 32–1091 kB), suggesting only limited direct interaction due to genomic or physical proximity in general.
Next to physical proximity, genomic and transcriptomic responses can form functional congruence with distinct genes affecting the same process or pathway. Outlier loci within genes that affect galactose metabolism could indicate that also short term metabolic acclimation might react by differentially regulating galactose metabolism. Indeed, we could find eight galactose binding domains (IPR008979) within the DEGs matching the outlier gene g19088 (Table 1). Several of these did belong to C-type lectins suggesting an immune recognition function rather than a metabolic function that would correspond to the galactokinase g12156 (Table 1).
One of the few non-synonymous SNPs that showed characteristics of a selective sweep in Texel was the SNP in the coiled-coil domain containing protein 97 (g28192) located in the spliceosome (Table 1). Its putative involvement in splicing of messenger RNA matched the enriched GO term GO:0048026 positive regulation of mRNA splicing, via spliceosome, which mapped to a Zinc-finger protein homolog (g19234) in cluster 5. g19234 was generally upregulated in Texel samples (significant on day 0), suggesting that translocation might immediately lead to increased transcript modification. However, given that only one out of the 555 DEGs seems to be involved in splicing, might suggests that that the regulatory control is very tight or that this link is probably of lesser importance. In fact, the only formal match between the outlier GO terms and the enriched GO terms within the DEGs was found for DNA integration (GO:0015074), which was found for the outlier gene g31576 (Table 1) and was also enriched in several DEGs in cluster 7 (Figure 4) and a total of nine DEGs associated to transposable elements in total (Supplementary Table 1).
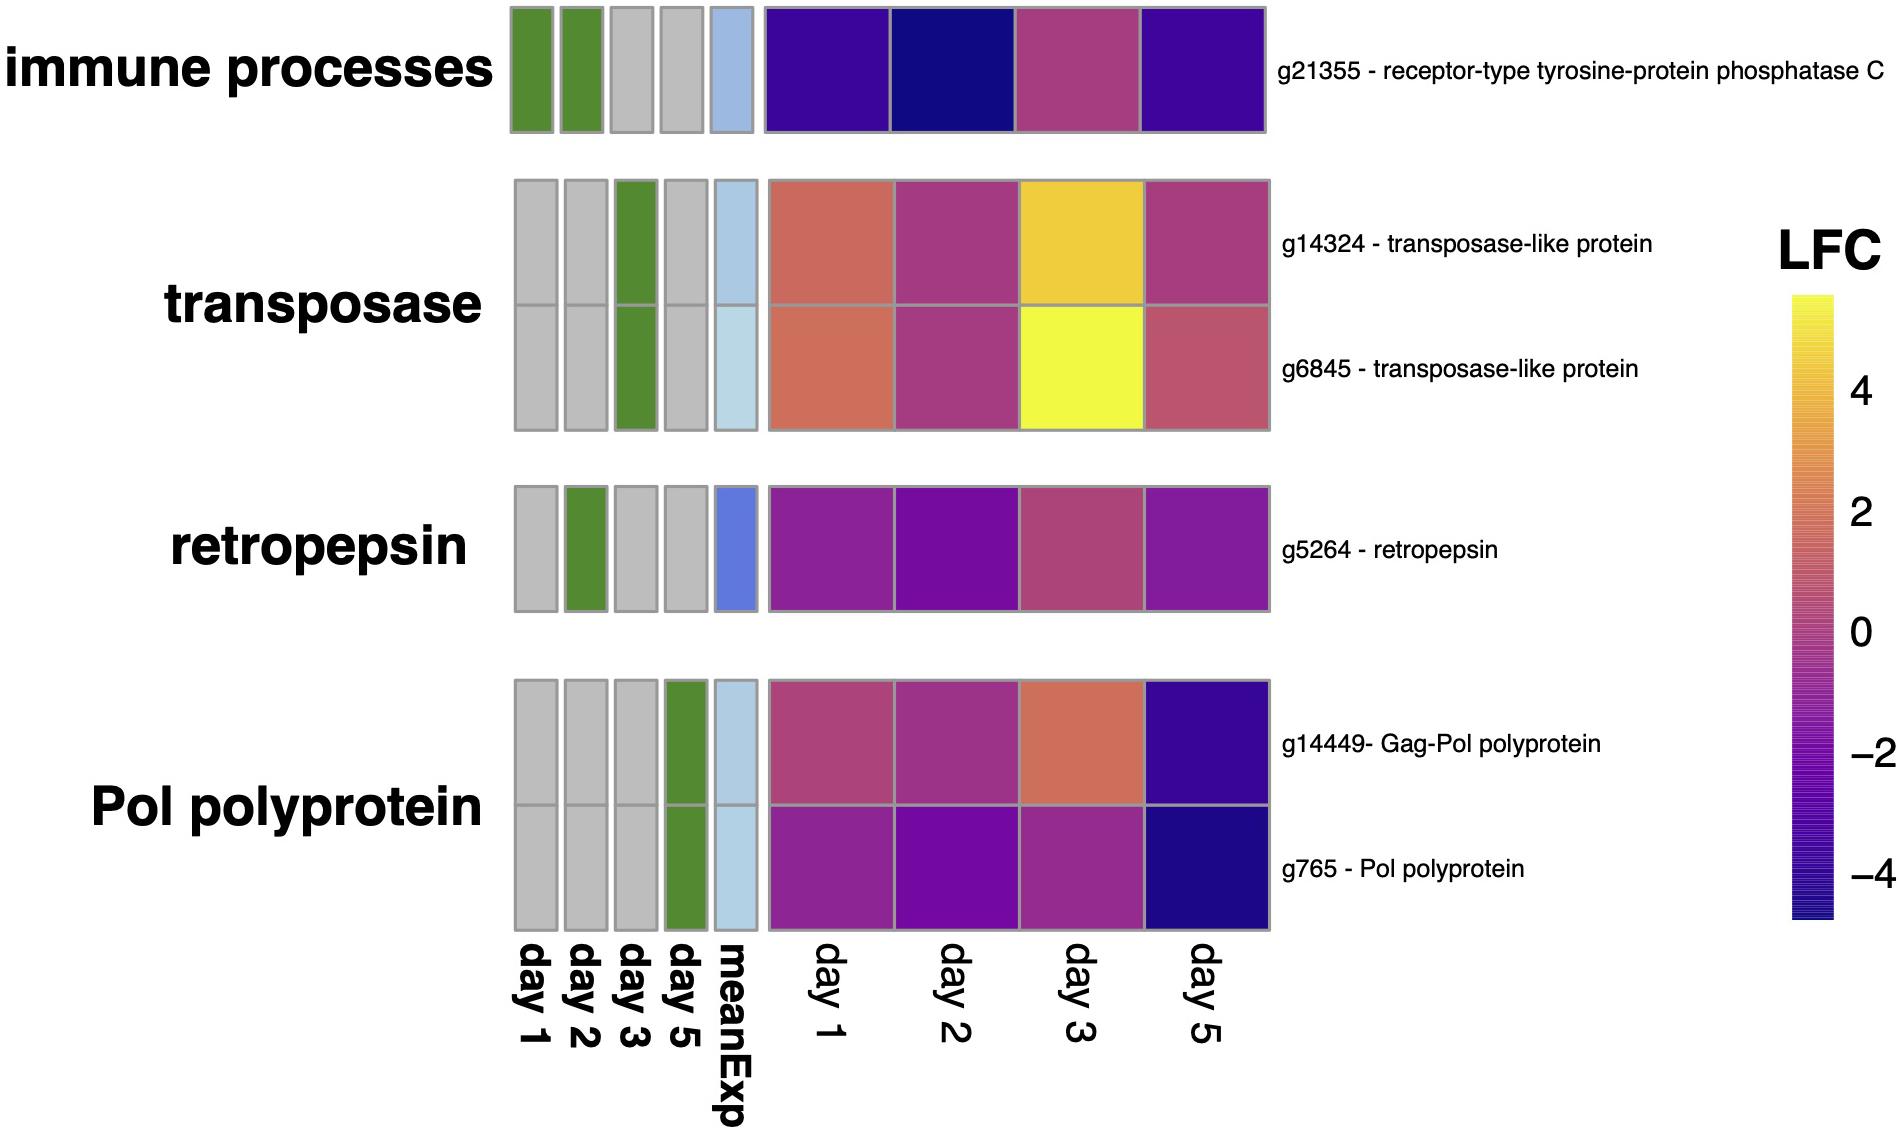
Figure 4. Differential expression of genes involved in DNA recombination (GO:0006310 - DNA recombination). The heatmap shows the log-fold change (LFC) of Texel oysters relative to Sylt oysters with a significant up-regulation of transposase genes on day 3 and down-regulation of genes of viral origin (retropepsin on day 2 and Pol polyproteins on day 5).
Discussion
The adaptive response of invasive species to the novel conditions in new habitats plays an important role for invasion success (Dlugosch and Parker, 2008; Colautti and Barrett, 2013), but can vary between different invasion events (Wendling and Wegner, 2015). Capitalizing on the independent invasions of the Pacific oyster into the European Wadden Sea (Moehler et al., 2011), we have now investigated the genomic signatures that differentiate two representative populations of these invasions along different time scales by comparing genomic outlier loci (long-term adaptation) with differentially expressed genes after translocation (short-term acclimation). While we found no direct match between outlier loci and differentially expressed genes in terms of gene identity or physical proximity, we found remarkable matches on the functional level. Here, the significant genetic differentiation of the outlier in the PAO retrotransposon peptidase g31576 and the reverse transcriptase g23389 matched the induction of several DEGs associated to transposon activation in Texel oysters after translocation into a new environment (Figure 4). While we cannot rule out that the observed genomic differentiation was present in the aquaculture broodstocks before each invasion event, this connection might point toward the importance of transposons in the stress response after relocation that can be translated to adaptive evolutionary process on longer time scales. The potential role of transposons as motors of evolutionary innovation by providing mechanisms to replenish and generate genetic variance has been recognized for biological invasions (Stapley et al., 2015). Despite of its intuitive appeal only little empirical support for this hypothesis has been found so far. The higher content of transposable elements (TE) in invasive Aedes agyptii mosquitoes than in locally restricted Anopheles gambiae (Stapley et al., 2015) hints on an adaptive role of TEs linked to overcoming temperature stress (Goubert et al., 2017). Similarly, the genome of invasive ants species is enriched in TEs (Schrader and Schmitz, 2019), suggesting that invasive potential of species might be connected to their genome flexibility based on a higher transposition rate.
Also within species, some outlier loci differentiating invasive and native populations were associated with TEs in marine clams (Metivier et al., 2017). Extending these findings we could now detect TE-associated outlier loci between populations from independent invasions of another marine bivalve, which might suggest that transposon activation might be a more universal feature of successful invasion, and might be fine-tuned to the conditions encountered in newly colonized habitats. Similar to outlier loci in clams (Metivier et al., 2017), the TE-associated loci identified here were silent or non-coding mutations suggesting that the outlier SNPs were not the direct target of natural selection. It is more likely that other genes changing their structure or expression as a consequence of transposon insertion might have conferred the selective advantage, and thus increased the frequency of TE-associated SNPs in a sweep like fashion. The expression of retrotransposon associated genes has been implicated in range expansion of dragon flies (Lancaster et al., 2016), suggesting that transposon activity might also have beneficial effects on short term acclimation. By identifying TE associated genes in outlier loci as well as in differentially expressed genes, we can now link these time scales in a single species and thereby build a potential bridge between short and long term responses of biological invasions.
Next to transposon associated loci, other matches between outlier loci and transcriptomic differentiation revolved around ATP-, but also galactose metabolism (Table 1). Galactose is a frequent component of the lipopolysaccharide (LPS) layer of many gram-negative bacteria, including well known oyster pathogens like Vibrio spp. (Destoumieux-Garzon et al., 2020). It has been established as a pathogen associated molecular pattern (PAMP) recognized by C-type lectins in shellfish (Huang et al., 2013; Li et al., 2015), potentially suggesting a role in immune recognition of these genes. Immune genes are frequently found among outlier loci in invasive species (Bernardi et al., 2016; Metivier et al., 2017), highlighting the strength of diversifying selection exerted by the new set of pathogens invaders are exposed to after colonizing a new habitat (Wendling and Wegner, 2015). In fact, we could already show that the two oyster populations used here have evolved resistance against their sympatric communities of Vibrio spp. (Wendling and Wegner, 2015; Wendling et al., 2016). And while we have successfully identified the molecular targets of the specific host x pathogen interactions on the Vibrio pathogen side (Wegner et al., 2019), we lack an understanding of the genomic architecture of resistance of the oyster host. One of the identified Vibrio genes, OG1907 (Wegner et al., 2019) contained a Glycosyl Hydrolase 3 domain (PF00933) that could potentially be involved in modification of the complex sugar composition of the LPS (Simpson and Trent, 2019), thereby establishing a potential link to the outlier loci found here if they target galactose in LPS of Vibrio. The importance of galactose binding by C-type lectins was also reflected in the transcriptomes, where a galactose binding domain was annotated in eight differentially expressed genes. Together with the periodic enrichment of immune processes this confirms previous results (Wendling and Wegner, 2015; Bernardi et al., 2016; Metivier et al., 2017) and might suggest a higher importance of adaption in immune traits in invasions than previously expected (Cornet et al., 2016).
The only annotated outlier locus where strong frequency shifts representing a selective sweep coincided with non-synonymous substitutions as a potential direct target for natural selection was observed in scaffold 792 in a homolog of coiled-coil protein 97, which is part of the U2 unit of the spliceosome (Table 1). Here, two non-synonymous SNPs nearly reached fixation in Texel oysters, suggesting that certain spliceosome variants characterize the invasion into the Southern Wadden Sea. Splicing heterogeneity can generate a tremendous amount of variation of mRNA molecules but only little is known about the functional significance of this variation (Wan and Larson, 2018). Alternative splicing has also been observed in several oyster genes and was related to artificial selection for increased growth rate (Zhang et al., 2019). Furthermore, differential expression of tumor necrosis factor receptor-associated factor 3 isoforms was proposed as a potential response to bacterial and viral infection in oysters (Huang et al., 2014). Here, we also observed differential expression of tumor necrosis factor genes (Supplementary Table 1). And while we cannot identify different splice variants from our data, the differential expression of these genes here and in previous studies performing experimental immune challenges (Huang et al., 2014), might link alternative splicing to immunity. A classic example for this link comes from insect DSCAM genes, where alternative splicing generates hypervariable immunoglobulins responsible for the specificity of the innate immune response (Watson et al., 2005), suggesting that alternative splicing might generate adaptive variation in immune genes. In general, transcriptional flexibility induced by alternative splicing is another way to increase phenotypic variability. If different gene isoforms leading to particular phenotypic variants are based on genetic variation in the spliceosome, selection could optimize phenotypes by fixing alleles of spliceosome genes. Together with the up-regulation of the Zinc-finger protein homolog g19234 mapping to GO:0048026 “positive regulation of mRNA splicing, via spliceosome” in Texel oysters, these results suggest that the induction of alternative splicing might also be adaptive on different time scales ranging from an immediate stress response to long-term adaptation.
In conclusion, we could show that next to the specific selection and induction of immune recognition genes, selection primarily targeted processes that generate variability. The finding that this can actually affect different processes generating genetic variability via increased transposition or phenotypic variation by alternative splicing highlights the obvious need for invasive species to restore and generate variability during several stages of the invasion to be successful in novel environments. The immediate reaction after translocation by differentially regulating transposon activity and splicing frequency between the two populations representing the independent invasion sources could potentially be linked to adaptive genetic variation of outlier loci affecting the same or similar functions. However, as we have only used the two populations previously used in a translocation experiment (Lokmer et al., 2016) to establish the formal link between genomic and transcriptomic differentiation in the same individuals, and only genotyped a limited subset of individuals used for transcriptomics by ddRAD sequencing, care has to be taken in taking this link too literally. First of all, our comparatively small sample size for ddRAD sequencing might bias our allele frequency estimates and limit the power of detecting selected variation. Furthermore, differentiation of outlier loci cannot be traced back to the actual invasion event, meaning that the signatures of selection observed here, could be a result of broodstock selection or other evolutionary forces prior to the invasion. Therefore invasion history could potentially confound selection acting during the invasion, and multiple populations from several invasions should be tested before these results can be generalized. Nevertheless, the immediate reaction to translocation in the transcriptomes suggests that these processes might be functionally linked across timescales, and could also be implicated in invasion success.
Data Availability Statement
The datasets presented in this study can be found in online repositories. The names of the repository/repositories and accession number(s) can be found below: ArrayExpress (accession: E-MTAB-9186) and European Nucleotide Archive (accession: PRJEB38477).
Author Contributions
KW conceived the study, analyzed the data, and wrote the manuscript. AL set up the experiment, collected samples, and analyzed transcriptomic data. UJ sequenced the samples and analyzed data. All authors edited and finalized the manuscript.
Funding
This study was financed by an DFG Emmy Noether grant given to KW (WE4641/1-3). AL was partly funded by the EU Horizon 2020 grant VIVALDI.
Conflict of Interest
The authors declare that the research was conducted in the absence of any commercial or financial relationships that could be construed as a potential conflict of interest.
Acknowledgments
We would like to thank David Thieltges and Anouk Goedknegt for help with the collection of oysters on Texel, Laura Burbaum for help with dissections, Nancy Kühne for instructing and helping with the molecular lab work and Jennifer Hülskötter for the supporting the ddRAD analyses.
Supplementary Material
The Supplementary Material for this article can be found online at: https://www.frontiersin.org/articles/10.3389/fevo.2020.567049/full#supplementary-material
Supplementary Table 1 | List of significant differentially expressed genes (DEG).
References
Alexa, A., and Rahnenfuhrer, J. (2010). topGO: Enrichment Analysis for Gene Ontology. R Package Version 2.20.0 Version 2.20.0.
Bernardi, G., Azzurro, E., Golani, D., and Miller, M. R. (2016). Genomic signatures of rapid adaptive evolution in the bluespotted cornetfish, a Mediterranean Lessepsian invader. Mol. Ecol. 25, 3384–3396. doi: 10.1111/mec.13682
Bolger, A. M., Lohse, M., and Usadel, B. (2014). Trimmomatic: a flexible trimmer for Illumina sequence data. Bioinformatics 30, 2114–2120. doi: 10.1093/bioinformatics/btu170
Bourne, S. D., Hudson, J., Holman, L. E., and Rius, M. (2018). “Marine invasion genomics: revealing ecological and evolutionary consequences of biological invasions,” in Population Genomics: Marine Organisms, eds M. Oleksiak and O. Rajora, (Cham: Springer), 363–398.
Bruins, R. W. B. (1983). Crassostrea gigas (Thunberg, 1793) op Texel. Corresp. Ned. Mal. Ver. 215, 1436–1438.
Catchen, J., Hohenlohe, P. A., Bassham, S., Amores, A., and Cresko, W. A. (2013). Stacks: an analysis tool set for population genomics. Mol. Ecol. 22, 3124–3140. doi: 10.1111/mec.12354
Colautti, R. I., and Barrett, S. C. (2013). Rapid adaptation to climate facilitates range expansion of an invasive plant. Science 342, 364–366. doi: 10.1126/science.1242121
Colautti, R. I., and Lau, J. A. (2015). Contemporary evolution during invasion: evidence for differentiation, natural selection, and local adaptation. Mol. Ecol. 24, 1999–2017. doi: 10.1111/mec.13162
Cornet, S., Brouat, C., Diagne, C., and Charbonnel, N. (2016). Eco-immunology and bioinvasion: revisiting the evolution of increased competitive ability hypotheses. Evol. App. 9, 952–962. doi: 10.1111/eva.12406
Cummins, S. F., Nichols, A. E., Amare, A., Hummon, A. B., Sweedler, J. V., and Nagle, G. T. (2004). Characterization of Aplysia enticin and temptin, two novel water-borne protein pheromones that act in concert with attractin to stimulate mate attraction. J. Biol. Chem. 279, 25614–25622. doi: 10.1074/jbc.M313585200
Curnutt, J. L. (2000). Host-area speci§c climatic-matching: similarity breeds exotics. Biol. Conserv. 94, 341–351.
Destoumieux-Garzon, D., Canesi, L., Ovanedel, D., Travers, M. A., Charriere, G. M., Pruzzo, C., et al. (2020). Vibrio-bivalve interactions in health and disease. Environ. Microbiol. doi: 10.1111/1462-2920.15055
Dlugosch, K. M., and Parker, I. M. (2008). Founding events in species invasions: genetic variation, adaptive evolution, and the role of multiple introductions. Mol. Ecol. 17, 431–449. doi: 10.1111/j.1365-294X.2007.03538.x
Dobin, A., Davis, C. A., Schlesinger, F., Drenkow, J., Zaleski, C., Jha, S., et al. (2013). STAR: ultrafast universal RNA-seq aligner. Bioinformatics 29, 15–21. doi: 10.1093/bioinformatics/bts635
FAO, (2014). The State of World Fisheries and Aquaculture - Opportunities and Challenges. Rome: FAO.
Feis, M. E., Goedknegt, M. A., Thieltges, D. W., Buschbaum, C., and Wegner, K. M. (2016). Biological invasions and host-parasite coevolution: different coevolutionary trajectories along separate parasite invasion fronts. Zoology 119, 366–374. doi: 10.1016/j.zool.2016.05.012
Feis, M. E., John, U., Lokmer, A., Luttikhuizen, P. C., and Wegner, K. M. (2018). Dual transcriptomics reveals co-evolutionary mechanisms of intestinal parasite infections in blue mussels Mytilus edulis. Mol. Ecol. 27, 1505–1519. doi: 10.1111/mec.14541
Forsström, T., Ahmad, F., and Vasemägi, A. (2017). Invasion genomics: genotyping-by-sequencing approach reveals regional genetic structure and signatures of temporal selection in an introduced mud crab. Mar. Biol. 164:186. doi: 10.1007/s00227-017-3210-1
Goedknegt, M. A., Feis, M. E., Wegner, K. M., Luttikhuizen, P. C., Buschbaum, C., Camphuysen, K., et al. (2016). Parasites and marine invasions: ecological and evolutionary perspectives. J. Sea Res. 113, 11–27. doi: 10.1016/j.seares.2015.12.003
Goubert, C., Henri, H., Minard, G., Valiente Moro, C., Mavingui, P., Vieira, C., et al. (2017). High-throughput sequencing of transposable element insertions suggests adaptive evolution of the invasive Asian tiger mosquito towards temperate environments. Mol. Ecol. 26, 3968–3981. doi: 10.1111/mec.14184
Guggisberg, A., Lai, Z., Huang, J., and Rieseberg, L. H. (2013). Transcriptome divergence between introduced and native populations of Canada thistle, Cirsium arvense. New Phytol. 199, 595–608. doi: 10.1111/nph.12258
Hoff, K. J., and Stanke, M. (2019). Predicting genes in single genomes with Augustus. Curr. Protoc. Bioinformatics 65:e57. doi: 10.1002/cpbi.57
Huang, B., Zhang, L., Du, Y., Li, L., Qu, T., Meng, J., et al. (2014). Alternative splicing and immune response of Crassostrea gigas tumor necrosis factor receptor-associated factor 3. Mol. Biol. Rep. 41, 6481–6491. doi: 10.1007/s11033-014-3531-9
Huang, M., Song, X., Zhao, J., Mu, C., Wang, L., Zhang, H., et al. (2013). A C-type lectin (AiCTL-3) from bay scallop Argopecten irradians with mannose/galactose binding ability to bind various bacteria. Gene 531, 31–38. doi: 10.1016/j.gene.2013.08.042
Hulme, P. E. (2009). Trade, transport and trouble: managing invasive species pathways in an era of globalization. J. Appl. Ecol. 46, 10–18. doi: 10.1111/j.1365-2664.2008.01600.x
Jones, P., Binns, D., Chang, H. Y., Fraser, M., Li, W., McAnulla, C., et al. (2014). InterProScan 5: genome-scale protein function classification. Bioinformatics 30, 1236–1240. doi: 10.1093/bioinformatics/btu031
Kelehear, C., Brown, G. P., and Shine, R. (2012). Rapid evolution of parasite life history traits on an expanding range-edge. Ecol. Lett. 15, 329–337. doi: 10.1111/j.1461-0248.2012.01742.x
Knop, E., and Reusser, N. (2012). Jack-of-all-trades: phenotypic plasticity facilitates the invasion of an alien slug species. Proc. Biol. Sci. 279, 4668–4676. doi: 10.1098/rspb.2012.1564
Kopylova, E., Noe, L., and Touzet, H. (2012). SortMeRNA: fast and accurate filtering of ribosomal RNAs in metatranscriptomic data. Bioinformatics 28, 3211–3217. doi: 10.1093/bioinformatics/bts611
Lallias, D., Boudry, P., Batista, F. M., Beaumont, A., King, J. W., Turner, J. R., et al. (2015). Invasion genetics of the Pacific oyster Crassostrea gigas in the British Isles inferred from microsatellite and mitochondrial markers. Biol. Invas. 17, 2581–2595. doi: 10.1007/s10530-015-0896-1
Lancaster, L. T., Dudaniec, R. Y., Chauhan, P., Wellenreuther, M., Svensson, E. I., and Hansson, B. (2016). Gene expression under thermal stress varies across a geographical range expansion front. Mol. Ecol. 25, 1141–1156. doi: 10.1111/mec.13548
Lawrence, M., Huber, W., Pages, H., Aboyoun, P., Carlson, M., Gentleman, R., et al. (2013). Software for computing and annotating genomic ranges. PLoS Comput. Biol. 9:e1003118. doi: 10.1371/journal.pcbi.1003118
Li, H., Zhang, H., Jiang, S., Wang, W., Xin, L., Wang, H., et al. (2015). A single-CRD C-type lectin from oyster Crassostrea gigas mediates immune recognition and pathogen elimination with a potential role in the activation of complement system. Fish Shellfish Immunol. 44, 566–575. doi: 10.1016/j.fsi.2015.03.011
Lin, Y., Chen, Y., Yi, C., Fong, J. J., Kim, W., Rius, M., et al. (2017). Genetic signatures of natural selection in a model invasive ascidian. Sci. Rep. 7:44080. doi: 10.1038/srep44080
Lokmer, A., Kuenzel, S., Baines, J., and Wegner, K. M. (2016). The role of tissue-specific microbiota in initial establishment success of pacific oysters. Environ. Microbiol. 18, 970–987. doi: 10.1111/1462-2920.13163
Love, M. I., Huber, W., and Anders, S. (2014). Moderated estimation of fold change and dispersion for RNA-seq data with DESeq2. Genome Biol. 15:550. doi: 10.1186/s13059-014-0550-8
Metivier, S. L., Kim, J. H., and Addison, J. A. (2017). Genotype by sequencing identifies natural selection as a driver of intraspecific divergence in Atlantic populations of the high dispersal marine invertebrate. Macoma petalum. Ecol. Evol. 7, 8058–8072. doi: 10.1002/ece3.3332
Moehler, J., Wegner, K. M., Reise, K., and Jacobsen, S. (2011). Invasion genetics of Pacific oysterCrassostrea gigasshaped by aquaculture stocking practices. J. Sea Res. 66, 256–262. doi: 10.1016/j.seares.2011.08.004
Molnar, J. L., Gamboa, R. L., Revenga, C., and Spalding, M. D. (2008). Assessing the global threat of invasive species to marine biodiversity. Front. Ecol. Environ. 6:485–492. doi: 10.1890/070064
Moran, E. V., and Alexander, J. M. (2014). Evolutionary responses to global change: lessons from invasive species. Ecol. Lett. 17, 637–649. doi: 10.1111/ele.12262
Parente, T. E., Moreira, D. A., Magalhaes, M. G. P., de Andrade, P. C. C., Furtado, C., Haas, B. J., et al. (2017). The liver transcriptome of suckermouth armoured catfish (Pterygoplichthys anisitsi, Loricariidae): identification of expansions in defensome gene families. Mar. Pollut. Bull. 115, 352–361. doi: 10.1016/j.marpolbul.2016.12.012
Peterson, B. K., Weber, J. N., Kay, E. H., Fisher, H. S., and Hoekstra, H. E. (2012). Double Digest RADseq: an inexpensive method for de novo SNP discovery and genotyping in model and non-model species. PLoS One 7:e0037135. doi: 10.1371/journal.pone.0037135
Reise, K., Buschbaum, C., Büttger, H., Rick, J., and Wegner, K. M. (2017). Invasion trajectory of Pacific oysters in the northern Wadden Sea. Mar. Biol. 164:68. doi: 10.1007/s00227-017-3104-2
Richards, C. L., Bossdorf, O., Muth, N. Z., Gurevitch, J., and Pigliucci, M. (2006). Jack of all trades, master of some? On the role of phenotypic plasticity in plant invasions. Ecol. Lett. 9, 981–993. doi: 10.1111/j.1461-0248.2006.00950.x
Rohfritsch, A., Bierne, N., Boudry, P., Heurtebise, S., Cornette, F., and Lapegue, S. (2013). Population genomics shed light on the demographic and adaptive histories of European invasion in the Pacific oyster, Crassostrea gigas. Evol. Appl. 6, 1064–1078. doi: 10.1111/eva.12086
Romero, A., Aranguren, R., Moreira, R., Novoa, B., and Figueras, A. (2019). Integrated transcriptomic and functional immunological approach for assessing the invasiveness of bivalve alien species. Sci. Rep. 9:19879. doi: 10.1038/s41598-019-56421-y
Ruesink, J. L., Lenihan, H. S., Trimble, A. C., Heiman, K. W., Micheli, F., Byers, J. E., et al. (2005). Introduction of non-native oysters: ecosystem effects and restoration implications. Annu. Rev. Ecol. Evol. Syst. 36, 643–689.
Schrader, L., and Schmitz, J. (2019). The impact of transposable elements in adaptive evolution. Mol. Ecol. 28, 1537–1549. doi: 10.1111/mec.14794
Schweyen, H., Rozenberg, A., and Leese, F. (2014). Detection and removal of PCR duplicates in population genomic ddRAD studies by addition of a degenerate base region (DBR) in sequencing adapters. Biol. Bull. 227, 146–160. doi: 10.1086/BBLv227n2p146
Seebens, H., Gastner, M. T., and Blasius, B. (2013). The risk of marine bioinvasion caused by global shipping. Ecol. Lett. 16, 782–790. doi: 10.1111/ele.12111
Shama, L. N. S., Mark, F. C., Strobel, A., Lokmer, A., John, U., and Wegner, K. M. (2016). Transgenerational effects persist down the maternal line in marine sticklebacks: gene expression matches physiology in a warming ocean. Evol. Appl. 9, 1096–1111. doi: 10.1111/eva.12370
Simpson, B. W., and Trent, M. S. (2019). Pushing the envelope: LPS modifications and their consequences. Nat. Rev. Microbiol. 17, 403–416. doi: 10.1038/s41579-019-0201-x
Stanke, M., Schoffmann, O., Morgenstern, B., and Waack, S. (2006). Gene prediction in eukaryotes with a generalized hidden Markov model that uses hints from external sources. BMC Bioinformatics 7:62. doi: 10.1186/1471-2105-7-62
Stapley, J., Santure, A. W., and Dennis, S. R. (2015). Transposable elements as agents of rapid adaptation may explain the genetic paradox of invasive species. Mol. Ecol. 24, 2241–2252. doi: 10.1111/mec.13089
Troost, K. (2010). Causes and effects of a highly successful marine invasion: case-study of the introduced Pacific oyster Crassostrea gigas in continental NW European estuaries. J. Sea Res. 64, 145–165. doi: 10.1016/j.seares.2010.02.004
Vogel, H., Schmidtberg, H., and Vilcinskas, A. (2017). Comparative transcriptomics in three ladybird species supports a role for immunity in invasion biology. Dev. Comp. Immunol. 67, 452–456. doi: 10.1016/j.dci.2016.09.015
Wan, Y., and Larson, D. R. (2018). Splicing heterogeneity: separating signal from noise. Genome Biol. 19:86. doi: 10.1186/s13059-018-1467-4
Watson, F. L., Puttmann-Holgado, R., Thomas, F., Lamar, D. L., Hughes, M., Kondo, M., et al. (2005). Extensive diversity of Ig-superfamily proteins in the immune system of insects. Science 309, 1874–1878. doi: 10.1126/science.1116887
Weclawski, U., Heitlinger, E. G., Baust, T., Klar, B., Petney, T., Han, Y. S., et al. (2013). Evolutionary divergence of the swim bladder nematode Anguillicola crassus after colonization of a novel host, Anguilla anguilla. BMC Evol. Biol. 13:11. doi: 10.1186/1471-2148-13-78
Wegner, K. M., Piel, D., Bruto, M., John, U., Mao, Z., Alunno-Bruscia, M., et al. (2019). Molecular targets for coevolutionary interactions between pacific oyster larvae and their sympatric vibrios. Front. Microbiol. 10:2067. doi: 10.3389/fmicb.2019.02067
Weiss, M., Weigand, H., Weigand, A. M., and Leese, F. (2018). Genome-wide single-nucleotide polymorphism data reveal cryptic species within cryptic freshwater snail species-The case of the Ancylus fluviatilis species complex. Ecol. Evol. 8, 1063–1072. doi: 10.1002/ece3.3706
Wellband, K. W., and Heath, D. D. (2017). Plasticity in gene transcription explains the differential performance of two invasive fish species. Evol. Appl. 10, 563–576. doi: 10.1111/eva.12463
Wendling, C. C., Fabritzek, A. G., and Wegner, M. K. (2016). Population specific genotype x genotype x environment interactions in bacterial disease of early life stages of Pacific oyster larvae. Evol. Appl. 10, 338–347. doi: 10.1111/eva.12452
Wendling, C. C., and Wegner, K. M. (2015). Adaptation to enemy shifts: rapid resistance evolution to local Vibrio spp. in invasive Pacific oysters. Proc. R. Soc. B Biol. Sci. 282:e20142244. doi: 10.1098/rspb.2014.2244
Whitlock, M. C., and Lotterhos, K. E. (2015). Reliable detection of loci responsible for local adaptation: inference of a null model through trimming the distribution of F(ST). Am. Nat. 186(Suppl. 1), S24–S36. doi: 10.1086/682949
Willing, E. M., Dreyer, C., and van Oosterhout, C. (2012). Estimates of genetic differentiation measured by F-ST do not necessarily require large sample sizes when using many snp markers. PLoS One 7:e0042649. doi: 10.1371/journal.pone.0042649
Xiao, Y., Hsiao, T. H., Suresh, U., Chen, H. I., Wu, X., Wolf, S. E., et al. (2014). A novel significance score for gene selection and ranking. Bioinformatics 30, 801–807. doi: 10.1093/bioinformatics/btr671
Keywords: biological invasion, genomics, genetic differentiation, FST outlier, adaptation, gene expression
Citation: Wegner KM, Lokmer A and John U (2020) Genomic and Transcriptomic Differentiation of Independent Invasions of the Pacific Oyster Crassostrea gigas. Front. Ecol. Evol. 8:567049. doi: 10.3389/fevo.2020.567049
Received: 29 May 2020; Accepted: 01 October 2020;
Published: 26 October 2020.
Edited by:
Bernd Hänfling, University of Hull, United KingdomReviewed by:
Pierre Boudry, Institut Français de Recherche pour l’Exploitation de la mer (IFREMER), FranceZdenka Krenova, Global Change Research Institute, Czech Academy of Sciences, Czechia
Copyright © 2020 Wegner, Lokmer and John. This is an open-access article distributed under the terms of the Creative Commons Attribution License (CC BY). The use, distribution or reproduction in other forums is permitted, provided the original author(s) and the copyright owner(s) are credited and that the original publication in this journal is cited, in accordance with accepted academic practice. No use, distribution or reproduction is permitted which does not comply with these terms.
*Correspondence: K. Mathias Wegner, bWF0aGlhcy53ZWduZXJAYXdpLmRl