 Diana Pita
 Esteban Fernández-Juricic
- Department of Biological Sciences, Purdue University, West Lafayette, IN, United States
Many fish form schools and maintain visual contact with their neighbors in a three-dimensional environment. In this study, we assessed whether zebrafish modified their spacing and interaction time in an additive or multiplicative way relative to multiple sources of social information using computer animations. We simultaneously manipulated: (a) the size of the virtual conspecific (as a proxy of social cue magnitude), (b) the position of the virtual conspecific in the water column (as a proxy of the level of perceived risk), and (c) the absence/presence of the visual horizon (as a proxy of depth perception). We found that the size of the virtual conspecific independently affected spacing behavior (zebrafish increased their separation distance as conspecific size increased). However, some of these factors interacted significantly, such that their effects on social behavior depended on each other. For instance, zebrafish increased their separation distance under high risk conditions when the virtual conspecific was larger, but this risk effect disappeared when the conspecific was the same size or smaller, likely to avoid aggression. Also, zebrafish increased their separation distance when depth perception was enhanced under low risk conditions, but the effect of depth perception disappeared under high risk conditions. Overall, we found that certain dimensions of the visual social environment affected zebrafish spacing behavior in different ways, but they did not affect social interaction time. We discuss the implications of these findings for the spatial organization of fish schools.
Introduction
Models of social behavior have long considered the spatial range over which a group is dispersed (Krause and Ruxton, 2002). This spatial range can affect the degree of separation between group mates (i.e., neighbor separation distance) and ultimately the transmission of social information within the group (Proctor et al., 2001, 2003) as animals use social cues to regulate their social interactions (Pritchard et al., 2001; Fernández-Juricic and Kacelnik, 2004; Abaid et al., 2012). Empirical studies have shown that longer neighbor distances constrain the flow of social information (Fernández-Juricic and Kacelnik, 2004; Fernández-Juricic and Kowalski, 2011; Pays et al., 2013) and modify the visual monitoring strategies of group members (Pays et al., 2009; Fernández-Juricic et al., 2011). The ability of an animal to acquire and evaluate the quality of social information available over distance could affect its decisions regarding its own position within the group to maintain social cohesion (Sumpter, 2010).
An important factor that can limit the transmission of social information is the perceptual ability of the receiver (Strandburg-Peshkin et al., 2013; Pita et al., 2016; Lavergne et al., 2019). In the case of visual information, visual acuity (i.e., ability to resolve two objects as separate entities) limits the spatial range over which an animal can resolve the details of an image, which can ultimately constrain its ability to interact with other group members (Pita et al., 2016). Group members experiencing such information constraints are expected to change their behavior to maintain the resolution of social information (Kimbell and Morrell, 2015). For instance, when social information becomes more difficult to gather, individuals can shorten their neighbor distances (Dawkins and Woodington, 1997), lengthen the duration of their interactions with group mates (Fernández-Juricic and Kacelnik, 2004; Fernández-Juricic et al., 2007), or use regions of the visual field with high visual acuity (i.e., centers of acute vision) (Butler et al., 2014) to gather social information.
The availability of computer animations and robotic stimuli have allowed experimenters to manipulate social cues to assess their role in tuning social behavior (Gerlai, 2017; Bierbach et al., 2018; Kim et al., 2018). Several studies have manipulated single social cues at a time (Butail et al., 2013; Bartolini et al., 2016); however, we know less about the effects of simultaneous manipulations of multiple social cues, and more specifically, how simultaneous manipulations affect the individual’s ability to gather social information and respond to variations in its visual social environment (Larsch and Baier, 2018; Lemasson et al., 2018). This is particularly relevant because understanding how animals respond to variations in the social environment can allow us to identify the rules underlying social interactions (Ord et al., 2007; Peters et al., 2007; Herbert-Read, 2016). For instance, two different visual social cues (e.g., color and size) can act in an additive (i.e., the combined effect of color and size is equal to the sum of each effect taken individually) or multiplicative (i.e., the effect of color cues depends on the size cues) way. Furthermore, we can explore how these rules may be affected by environmental change, leading to the disruption of social interactions and changes in the spatial arrangement of groups. For example, increased water turbidity can reduce the transmission of visual information between fish, resulting in fewer social interactions and smaller group sizes (Chamberlain and Ioannou, 2019).
In this study, we assessed how zebrafish modified their social spacing behavior (i.e., distance between conspecifics while interacting) and social interaction time (i.e., time spent interacting with conspecifics) relative to three types of simultaneous changes in the visual social environment: (a) the size of the conspecific (as a proxy of the magnitude of the social cues), (b) the position of the conspecific in the water column (as a proxy of the levels of risk in the environment), and (c) the absence/presence of the visual horizon (as a proxy of depth perception). A detailed account of our predictions relative to interaction spacing and time is presented below. Additionally, we assessed whether the zebrafish would visually track our manipulations of the visual social environment. More specifically, we estimated the probability of zebrafish using their high vs. low acuity vision in the different social manipulations based on previous accounts of the position of different retinal landmarks (Pita et al., 2015). We had not developed specific hypotheses and predictions for the probability of using high vs. low acuity vision, so we considered this a post hoc analysis.
We used zebrafish as our model species because they are highly social animals that depend on visual information during social interactions (Miklosi and Andrew, 2006; Saverino and Gerlai, 2008). We manipulated the visual social environment using computer animations following (Ingley et al., 2015; Balzarini et al., 2017). We only considered interactions with a single conspecific as a first attempt to identify some of the simplest rules underlying pairwise social interactions. Future studies should consider how these rules scale up in larger groups (Lemasson et al., 2018).
Hypotheses and Predictions
We first present predictions for single effects and then for their interactions.
An individual’s ability to resolve social cues from a group mate (e.g., variations in coloration, body patterns, etc.) decreases with distance (Fernández-Juricic and Kowalski, 2011). To simulate changes in the magnitude of the social cues, we manipulated the size of the virtual conspecific. Zebrafish appear to use the diameter of the eye and the width of body stripes as social cues (Guthrie and Muntz, 1993; Bone and Moore, 2008), which scale directly with body size and may serve as a cue of perceived neighbor distance. We predicted that as the size of the conspecific decreased, individuals would move closer to the conspecific to enhance their ability to resolve the conspecific (Pita et al., 2015) and/or increase the amount of time spent interacting with the conspecific (Fernández-Juricic et al., 2004, 2007).
In zebrafish, the vertical position of the fish in the water column varies with the level of risk (Bishop et al., 2016; Oliveira et al., 2017). Zebrafish located at the bottom of the water column (i.e., low vertical spatial position) are associated with higher risk environments (e.g., predator presence) (Kalueff et al., 2013; Oliveira et al., 2017). We therefore predicted that when the conspecific was at the bottom of the water column, individuals would move closer to the conspecific and/or increase the duration of their interaction to obtain more information about a potential threat (Pham et al., 2012).
When animals assess the size of an object, they consider the visual angle or angular size (i.e., amount of space that the object takes up on the retina) (Douglas, 1996; Sperandio and Chouinard, 2015). However, distance can complicate this assessment, as objects that are far away have a reduced visual angle and consequently appear smaller than their actual size. To compensate for this, animals have evolved various mechanisms to improve depth perception (Howard, 2012; Nityananda and Read, 2017), ultimately allowing them to establish size constancy (i.e., ability to perceive the relative size of an object independent of its angular size) (Douglas et al., 1988; Zeil, 2000; Frech et al., 2012). One of the cues that facilitates depth perception is the presence of a visual horizon, which serves as a salient referential cue that can offer information about object orientation and distance (Layne et al., 1997; Caballero et al., 2015). In their natural habitats, zebrafish have a visual horizon defined by a variety of environmental substrates (Zimmermann et al., 2018). We manipulated the presence/absence of a virtual visual horizon in our animations. We predicted that when the horizon was absent, individuals would move closer to the conspecific and/or increase the duration of the social interaction due to the lack of referential information and the need to better assess its relative size and location, compared to a situation in which the horizon was present.
One of the novel components of our study is the simultaneous manipulation of different factors to assess potential interaction effects. The conceptual frameworks we used allowed us to generate predictions for two-way interactions between pairs of the three factors considered (see also statistical analyses). First, we predicted a significant interaction between the size of the conspecific and the position of the conspecific in the water column, whereby individuals would increase their separation distance and reduce social interaction time particularly when exposed to a small conspecific at the bottom of the water column. Other studies have found that the preference for interacting with size-matched conspecifics is enhanced in high risk environments (Krause and Godin, 1994). We hypothesized that individuals may experience higher risk when joining a group composed of smaller conspecifics in a high-risk scenario because their larger size would make them more conspicuous to potential predators (Krause and Ruxton, 2002; Croft et al., 2006; Rodgers et al., 2015).
Second, we predicted a significant interaction effect between the size of the conspecific and the absence/presence of the visual horizon. When the horizon was absent, zebrafish would likely perceive conspecifics according to their absolute size due to the lack of referential information, leading to large and small conspecifics appearing as smaller or larger, respectively, than size-matched (i.e., intermediate) conspecifics. In these scenarios (small/large conspecifics with the horizon absent), we predicted zebrafish would increase their separation distance and reduce their interaction time to minimize the costs of interacting with differently sized group mates (Nakayama et al., 2009). For example, body size correlates with dominance in teleost fish and individuals of larger body size are more likely to win fighting contests (Arnott and Elwood, 2009), while individuals of smaller body size are more likely to pay a cost for fighting (Hoare et al., 2000). On the other hand, when the horizon was present, we predicted individuals would perceive conspecifics according to their relative size (i.e., a small conspecific would be perceived to be far away compared to a large conspecific) because of the enhanced ability to perceive depth.
Third, we predicted an interaction between the position of the conspecific in the water column and the absence/presence of the visual horizon, whereby individuals would move closer to the conspecific and increase their interaction time particularly when the conspecific is at the bottom of the water column and the horizon is present. We hypothesized that the closer the conspecific is to the horizon, the more pronounced the enhanced depth perception benefits would be, and consequently the perception of a high-risk environment.
Materials and Methods
We used 10 adult zebrafish (5 male and 5 female zebrafish, wild-type AB genetic strain) acquired from The Zebrafish International Resource Center (ZIRC, Eugene, OR, United States). Our effect sizes and sample size per combination of factors (10 individuals) was similar to previous studies in zebrafish that manipulated some of the factors we studied (Abaid et al., 2012; Bartolini et al., 2016; Macrì et al., 2017; Ruberto et al., 2017). Before the experiment, zebrafish were housed together in a 12-gallon glass stock tank (51.4 cm L × 26.7 cm W × 32.1 cm H) maintained with a recirculating water filter (Aqueon Power Filter®) and exposed to a 16-h light: 8-h dark cycle. Water quality checks were preformed daily (pH, temperature) and weekly (ammonia, nitrates, nitrites, chlorine) to ensure appropriate housing conditions. We fed zebrafish daily with commercial fish flakes (Tetramin® Tropical Flakes).
Before the initiation of the experiment, zebrafish were transferred from their stock tank into individual 2.5-gallon tanks (30.5 cm L × 15.2 cm W × 20.3 cm H) with air stones to provide aeration. To reduce stress behaviors associated with exposure to a novel tank environment, each zebrafish was tested within its individual 2.5-gallon home tank. During treatment exposure, the home tank was placed directly against the screen of a computer monitor (Acer LCD monitor, model v176L) displaying the animated treatment video (Supplementary Figure 1). The computer monitor had a resolution of 1280 × 1024 pixels and a refresh rate of 75 Hz. We determined this to be appropriate for simulating smooth continuous movement in the eyes of the zebrafish as, the known range of critical flicker fusion frequencies in fish ranges from 14 to 67 Hz (Lythgoe, 1979).
Video animations have been used considerably in animal behavior (Rosenthal, 2002; Peters and Evans, 2007; Woo and Rieucau, 2008; Chouinard-Thuly et al., 2017). We followed (Ingley et al., 2015; Balzarini et al., 2017) by manipulating visual social cues using computer animations. We considered this technique to be an appropriate method because zebrafish have already been shown to be responsive to computer animations (Saverino and Gerlai, 2008; Stowers et al., 2017), reacting to animated conspecifics in the same way they do to live conspecifics (Qin et al., 2014; Gerlai, 2017). We utilized tank dimensions that fell within the dimensions used in previous studies testing zebrafish’s response to animations [i.e., 50 × 25 × 30 cm (Qin et al., 2014) and 51 × 30 × 25 cm (Saverino and Gerlai, 2008)]. Therefore, we did not find it necessary to perform a validation study of our experimental setup.
We generated animations using the open source software1 anyfish, which allows the user to create realistic animated fish stimuli (Ingley et al., 2015). We used a photograph of an adult female wild-type zebrafish as a model for our animated stimulus. A female zebrafish was utilized because other studies have shown that males are less likely to engage in interactions with other males, but females are preferred by both sexes (Ruhl and McRobert, 2005). Following previous studies using computer animated zebrafish, we used one photographic image of a zebrafish, which remained constant across treatments (Saverino and Gerlai, 2008; Gerlai et al., 2009; Qin et al., 2014). By modifying the positions of the animated stimulus with user-defined key frames, we designed the virtual conspecific to swim back and forth, horizontally across the screen. We also had the animated conspecific rotate horizontally 180 degrees when it reached the edge of the screen to change direction. During this brief period of rotation, the cranial aspect of the conspecific was visible, with the conspecific appearing to face the tank of the live fish. We did not employ subtle behaviors (e.g., opercular movements) in our animations. However, we considered this appropriate as evidence indicates an equivalent shoaling responses exists when presenting animated conspecifics moving back and forth compared to video recordings of live zebrafish (Qin et al., 2014). The individual frames were then combined to generate a 60 frame per second video to simulate a conspecific swimming at approximately 5 cm per second which is the approximate speed maintained by zebrafish when schooling (Miller and Gerlai, 2012). The flicker rate of the animation was designed to simulate smooth continuous movement in the eyes of the zebrafish as the critical flicker fusion frequency of many fish are thought to be within the range of 14–67 Hz (Lythgoe, 1979).
We positioned top- and side-view cameras (JVC Everio GZ-MG330-HU camcorder) to record the behavior of the zebrafish throughout the trial (Supplementary Figure 1). We temporally synchronized both camera views with a portable DVR (Night Owl, H264-4 channel DVR) with multiplexer, which brought together the different video inputs and allowed us to calibrate the position of the zebrafish and computer monitor in both the top and side camera views. We spatially synchronized both camera views by standardizing the dimension of the tank using a premeasured scale (length of the tank) in the top and side camera views with ImageJ.2 The synchronization of the cameras allowed us to determine the three-dimensional position of the live zebrafish. The 15.24 cm sides and the 30.48 cm bottom of the tank were covered with opaque white tape and the experimental arena, consisting of a table that supported the tank and computer monitor were surrounded by opaque white curtains to reduce visual distractions during trials. Before each trial, there was a 10-min acclimation period followed by the 3-min treatment video that provided 1 min of continuous conspecific exposure. The first min of the treatment video displayed only the virtual environment followed by 1 min of the conspecific swimming within in the virtual environment, while the last minute displayed again the virtual environment without the conspecific. Light levels at the surface of the water (mean ± SE; 1072 ± 1.35 lux) and temperature levels (mean ± SE; 74 ± 0.07°F) remained constant throughout the experiment.
We exposed each zebrafish (4.5 ± 0.15 cm body length; mean ± SE) to a total of 12 treatments, represented by the combination of three categorical independent variables: size of the conspecific (three levels: large, intermediate, small), the position of the conspecific in the water column (two levels: top and bottom), and the absence/presence of a visual horizon (two levels: absent and present). Each zebrafish was exposed to one treatment per day, allowing for approximately 24 h between each successive trial over the course of 12 days. Additionally, we randomized both the testing order of the zebrafish each day and the order of each zebrafish’s treatment exposure.
Videos were coded manually and blind by an individual unaware of the experimental question or design. First, we used the program idTracker3 to divide each video into frames (30 frames per second). Following this procedure, we used ImageJ (see text footnote 2) to measure the visual separation distance between the eye of the live zebrafish and the midpoint of the body of the animated conspecific. We chose to manually code the videos (Delcourt and Poncin, 2012) because other fully automated tracking programs tend to only measure the distance between the center of the live fish and the computer screen, but we intended our measurements to be more sensory specific, as the distance over which visual information is acquired (distance between the eye of the zebrafish and virtual conspecific). An example of the movement trajectories we generated is in the Supplementary Figure 2. By using three-dimensional measurements obtained from manual coding, we were able to calculate the position of the conspecific within the zebrafish’s visual field following (Pita et al., 2015) to determine if the conspecific was aligned with high (i.e., center of acute vision) or low (i.e., retinal periphery) acuity retinal regions. High acuity retinal regions are expected to provide finer scale spatial information compared to low acuity retinal regions (Pettigrew et al., 1988). In the case of zebrafish, a previous study found that each eye has one center of acute vision (enlargement of the retinal tissue due to the higher density of cone photoreceptors/reginal ganglion cells or area) that projects fronto-dorsally surrounded by low acuity regions (periphery of the retina) (Pita et al., 2015).
Measurements were taken during defined interaction periods. The beginning of an interaction period represented any approach made by the zebrafish toward the computer screen (Kalueff et al., 2013). We evaluated all movements toward the computer screen as increasing proximity likely indicates some level of attraction (Kalueff et al., 2013), possibly to obtain more information or engage in further interaction with the conspecific. In zebrafish, the turning angle represents a change in the directional heading (Kalueff et al., 2013), and we used it to define the end of each interaction period. We found that the best way to capture the information in these isolated behaviors is to isolate interactions in regard to changes in movement trajectory. Specifically, we measured the separation distance of the zebrafish prior to the frame where the zebrafish altered its directional heading over 45° from its original angle of approach. One measurement was recorded during each interaction period, evaluating the separation distance (i.e., distance between the eye of the zebrafish and the virtual conspecific) and the interaction duration (i.e., difference between the start and end time of the interaction period). Additionally we assessed whether the zebrafish was viewing the virtual conspecific with the center of acute vision or the retinal periphery. We had not developed specific predictions for the region of the visual field used, so we considered this as a post hoc analysis.
We manipulated the size of the conspecific through a twofold increase (large conspecific = 8 cm) and twofold decrease (small conspecific = 2 cm) in size relative to a size-matched (intermediate conspecific = 4 cm) zebrafish. The eyes are an important cue involved in social recognition and the initiation of shoaling behavior (Landgraf et al., 2016), while the striping pattern is used as a reference mark to assess changes in conspecific movement when individuals are interacting in groups (Guthrie and Muntz, 1993; Bone and Moore, 2008). Because we kept the relative eye diameter and width of the lateral body stripes constant in each conspecific size manipulation, the net result was that the eyes and stripes could have been easier or more difficult to visually resolve in the large and small conspecifics, respectively.
We manipulated the position of our animation along the water column by making the virtual conspecific swim in either the upper portion of the tank (12.7 cm, low risk level) or lower portion of the tank (7.6 cm, high risk level), relative to the bottom of the tank. Previous studies have shown that under stress, zebrafish position themselves at the bottom of the water column (Egan et al., 2009; Kalueff et al., 2013).
In animals moving in two-dimensional and three-dimensional space and through manipulative approaches, it has been demonstrated that the presence of a visual horizon acts as a depth cue and can influence the visual perception of (and behavioral responses to) objects in the environment (Layne et al., 1997; Zeil, 2000; Caballero et al., 2015). The empirical evidence on the visual horizon effect also includes fish (Douglas, 1996). We therefore manipulated the presence/absence of the virtual horizon under the hypothesis that it would modify the perceived depth of the conspecific in the virtual environment, and ultimately affect the quality of information (i.e., higher with the presence of the visual horizon because the spatial reference could enhance the perception of depth). Treatments with the horizon absent (low perceived depth) had a homogenous background with the virtual conspecific swimming back and forth, similar to other playback studies with zebrafish (Rosenthal and Ryan, 2005; Saverino and Gerlai, 2008; Neri, 2012; Fernandes et al., 2015). We selected a white background to enhance detection of the live fish and virtual conspecific with the video tracking software used in this study. Treatments with the horizon present (high perceived depth) had a virtual substrate, the default terrain of the anyfish program. When the virtual horizon was present, the conspecifics were 8 and 3 cm above the horizon in high and low risk treatments, respectively.
We also coded whether the zebrafish was using the center of acute vision (i.e., high acuity region of visual field) or retinal periphery (i.e., low acuity region of visual field) for each observation to establish if zebrafish may utilize high acuity regions of the visual field to increase their uptake of social information. We measured the position (angle in three-dimensional space) of the conspecific relative to the eye of the zebrafish (Pita et al., 2015). The distance between the eye of the live zebrafish and the center of the virtual conspecific was calculated from two-dimensional measurements of the top and side view camera recordings (Supplementary Figure 1). To estimate where the center of acute vision projected in the visual space of our experimental arena, we calculated both the horizontal (angle relative to the horizontal plane of the zebrafish) and vertical (angle relative to the vertical plane of the zebrafish) positions of the eye of the zebrafish. We then evaluated the position of the conspecific relative to the projection of the zebrafish’s center of acute vision utilizing a 95% confidence interval range based on the retinal topographic map of the density of retinal ganglion cells of this species (Pita et al., 2015). If the virtual conspecific was within the 95% confidence interval range, we recorded that the live zebrafish was visualizing it with its center of acute vision for that frame. If the virtual conspecific was outside the 95% confidence interval, we deemed it as being visualized by areas of the retina with low visual acuity at that time frame (e.g., retinal periphery). Although zebrafish can move their eyes, these movements act as a means to provide image stabilization when swimming (Chen et al., 2014) or for prey localization when foraging (Bianco et al., 2011; Patterson et al., 2013). We assumed that any eye movements generated during the approach to the animation were used to maintain image stabilization of the conspecific within the zebrafish’s visual field. Although zebrafish can move their eyes in certain contexts (Brockerhoff et al., 1997), the assumption of lack of eye movements has been used in social interaction studies in which fish are individually tracked relative to the position of neighbors (Strandburg-Peshkin et al., 2013; Rosenthal et al., 2015). Nevertheless, because of the possibility of some eye movements, we acknowledge that our results should be taken with care.
Statistical Analysis
We ran general linear mixed models using a repeated measures design in SAS (version 9.4). The code and the data used are available in the Supplementary Material. We tested the effects of the size of the conspecific, the position of the conspecific in the water column, and the absence/presence of the visual horizon on separation distance and interaction duration. Across trials, there were 10.66 ± 0.63 (mean ± SE) interaction behaviors analyzed per trial per individual. Each interaction behavior totaled approximately 23.9 ± 0.40 frames (mean ± SE). In addition to the main effects, we also analyzed two-way interaction effects (i.e., size of the conspecific × position of the conspecific in the water column, size of the conspecific × absence/presence of the visual horizon, and the position of the conspecific in the water column × absence/presence of the visual horizon) on separation distance and interaction duration. The original models included the three-way interaction (size of the conspecific × position of the conspecific in the water column × absence/presence of the visual horizon) as well as the sex of the live zebrafish, but did not turn out to be significant; so, we removed it to increase the power of the tests. We added to the final model the order in which individual zebrafish were exposed to the multiple treatment combinations as an independent factor (despite our randomizing order presentation) to control statistically for potential temporal effects. We defined the model in SAS PROC MIXED by setting each of the three main factors (size of the conspecific, position of the conspecific in the water column, and absence/presence of the visual horizon) as within-subject factors relative to subject ID, which was defined as a random factor, following Moser (2004) (see Supplementary Material). This model allowed covariances to vary due to subject ID, size of the conspecific, position of the conspecific in the water column, and absence/presence of the visual horizon. We used an unstructured variance-covariance matrix, which is recommended by West et al. (2015) when dealing with multiple repeated-measures factors like in our case. We used the between-within method for estimating the degrees of freedom in the mixed models given the presence of three repeated measure factors. We checked for the normality of the residuals and the homogeneity of variance visually and we found extremely minor deviations that did not justify transforming the data. We used t-tests to assess post hoc differences between levels of a given factor or interaction. However, we applied the Holm–Bonferroni P-value correction for multiple comparisons to reduce the probability of committing type I error (Holm, 1978). All P-values presented in the results are Holm–Bonferroni transformed. Additionally, we estimated the effect size of those independent factors that turned out to be significant (P < 0.05). More specifically, we calculated Cohen’s d for non-independent samples (Lakens, 2013) for pairwise comparisons between means to facilitate comparisons with other studies.
We also ran a generalized linear mixed model in SAS (version 9.4) to analyze whether the probability of using different regions of the visual field (i.e., center of acute vision vs. periphery) varied in the different treatment conditions. In SAS PROC GLIMMIX, we defined the model in much the same way as described above for the general linear models. The main differences were that our dependent variable was binomial (center of acute vision, periphery) with a logit link function, and a first-order autoregressive covariance structure (Supplementary Material). For the purposes of this model, we set our dependent variable as 1, when the conspecific was viewed with the center of acute vision, and 0, when the conspecific was viewed with the retinal periphery.
Results
Separation Distance
The size of the conspecific affected zebrafish separation distance (Table 1). Zebrafish increased their separation distance as the virtual conspecific increased in size (Figure 1; effect sizes reported in Table 2). However, we did not detect a significant change in separation distance relative to the position of the conspecific in the water column or in the presence of the visual horizon (Table 1).
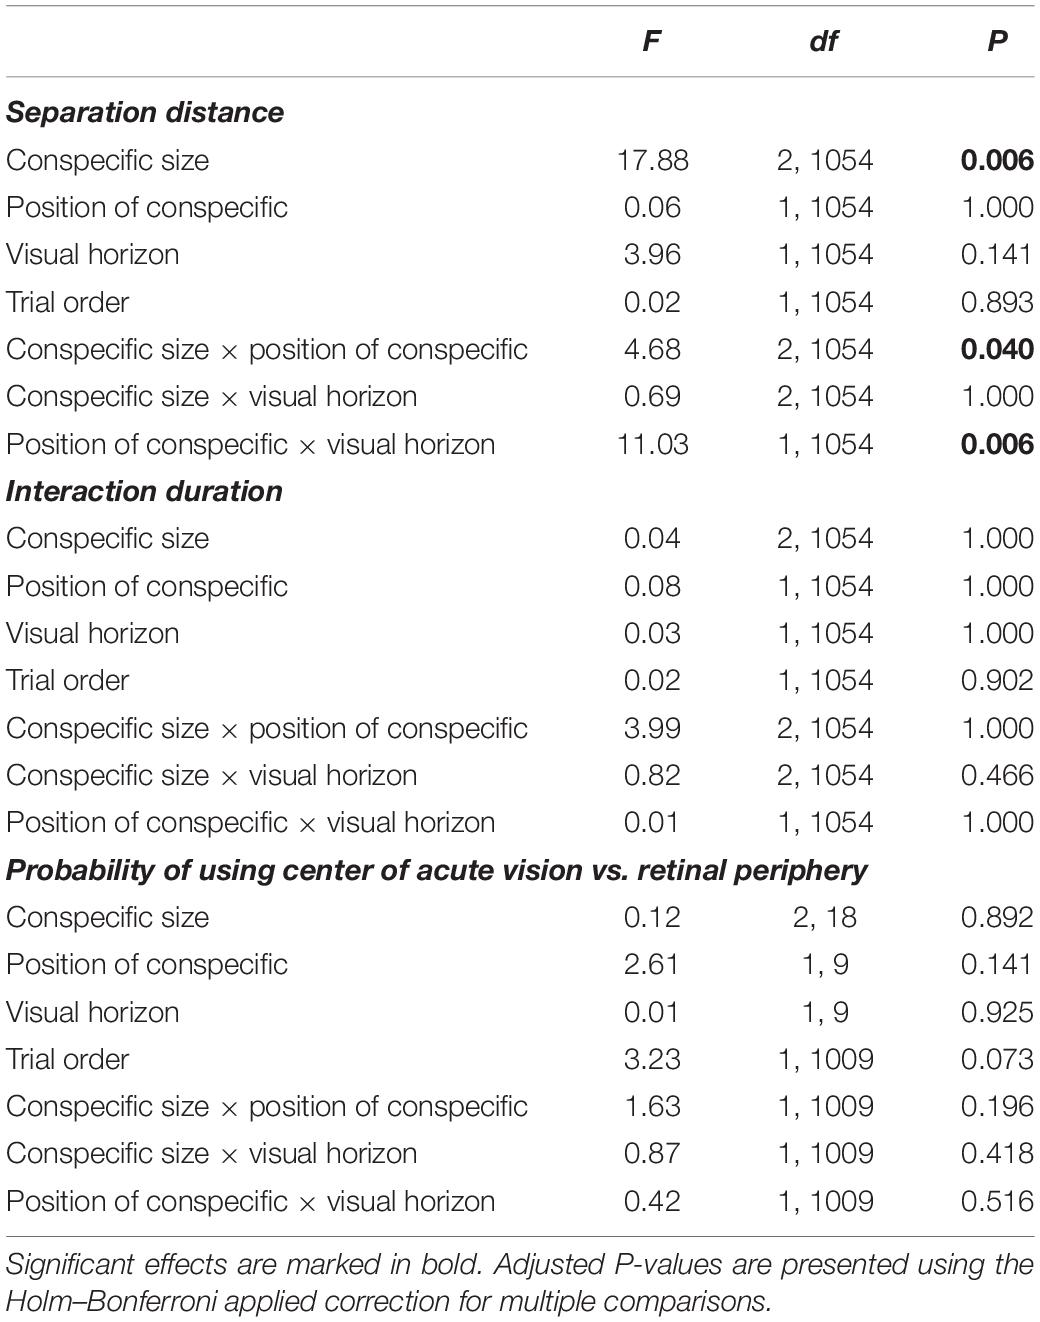
Table 1. Effects of the size of the virtual conspecific, the position of the virtual conspecific in the water column, and the absence/presence of the visual horizon: (a) separation distance, (b) interaction duration, and (c) the probability of viewing the conspecific with the center of acute vision (1) or the retinal periphery (0).
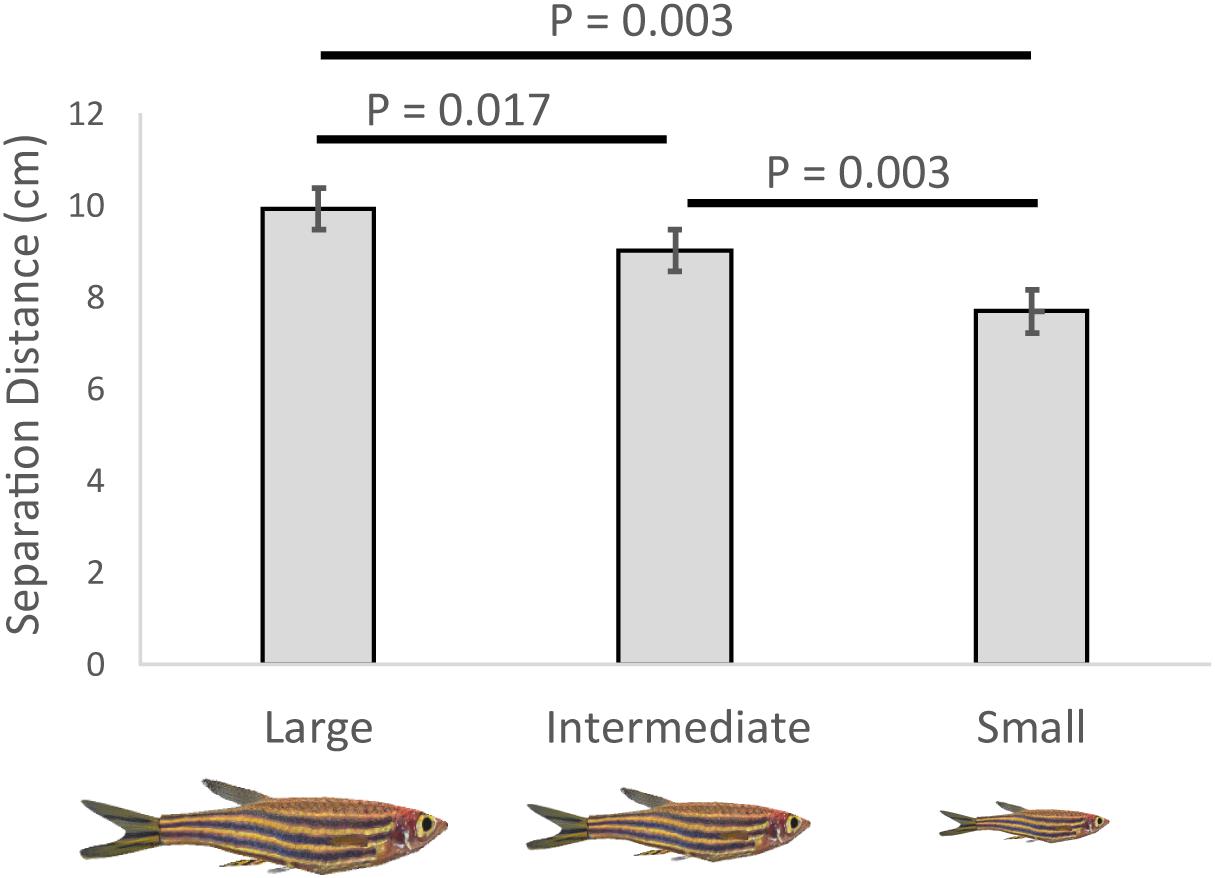
Figure 1. Variation in separation distance between the zebrafish and virtual conspecific (cm) relative to: the size of the conspecific (large, intermediate, and small), shown are means and SEs.
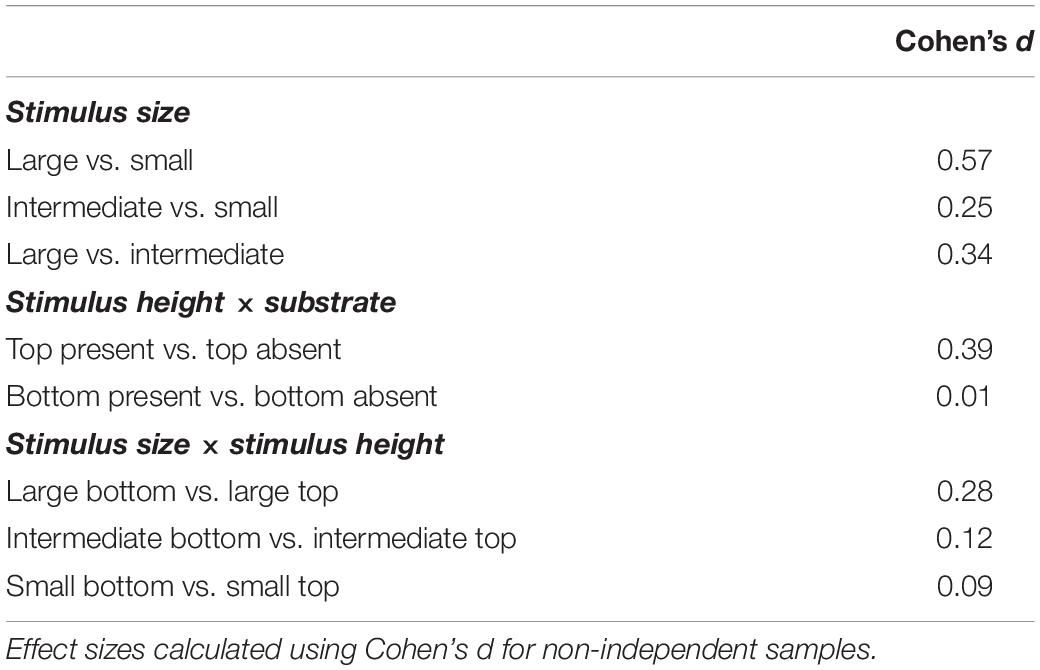
Table 2. Effect sizes for the pairwise comparisons associated with the significant independent factors reported in the study.
We also found two significant two-way interactions that involved the three factors we manipulated (Table 1; effect sizes reported in Table 2). First, the size of the conspecific interacted with its position in the water column (Figure 2A). Despite the significant P-value, based on an F statistic, from the overall interaction (Table 1), the post hoc tests, based on t statistics, were not significant (large – top vs. bottom, P = 0.147; intermediate – top vs. bottom, P = 0.386; small – top vs. bottom, P = 0.386). This is not unusual given that post hoc tests are not as powerful as F ratio tests (Gotelli and Ellison, 2013). The overall trend was separation distances being longer when the large conspecific was at the bottom rather than the top of the water column (Figure 2A), with smaller differences between the two positions in the water column when subjects were exposed to the intermediate and small conspecifics (Figure 2A).
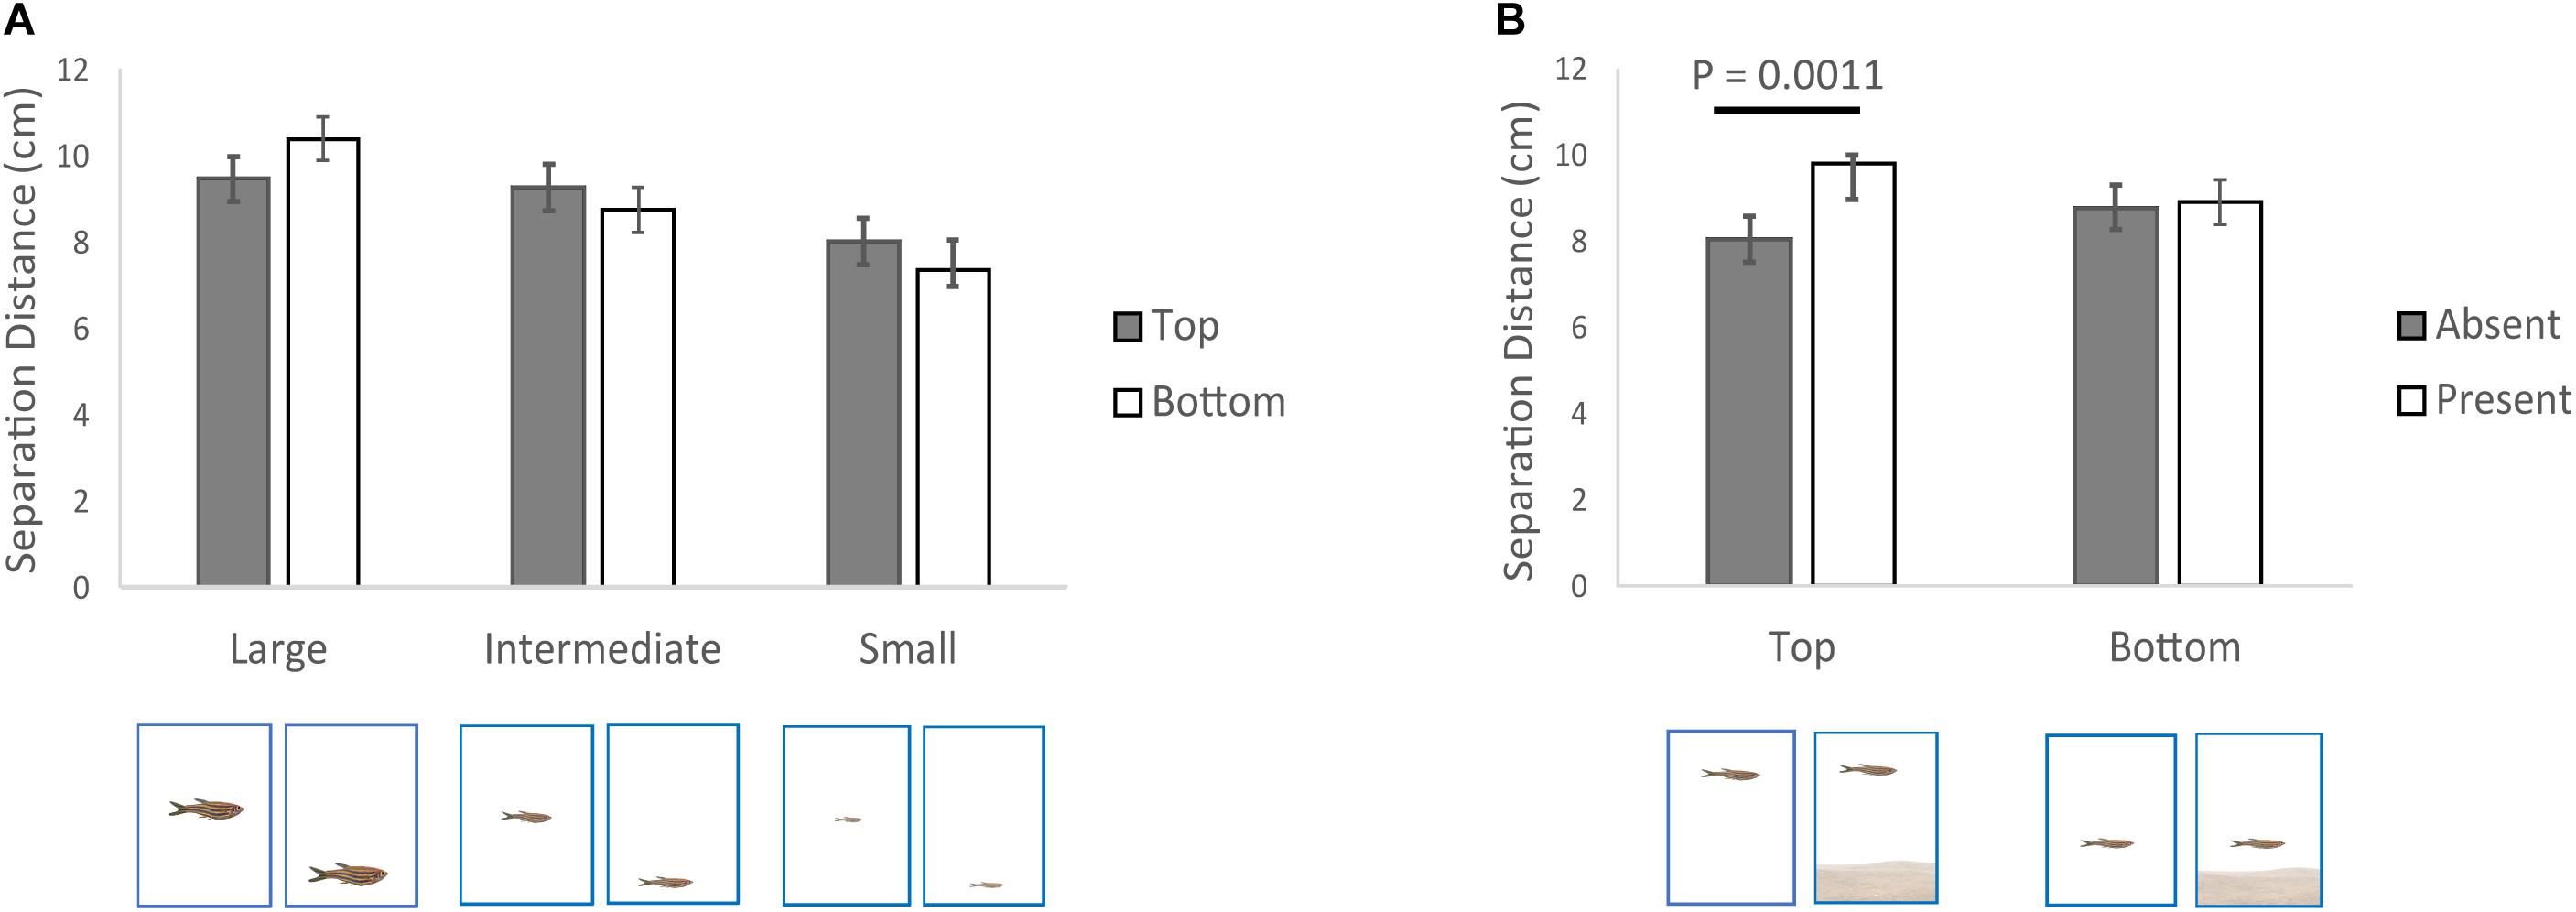
Figure 2. Variation in separation distance between the zebrafish and virtual conspecific (cm) relative to the simultaneous effect of: (A) size of the conspecific (large, intermediate, small), (B) position of the conspecific in the water column (top, bottom) and (C) absence/presence of the visual horizon. Shown are means and SEs.
Second, the position of the conspecific in the water column also interacted with the absence/presence of the visual horizon (Table 1; effect sizes reported in Table 2), such that when the conspecific was at the top of the water column, the separation distance was longer when the horizon was present compared to when it was absent (Figure 2B). However, no significant difference in separation distance relative to the visual horizon was detected when the conspecific was at the bottom of the water column (Figure 2B).
Interaction Duration
There were no significant effects of size of the conspecific, its position in the water column, or absence/presence of the visual horizon on the duration of the interaction between the zebrafish and the conspecific (Table 1).
Probability of Viewing the Conspecific With Different Regions of the Visual Field
The probability of the zebrafish viewing the virtual conspecific with the center of acute vision was not significantly affected by any of our manipulated treatments or their interactions (Table 1). The implication is that during the social interactions, our subjects have similar probabilities of viewing the conspecific with either the center of acute vision or the retinal periphery.
Discussion
In a social pairwise scenario, zebrafish modified their spacing behavior with changes in different features of their social environment (conspecific size, position of the conspecific in the water column, and presence of a visual horizon). However, we did not find changes in the duration of the social interactions. Zebrafish responded to our manipulations not just in an additive way (i.e., independent effects of each type of manipulation), but also in a multiplicative way (i.e., interaction effects between different manipulations). Zebrafish modulated their behavioral responses based on combinations of different visual social inputs such that their behavior toward one input depended on the levels of the second input.
One of our original predictions for single independent effects was supported by our findings. Specifically, there was an inverse relationship between separation distance and the size of the virtual conspecific with zebrafish moving closer to the virtual conspecific as its size decreased. Our results are similar to other studies showing that zebrafish maintain a shorter separation distance with size-matched or smaller conspecifics compared to larger conspecifics (Fernandes et al., 2015). However, other studies typically interpret a shorter or longer separation distance as an increased or decreased shoaling preference, respectively. An alternative interpretation is that zebrafish altered their separation distance in an effort to improve the resolution of social cues (i.e., eye and stripes) in order to maintain social cohesion (Bone and Moore, 2008). Our findings support this hypothesis as zebrafish maintained a separation distance that could have allowed them to resolve conspecific cues using their high acuity vision (Supplementary Figure 3a). Similarly, zebrafish maintained a separation distance allowing them to resolve conspecific cues using their low acuity vision, but only for intermediate and large-sized conspecifics (Supplementary Figure 3b). When interacting with small conspecifics, zebrafish maintained a separation distance that would allow for the resolution of the eye while remaining at the margin of the resolution limits for the stripes (Supplementary Figure 3b). Considering that individuals may suffer an increased predation risk when joining a group composed of smaller conspecifics, zebrafish may make a compromise between obtaining social information and increasing antipredator vigilance. Therefore, when interacting with small conspecifics, zebrafish may prioritize maintaining a separation distance at the outer limits of cue resolution in order to improve predator detection and the probability of survival. This is because the farther individuals can space themselves in the group, the faster the group can detect and potentially react to approaching predators (Rountree and Sedberry, 2009). This is important as larger individuals have a higher probability of being targeted by a predator when associating with small conspecifics (Rodgers et al., 2015). However, it is important to note that the effects of the factors we manipulated cannot be interpreted only in isolation because of the significant interaction effects we found.
The effect of conspecific position in the water column depended on the size of the virtual conspecific. Zebrafish tended to maintain shorter separation distances when the large conspecific was at the top of the water column (i.e., low risk scenario) compared to the bottom of the water column (i.e., high risk scenario). On the other hand, for intermediate and small-sized conspecifics the difference in separation distance was less pronounced in regard to changes in position in the water column. These results do not support our original predictions, although the water column effects with the large conspecific may be explained by size disparity and the potential for aggressive interactions. Fighting ability is positively correlated with body size (Li et al., 2018). Smaller individuals in particular suffer more costs when engaging in aggressive interactions with larger individuals (Arnott and Elwood, 2009). Additionally, in some fish species, low vertical spatial positions are associated with aggressive behavior (Nakayama et al., 2009). Our live zebrafish may have maintained a longer separation distance when large conspecifics occupied low positions in the water column to reduce the probability of a potentially costly aggressive interaction. Alternatively, the large conspecific could have been perceived as a predator; however, this is unlikely as we did not observe any antipredator associated behaviors (e.g., increased turning rate, jumping, and erratic movement) (Kalueff et al., 2013). The less pronounced difference in separation distance with position of the water column for the small and intermediate conspecifics could be explained by an insufficient elicitation of antipredator avoidance behaviors. Although zebrafish typically maintain low positions in the water column under high risk of predation, this behavior is often coupled with other behaviors such as erratic movement, increased speed, freezing, and increased opercular movement (Kalueff et al., 2013). We were not able to generate these behaviors in our virtual displays.
The effects of the visual horizon depended on the position of the conspecific in the water column. Specifically, we observed greater separation distances when the horizon was present rather than absent and the conspecific was at the top of the water column. It is possible that the visual horizon may be providing additional depth information regarding the position of the conspecific, but only in the low risk scenario. It is possible that in the high risk scenario (conspecific at the bottom of the tank), the putative enhancement in depth perception with the presence of the horizon is reduced as individuals maintain similar separation distances irrespective of the absence/presence of the horizon possibly to increase the perception of social information or improve survival through dilution effects (Krause and Ruxton, 2002). Alternatively, individuals may perceive the visual horizon as a safe area to seek refuge from predators, resulting in individuals swimming closer to the conspecific in an attempt to get closer to the horizon in the high risk scenario.
In terms of interaction time, we did not detect any significant effects of any of the three visual social inputs manipulated. This could be attributed to zebrafish prioritizing obtaining high quality social information via changes in neighbor distance, lack of a high enough sample size to detect interaction time effects, or an increase in Type II error due to the Holm–Bonferroni correction we ran (Nakagawa, 2004). We also found that none of our manipulations affected the portion of the visual field (high vs. low acuity) zebrafish used to view the conspecific. The implication is that zebrafish use their high and low acuity vision with relatively equal probability to track conspecifics. One potential explanation is that the information zebrafish get from viewing conspecifics with their center of acute vision is enough without the need to compensate for difficult viewing conditions. Alternatively, our sample size may have been limited to detect an effect.
Overall, it appears that the visual social environment affects zebrafish spacing behavior in complex ways. Many vertebrates (fish and birds) interact socially in three-dimensional space. Previous findings (Larsch and Baier, 2018; Lemasson et al., 2018) and ours suggest that the rules underlying these three-dimensional interactions are likely affected by multiple parameters acting simultaneously. In other words, the effects of some visual features of the social environment may depend on the intensity of other visual features tuning up or down different behavioral responses. We believe this is relevant because research on collective behavior sometimes tries to pin down simple rules (i.e., effects of single factors) governing between-individual interactions (Schellinck and White, 2011; Arganda et al., 2012; Pita et al., 2016). Although simplification is certainly necessary to understand complex behaviors, we suggest that considering the multiplicative effects of different features of the visual social environment can enhance our ability to predict social interactions in groups.
One of the implications of the dynamic nature of zebrafish social behavior is that it could influence the spatial configuration of fish schools depending on habitat complexity and water turbidity. For example, in a low-risk environment with an easily visible horizon, individuals may maintain long separation distances, which would lead to low density groups with low intra-specific competition (Krause and Ruxton, 2002). Low density fish schools could then detect predators more quickly because of greater group visibility (Rountree and Sedberry, 2009; Pita et al., 2015). Additionally, in these low-density groups, the presence of a threat could be quickly transmitted across the group via social information, which could lead to rapid changes in the spatial configuration of the school ending in spatially tighter (e.g., higher density) schools. However, if the group is composed of individuals with different sizes, there may be increased interaction costs particularly under high risk situations. These costs may alter the flow of social information and the structural dynamics of the group. More work along the lines of Lemasson et al. (2018) should establish the relevance of the different sources of visual social information in triggering these structural changes as the number of group members increases (and their position in three-dimensional space changes) in environments with different levels of habitat complexity and visibility.
Data Availability Statement
The original contributions presented in the study are included in the article/Supplementary Materials, further inquiries can be directed to the corresponding author/s.
Ethics Statement
The animal study was reviewed and approved by the Purdue IACUC.
Author Contributions
DP conceived the original idea, carried out the experiment, analyzed the data, and wrote the manuscript with support from EF-J. EF-J supervised the project. Both authors contributed to the article and approved the submitted version.
Funding
This research was funded by the National Science Foundation EAGER grant 1251424.
Conflict of Interest
The authors declare that the research was conducted in the absence of any commercial or financial relationships that could be construed as a potential conflict of interest.
Acknowledgments
We are grateful to Deona Harris, Megan Bock, Elizabeth Brewer, and Rachel Lim for helping in the video processing and data gathering. This manuscript has been released as a pre-print at bioRxiv, (Pita and Fernandez-Juricic, 2019).
Supplementary Material
The Supplementary Material for this article can be found online at: https://www.frontiersin.org/articles/10.3389/fevo.2020.568752/full#supplementary-material
Footnotes
References
Abaid, N., Bartolini, T., Macrì, S., and Porfiri, M. (2012). Zebrafish responds differentially to a robotic fish of varying aspect ratio, tail beat frequency, noise, and color. Behav. Brain Res. 233, 545–553. doi: 10.1016/j.bbr.2012.05.047
Arganda, S., Perez-Escudero, A., and de Polavieja, G. G. (2012). A common rule for decision making in animal collectives across species. Proc. Natl. Acad. Sci. 109, 20508–20513. doi: 10.1073/pnas.1210664109
Arnott, G., and Elwood, R. W. (2009). Assessment of fighting ability in animal contests. Anim. Behav. 77, 991–1004. doi: 10.1016/j.anbehav.2009.02.010
Balzarini, V., Taborsky, M., Villa, F., and Frommen, J. G. (2017). Computer animations of color markings reveal the function of visual threat signals in Neolamprologus pulcher. Curr. Zool. 63, 45–54. doi: 10.1093/cz/zow086
Bartolini, T., Mwaffo, V., Showler, A., Macrì, S., Butail, S., and Porfiri, M. (2016). Zebrafish response to 3D printed shoals of conspecifics: The effect of body size. Bioinspir. Biomimet. 11:026003. doi: 10.1088/1748-3190/11/2/026003
Bianco, I. H., Kampff, A. R., and Engert, F. (2011). Prey Capture Behavior Evoked by Simple Visual Stimuli in Larval Zebrafish. Front. Syst. Neurosci. 5:1–13. doi: 10.3389/fnsys.2011.00101
Bierbach, D., Landgraf, T., Romanczuk, P., Lukas, J., Nguyen, H., Wolf, M., et al. (2018). Using a robotic fish to investigate individual differences in social responsiveness in the guppy. R. Soc. Open Sci. 5:181026. doi: 10.1098/rsos.181026
Bishop, B. H., Spence-Chorman, N., and Gahtan, E. (2016). Three-dimensional motion tracking reveals a diving component to visual and auditory escape swims in zebrafish larvae. J. Exp. Biol. 219, 3981–3987. doi: 10.1242/jeb.147124
Bone, Q., and Moore, R. (2008). Sensory Systems, and Communication in Biology of Fishes. New York: Taylor & Francis, 289–346.
Brockerhoff, S. E., Hurley, J. B., Niemi, G. A., and Dowling, J. E. (1997). A new form of inherited red-blindness identified in zebrafish. J. Neurosci. 17, 4236–4242. doi: 10.1523/jneurosci.17-11-04236.1997
Butail, S., Bartolini, T., and Porfiri, M. (2013). Collective response of zebrafish shoals to a free-swimming robotic fish. PLoS One 8:e76123. doi: 10.1371/journal.pone.0076123
Butler, S. R., Fernandez-Juricic, E., and Fernández-Juricic, E. (2014). European starlings recognize the location of robotic conspecific attention. Biol. Lett. 10:20140665. doi: 10.1098/rsbl.2014.0665
Caballero, J., Mazo, C., Rodriguez-Pinto, I., and Theobald, J. C. (2015). A visual horizon affects steering responses during flight in fruit flies. J. Exp. Biol. 218, 2942–2950. doi: 10.1242/jeb.119313
Chamberlain, A. C., and Ioannou, C. C. (2019). Turbidity increases risk perception but constrains collective behaviour during foraging by fish shoals. Anim. Behav. 156, 129–138. doi: 10.1016/j.anbehav.2019.08.012
Chen, C., Bockisch, C. J., Bertolini, G., Olasagasti, I., Neuhauss, S. C. F., Weber, K. P., et al. (2014). Velocity storage mechanism in zebrafish larvae. J. Physiol. 592, 203–214. doi: 10.1113/jphysiol.2013.258640
Chouinard-Thuly, L., Gierszewski, S., Rosenthal, G. G., Reader, S. M., Rieucau, G., Woo, K. L., et al. (2017). Technical and conceptual considerations for using animated stimuli in studies of animal behavior. Curr. Zool. 63, 5–19. doi: 10.1093/cz/zow104
Croft, D. P., Morrell, L. J., Wade, A. S., Piyapong, C., Ioannou, C. C., Dyer, J. R. G., et al. (2006). Predation risk as a driving force for sexual segregation: A cross population comparison. Am. Nat. 167, 867–878. doi: 10.1086/504853
Dawkins, M. S., and Woodington, A. (1997). Distance and the presentation of visual stimuli to birds. Anim. Behav. 54, 1019–1025. doi: 10.1006/anbe.1997.0519
Delcourt, J., and Poncin, P. (2012). Shoals and schools: Back to the heuristic definitions and quantitative references. Rev. Fish Biol. Fish. 22, 595–619. doi: 10.1007/s11160-012-9260-z
Douglas, R. H. (1996). Goldfish use the visual angle of a familiar landmark to locate a foodsource. J. Fish Biol. 49, 532–536. doi: 10.1006/jfbi.1996.0179
Douglas, R. H., Eva, J., and Guttridge, N. (1988). Size constancy in goldfish (Carassius auratus). Behav. Brain Res. 30, 37–42. doi: 10.1016/0166-4328(88)90006-X
Egan, R. J., Bergner, C. L., Hart, P. C., Cachat, J. M., Canavello, P. R., Elegante, M. F., et al. (2009). Understanding behavioral and physiological phenotypes of stress and anxiety in zebrafish. Behav. Brain Res. 205, 38–44. doi: 10.1016/j.bbr.2009.06.022
Fernandes, Y., Rampersad, M., Jia, J., and Gerlai, R. (2015). The effect of the number and size of animated conspecific images on shoaling responses of zebrafish. Pharmacol. Biochem. Behav. 139, 94–102. doi: 10.1016/j.pbb.2015.01.011
Fernández-Juricic, E., and Kacelnik, A. (2004). Information transfer and gain in flocks: The effects of quality and quantity of social information at different neighbour distances. Behav. Ecol. Sociobiol. 55, 502–511. doi: 10.1007/s00265-003-0698-9
Fernández-Juricic, E., and Kowalski, V. (2011). Where does a flock end from an information perspective? A comparative experiment with live and robotic birds. Behav. Ecol. 22, 1304–1311. doi: 10.1093/beheco/arr132
Fernández-Juricic, E., Beauchamp, G., and Bastain, B. (2007). Group-size and distance-to-neighbour effects on feeding and vigilance in brown-headed cowbirds. Anim. Behav. 73, 771–778. doi: 10.1016/j.anbehav.2006.09.014
Fernández-Juricic, E., Beauchamp, G., Treminio, R., and Hoover, M. (2011). Making heads turn: Association between head movements during vigilance and perceived predation risk in brown-headed cowbird flocks. Anim. Behav. 82, 573–577. doi: 10.1016/j.anbehav.2011.06.014
Fernández-Juricic, E., Siller, S., and Kacelnik, A. (2004). Flock density, social foraging, and scanning: an experiment with starlings. Behav. Ecol. 15, 371–379. doi: 10.1093/beheco/arh017
Frech, B., Vogtsberger, M., and Neumeyer, C. (2012). Visual discrimination of objects differing in spatial depth by goldfish. J. Comp. Physiol. 198, 53–60. doi: 10.1007/s00359-011-0685-y
Gerlai, R. (2017). Animated images in the analysis of zebrafish behavior. Curr. Zool. 63, 35–44. doi: 10.1093/cz/zow077
Gerlai, R., Fernandes, Y., and Pereira, T. (2009). Zebrafish (Danio rerio) responds to the animated image of a predator: Towards the development of an automated aversive task. Behav. Brain Res. 201, 318–324. doi: 10.1016/j.bbr.2009.03.003
Gotelli, N. J., and Ellison, A. M. (2013). A Primer of Ecological Statistics, 2nd Edn. Sunderland, Massachusetts U.S.A: Sinauer Associates.
Guthrie, D. M., and Muntz, W. R. A. (1993). “Role of vision in fish behaviour,” in Behaviour of Teleost Fishes, ed. T. J. Pitcher (London: Chapman & Hall), 89–128. doi: 10.1007/978-94-011-1578-0_4
Herbert-Read, J. E. (2016). Understanding how animal groups achieve coordinated movement. J. Exp. Biol. 219, 2971–2983. doi: 10.1242/jeb.129411
Hoare, D. J., Krause, J., Peuhkuri, N., and Godin, J. G. (2000). Body size and shoaling in fish. J. Fish Biol. 57, 1351–1366. doi: 10.1006/jfbi.2000.1446
Holm, S. (1978). Board of the Foundation of the Scandinavian Journal of Statistics A Simple Sequentially Rejective Multiple Test Procedure Author (s): Sture Holm Published by: Wiley on behalf of Board of the Foundation of the Scandinavian Journal of Statistics Stable U. Scand. J. Stat. 6, 65–70.
Howard, I. P. (2012). Perceiving in Depth: (Vol. 3) Other Mechanisms of Depth Perception. New York, NY: Oxford University Press, doi: 10.1093/acprof:oso/9780199764167.001.0001
Ingley, S. J., Rahmani Asl, M., Wu, C., Cui, R., Gadelhak, M., Li, W., et al. (2015). anyFish 2.0: An open-source software platform to generate and share animated fish models to study behavior. SoftwareX 3–4, 13–21. doi: 10.1016/j.softx.2015.10.001
Kalueff, A. V., Gebhardt, M., Stewart, A. M., Cachat, J. M., Brimmer, M., Chawla, J. S., et al. (2013). Towards a comprehensive catalog of zebrafish behavior 1.0 and beyond. Zebrafish 10, 70–86. doi: 10.1089/zeb.2012.0861
Kim, C., Ruberto, T., Phamduy, P., and Porfiri, M. (2018). Closed-loop control of zebrafish behaviour in three dimensions using a robotic stimulus. Sci. Rep. 8, 1–15. doi: 10.1038/s41598-017-19083-2
Kimbell, H. S., and Morrell, L. J. (2015). Turbidity influences individual and group level responses to predation in guppies. Anim. Behav. 103, 179–185. doi: 10.1016/j.anbehav.2015.02.027
Krause, J., and Godin, J.-J. (1994). Shoal Choice in the Banded Killifish: Effects of Predation Risk, Fish Size, Species Composition and Size of Shoals. Ethology 136, 128–136. doi: 10.1111/j.1439-0310.1994.tb01063.x
Lakens, D. (2013). Calculating and reporting effect sizes to facilitate cumulative science: A practical primer for t-tests and ANOVAs. Front. Psychol. 4:1–12. doi: 10.3389/fpsyg.2013.00863
Landgraf, T., Bierbach, D., Nguyen, H., Muggelberg, N., Romanczuk, P., and Krause, J. (2016). RoboFish: Increased acceptance of interactive robotic fish with realistic eyes and natural motion patterns by live Trinidadian guppies. Bioinspir. Biom. 11:015001. doi: 10.1088/1748-3190/11/1/015001
Larsch, J., and Baier, H. (2018). Biological Motion as an Innate Perceptual Mechanism Driving Social Affiliation. Curr. Biol. 28, 3523–3532.e. doi: 10.1016/j.cub.2018.09.014
Lavergne, F. A., Wendehenne, H., Bäuerle, T., and Bechinger, C. (2019). Group formation and cohesion of active particles with visual perception – dependent motility. Science 364, 70–74. doi: 10.1126/science.aau5347
Layne, J., Land, M., and Zeil, J. (1997). Fiddler crabs use the visual horizon to distinguish predators from conspecifics: A review of the evidence. J. Mar. Biol. Assoc. 77, 43–54. doi: 10.1017/S0025315400033774
Lemasson, B., Tanner, C., Woodley, C., Threadgill, T., Qarqish, S., and Smith, D. (2018). Motion cues tune social influence in shoaling fish. Sci. Rep. 8, 1–10. doi: 10.1038/s41598-018-27807-1
Li, C. Y., Jones, R., and Earley, R. L. (2018). Contest decisions are governed by own size and opponent size category in mangrove rivulus fish, Kryptolebias marmoratus. Anim. Behav. 146, 97–103. doi: 10.1016/j.anbehav.2018.09.020
Macrì, S., Neri, D., Ru, T., Mwaffo, V., and Butail, S. (2017). Three-dimensional scoring of zebrafish behavior unveils biological phenomena hidden by two-dimensional analyses. Sci. Rep. 7, 1–10. doi: 10.1038/s41598-017-01990-z
Miklosi, A., and Andrew, R. J. (2006). The Zebrafish as a Model for Behavioral Studies. Zebrafish 3, 227–234. doi: 10.1089/zeb.2006.3.227
Miller, N., and Gerlai, R. (2012). From Schooling to Shoaling: Patterns of Collective Motion in Zebrafish (Danio rerio). PLoS One 7:e48865. doi: 10.1371/journal.pone.0048865
Nakayama, S., Ojanguren, A., and Fuiman, L. (2009). To fight, or not to fight: determinants and consequences of social behaviour in young red drum (Sciaenops ocellatus). Behaviour 146, 815–830. doi: 10.1163/156853909X446226
Neri, P. (2012). Feature binding in zebrafish. Anim. Behav. 84, 485–493. doi: 10.1016/j.anbehav.2012.06.005
Nityananda, V., and Read, J. C. A. (2017). Stereopsis in animals: evolution, function and mechanisms. J. Exp. Biol. 220, 2502–2512. doi: 10.1242/jeb.143883
Oliveira, T. A., Idalencio, R., Kalichak, F., dos Santos, Rosa, J. G., Koakoski, G., et al. (2017). Stress responses to conspecific visual cues of predation risk in zebrafish. PeerJ 5:e3739. doi: 10.7717/peerj.3739
Ord, T. J., Peters, R. A., Clucas, B., and Stamps, J. A. (2007). Lizards speed up visual displays in noisy motion habitats. Proc. R. Soc. B Biol. Sci. 274, 1057–1062. doi: 10.1098/rspb.2006.0263
Patterson, B. W., Abraham, A. O., Maciver, M. A., and Mclean, D. L. (2013). Visually guided gradation of prey capture movements in larval zebrafish. J. Exp. Biol. 216, 3071–3083. doi: 10.1242/jeb.087742
Pays, O., Beauchamp, G., Carter, A. J., and Goldizen, A. W. (2013). Foraging in groups allows collective predator detection in a mammal species without alarm calls. Behav. Ecol. 24, 1229–1236. doi: 10.1093/beheco/art057
Pays, O., Dubot, A. L., Jarman, P. J., Loisel, P., and Goldizen, A. W. (2009). Vigilance and its complex synchrony in the red-necked pademelon, Thylogale thetis. Behav. Ecol. 20, 22–29. doi: 10.1093/beheco/arn110
Peters, R. A., and Evans, C. S. (2007). Active space of a movement-based signal: Response to the Jacky dragon (Amphibolurus muricatus) display is sensitive to distance, but independent of orientation. J. Exp. Biol. 210, 395–402. doi: 10.1242/jeb.02676
Peters, R. A., Hemmi, J. M., and Zeil, J. (2007). Signaling against the Wind: Modifying Motion-Signal Structure in Response to Increased Noise. Curr. Biol. 17, 1231–1234. doi: 10.1016/j.cub.2007.06.035
Pettigrew, J. D., Dreher, B., Hopkins, C. S., McCall, M. J., and Brown, M. (1988). Peak density of ganglion cells in the retinae of michiropteran bats: implications for visual acuity. Brain. Behav. Evol. 32, 39–56. doi: 10.1159/000116531
Pham, M., Raymond, J., Hester, J., Kyzar, E., Gaikwad, S., and Bruce, I. (2012). “Assessing Social Behavior Phenotypes in Adult Zebrafish: Shoaling, Social Preference, and Mirror Biting Tests,” in Zebrafish Protocols for Neurobehavioral Research. Neuromethods, eds A. Kalueff and A. Stewart (Totowa, NJ: Humana Press), 231–246. doi: 10.1007/978-1-61779-597-8_17
Pita, D., and Fernandez-Juricic, E. (2019). The visual social environment affects non-additively neighbor spacing and interaction time in zebrafish. bioRxiv 2019:511972. doi: 10.1101/511972
Pita, D., Collignon, B., Halloy, J., and Fernández-Juricic, E. (2016). Collective behaviour in vertebrates: a sensory perspective. R. Soc. Open Sci. 3:160377. doi: 10.1098/rsos.160377
Pita, D., Moore, B. A., Tyrrell, L. P., and Fernández-Juricic, E. (2015). Vision in two cyprinid fish: implications for collective behavior. PeerJ 3:e1113. doi: 10.7717/peerj.1113
Pritchard, V., Lawrence, J., Butlin, R. K., and Krause, J. (2001). Shoal choice in zebrafish, Danio rerio: the influence of shoal size and activity. Anim. Behav. 62, 1085–1088. doi: 10.1006/anbe.2001.1858
Proctor, C. J., Broom, M., and Ruxton, G. D. (2001). Modelling antipredator vigilance and flight response in group foragers when warning signals are ambiguous. J. Theor. Biol. 211, 409–417. doi: 10.1006/jtbi.2001.2353
Proctor, C. J., Broom, M., and Ruxton, G. D. (2003). A communication-based spatial model of antipredator vigilance. J. Theor. Biol. 220, 123–137. doi: 10.1006/jtbi.2003.3159
Qin, M., Wong, A., Seguin, D., and Gerlai, R. (2014). Induction of Social Behavior in Zebrafish: Live Versus Computer Animated Fish as Stimuli. Zebrafish 11, 185–197. doi: 10.1089/zeb.2013.0969
Rodgers, G. M., Downing, B., and Morrell, L. J. (2015). Prey body size mediates the predation risk associated with being “odd.”. Behav. Ecol. 26, 242–246. doi: 10.1093/beheco/aru185
Rosenthal, G. G. (2002). Design considerations and techniques for constructing video stimuli. Acta Ethol. 3, 49–54. doi: 10.1007/s102110000024
Rosenthal, G. G., and Ryan, M. J. (2005). Assortative preferences for stripes in danios. Anim. Behav. 70, 1063–1066. doi: 10.1016/j.anbehav.2005.02.005
Rosenthal, S. B., Twomey, C. R., Hartnett, A. T., Wu, H. S., and Couzin, I. D. (2015). Revealing the hidden networks of interaction in mobile animal groups allows prediction of complex behavioral contagion. Proc. Natl. Acad. Sci. 112, 4690–4695. doi: 10.1073/pnas.1420068112
Rountree, R. A., and Sedberry, G. R. (2009). A theoretical model of shoaling behavior based on a consideration of patterns of overlap among the visual fields of individual members. Acta Ethol. 12, 61–70. doi: 10.1007/s10211-009-0057-6
Ruberto, T., Polverino, G., and Porfiri, M. (2017). How different is a 3d-printed replica from a conspecific in the eyes of a zebrafish? J. Exp. Anal. Behav. 107, 279–293. doi: 10.1002/jeab.247
Ruhl, N., and McRobert, S. P. (2005). The effect of sex and shoal size on shoaling behaviour in Danio rerio. J. Fish Biol. 67, 1318–1326. doi: 10.1111/j.0022-1112.2005.00826.x
Saverino, C., and Gerlai, R. (2008). The social zebrafish: Behavioral responses to conspecific, heterospecific, and computer animated fish. Behav. Brain Res. 191, 77–87. doi: 10.1016/j.bbr.2008.03.013
Schellinck, J., and White, T. (2011). A review of attraction and repulsion models of aggregation: Methods, findings and a discussion of model validation. Ecol. Modell. 222, 1897–1911. doi: 10.1016/j.ecolmodel.2011.03.013
Sperandio, I., and Chouinard, P. A. (2015). The Mechanisms of Size Constancy. Multisens. Res. 28, 253–283. doi: 10.1163/22134808-00002483
Stowers, J. R., Hofbauer, M., Bastien, R., Griessner, J., Higgins, P., Farooqui, S., et al. (2017). Virtual reality for freely moving animals. Nat. Methods 14, 995–1002. doi: 10.1038/nmeth.4399
Strandburg-Peshkin, A., Twomey, C. R., Bode, N. W. F., Kao, A. B., Katz, Y., Ioannou, C. C., et al. (2013). Visual sensory networks and effective information transfer in animal groups. Curr. Biol. 23, R709–R711. doi: 10.1016/j.cub.2013.07.059
West, B. T., Welch, K. B., Galecki, A. T., and Gillespie, B. W. (2015). Linear mixed models: a practical guide using statistical software. Boca Raton. Taylor & Francis Group: CRC Press.
Woo, K. L., and Rieucau, G. (2008). Considerations in video playback design: Using optic flow analysis to examine motion characteristics of live and computer-generated animation sequences. Behav. Proces. 78, 455–463. doi: 10.1016/j.beproc.2008.03.003
Zeil, J. (2000). Depth cues, behavioural context, and natural illumination: some potential limitations of video playback techniques. Acta Ethol. 3, 39–48. doi: 10.1007/s102110000021
Keywords: fish schools, groups, social information, spacing behavior, vision
Citation: Pita D and Fernández-Juricic E (2021) Zebrafish Neighbor Distance Changes Relative to Conspecific Size, Position in the Water Column, and the Horizon: A Video-Playback Experiment. Front. Ecol. Evol. 8:568752. doi: 10.3389/fevo.2020.568752
Received: 02 June 2020; Accepted: 14 December 2020;
Published: 11 January 2021.
Edited by:
Robert Gerlai, University of Toronto, CanadaReviewed by:
Peter L. Hurd, University of Alberta, CanadaXimena J. Nelson, University of Canterbury, New Zealand
Copyright © 2021 Pita and Fernández-Juricic. This is an open-access article distributed under the terms of the Creative Commons Attribution License (CC BY). The use, distribution or reproduction in other forums is permitted, provided the original author(s) and the copyright owner(s) are credited and that the original publication in this journal is cited, in accordance with accepted academic practice. No use, distribution or reproduction is permitted which does not comply with these terms.
*Correspondence: Esteban Fernández-Juricic, ZWZlcm5hbkBwdXJkdWUuZWR1