 Christina Lynggaard1*
 Douglas W. Yu2,3,4
 Guilherme Oliveira5
 Cecilio F. Caldeira5
 Silvio J. Ramos5
 Martin R. Ellegaard1,6M. Thomas P. Gilbert1,6
 Markus Gastauer5†
 Kristine Bohmann1†
- 1Section for Evolutionary Genomics, Faculty of Health and Medical Sciences, The Globe Institute, University of Copenhagen, Copenhagen, Denmark
- 2School of Biological Sciences, University of East Anglia, Norwich, United Kingdom
- 3State Key Laboratory of Genetic Resources and Evolution, Kunming Institute of Zoology, Chinese Academy of Sciences, Kunming, China
- 4Center for Excellence in Animal Evolution and Genetics, Chinese Academy of Sciences, Kunming, China
- 5Instituto Tecnológico Vale, Belém, Brazil
- 6University Museum, NTNU, Trondheim, Norway
Human activities change natural landscapes, and in doing so endanger biodiversity and associated ecosystem services. To reduce the net impacts of these activities, such as mining, disturbed areas are rehabilitated and restored. During this process, monitoring is important to ensure that desired trajectories are maintained. In the Carajás region of the Brazilian Amazon, exploration for iron ores has transformed the original ecosystem; natural forest and a savanna formation with lateritic iron duricrust outcrops named canga. Here, native vegetation is logged and topsoil removed and deposited in waste piles along with mine waste. During rehabilitation, these waste piles are hydroseeded with non-native plant species to achieve rapid revegetation. Further, seeds of native canga and forest plant species are planted to point ecological succession towards natural ecosystems. In this study, we investigate diversity and composition of the arthropod community along a post-mining rehabilitation and restoration gradient, taking seasonality and primer bias into account. We use DNA metabarcoding of bulk arthropod samples collected in both the dry and rainy seasons from waste-pile benches at various stages of revegetation: non-revegetated exposed soils, initial stage with one-to-three-year-old stands, intermediate stage with four-to-five-year-old stands, and advanced stage with six-to-seven-year-old stands. We use samples from undisturbed cangas and forests as reference sites. In addition, we vegetation diversity and structure were measured to investigate relations between arthropod community and vegetation structure. Our results show that, over time, the arthropod community composition of the waste piles becomes more similar to the reference forests, but not to the reference cangas. Nevertheless, even the communities in the advanced-stage waste piles are different from the reference forests, and full restoration in these highly diverse ecosystems is not achieved, even after 6 to 7 years. Finally, our results show seasonal variation in arthropod communities and primer bias.
Introduction
To minimise the negative impact of mining, and similar forms of disturbance, on biodiversity and ecosystem functioning, the mitigation hierarchy (avoidance, minimisation, rehabilitation or restoration, and offsets) sets guidelines to prioritise the actions that should be taken (Rio Tinto, 2004; Bergès et al., 2020). In fact, many countries have a statutory requirement to restore disturbed areas to their original states (SER, 2004) or to rehabilitate them [i.e., restitution of ecosystem structure and functioning, but with a different set of species than the initial ones (SER, 2004; Aronson et al., 2011)]. In order to measure whether biodiversity and/or ecosystem functioning are indeed converging on designated reference (original-state) sites or are moving towards novel assemblages and/or sets of functions (Hobbs et al., 2009), areas under restoration and rehabilitation thus require monitoring (Derhé et al., 2016; McDonald et al., 2016).
Despite the need for monitoring of these areas, no consensus has been reached about which environmental variables are the best indicators for measuring ecosystem state and change (Gastauer et al., 2018, 2020a). However, measurements of vegetation structure such as canopy openness, tree density, vegetation cover and soil organic carbon are commonly used (Wortley et al., 2013; Lorenz et al., 2019). Specifically, basal area, tree density, tree species richness and leaf area index have previously been shown to be important when assessing environmental rehabilitation status (Ruiz-Jaen and Mitchell Aide, 2005; Gastauer et al., 2020a). Alternatively, arthropods can be used, as they directly make up a large proportion of terrestrial biodiversity and because arthropod species diversity and composition closely follow the diversity and composition of plant species (Basset et al., 2012; Zhang et al., 2016), providing a convenient way to measure both sets of taxa.
Arthropods occur in high abundance and are easily sampled in so-called ‘bulk samples’ (Rosenberg et al., 1986). However, morphological taxonomic identification of individual arthropods in such samples requires taxonomic expertise across multiple groups and a significant time investment (Basset et al., 2012). As a result, molecular methods, such as DNA metabarcoding, are increasingly being applied to identify taxa within bulk arthropod samples (Yu et al., 2012; Morinière et al., 2016; Liu et al., 2018). DNA metabarcoding is a synonym for parallel and targeted sequencing of taxonomically informative marker regions (Taberlet et al., 2012). Here, taxonomically informative gene sequences are targeted with a metabarcoding primer set and PCR amplified. The resulting sequences can then be used to generate sample-by-species tables and afterwards as input into standard community-ecology analyses. However, the choice of metabarcoding primer set is an important decision, as PCR amplification bias can occur when having mismatches between the primer and the target sequences (Krehenwinkel et al., 2017). Metabarcoding of bulk arthropod samples has been used to quantify the biological impacts of logging and planting oil palm (Edwards et al., 2014); to characterise the diversity of insect samples in montane landscapes in tropical southern China (Zhang et al., 2016); to monitor temporal changes in arthropod communities in different forest types (Brandon-Mong et al., 2018); to measure biodiversity response to subtle differences in forest environmental condition (Barsoum et al., 2019); to follow changes in an invertebrate community in an ecosystem under restoration after sand mining (Fernandes et al., 2019); and to assess reclamation trajectories after mining (Gervan et al., 2020) [i.e., when the area again has a useful function (SER, 2004)]. However, we are far from defining baselines for assessing rehabilitation and from understanding the multiple factors that influence arthropod diversity in post-mining areas under rehabilitation, such as the season in which samples were collected and primer bias.
An example of areas under rehabilitation can be found in the Carajás region in the Eastern Amazon in Brazil. The region is dominated by evergreen and semideciduous submontane forest formations that cover hillsides and lower portions of the landscape. On mountain tops, banded iron formations outcrop, forming a patchy, hyperdiverse, endemic savanna-like ecosystem, locally known as canga (Nascimento et al., 2019). Open-cast iron mining has transformed evergreen forests and cangas into mine pits and waste piles, which require environmental rehabilitation (Gastauer et al., 2020b). During the mining process, the native vegetation is cut back, the topsoil removed, and together with mine waste, deposited in waste piles (Nascimento et al., 2019). To achieve environmental rehabilitation, the waste-pile benches are hydroseeded with a mix of fertilizers, organic composts, and fast-growing, non-native, non-invasive plant species, to achieve rapid vegetation cover, establish photosynthesis on the site, incorporate biomass into the system, and to attract seed-dispersing fauna. At the same time, seeds of selected native canga and forest species are applied, with the longer-term objective of achieving the restoration of the original canga and native-forest ecosystems.
In this study, we investigate the trajectories of arthropod communities in post-mining areas under environmental rehabilitation in the Carajás region, by using DNA metabarcoding of bulk arthropod samples collected during the dry and rainy seasons from a temporal gradient of waste-pile sites following iron mining and from untouched canga and native-forest reference sites. Specifically, we aim to (i) measure whether the oldest waste piles have or have not achieved restoration of the original assemblages or whether new assemblages are emerging, (ii) assess whether arthropod composition is correlated with local vegetation composition or structure (separately measured) and (iii) assess whether our results are robust irrespective of metabarcoding primer set and season.
Materials and Methods
Study Sites
Using Malaise traps, we collected bulk arthropod samples in September 2017 (dry season) and April 2018 (rainy season) in an iron mining area (06°03′31″S 50°10′37″W) in Carajás National Forest, Pará state, Brazil. The traps were left to collect arthropods for 5 days. A total of 32 bulk arthropod samples were collected: 16 for each season. Propylene glycol was used as the collecting liquid. Traps were installed on waste piles representing different stages after the initiation of environmental rehabilitation, as well as within both undisturbed canga ecosystems and tropical forest located close to the mine as reference sites (Figure 1). Specifically, traps were set in the following locations: three waste piles named West (W), Northwest 2 (NW2) and South 4 (S4), each containing a rehabilitation chronosequence. The different stages of the rehabilitation chronosequence were non-revegetated soils (W), initial stage (one-to-three-year-old stands; NW2, S4), intermediate (four-to-five-year-old stands; W, NW2, S4) and advanced rehabilitation stage (six-to-seven-year-old stands; W, NW2, S4). The two reference forest sites were in NW2 and S4, and the three reference canga samples were collected in a canga patch near waste piles at S4 (Figure 1). Upon collection, samples were transferred to 50 mL Falcon tubes and stored at room temperature until DNA extraction.
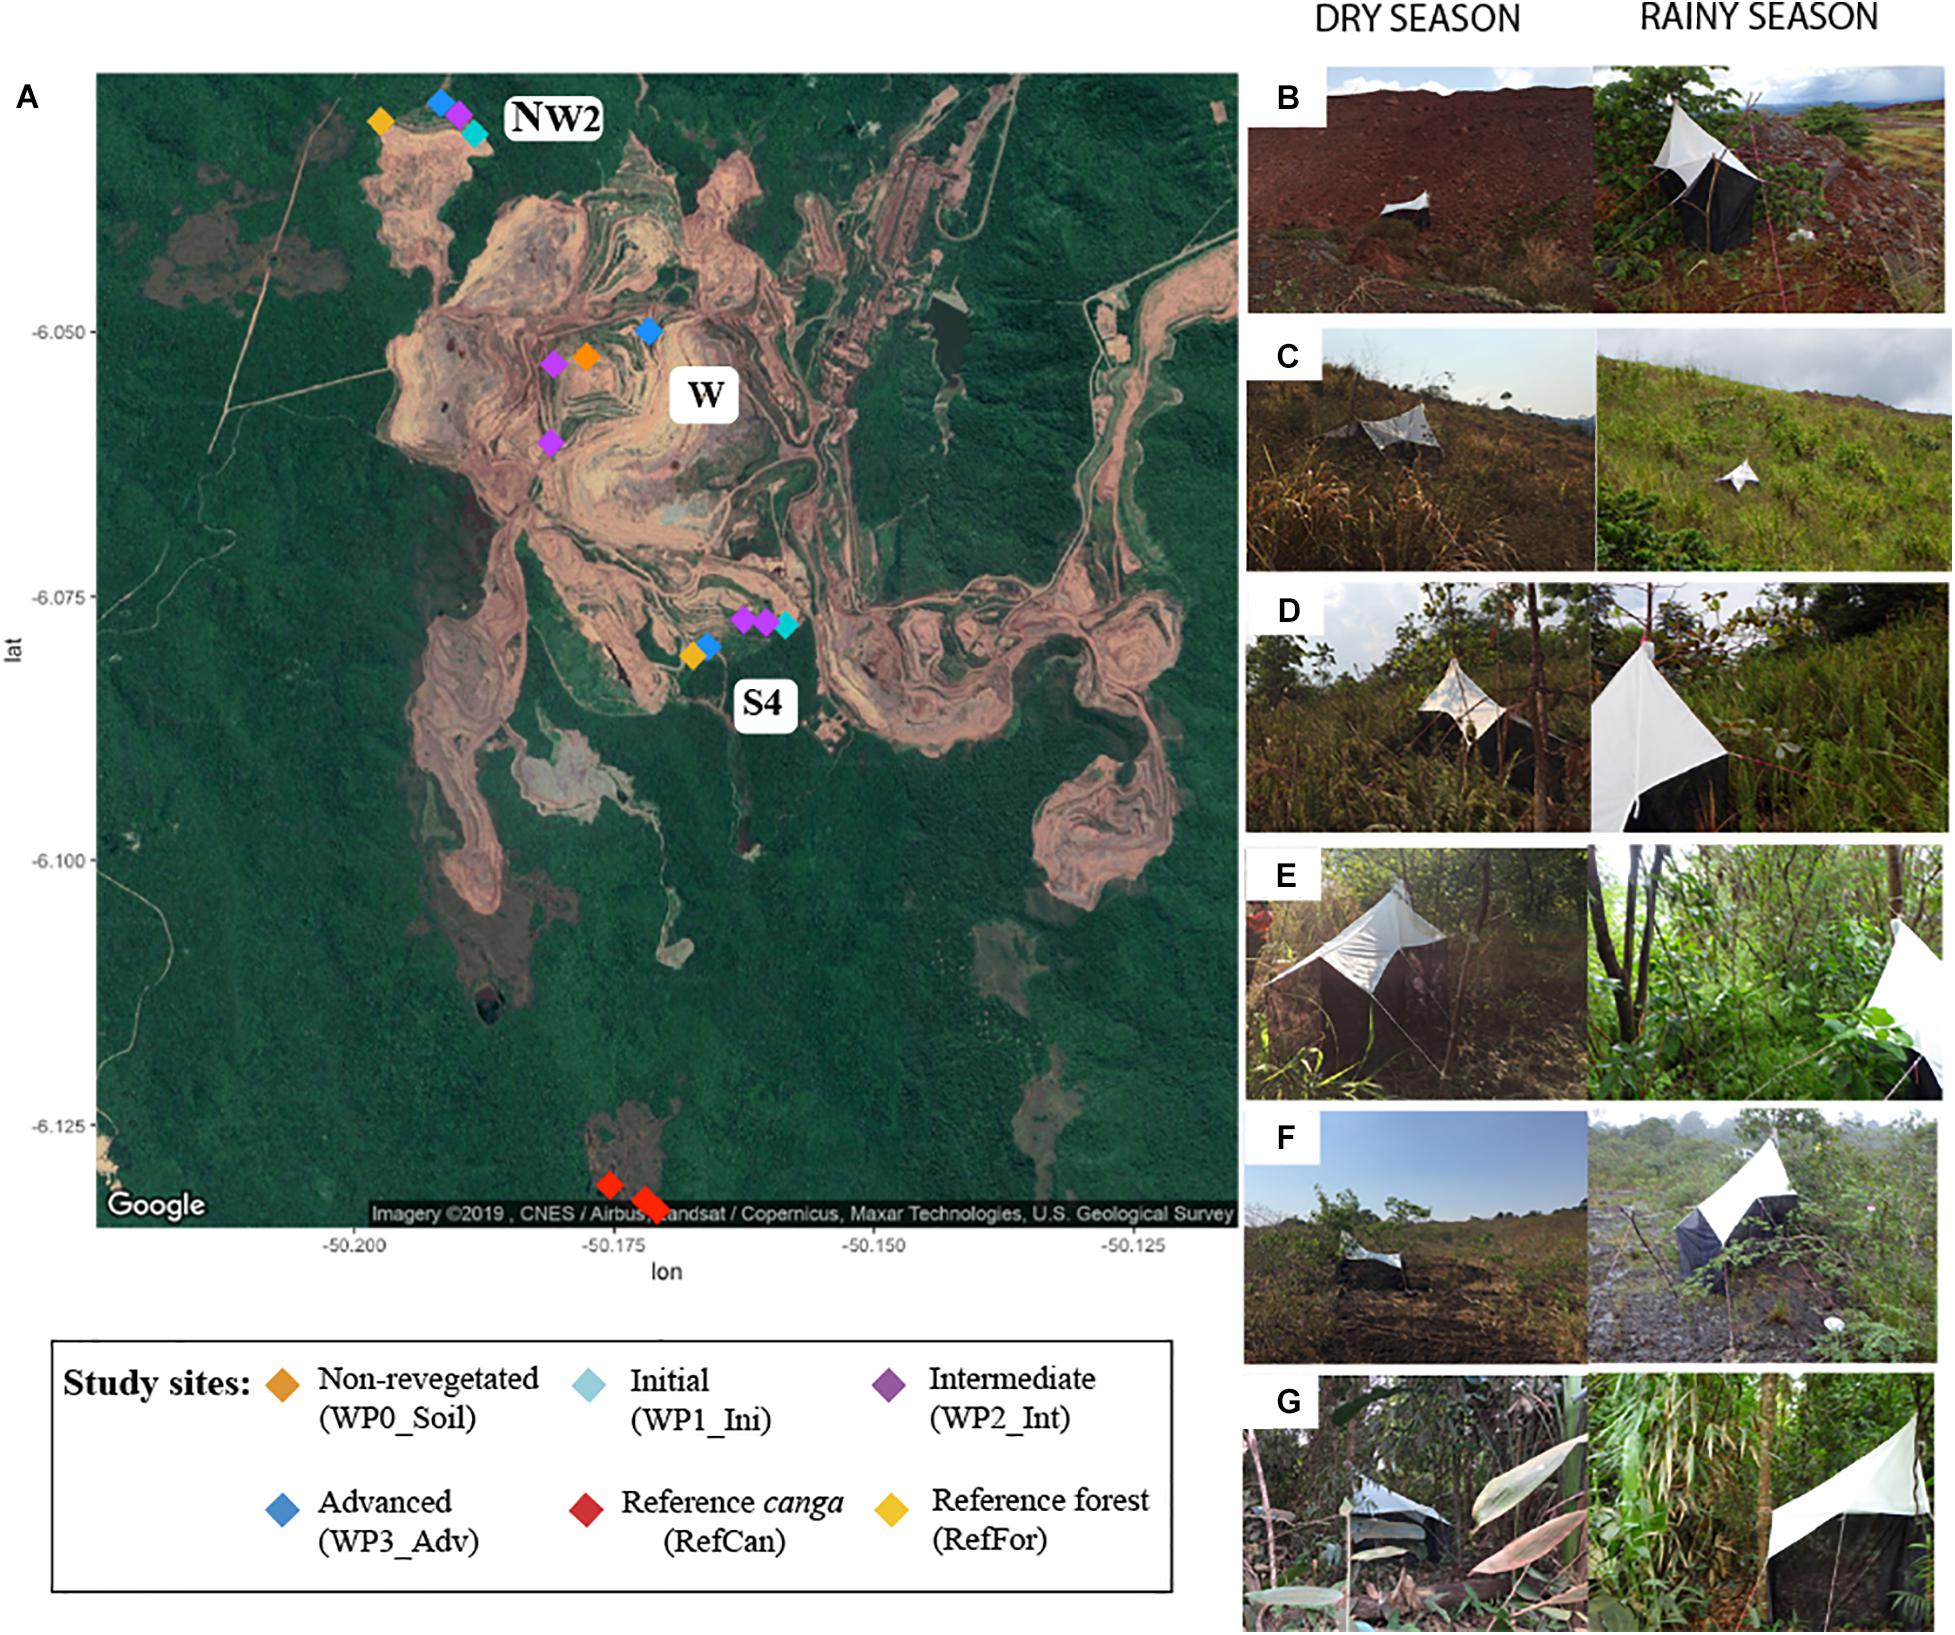
Figure 1. Collection sites in the iron mine in Carajás National Forest, Pará state, Brazil. (A) Map of the mine with sample locations: waste piles (W, NW2 and S4) with different rehabilitation stages (non-revegetated, initial, intermediate, and advanced), reference canga and reference forest sites close to the waste piles. Pictures of some sites: (B) Waste piles with a non-revegetated soil during dry (left) and rainy (right) season showing spontaneous colonization of plants; (C) Waste piles with initial status in dry (left) and rainy (right) season; (D) Waste pile with intermediate status in dry (left) and rainy (right) season; (E) Waste pile with advanced status in dry (left) and rainy (right) season; (F) Reference canga patch in dry (left) and rainy (right) season; and (G) Reference forest in dry (left) and rainy (right) season.
To compare arthropod community composition with vegetation structure and diversity, we tagged and identified all trees with stem diameter at breast height > 3 cm within three plots of 10 × 20 m in each rehabilitation stage from each study site. We estimated tree species richness (S) as the number of species found in each plot, tree density (N) as the number of individual trees in each plot, and basal area (BA) as the cross-sectional area of the tree trunks and stems at breast height. Additionally, the leaf area index (LAI), a surrogate for canopy closure, was measured using a LAI-2200C (LI-COR INC., Lincoln, NE, United States) following the manufacturer’s instructions, in which sky conditions were continuously monitored by a sensor in a site free of vegetation. A second sensor was used to capture two below-canopy readings at each corner and at the centre of each plot, totalling 10 below-canopy readings for each plot. As we retrieved only one bulk arthropod sample per rehabilitation stage per study site, we used the mean values of tree species richness, tree density, leaf area index, and basal area from the three plots from each stage in each waste pile.
DNA Metabarcoding
Prior to DNA extraction, samples were removed from the propylene glycol. DNA was extracted using a non-destructive protocol (Nielsen et al., 2019) modified from Gilbert et al. (2007). To account for possible contamination, a negative extraction control was included every 10 to 20 samples. After DNA extraction, 200 μL of digest were purified using the QiaQuick PCR Purification kit (Qiagen, United Kingdom) following the manufacturer’s protocol with minor modifications. Specifically, after the addition of 50 μL elution buffer, samples were incubated at 37°C for 15 min before centrifugation. DNA extracts were stored in LoBind Eppendorf tubes at −18°C until further processing.
Two metabarcoding primer sets were used to PCR amplify arthropod COI markers in DNA extracted from the bulk arthropod samples: (i) ZBJ-ArtF1c (forward 5′-AGATATTGGAACWTTATATTTTATTTTTGG-3′) and ZBJ-ArtR2c (reverse 5′-WACTAATCAATTWCCAAATCCTCC-3′; Zeale et al., 2011) amplifying a ca. 157 bp fragment of the COI gene, hereafter referred to as ‘Zeale’ and (ii) mlCOIintF (forward 5′-GGWACWGGWTGAACWGTWTAYCCYCC-3′) and jgHCO2198 (reverse 5′-TAIACYTCIGGRTGICCRAARAAYCA-3′; Geller et al., 2013; Leray et al., 2013) amplifying a ca. 313 bp region of the COI gene, hereafter referred to as ‘Leray’. Nucleotide tags were added to the 5′ end of primers to allow for parallel sequencing (Binladen et al., 2007). Nucleotide additions consisted of seven to eight nucleotides on both forward and reverse primers, of which six nucleotides were tags and one to two nucleotides were added to increase complexity on the flow cell (De Barba et al., 2014).
Prior to metabarcoding PCR amplification, a subset of the DNA extracts and all negative controls were screened using quantitative PCR (qPCR). This was done to screen for the optimal cycle number, in order to avoid using excessive PCR cycle numbers in the following metabarcoding PCR (Krehenwinkel et al., 2017), to screen for PCR inhibitors by using dilution series (Murray et al., 2015) and to assess contamination [applied in, for example, Bohmann et al. (2018)]. The 20–25 μL qPCR reactions (20 μl for rainy season, 25 μl for dry season) consisted of 1 μL DNA template, 1x Gold PCR Buffer (Applied Biosystems), 2.5 mM MgCl2 (Applied Biosystems), 0.2 mM dNTP mix (Invitrogen), 0.75U AmpliTaq Gold (Applied Biosystems), 0.5 mg/ml Bovine Serum Albumin (BSA; Bio Labs), 0.6 μL of each of the 5′ tagged forward and reverse primer and 1 μl of SYBR Green/ROX solution [one part SYBR Green I nucleic acid gel stain (Invitrogen), four parts ROX Reference Dye (Invitrogen) and 2000 parts high-grade DMSO (Sigma-Aldrich)]. PCR master mixes were set up in a dedicated no-DNA laboratory to minimize contamination risk. The PCR parameters for the Zeale primer were: 95°C for 10 min, 40 cycles of 95°C for 15 s, 52°C for 30 s, then 72°C for 30 s and finally a dissociation curve. For the Leray primer, the PCR parameters were: 95°C for 10 min, 40 cycles of 95°C for 15 s and 51°C for 30 s, then 72°C for 60 s and finally a dissociation curve.
For DNA metabarcoding, tagged PCR was carried out with three PCR replicates for each sample extract, negative extraction control, and positive control. Two positive controls were used: one consisting of a mix of DNA from Locusta migratoria (order: Orthoptera), Tenebrio molitor (order: Coleoptera) and Galleria mellonella (order: Lepidoptera; used with samples from the dry season) and one consisting a mix of DNA from L. migratoria, T. molitor and Blaptica dubia (Blattodea; used with samples from the rainy season). PCR negative controls were added for every seventh PCR product. PCR amplifications were performed using matching nucleotide tags (e.g., forward primer tag 1 – reverse primer tag 1, forward tag 2 – reverse tag 2, etc.) to account for potential tag-jumps and to avoid false assignment of sequences to samples (Schnell et al., 2015). The three PCR replicates made for each sample DNA extract, negative extraction control, and positive control were carried out with unique tag combinations. PCR reactions were prepared as the qPCRs, except for the omission of SYBR Green/ROX solution and, in the PCR parameters, the replacement of the dissociation curve with a final extension time of 72°C for 7 min. As the qPCR screening showed no PCR inhibition when using undiluted DNA extracts, 1 μl of undiluted DNA extract was used in all metabarcoding PCRs. Further, based on the qPCR screening the following cycle numbers were used: for the Leray primer, 35 and 32 cycles were carried out for the dry and wet season, respectively, while for the Zeale primer, 32 and 28 cycles were carried out for the dry and rainy season, respectively.
Following PCR amplification, PCR products were visualized on 2% agarose gel using GelRed against a 50 bp ladder. All negative controls appeared negative. Prior to library build, PCR products were pooled. Only samples that showed amplification in at least two PCR replicates were pooled. If a sample only had two replicates showing amplification, only those two replicates were added to the pool. PCR products from positive controls and from negative extraction controls were included in the pooling. Amplicon pools were purified using MagBio HighPrep beads (LabLife) and a 1.6x bead-to-amplicon pool ratio and eluted in 35 μl EB buffer (Qiagen). Purified amplicon pools were built into libraries using the TagSteady protocol (Carøe and Bohmann, 2020). Libraries were purified using MagBio HighPrep beads (LabLife) and a 0.8x bead-to-amplicon pool ratio, eluted in 30 μl EB buffer (Qiagen) and quantified using the NEBNext Library Quant Kit for Illumina (New England Biolabs Inc.). Amplicon pools were pooled at equimolar ratio and sequenced 250 bp PE on an Illumina MiSeq v2 sequencing platform at the National High-throughput DNA Sequencing Centre at the University of Copenhagen aiming at 25,000 paired reads per PCR replicate.
Data Analysis
Bioinformatic Processing
Sequence data from each primer set and for each season was processed separately. AdapterRemoval v2.2.2 (Schubert et al., 2016) was used to remove Illumina adapters and low quality reads, and to merge the paired reads. The Begum package1 was used to demultiplex sequences based on primer and tag sequences within each amplicon library. For this, two mismatches to primer sequences and no mismatches to tag sequences were allowed. Begum was then used to filter sequences across each of the two to three PCR replicates per sample. Thresholds for filtering sequences followed a restrictive approach as determined by the sequenced negative and positive controls (Alberdi et al., 2018a). Specifically, we retained only sequences that were present in at least two of the two to three PCR replicates per sample, with a minimum copy number of 10 sequences per PCR replicate. To determine the best clustering values, clustering parameters were assessed for each dataset using SUMATRA (Mercier et al., 2013). Based on these results, SUMACLUST was used to cluster sequences into operational taxonomic units (OTUs) with a similarity score of 97% and create a sample-OTU table. To detect and delete erroneous OTUs from the sample-OTU table, curation of the sequences was done using the LULU algorithm with default settings (Frøslev et al., 2017). No OTUs were assigned to the negative extraction controls, and none of the OTUs found in the positive controls were detected in the bulk arthropod samples, indicating no cross-contamination.
Taxonomy was assigned to the OTU sequences using BLASTn against the NCBI Genbank database2, and the output imported into MEGAN Community Edition v6.12.7 (Huson et al., 2016) using a weighted LCA algorithm with 80% coverage, top percent of 10, and a min. score of 150. Taxonomic order, family and genus information was complemented with data retrieved using the GBIF sequence ID function3. OTUs that could not be taxonomically identified as arthropods were discarded from further analyses. Taxonomic names were verified with information retrieved from the Integrated Taxonomic Information System (ITIS)4. The OTU table was converted into a presence/absence dataset, as the number of sequences per OTU is not a reliable measure of absolute abundance (Yu et al., 2012; Nichols et al., 2018). Finally, taxonomic diversity was visualised using Krona charts (Ondov et al., 2011).
Community Analysis
Analyses were performed using R 3.5.1 (R Core Team, 2018). To visualise the community composition between samples, we ran a constrained principal coordinate analysis (PCoA) ordination using cmdscale from stats v.3.5 package, with Jaccard dissimilarity matrices computed using vegdist from vegan 2.5–6 (Oksanen et al., 2019). To test for differences in composition between rehabilitation stages and reference sites, we used mvabund v.4.0.1 (Wang et al., 2012). This was done using the summary.manyglm function in mvabund and p-values we had corrected for multiple tests using the p.adjust (method = fdr) function implemented in base R. Differences in arthropod communities between rehabilitation stages (across sites) and between sites (across rehabilitation stages) in the mine were further visualised with an intercept diagram using UpSetR 1.4.0 (Conway et al., 2017). Moreover, to partition beta diversity into turnover and nestedness for waste piles in each location, we used betapart 1.5.1 (Baselga and Orme, 2012) using Jaccard dissimilarities. Vegetation data such as basal area (BA), tree density (N), tree species richness (S), and leaf area index (LAI) were fitted on this ordination using the function envfit from vegan. A smooth response surface was fitted using the ordisurf function, as a linear relationship cannot be assumed. As LAI data are not available for the canga, community data from these sites were removed before fitting that vegetation data. To identify the taxa driving the community differences between the study sites (the waste piles and the reference sites) in each season, taxonomic heat trees were plotted using metacoder 0.3.3 (Foster et al., 2017) using the combined information from both primer sets for a more complete overview, and using presence and absence data.
To investigate the estimated OTU richness (Chao2, q of 0) and Shannon diversities (q of 1), we used the function specpool in vegan and iNEXT 2.0.19 (Hsieh et al., 2016). In addition, to compare the estimated species richness between rehabilitation stages, we performed a Welch’s t-test with a Bonferroni correction. Although clustering parameters were assessed during bioinformatic processing, it is possible that OTUs were oversplit, which would make alpha diversity estimates based on phylogenetic diversity more robust (Wang et al., 2019). To obtain information about the phylogenetic diversity of arthropods in each site, curated OTU sequences for each primer set were aligned using muscle v3.8.31 (Edgar, 2004). To build an ultrametric phylogenetic tree, a Bayesian phylogenetic inference was performed using a Markov chain Monte Carlo (MCMC) with 10,000,000 steps using BEAST 2.5 (Bouckaert et al., 2019), outputting trees every 1,000 steps. The resulting 10,000 trees were analysed with Tracer v1.7.1 (Rambaut et al., 2018) and burned using the burntrees.pl script (available at https://github.com/nylander/Burntrees/blob/master/README.md), leaving only the last 5%. These 500 trees were summarised on a maximum clade credibility tree produced with TreeAnnotator v2.5.2 (Drummond and Rambaut, 2007; Bouckaert et al., 2019) with node represented by median heights. This ultrametric tree was used in iNextPD v.0.3.2 (Hsieh and Chao, 2017) to visualise differences in arthropod phylogenetic coverage between the sites. Finally, to perform multiplicative diversity partitioning (i.e., partition diversity into independent alpha and beta diversity components) for each location in the mine, we used the multipart function in vegan using 999 simulations.
Results
After the filtering steps, the number of OTUs detected per season and per primer set were as follows: for samples collected during the dry season, 327 OTUs for the Leray primer set and 205 OTUs with Zeale, and for samples collected during the rainy season, 234 OTUs using the Leray primer and 252 OTUs with the Zeale primer. The number of reads after each filtering step can be found in Supplementary Table 1. The detection of arthropod taxonomic groups, especially within insects, differed between the two metabarcoding primer sets. The Leray primer detected more insect orders (14 in dry season and 12 in rainy season), with the orders Lepidoptera, Diptera, Hemiptera, and Hymenoptera having the most taxa. In contrast, the Zeale primer set detected arthropods within fewer orders (9 in both seasons), mainly within the orders Diptera and Lepidoptera, with the detection of taxa within other orders occurring at lower frequencies (Supplementary Figure 1). As more OTUs and arthropod taxa were detected with the Leray primer and some of the community composition analyses show similar results, we report here the Leray primer results only. The results from the Zeale primer set can be found in Supplementary Information.
Arthropod Community Composition
A constrained principal coordinate analysis (PCoA) ordination was carried out to visualise the community composition between samples. The PCoA ordinations show that the arthropod community composition in the reference sites, and especially canga, was different compared to the waste piles. In spite of having few sampling points, in both seasons waste piles under rehabilitation for a longer time (intermediate and advanced) had community compositions that were more similar to the reference forests (Figure 2 and Supplementary Figure 2). In contrast, the community composition of waste piles with a non-revegetated soil, was the most dissimilar to the arthropod community of the reference sites. To test for differences in the community composition between waste piles and the reference sites, a contrast test was done. Although with low statistical power (Supplementary Tables 2, 3), waste piles with non-revegetated soil had community compositions that were significantly different from the rest of the waste piles and the reference sites (Table 1). In contrast, the older waste piles (intermediate and advanced) were not significantly different from the reference sites.
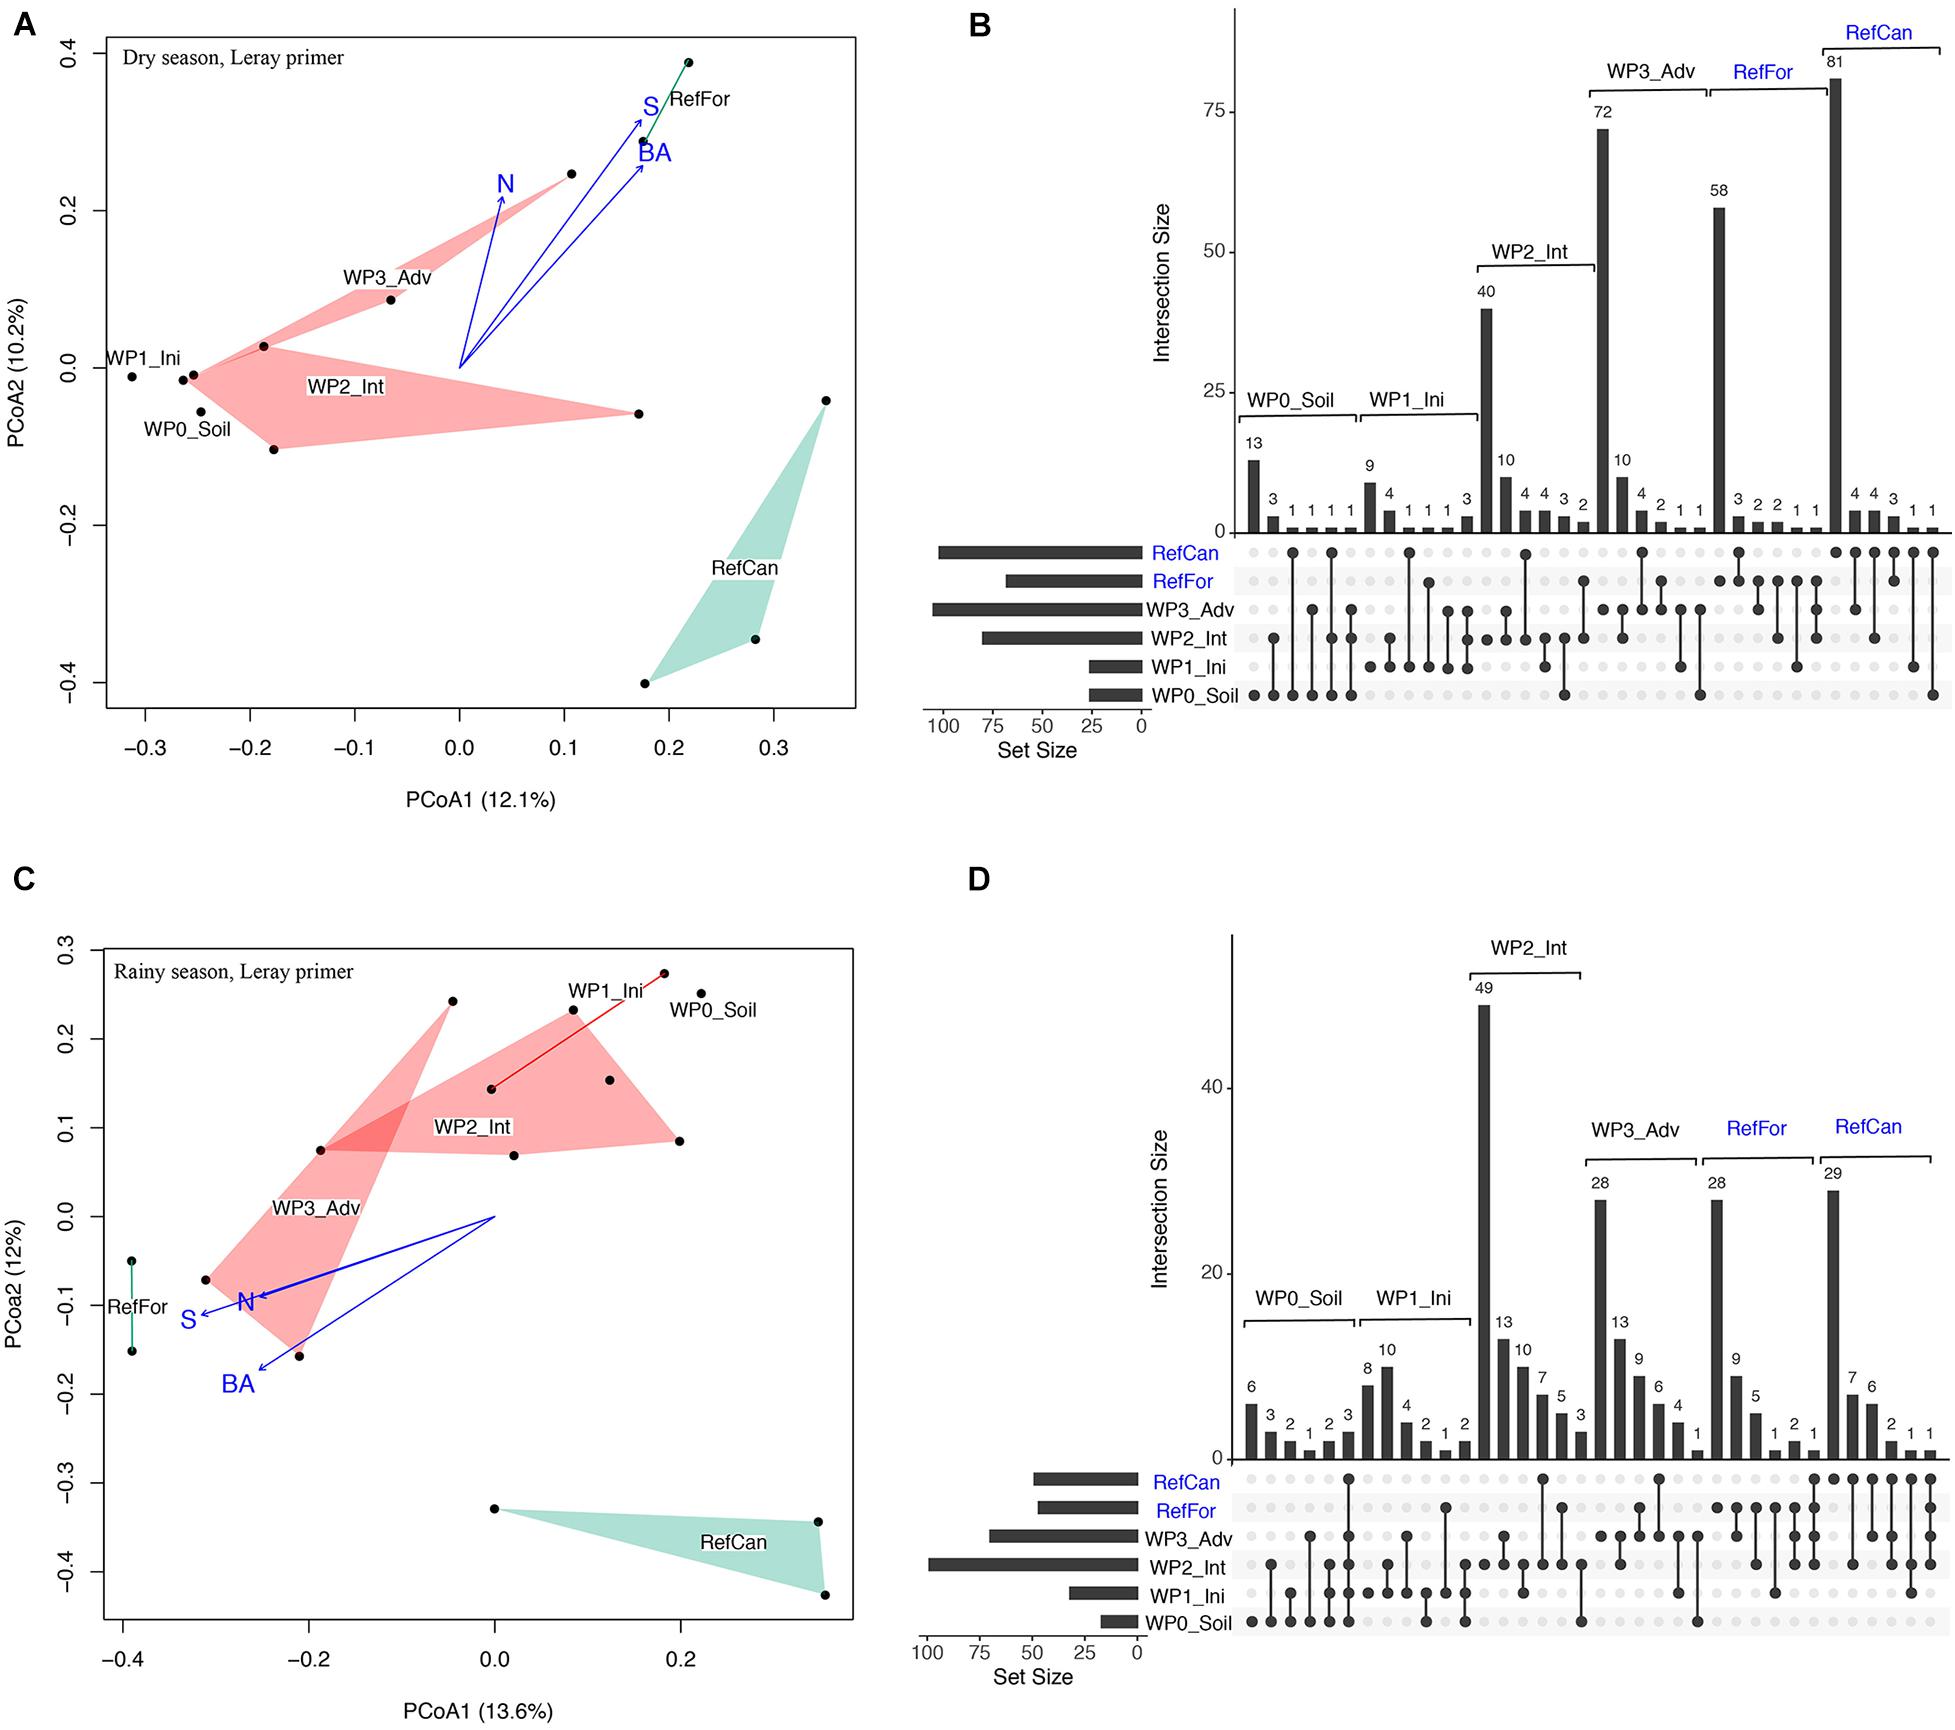
Figure 2. Arthropod community composition for waste piles and reference sites in the dry and rainy season. Dry season: (A) Principal coordinate analysis (PCoA) ordination of the Jaccard dissimilarity of the arthropod community from waste piles (red) and reference sites (green). Fitted vegetation information such as basal area (BA), tree density (N) and tree species richness (S). Points represent samples, polygons added using the ordihull function. (B) UpSetR intersection diagram of unique and shared OTUs in the study sites. Horizontal lines on the left indicate the total number of OTUs in each site. Reference sites are marked in blue. Rainy season: (C) Principal coordinate analysis (PCoA) ordination of the Jaccard dissimilarity of the arthropod community from waste piles (red) and reference sites (green), (D) UpSetR intersection diagram of unique and shared OTUs in the study sites. Code for study sites as in Figure 1. All data is from the ‘Leray’ dataset.
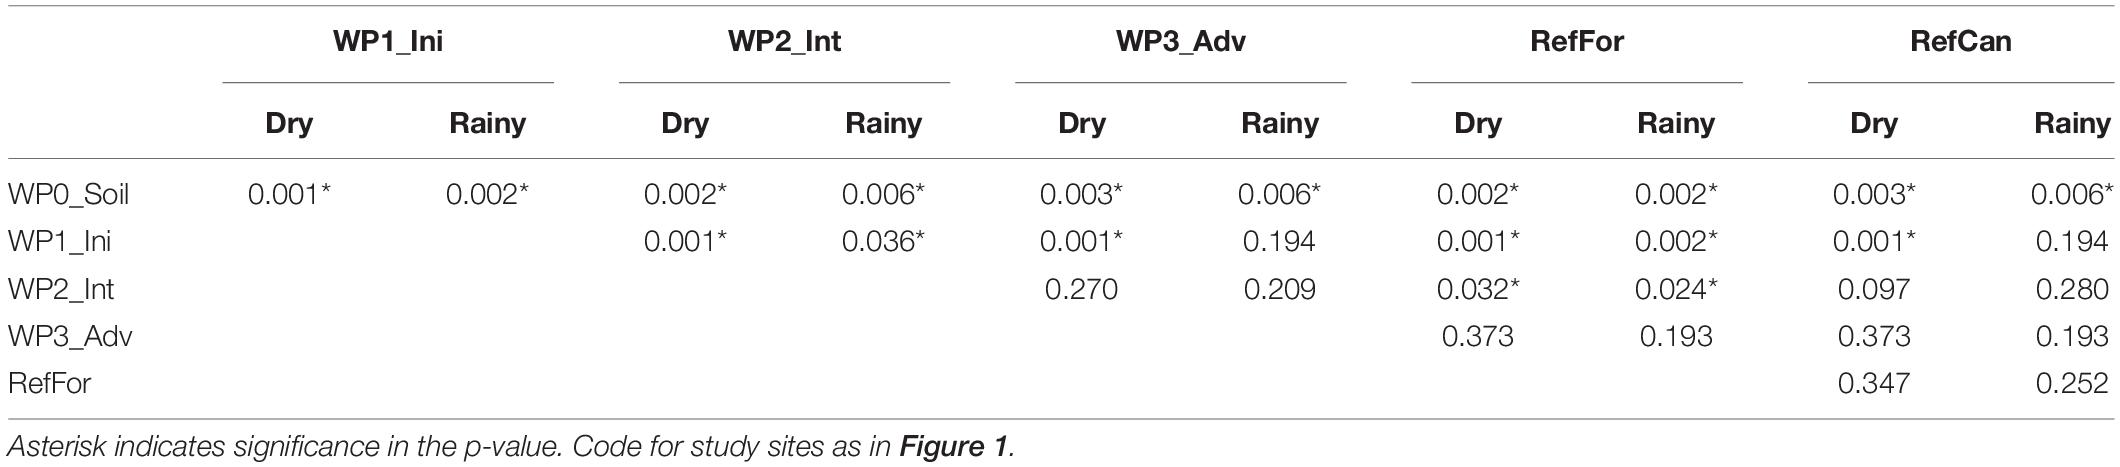
Table 1. Results from the corrected p-values (method = fdr) of the mvabund analyses to test differences between the waste piles for samples collected during the dry and the rainy season from the ‘Leray’ dataset.
An UpSetR diagram was used to supplement the PCoA ordinations and visualise shared arthropod OTUs between rehabilitation stages. These diagrams show that, for both seasons, all study sites had a high number of unique OTUs, with the exception of the waste piles with non-revegetated soil and an initial stage (Figure 2 and Supplementary Figure 2). Waste piles with an intermediate and advanced rehabilitation stage shared the greatest number of arthropod OTUs with reference sites. Moreover, waste piles shared more OTUs during the rainy season than during the dry season. This shows that, although most of the detected arthropods can fly, the interchange of taxa between sites is hindered, especially in the dry season.
The betapart analysis was carried out to determine whether the changes in the community composition were due to turnover or nestedness. We found that the observed changes are mainly due to successional turnover in the following sites: waste piles located in S4 for samples collected during the dry season (p-value < 0.01), and waste piles located in S4 and W for the rainy season (p = 0.001 and p < 0.01, respectively). These results relate to the high number of unique OTU in each site.
Next, we investigated the influence of the waste piles’ spatial distribution within the mine. Given the high number of unique OTUs, diversity was partitioned into independent alpha and beta diversity components. The results of this analysis show that, for both seasons, alpha diversity (Alpha. 1) was higher than expected within the samples, assuming a completely random taxa distribution (Supplementary Table 4). However, this analysis showed different results for the beta diversity. On the one hand, species turnover (Beta. 1) in both seasons was lower between rehabilitation stages than would be expected by chance. On the other hand, although spatial turnover between locations (Beta. 2) was also lower than would be expected by chance during dry season, during rainy season it met random expectations. This shows that the spatial distribution of the waste piles had an impact in the arthropod community composition.
Arthropod Community and Vegetation Structure
To investigate relations between arthropod community and vegetation structure in the study sites, we measured vegetation diversity and structure and compared it to arthropod community composition. Values for basal area (BA) and leaf area index (LAI) increased in line with the age of the waste pile; non-revegetated waste piles had the lowest values (0 m2 BA and 0.467 LAI), whereas advanced waste piles had the highest (825.913 m2 BA and 3.441 LAI). However, tree density (N) and tree species richness (S) had overlapping values between intermediate and advanced waste piles (Table 2). Correlations between arthropod composition and vegetation structure were found for BA and S during the dry season and for BA, N, S and LAI during the rainy season (Supplementary Figure 3). Different correlations were found with the Zeale primer, as there was a correlation with all vegetation data, except for N during the dry season. This illustrates the impact of primer bias.
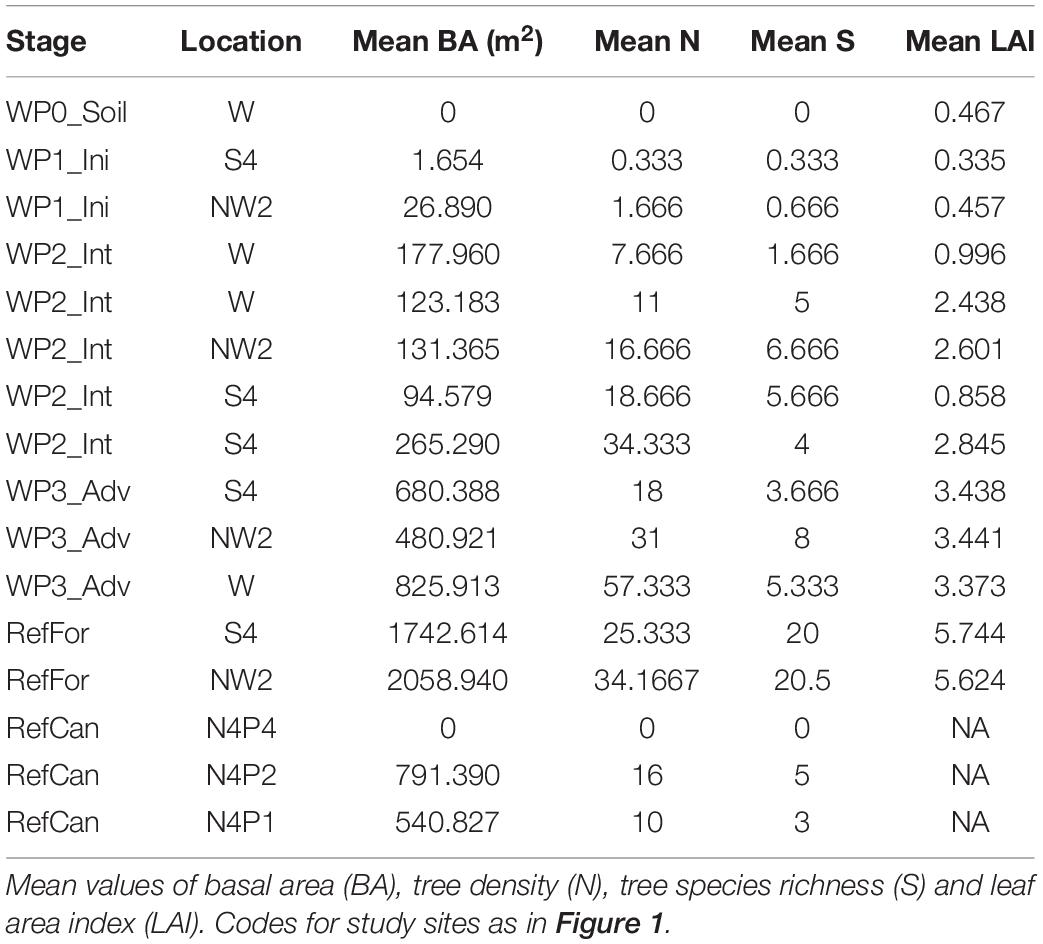
Table 2. Vegetation data from waste piles under rehabilitation and reference sites where bulk arthropod samples were collected.
Taxonomic Composition of the Chronosequences and Reference Sites
When combining the community data of both primer sets, a total of 17 orders and 76 families were detected in samples collected during the dry season and 15 orders and 75 families in the rainy season (Figure 3). The detected arthropods include predators (e.g., centipedes from the family Scutigeridae), disease vectors (e.g., dipterans from the family Tabanidae), pollinators (e.g., lepidopterans from the families Noctuidae and Geometridae), plant parasitoids (e.g., coleopterans from the family Curculionidae) and animal parasitoides (e.g., dipterans from the family Tachinidae).
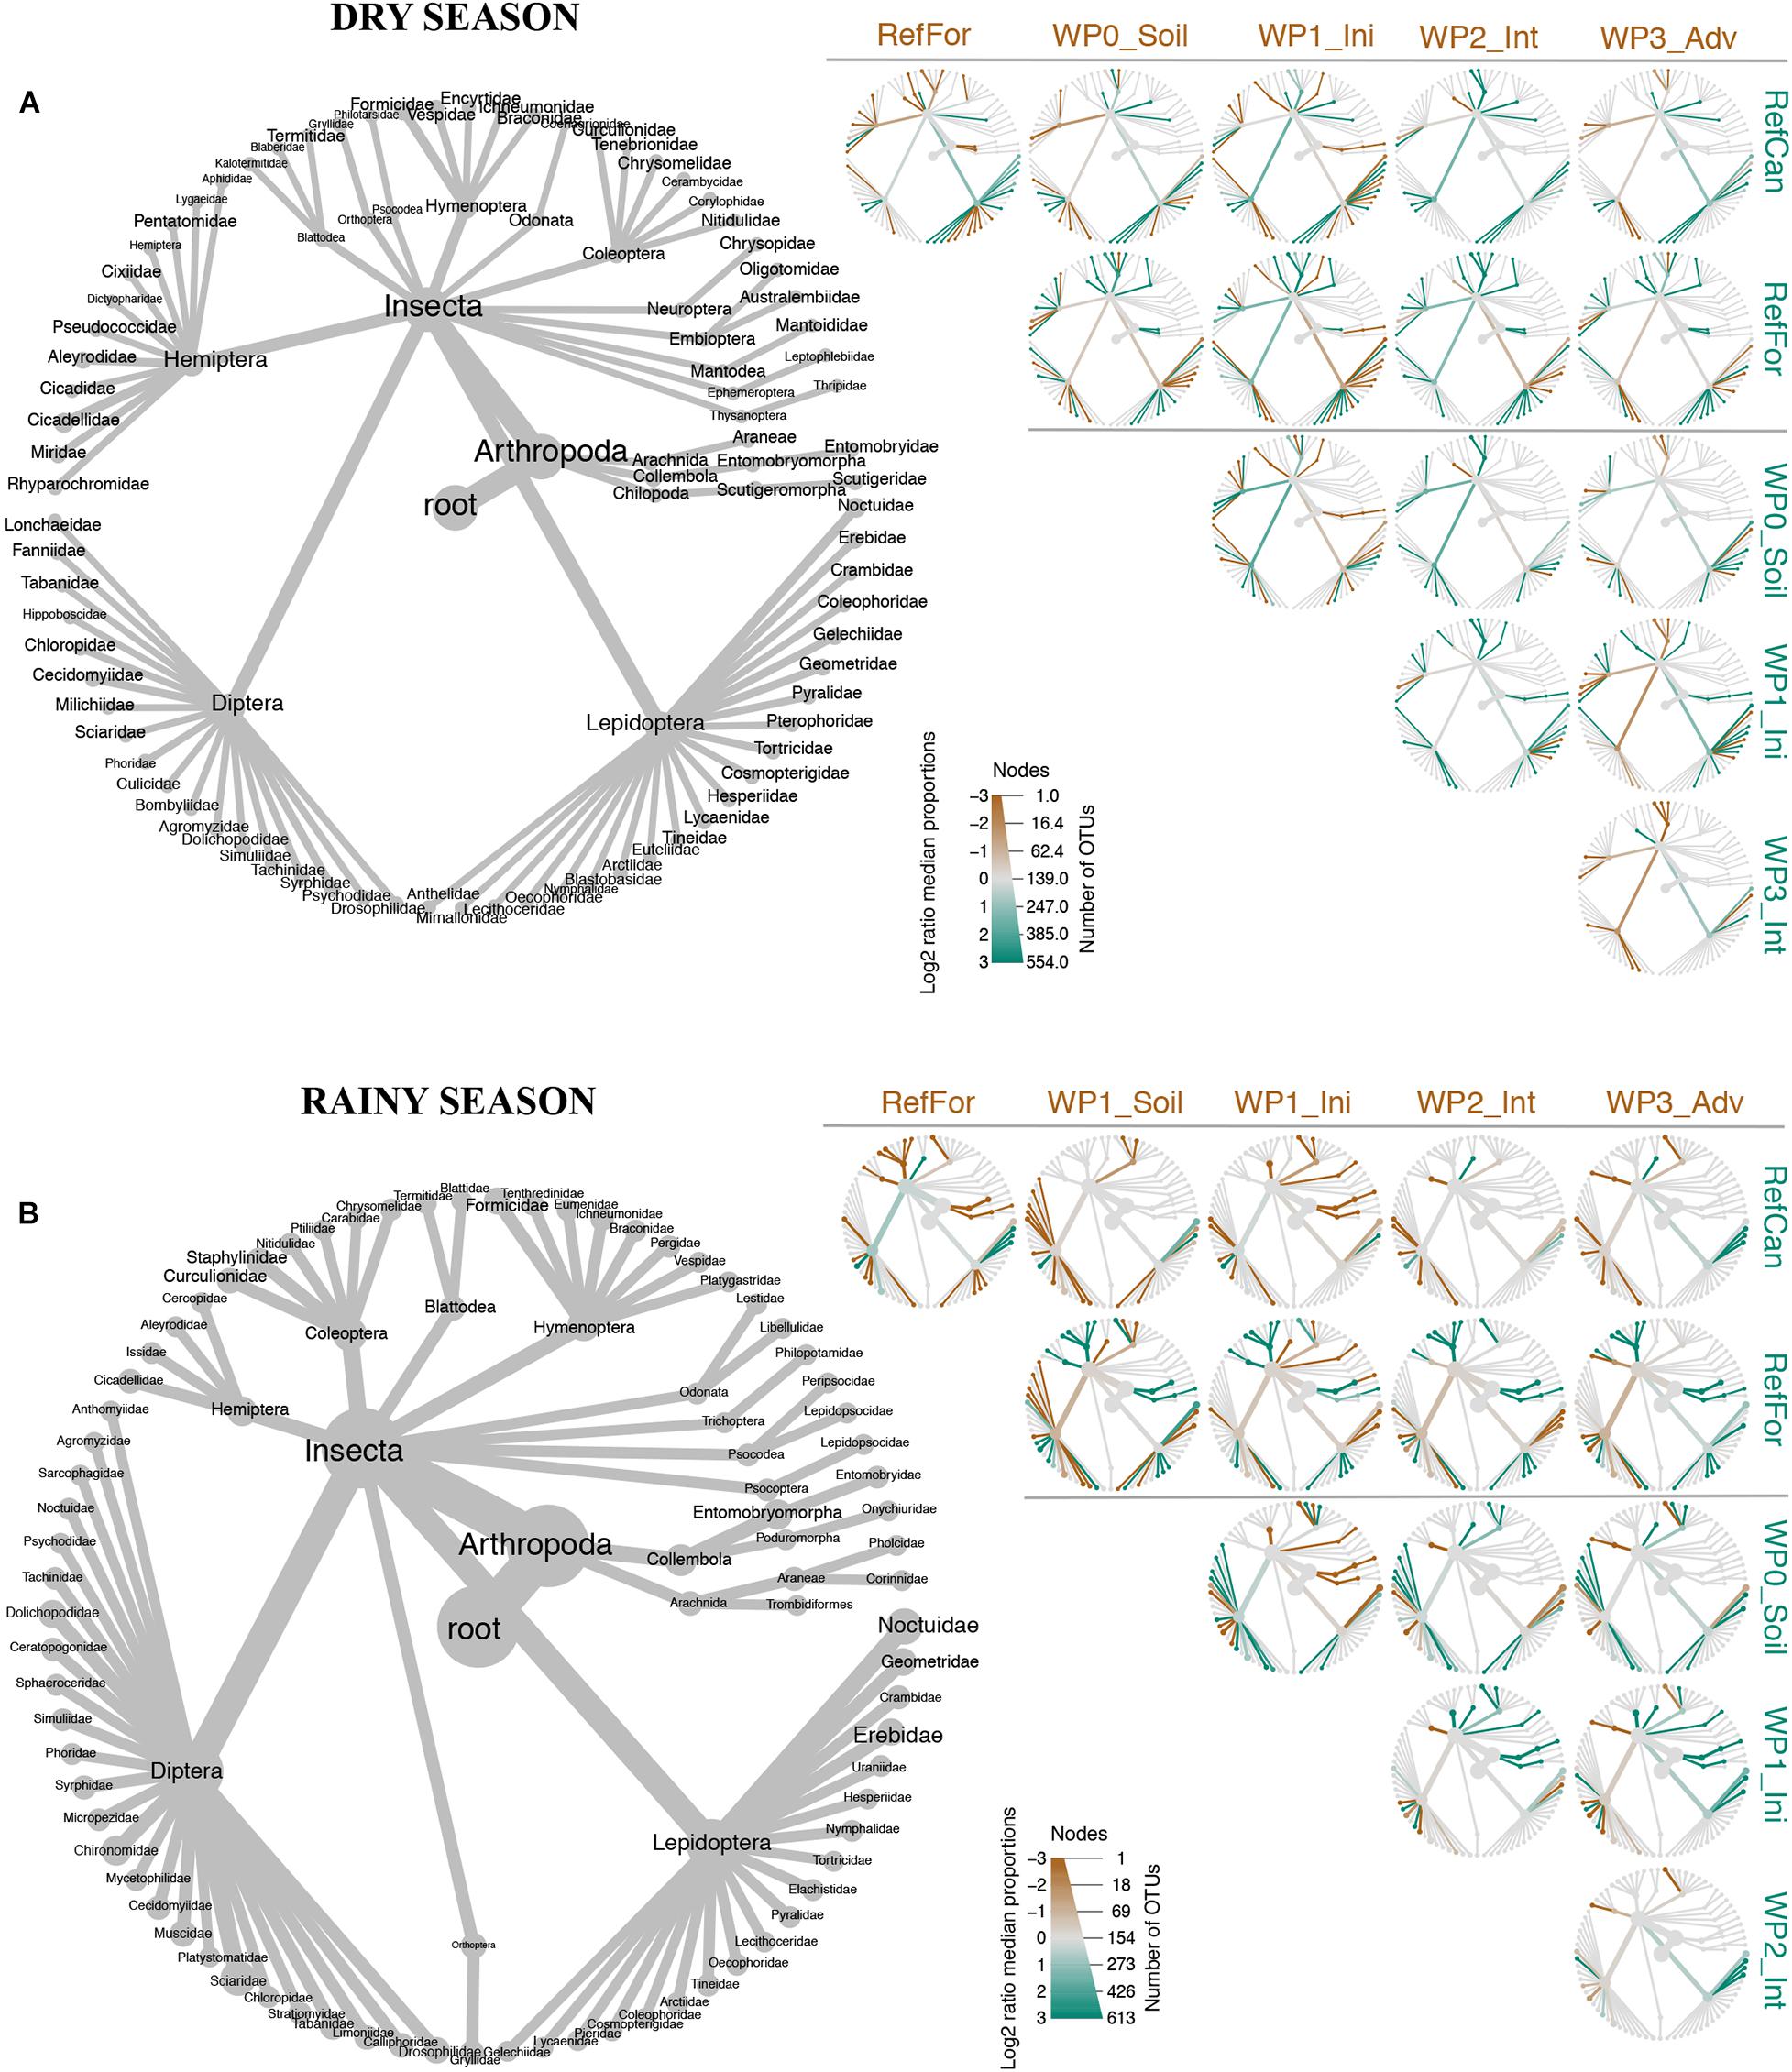
Figure 3. Heat-tree built with metacoder showing pairwise taxonomic comparisons between study sites. Combined information from both ‘Leray’ and ‘Zeale’ datasets. (A) Dry season. (B) Rainy season. Brown branches represent taxa that are more abundant (times that OTU was detected) in sites in the top of the columns. Green branches represent taxa from the sites in the row to the right. Node size is related to the number of OTUs belonging to that rank. Code for study sites as in Figure 1.
The trees built with metacoder show differences between rehabilitation stages of waste piles. During the dry season, samples from waste piles without revegetated soils had higher numbers of OTUs within the families Lygaeidae (Hemiptera), Dolichopodida (Diptera), and Pyralidae (Lepidoptera) than samples collected in the rest of the sites. In contrast, the families Coenagrionidae (Odonata), Kaloternbidae (Blattodea), Pentatomidae (Hemiptera), Noctuidae (Lepidoptera) and collembolans (Entomophryomorpha) were more abundant in initial stages than in the rest of the sites. Intermediate stages had higher abundance of the order Blattodea and the family Torticidae (Lepidoptera), whereas the families Formicidae (Hymenoptera), Aleyrodidae (Hemiptera), Syrphidae (Diptera) and Erebidae (Lepidopetera) were more abundant in the advanced stages. Differences between waste piles and reference sites were also observed in the dry season. In general, lepidopterans were more abundant in waste piles, whereas reference forest had more arachnids, coleopterans from the family Curculionidae, hymenopterans from the families Formicidae, Vespidae and Ichneumonidae, orthopterans of the family Gryllidae and the lepidopteran family Nymphalidae. In the same season, arthropods from the orders Coleoptera, Embioptera, Psocodea, Hymenoptera and the lepidopteran families Anthelidae, Mimallonidae and Lecithoceridae were more abundant in the reference cangas compared to the waste piles. From all the waste piles, those at an advanced rehabilitation stage also had a higher number of hymenopterans from the family Formicidae, as in the reference forest (Figure 3).
The metacoder trees for samples collected during the rainy season, show that samples from waste piles with non-revegetated soil had had higher numbers of OTUs within insect families such as Sciaride (Diptera), Ichneumonidae (Hymenoptera) and Geometridae (Lepidoptera). In the initial stages, coleopterans, blattodeans, arachnids, collembolans and the families Libeluliidae (Odonata), Eumeridae (Hymenoptera), Micropeziidae (Diptera) and Noctuidae (Lepidoptera) were more abundant than in the rest of the sites. Families such as Crambidae (Lepidoptera) and Muscidae (Diptera) were more abundant in intermediate stages, and Formicidae (Hymenoptera), Cicadeliidae (Hemiptera) and Chironomidae (Diptear) in advanced stages. Further, the arthropod communities in waste piles had more dipterans and lepidopterans from the families Geometridae and Erebidae, compared to the reference forest. Nevertheless, in the reference forest we detected more collembolans, especially from the family Entomobryomorpha, coleopterans (e.g., from the families Chrysomelidae, Carabidae, Staphylinidae and Curculionidae), arachnids and hymenopterans from the family Formicidae. The waste pile benches that had fewer lepidopterans and more hymenopterans from the family Formicidae, were benches in the advanced rehabilitation stage. For the reference cangas, the arthropod community differed from the waste piles due to a higher number of lepidopterans from the family Crambidae and dipterans from the family Chironomidae and a lower number of hymenopterans. Advanced waste piles also presented a higher number of Chironomidae dipterans than the rest of the waste piles (Figure 3). Overall, there were more similarities in the arthropod taxa between advanced waste piles and reference forests than with reference cangas. The dissimilarities in these arthropod taxa drove the beta diversity results visualized with the PCoA ordination and UpSetR diagram (Figure 2 and Supplementary Figure 2).
OTU Richness and Phylogenetic Diversity
To investigate differences in the alpha diversity between study sites (the waste piles and the reference sites) and seasons, observed and estimated species richness were calculated and plotted. In both seasons, and for both primer sets, there were different numbers of observed species in waste piles within the same rehabilitation stage in the different locations (Figure 4). Nevertheless, the Chao2 estimators indicate no significant differences in estimated species richness between rehabilitation stages (Supplementary Table 5). The iNEXT analyses reveal that waste piles at an intermediate and advanced stage present the highest richness (Figure 4). Seasonal differences are especially apparent in the intermediate stages, which during the dry season present lower asymptotic estimated species richness and Shannon than in the advanced stages, although during the rainy season they are the same. Interestingly, in both seasons, the species present in these sites are relatively evenly distributed, as the diversity decreases very slightly when increasing the order of diversity q of 0 (species richness) to q of 1 (Shannon diversity).
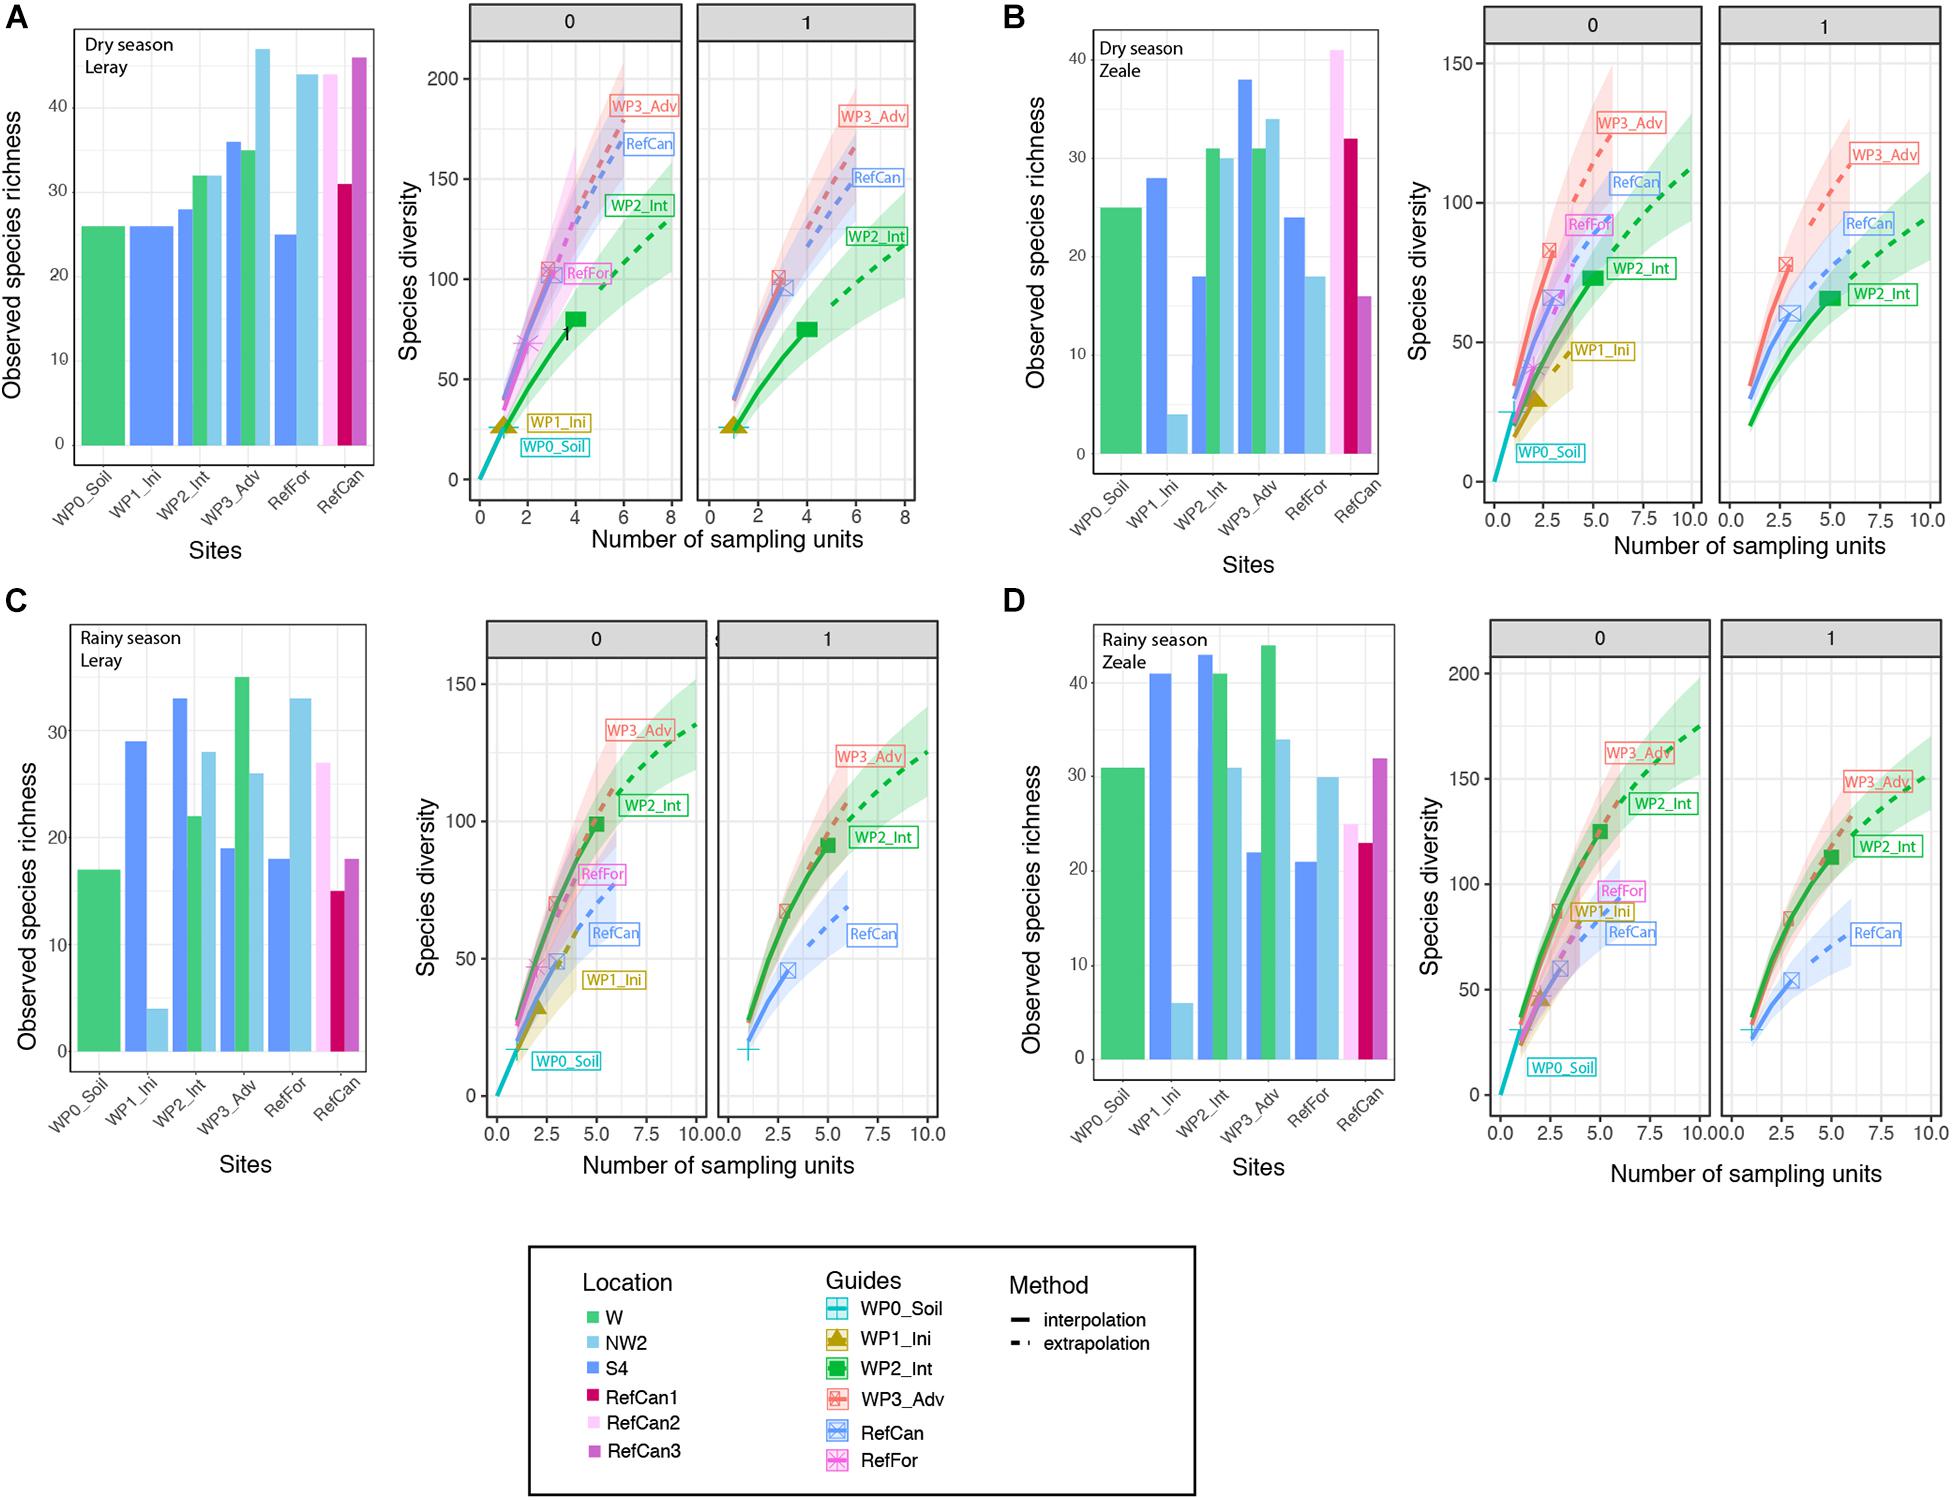
Figure 4. Observed arthropod species richness and iNEXT estimates of total species richness of order of diversity 0 (species richness), 1 (Shannon diversity) of bulk arthropod samples collected at different sites in the mine. Dry season: (A) ‘Leray’ dataset, (B) ‘Zeale’ dataset. Rainy season: (C) ‘Leray’ dataset, (D) ‘Zeale’ dataset. Code for study sites as in Figure 1.
Differences in the distribution of OTUs in relation to the total phylogenetic diversity detected in the sites can be observed between the waste piles. In both seasons, non-revegetated and initial waste piles lack entire clades that are found in the reference sites and in the intermediate and advanced waste piles (Figure 5 and Supplementary Figure 4). Moreover, waste piles at an advanced stage present the highest phylogenetic coverage during the dry season, and the intermediate stages during the rainy season. These results highlight the impact of the season in the arthropod diversity.
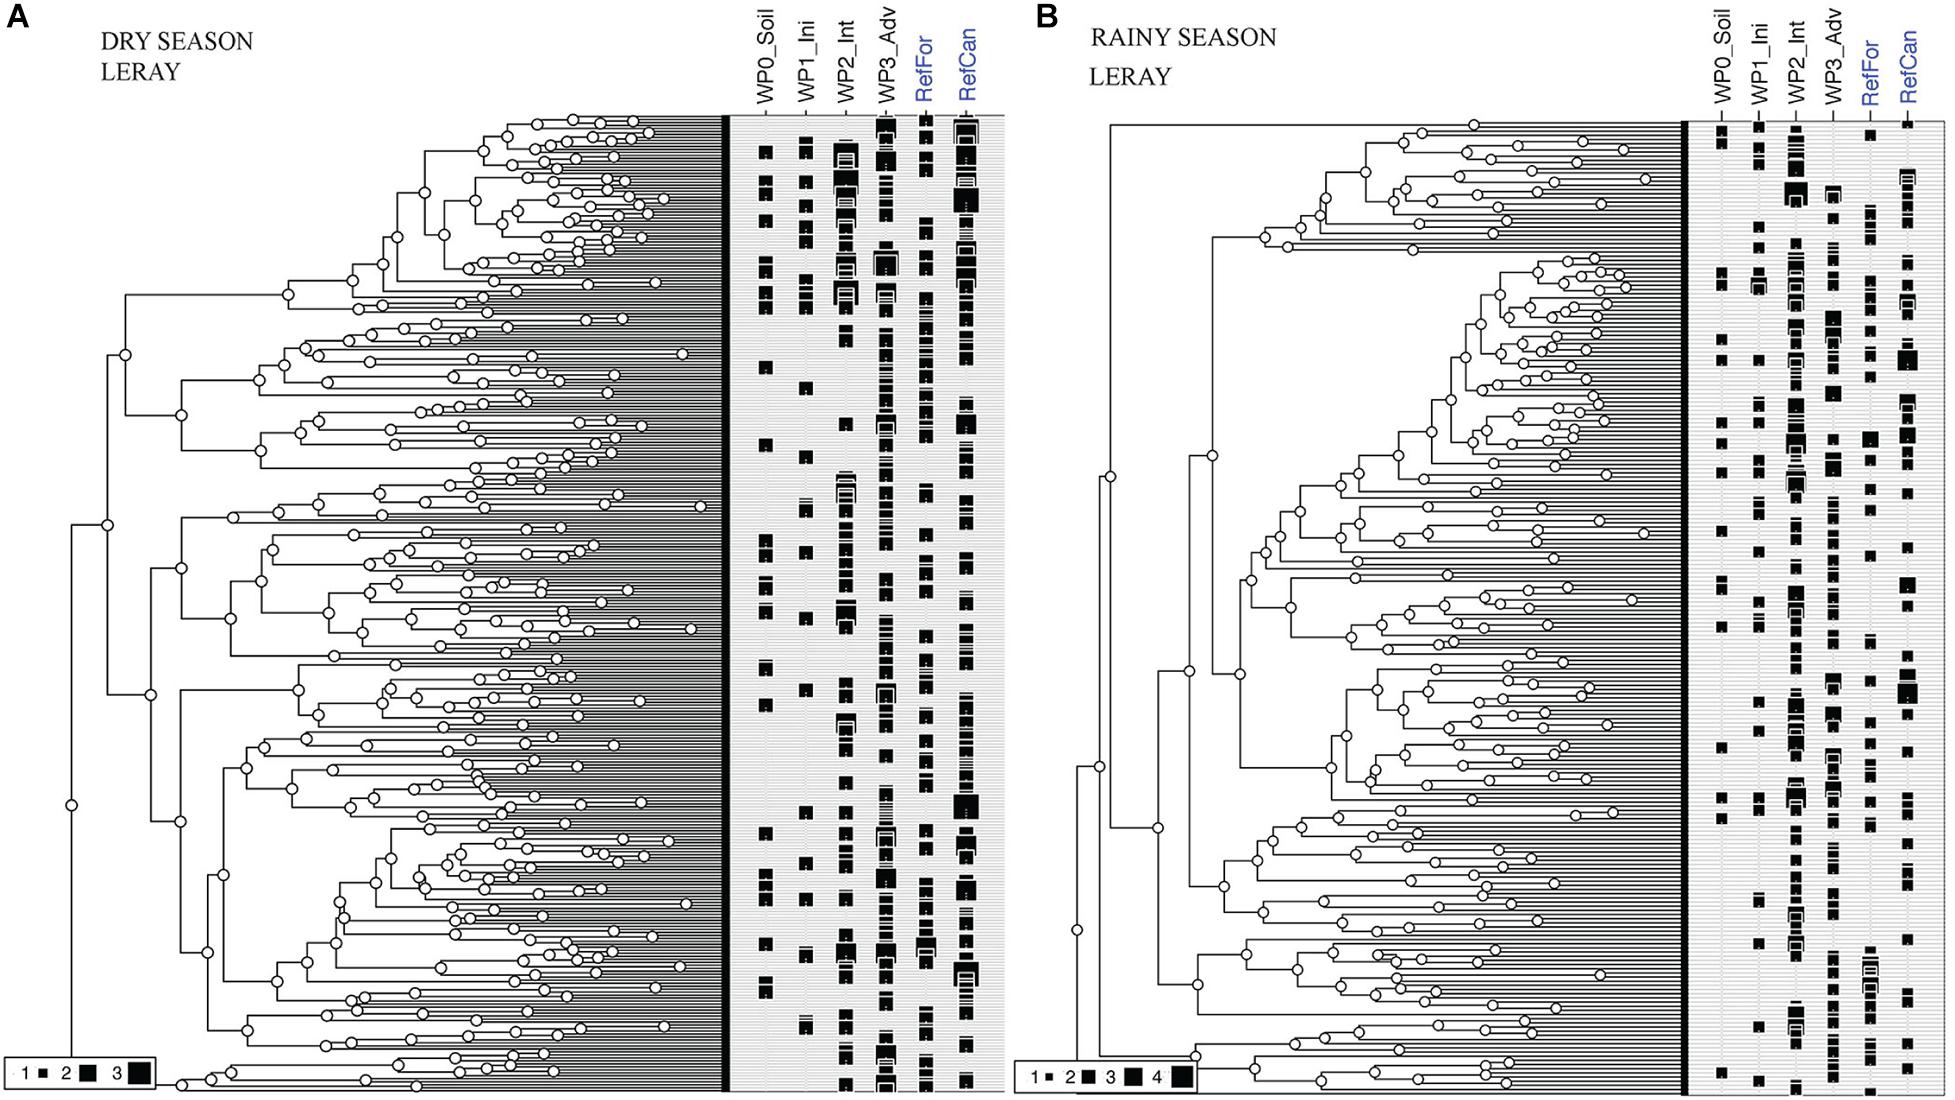
Figure 5. Phylogenetic diversity of the total OTUs detected in bulk arthropod samples collected using Malaise traps. (A) Dry season. (B) Rainy season. Figure created using an ultrametric tree and iNextPD. Reference sites marked in blue. Size of black squares in each site indicates the incidence frequency of that OTU. Code for study sites as in Figure 1. All data is from the ‘Leray’ dataset.
Discussion
Changes in Community Composition
The focus of biodiversity studies should be on the changes in community composition, instead of the species richness (Magurran et al., 2015, 2018; Aggemyr et al., 2018; Wang et al., 2019). In concordance with this, we find that species richness seems to recover rapidly after revegetation and we therefore focus on changes in the community composition. Our results show that the community of the reference forests and cangas are compositionally different from the communities undergoing rehabilitation in the waste piles. Nevertheless, waste pile benches under rehabilitation for a longer time (i.e., intermediate and advanced stages) had more similar communities to the reference areas, especially to reference forests, than the waste piles with non-revegetated soil (Figure 2). Although we found successional turnover to drive the community composition along rehabilitation chronosequences in few locations in the mine (S4 in both seasons and W in the rainy season), the lack of significance for the remaining locations may result from insufficient data. Successional turnover is supported by the results of the UpSetR diagrams, as the communities in these sites consist of unique arthropod OTUs (Figure 2). Successional turnover in arthropod communities has also been found in restored sites (Pais and Varanda, 2010). However, in our study, it is important to note that rehabilitation stage is not the only variable shaping the community composition: dispersal limitations and landscape patterns also influence arthropod composition. Therefore, the location of the waste pile within the mine plays an important role for species turnover between sites, as spatial turnover has an impact during the rainy season.
Vegetation structure such as basal area, tree density, tree species richness and leaf area index have previously been shown to be important when assessing environmental rehabilitation status (Ruiz-Jaen and Mitchell Aide, 2005; Gastauer et al., 2020a). As arthropod diversity and composition are known to be correlated with vegetation structure (Basset et al., 2012; Zhang et al., 2016), we fitted vegetation data with arthropod community and found that the basal area and tree species richness were correlated with the detected arthropod community. However, tree density and leaf area index showed different correlations, depending on the season (Supplementary Figure 3). Previous studies have also found correlation between vegetation cover and arthropod communities with differences between seasons (Salman and Blaustein, 2018). In addition, in the present study tree density and leaf area index also showed different correlations, depending on primer set used (Supplementary Figure 3). As mentioned previously, primer bias can cause DNA amplification of certain arthropod taxa that may be more or less correlated to these vegetation parameters and therefore result in differences between primers used.
Apart from the presence or absence of certain taxa, for a complete assessment of environmental rehabilitation status, functional diversity should also be taken into account (Gastauer et al., 2020a). We found the compositional differences in arthropod communities in the waste piles to be driven by the presence or absence of certain groups of arthropods. This in turn depends on different environmental requirements. For example, collembolans (Entomobryidae) are known to play an important role in soil rehabilitation (Rusek, 1998; Langmaack et al., 2001) and the large presence of these in the initial stages is an important contribution to the return of soil functions. Termites (Blattodea) found in the young stages (initial and intermediate) are also important for soil development due to their foraging activities (Whitford and Eldridge, 2013). Although ants (Formicidae) are present in all rehabilitation stages, their great abundance in advance stages indicates that an important factor for their establishment, such as soil cover (da Veiga et al., 2015), is available in those waste piles. In addition, an abundance of ants has been correlated with microbial activity in rehabilitated mine sites (Andersen and Sparling, 2008). Interestingly, even though plant seeds from both reference sites (forest and canga) are applied to achieve environmental rehabilitation in these waste piles, the arthropod community in advanced waste piles converged gradually to the reference forests and not to reference cangas. The reason for this can be that arthropod communities depend on the establishment of a tree cover, which is not present in the cangas, as indicated by the correlations found with vegetation structure. However, it is important to have in mind that the closest reference site to the waste piles is the reference forest, whereas the reference cangas is further away. Differences in arthropod community between older waste piles and the reference forests indicate that pre-disturbance communities have not been achieved after 6 to 7 years. This is probably due to the high diversity present in this area (Neves et al., 2020), making rehabilitation more time demanding. Although desired rehabilitation trajectories are being achieved in these waste piles, and no evidence for the emergence of novel ecosystems has been found, the possibility cannot be dismissed and samples from longer chronosequences should also be analysed.
Differences in Species Richness
Although the results are not statistically significant, the alpha diversity analyses show that waste piles with an intermediate and advanced rehabilitation status present the highest estimated OTU richness. However, of these waste piles, only the ones with an advanced status show a high richness in both seasons, in contrast to the intermediate waste piles in which the richness decreases in the dry season. Similarly, the intermediate and advanced waste piles have arthropod OTUs with a high phylogenetic coverage during both seasons. This indicates that certain arthropod groups require specific environmental factors, e.g., vegetation structure, that are not present in the young stages. The data could indicate that the waste piles with an advanced rehabilitation status have a more stable community. This lack of statistical significance can be due to low sample size, but could also be due to ecological factors, as other studies have recorded no changes in alpha diversity after ecological disturbances (Dornelas et al., 2014; Magurran et al., 2015). However, as mentioned above, there is a low sample size and the asymptotes in the iNext plots are far from being reached, indicating that higher sample size is needed to achieve sampling sufficiency for each rehabilitation status.
Importance of Seasonality and Primer Sets
Although it is known that arthropods have seasonal variation (Liu et al., 2013; Wardhaugh, 2014; Zhang et al., 2016; Barsoum et al., 2019) and that the use of just one metabarcoding primer set can produce biased results when working with arthropods (Clarke et al., 2014; Alberdi et al., 2018b), these issues have not yet been addressed in studies describing arthropod communities in post-mining areas. In our study, seasonal differences were found in community composition, correlating to vegetation data, species richness and phylogenetic diversity. Based on our results, and together with other studies that have found differences in the structure of arthropod communities between seasons (Boulter et al., 2011; Santorufo et al., 2014), we recommend the sampling of bulk arthropod samples in different seasons for a better understanding of the community, especially in tropical and subtropical areas.
In addition, in this study we used two metabarcoding primer sets, which both amplified a marker within the traditional COI barcode region (Zeale et al., 2011; Geller et al., 2013; Leray et al., 2013). When comparing the results from the two datasets, we found the taxonomic identifications between the two primer sets to be different, and when comparing the arthropod community with the vegetation data, we detected different correlations. Differences in arthropod taxa detections between these two primer sets has been discussed previously (see Alberdi et al., 2018b), showing the co-detection of only certain taxa. We therefore recommend the use of more than one set of primers. Collecting samples in only one season or amplifying DNA with one primer set can cause biased results, and not taking this into account can impact the characterisation of the arthropod community.
Final Remarks and Future Studies
Monitoring of areas under environmental rehabilitation is resource demanding, and characterising communities in areas under rehabilitation can be challenging, as hybrid ecosystems that still provide important ecosystem services can arise (Gastauer et al., 2019). Moreover, the high biodiversity present in the study areas and the lack of a complete reference database, which makes taxonomic assignment to the OTUs difficult, makes this type of study challenging. Nevertheless, DNA metabarcoding of bulk arthropod samples has proven to be an efficient method to study changes in ecosystems (Edwards et al., 2014; Zhang et al., 2016; Barsoum et al., 2019; Fernandes et al., 2019; Gervan et al., 2020). Although DNA metabarcoding of bulk arthropod samples has been used for environmental monitoring purposes and has been recently applied to study arthropod communities after mining (Fernandes et al., 2019; Gervan et al., 2020), we are far from defining baselines and understanding the multiple factors that influence arthropod diversity detected within bulk arthropod samples.
Based on our results, we suggest the following considerations to make monitoring of arthropod communities in post-mining areas more effective. Regarding sample collection, bulk arthropod samples should be collected in both main seasons to account for seasonal variation. Further, at least three to four sites at the same rehabilitation stages should be sampled, to increase statistical power. In addition, as spatial turnover plays a role in species distribution, sampling sites should be selected as far away as possible from each other. As vegetation structure is sampled more easily, data collection can be done more regularly, whereas bulk arthropod samples can be collected every 3 to 5 years, for example. Regarding molecular and bioinformatic analyses, researchers should follow robust pipelines. DNA extracted from bulk arthropod samples, especially in tropical regions, will most often consists of DNA from many arthropod taxa. Therefore, the probability of having mismatches between the used primer and the target sequences is higher. The use of two metabarcoding primers targeting arthropod DNA makes it possible to reduce primer bias. With regards to community analyses, studies should focus on beta diversity, as we found that changes in alpha diversity are bad candidates for environmental indicators for areas under rehabilitation. We therefore agree with other authors (Dornelas et al., 2014), that changes in alpha diversity may not be noticeable due to substitution of taxa and therefore the composition of the community is a better indicator of biodiversity changes.
This study is the first to use DNA metabarcoding to characterise arthropod communities in areas under rehabilitation after mining in a megadiverse ecosystem such as the Amazonian forest. Studies such as this are important to benchmark methods with which changes in biodiversity can be objectively studied, leading to a better understanding of the impact of rehabilitation efforts in highly biodiverse areas.
Data Availability Statement
The datasets presented in this study can be found in online repositories. The names of the repository/repositories and accession number(s) can be found below: https://erda.ku.dk/public/archives/1aad025cea2257ad3a725f33a0236142/published-archive.html, 1aad025cea2257ad3a725f33a0236142; https://github.com/lynggaardc/Arthropods_Brazil.git, no accession number.
Author Contributions
CC, CL, KB, MG, MTG and SR conceived the study. CL, MG and ME carried out sample collection. CL and ME generated the data with inputs from KB. CL and MG analysed the data with important contributions from DY. CL wrote the original manuscript and all authors contributed to revisions.
Funding
Collection permits were granted by the Brazilian Ministry of Environment (SISBIO 67580-1 and SISGEN R04409B). Collection of samples received support from Vale (Canga Plant and Soil and Biodiversity Genomics), and CNPq to GO (444227/2018-0, 402756/2018-5 and 307479/2016-1), CAPES to GO (88887.130628/2016-00), and the CABANA project [RCUK(BB/P027849/1)]. CL was supported by the National Council of Science and Technology in Mexico (CONACyT) Grant CVU 582667 and the Danish Council for Independent Research, DFF grant 7079-00029B. KB was supported by the Independent Research Fund Denmark, DFF grant 5051-00140.
Conflict of Interest
The authors declare that the research was conducted in the absence of any commercial or financial relationships that could be construed as a potential conflict of interest.
Acknowledgments
We thank Wesley de Melo Rangel, Joyce Reis and Gilliana Almeida da Rosa for field assistance and the staff at the Danish National High-Throughput DNA Sequencing Centre for sequencing. Special thanks to Xiaoyang Wang for developing the original R script for the community analyses.
Supplementary Material
The Supplementary Material for this article can be found online at: https://www.frontiersin.org/articles/10.3389/fevo.2020.590976/full#supplementary-material
Footnotes
- ^ https://github.com/shyamsg/Begum
- ^ www.ncbi.nlm.nih.gov/
- ^ https://www.gbif.org/
- ^ http://www.itis.gov
References
Aggemyr, E., Auffret, A. G., Jädergård, L., and Cousins, S. A. O. (2018). Species richness and composition differ in response to landscape and biogeography. Landsc. Ecol. 33, 2273–2284. doi: 10.1007/s10980-018-0742-9
Alberdi, A., Aizpurua, O., Bohmann, K., Gopalakrishnan, S., Lynggaard, C., Nielsen, M., et al. (2018a). Promises and pitfalls of using high-throughput sequencing for diet analysis. Mol. Ecol. Resour. 19, 327–348. doi: 10.1111/1755-0998.12960
Alberdi, A., Aizpurua, O., Gilbert, M. T. P., and Bohmann, K. (2018b). Scrutinizing key steps for reliable metabarcoding of environmental samples. Methods Ecol. Evol. 9, 134–147. doi: 10.1111/2041-210x.12849
Andersen, A. N., and Sparling, G. P. (2008). Ants as Indicators of Restoration Success: Relationship with Soil Microbial Biomass in the Australian Seasonal Tropics. Restor. Ecol. 5, 109–114. doi: 10.1046/j.1526-100X.1997.09713.x
Aronson, J., Brancalion, P. H. S., Durigan, G., Rodrigues, R. R., Engel, V. L., Tabarelli, M., et al. (2011). What Role Should Government Regulation Play in Ecological Restoration? Ongoing Debate in São Paulo State, Brazil. Restor. Ecol. 19, 690–695. doi: 10.1111/j.1526-100X.2011.00815.x
Barsoum, N., Bruce, C., Forster, J., Ji, Y.-Q., and Yu, D. W. (2019). The devil is in the detail: Metabarcoding of arthropods provides a sensitive measure of biodiversity response to forest stand composition compared with surrogate measures of biodiversity. Ecol. Indic. 101, 313–323. doi: 10.1016/j.ecolind.2019.01.023
Baselga, A., and Orme, C. D. L. (2012). betapart : an R package for the study of beta diversity : Betapart package. Methods Ecol. Evol. 3, 808–812. doi: 10.1111/j.2041-210X.2012.00224.x
Basset, Y., Cizek, L., Cuénoud, P., Didham, R. K., Guilhaumon, F., Missa, O., et al. (2012). Arthropod diversity in a tropical forest. Science 338, 1481–1484. doi: 10.1126/science.1226727
Bergès, L., Avon, C., Bezombes, L., Clauzel, C., Duflot, R., Foltête, J.-C., et al. (2020). Environmental mitigation hierarchy and biodiversity offsets revisited through habitat connectivity modelling. J. Environ. Manage. 256:109950. doi: 10.1016/j.jenvman.2019.109950
Binladen, J., Gilbert, M. T. P., Bollback, J. P., Panitz, F., Bendixen, C., Nielsen, R., et al. (2007). The use of coded PCR primers enables high-throughput sequencing of multiple homolog amplification products by 454 parallel sequencing. PLoS One 2:e197. doi: 10.1371/journal.pone.0000197
Bohmann, K., Gopalakrishnan, S., Nielsen, M., Nielsen, L. D. S. B., Jones, G., Streicker, D. G., et al. (2018). Using DNA metabarcoding for simultaneous inference of common vampire bat diet and population structure. Mol. Ecol. Resour. 18, 1050–1063. doi: 10.1111/1755-0998.12891
Bouckaert, R., Vaughan, T. G., Barido-Sottani, J., Duchêne, S., Fourment, M., Gavryushkina, A., et al. (2019). BEAST 2.5: An advanced software platform for Bayesian evolutionary analysis. PLoS Comput. Biol. 15:e1006650. doi: 10.1371/journal.pcbi.1006650
Boulter, S. L., Lambkin, C. L., and Starick, N. T. Others. (2011). Assessing the abundance of seven major arthropod groups along an altitudinal gradient and across seasons in subtropical rainforest. Mem. Queensl. Mus. 55, 303–313.
Brandon-Mong, G.-J., Littlefair, J. E., Sing, K.-W., Lee, Y.-P., Gan, H.-M., Clare, E. L., et al. (2018). Temporal changes in arthropod activity in tropical anthropogenic forests. Bull. Entomol. Res. 108, 792–799. doi: 10.1017/S000748531800010X
Carøe, C., and Bohmann, K. (2020). Tagsteady: a metabarcoding library preparation protocol to avoid false assignment of sequences to samples. Mol. Ecol. Resour. 2020:13227. doi: 10.1111/1755-0998.13227
Clarke, L. J., Soubrier, J., Weyrich, L. S., and Cooper, A. (2014). Environmental metabarcodes for insects: in silico PCR reveals potential for taxonomic bias. Mol. Ecol. Resour. 14, 1160–1170. doi: 10.1111/1755-0998.12265
Conway, J. R., Lex, A., and Gehlenborg, N. (2017). UpSetR: an R package for the visualization of intersecting sets and their properties. Bioinformatics 33, 2938–2940. doi: 10.1093/bioinformatics/btx364
da Veiga, J. B., dos Santos, R. C., Lopes, M. P. M., da Silva, R. R., da Silva, A. C. S., and de Oliveira, A. S. (2015). Avaliação rápida da riqueza de formigas (Hymenoptera, Formicidae) em fragmentos de floresta ombrófila na região de Alta Floresta, MT. REVISTA DE CIÊNCIAS AGROAMBIENTAIS 13. Available online at: https://periodicos.unemat.br/index.php/rcaa/article/view/1173/1247 (accessed on July 28, 2020).
De Barba, M., Miquel, C., Boyer, F., Mercier, C., Rioux, D., Coissac, E., et al. (2014). DNA metabarcoding multiplexing and validation of data accuracy for diet assessment: application to omnivorous diet. Mol. Ecol. Resour. 14, 306–323. doi: 10.1111/1755-0998.12188
Derhé, M. A., Murphy, H., Monteith, G., and Menéndez, R. (2016). Measuring the success of reforestation for restoring biodiversity and ecosystem functioning. J. Appl. Ecol. 53, 1714–1724. doi: 10.1111/1365-2664.12728
Dornelas, M., Gotelli, N. J., McGill, B., Shimadzu, H., Moyes, F., Sievers, C., et al. (2014). Assemblage time series reveal biodiversity change but not systematic loss. Science 344, 296–299. doi: 10.1126/science.1248484
Drummond, A. J., and Rambaut, A. (2007). BEAST: Bayesian evolutionary analysis by sampling trees. BMC Evol. Biol. 7:214. doi: 10.1186/1471-2148-7-214
Edgar, R. C. (2004). MUSCLE: multiple sequence alignment with high accuracy and high throughput. Nucleic Acids Res. 32, 1792–1797. doi: 10.1093/nar/gkh340
Edwards, D. P., Magrach, A., Woodcock, P., Ji, Y., Lim, N. T.-L., Edwards, F. A., et al. (2014). Selective-logging and oil palm: multitaxon impacts, biodiversity indicators, and trade-offs for conservation planning. Ecol. Appl. 24, 2029–2049. doi: 10.1890/14-0010.1
Fernandes, K., van der Heyde, M., Coghlan, M., Wardell−Johnson, G., Bunce, M., Harris, R., et al. (2019). Invertebrate DNA metabarcoding reveals changes in communities across mine site restoration chronosequences. Restor. Ecol. 215:403. doi: 10.1111/rec.12976
Foster, Z. S. L., Sharpton, T. J., and Grünwald, N. J. (2017). Metacoder: An R package for visualization and manipulation of community taxonomic diversity data. PLoS Comput. Biol. 13:e1005404. doi: 10.1371/journal.pcbi.1005404
Frøslev, T. G., Kjøller, R., Bruun, H. H., Ejrnæs, R., Brunbjerg, A. K., Pietroni, C., et al. (2017). Algorithm for post-clustering curation of DNA amplicon data yields reliable biodiversity estimates. Nat. Commun. 8:1188. doi: 10.1038/s41467-017-01312-x
Gastauer, M., Caldeira, C. F., Ramos, S. J., Trevelin, L. C., Jaffé, R., Oliveira, G., et al. (2020a). Integrating environmental variables by multivariate ordination enables the reliable estimation of mineland rehabilitation status. J. Environ. Manage. 256:109894. doi: 10.1016/j.jenvman.2019.109894
Gastauer, M., Sarmento, P. S. M., Santos, V. C. A., Caldeira, C. F., Ramos, S. J., Teodoro, G. S., et al. (2020b). Vegetative functional traits guide plant species selection for initial mineland rehabilitation. Ecol. Eng. 148, 1057–1063. doi: 10.1016/j.ecoleng.2020.105763
Gastauer, M., Silva, J. R., Caldeira Junior, C. F., Ramos, S. J., Souza Filho, P. W. M., Furtini Neto, A. E., et al. (2018). Mine land rehabilitation: Modern ecological approaches for more sustainable mining. J. Clean. Prod. 172, 1409–1422. doi: 10.1016/j.jclepro.2017.10.223
Gastauer, M., Souza Filho, P. W. M., Ramos, S. J., Caldeira, C. F., Silva, J. R., Siqueira, J. O., et al. (2019). Mine land rehabilitation in Brazil: Goals and techniques in the context of legal requirements. Ambio 48, 74–88. doi: 10.1007/s13280-018-1053-8
Geller, J., Meyer, C., Parker, M., and Hawk, H. (2013). Redesign of PCR primers for mitochondrial cytochrome c oxidase subunit I for marine invertebrates and application in all-taxa biotic surveys. Mol. Ecol. Resour. 13, 851–861. doi: 10.1111/1755-0998.12138
Gervan, C. A., Gardner, W. C., Van Hamme, J. D., Higgins, R. J., and Bottos, E. M. (2020). Invertebrate Response to Mine Reclamation (South-Central British Columbia): The Effects of Reclamation Age on Arthropod Assemblages.Report number: 2020-01.
Gilbert, M. T. P., Moore, W., Melchior, L., and Worobey, M. (2007). DNA extraction from dry museum beetles without conferring external morphological damage. PLoS One 2:e272. doi: 10.1371/journal.pone.0000272
Hobbs, R. J., Higgs, E., and Harris, J. A. (2009). Novel ecosystems: implications for conservation and restoration. Trends Ecol. Evol. 24, 599–605. doi: 10.1016/j.tree.2009.05.012
Hsieh, T. C., and Chao, A. (2017). Rarefaction and Extrapolation: Making Fair Comparison of Abundance-Sensitive Phylogenetic Diversity among Multiple Assemblages. Syst. Biol. 66, 100–111. doi: 10.1093/sysbio/syw073
Hsieh, T. C., Ma, K. H., and Chao, A. (2016). iNEXT: an R package for rarefaction and extrapolation of species diversity (Hill numbers). Methods Ecol. Evol. 7, 1451–1456. doi: 10.1111/2041-210X.12613
Huson, D. H., Beier, S., Flade, I., Górska, A., El-Hadidi, M., Mitra, S., et al. (2016). MEGAN Community Edition – Interactive Exploration and Analysis of Large-Scale Microbiome Sequencing Data. PLoS Comput. Biol. 12:e1004957. doi: 10.1371/journal.pcbi.1004957
Krehenwinkel, H., Wolf, M., Lim, J. Y., Rominger, A. J., Simison, W. B., and Gillespie, R. G. (2017). Estimating and mitigating amplification bias in qualitative and quantitative arthropod metabarcoding. Sci. Rep. 7:17668.
Langmaack, M., Schrader, S., and Helming, K. (2001). Effect of mesofaunal activity on the rehabilitation of sealed soil surfaces. Appl. Soil Ecol. 16, 121–130. doi: 10.1016/S0929-1393(00)00108-6
Leray, M., Yang, J. Y., Meyer, C. P., Mills, S. C., Agudelo, N., Ranwez, V., et al. (2013). A new versatile primer set targeting a short fragment of the mitochondrial COI region for metabarcoding metazoan diversity : application for characterizing coral reef fish gut contents. Front. Zool. 10:1. doi: 10.1186/1742-9994-10-34
Liu, L., Guo, Z., Zhong, C., and Shi, S. (2018). DNA barcoding reveals insect diversity in the mangrove ecosystems of Hainan Island. China. Genome 61, 797–806. doi: 10.1139/gen-2018-0062
Liu, R., Zhu, F., Song, N., Yang, X., and Chai, Y. (2013). Seasonal distribution and diversity of ground arthropods in microhabitats following a shrub plantation age sequence in desertified steppe. PLoS One 8:e77962. doi: 10.1371/journal.pone.0077962
Lorenz, K., Lal, R., and Ehlers, K. (2019). Soil organic carbon stock as an indicator for monitoring land and soil degradation in relation to U nited N ations’. S ustainab. Dev. Goals. Land Degrad. Dev. 30, 824–838. doi: 10.1002/ldr.3270
Magurran, A. E., Deacon, A. E., Moyes, F., Shimadzu, H., Dornelas, M., Phillip, D. A. T., et al. (2018). Divergent biodiversity change within ecosystems. Proc. Natl. Acad. Sci. U S A. 115, 1843–1847. doi: 10.1073/pnas.1712594115
Magurran, A. E., Dornelas, M., Moyes, F., Gotelli, N. J., and McGill, B. (2015). Rapid biotic homogenization of marine fish assemblages. Nat. Commun. 6:8405. doi: 10.1038/ncomms9405
McDonald, T., Jonson, J., and Dixon, K. W. (2016). National standards for the practice of ecological restoration in Australia: National restoration standards. Australia. Restor. Ecol. 24, S4–S32. doi: 10.1111/rec.12359
Mercier, C., Boyer, F., Bonin, A., and Coissac, E. (2013). SUMATRA and SUMACLUST: Fast and exact comparison and clustering of sequences. Programs and Abstracts of the SeqBio 2013 workshop. Available online at: http://metabarcoding.org/sumatra
Morinière, J., Cancian, de Araujo, B., Lam, A. W., Hausmann, A., Balke, M., et al. (2016). Species Identification in Malaise Trap Samples by DNA Barcoding Based on NGS Technologies and a Scoring Matrix. PLoS One 11:e0155497. doi: 10.1371/journal.pone.0155497
Murray, D. C., Coghlan, M. L., and Bunce, M. (2015). From benchtop to desktop: important considerations when designing amplicon sequencing workflows. PLoS One 10:e0124671. doi: 10.1371/journal.pone.0124671
Nascimento, F. S., Gastauer, M., Souza-Filho, P. W. M., Nascimento, W. R. Jr., Santos, D. C., and Costa, M. F. (2019). Land Cover Changes in Open-Cast Mining Complexes Based on High-Resolution Remote Sensing Data. Earth Sci. 2019:2019080104. doi: 10.20944/preprints201908.0104.v1
Neves, D. M., Dexter, K. G., Baker, T. R., Coelho, de Souza, F., Oliveira-Filho, A. T., et al. (2020). Evolutionary diversity in tropical tree communities peaks at intermediate precipitation. Sci. Rep. 10:1188. doi: 10.1038/s41598-019-55621-w
Nichols, R. V., Vollmers, C., Newsom, L. A., Wang, Y., Heintzman, P. D., Leighton, M., et al. (2018). Minimizing polymerase biases in metabarcoding. Mol. Ecol. Resour. 12:R18. doi: 10.1111/1755-0998.12895
Nielsen, M., Gilbert, M. T. P., Pape, T., and Bohmann, K. (2019). A simplified DNA extraction protocol for unsorted bulk arthropod samples that maintains exoskeletal integrity. Environ. DNA 1, 144–154. doi: 10.1002/edn3.16
Oksanen, J., Blanchet, F. G., Friendly, M., Kindt, R., Legendre, P., McGlinn, D., et al. (2019). Vegan: community ecology package. R package version 2.5-6. Available online at: https://CRAN.R-project.org/package=vegan (accessed on September 01, 2019).
Ondov, B. D., Bergman, N. H., and Phillippy, A. M. (2011). Interactive metagenomic visualization in a Web browser. BMC Bioinform. 12:385. doi: 10.1186/1471-2105-12-385
Pais, M. P., and Varanda, E. M. (2010). Arthropod recolonization in the restoration of a semideciduous forest in southeast Brazil. Neotropic. Entomol. 39, 198–206. doi: 10.1590/S1519-566X2010000200009
Rambaut, A., Drummond, A. J., Xie, D., Baele, G., and Suchard, M. A. (2018). Posterior Summarization in Bayesian Phylogenetics Using Tracer 1.7. Syst. Biol. 67, 901–904. doi: 10.1093/sysbio/syy032
R Core Team (2018). R: A Language and Environment for Statistical Computing. Vienna: R Foundation for Statistical Computing. https://www.R-project.org
Rio Tinto. (2004). Rio Tinto’s biodiversity strategy: Sustaining a natural balance. Rio Tinto, London and Melbourne. Available online at: www.riotinto.com/documents/ReportsPublications/RTBidoversitystrategyfinal.pdf
Rosenberg, D. M., Danks, H. V., and Lehmkuhl, D. M. (1986). Importance of insects in environmental impact assessment. Environ. Manage. 10, 773–783. doi: 10.1007/BF01867730
Ruiz-Jaen, M. C., and Mitchell Aide, T. (2005). Restoration Success: How Is It Being Measured? Restor. Ecol. 13, 569–577. doi: 10.1111/j.1526-100X.2005.00072.x
Rusek, J. (1998). Biodiversity of Collembola and their functional role in the ecosystem. Biodiv. Conserv. 7, 1207–1219. doi: 10.1023/A:1008887817883
Salman, I. N. A., and Blaustein, L. (2018). Vegetation cover drives arthropod communities in mediterranean/subtropical green roof habitats. Sustainability 10, 4209. doi: 10.3390/su10114209
Santorufo, L., Van Gestel, C. A. M., and Maisto, G. (2014). Sampling season affects conclusions on soil arthropod community structure responses to metal pollution in Mediterranean urban soils. Geoderma 22, 47–53. doi: 10.1016/j.geoderma.2014.02.001
Schnell, I. B., Bohmann, K., and Gilbert, M. T. P. (2015). Tag jumps illuminated–reducing sequence-to-sample misidentifications in metabarcoding studies. Mol. Ecol. Resour. 15, 1289–1303. doi: 10.1111/1755-0998.12402
Schubert, M., Lindgreen, S., and Orlando, L. (2016). AdapterRemoval v2: rapid adapter trimming, identification, and read merging. BMC Res. Notes 9:88. doi: 10.1186/s13104-016-1900-2
SER (2004). The SER International Primer on Ecological Restoration. Washington, D.C: Society for Ecological Restoration International.
Taberlet, P., Coissac, E., Pompanon, F., Brochmann, C., and Willeslev, E. (2012). Towards next−generation biodiversity assessment using DNA metabarcoding. Mol Ecol. 21, 2045–2050. doi: 10.1111/j.1365-294X.2012.05470.x
Wang, X., Hua, F., Wang, L., Wilcove, D. S., and Yu, D. W. (2019). The biodiversity benefit of native forests and mixed-species plantations over monoculture plantations. Div. Distribut. 25, 1721–1735. doi: 10.1111/ddi.12972
Wang, Y., Naumann, U., Wright, S. T., and Warton, D. I. (2012). mvabund – an R package for model-based analysis of multivariate abundance data: The mvabund R package. Methods Ecol. Evol. 3, 471–474. doi: 10.1111/j.2041-210X.2012.00190.x
Wardhaugh, C. W. (2014). The spatial and temporal distributions of arthropods in forest canopies: uniting disparate patterns with hypotheses for specialisation. Biol. Rev. Camb. Philos. Soc. 89, 1021–1041. doi: 10.1111/brv.12094
Whitford, W. G., and Eldridge, D. J. (2013). “12.19 Effects of Ants and Termites on Soil and Geomorphological Processes,” in Treatise on Geomorphology, ed. J. F. Shroder (San Diego: Academic Press), 281–292. doi: 10.1016/B978-0-12-374739-6.00335-3
Wortley, L., Hero, J.-M., and Howes, M. (2013). Evaluating Ecological Restoration Success: A Review of the Literature: Trends and Gaps in Empirical Evaluations. Restor. Ecol. 21, 537–543. doi: 10.1111/rec.12028
Yu, D. W., Ji, Y., Emerson, B. C., Wang, X., Ye, C., Yang, C., et al. (2012). Biodiversity soup: metabarcoding of arthropods for rapid biodiversity assessment and biomonitoring. Methods Ecol. Evol. 3, 613–623. doi: 10.1111/j.2041-210X.2012.00198.x
Zeale, M. R. K., Butlin, R. K., Barker, G. L. A., Lees, D. C., and Jones, G. (2011). Taxon-specific PCR for DNA barcoding arthropod prey in bat faeces. Mol. Ecol. Resour. 11, 236–244. doi: 10.1111/j.1755-0998.2010.02920.x
Keywords: Amazon, arthropods, metabarcoding, mining, rehabilitation
Citation: Lynggaard C, Yu DW, Oliveira G, Caldeira CF, Ramos SJ, Ellegaard MR, Gilbert MTP, Gastauer M and Bohmann K (2020) DNA-Based Arthropod Diversity Assessment in Amazonian Iron Mine Lands Show Ecological Succession Towards Undisturbed Reference Sites. Front. Ecol. Evol. 8:590976. doi: 10.3389/fevo.2020.590976
Received: 03 August 2020; Accepted: 10 November 2020;
Published: 01 December 2020.
Edited by:
W. Douglas Robinson, Oregon State University, United StatesReviewed by:
Siu Mui Tsai, University of São Paulo, BrazilNaiara Sales, University of Lisbon, Portugal
Copyright © 2020 Lynggaard, Yu, Oliveira, Caldeira, Ramos, Ellegaard, Gilbert, Gastauer and Bohmann. This is an open-access article distributed under the terms of the Creative Commons Attribution License (CC BY). The use, distribution or reproduction in other forums is permitted, provided the original author(s) and the copyright owner(s) are credited and that the original publication in this journal is cited, in accordance with accepted academic practice. No use, distribution or reproduction is permitted which does not comply with these terms.
*Correspondence: Christina Lynggaard, Y2hyaXN0aW5hLmxAc3VuZC5rdS5kaw==
†These authors have contributed equally to this work