 Elizabeth A. Herder
 Austin R. Spence
 Morgan W. Tingley
 Sarah M. Hird
- 1Department of Molecular and Cell Biology, University of Connecticut, Storrs, CT, United States
- 2Department of Ecology and Evolutionary Biology, University of Connecticut, Storrs, CT, United States
- 3Department of Ecology and Evolutionary Biology, University of California, Los Angeles, Los Angeles, CA, United States
The microbial communities living on and in vertebrate hosts have myriad effects on their hosts, potentially including fitness and speciation. Microbiomes are influenced by both intrinsic (from the host) and extrinsic (from the environment) factors, but the relative contributions of each are unknown for most non-model species. Abiotic environmental factors can influence the microbiome directly but it is less clear how abiotic gradients shape microbiome communities in the wild. Here, we captured eight wild Anna’s hummingbirds from three different elevations along their elevational distribution in California and moved them directly to a middle (“Within Range”) elevation. After some time at this elevation, the birds were moved in captivity to an “Above Range” elevation, and two birds were later moved back to the Within Range elevation. Fecal and food samples were collected longitudinally and the V4 region of the 16S rRNA gene analyzed. The most abundant phyla in all samples were Fusobacteria, Firmicutes, Actinobacteria, and Proteobacteria. Individual Bird ID explained the greatest amount of microbiome variation at 27.5%, signifying some amount of stability in the Anna’s hummingbird fecal microbiome. Sample elevation explained 19.6% (p = 0.001) of the variation using weighted UniFrac, but only 2.0% (p = 0.047) using unweighted UniFrac, implying a change in abundance of bacterial lineages in the microbiome but not in the presence or absence of the microbes. Additionally, Fusobacteria were 7.0x more abundant in the Above Range elevation samples while Firmicutes were 0.3x lower. A thorough understanding of how the environment can shape the microbiome may assist in conservation efforts and a general understanding of host-microbiome relationships in an era of rapid and global environmental change.
Introduction
A microbiome is the community of microorganisms in a specified location (Bäckhed et al., 2005) and the microbiomes of vertebrates have myriad effects on their hosts, from digestion (Oliphant and Allen-Vercoe, 2019) and behavior (Borre et al., 2014) to lifespan (Smith et al., 2017) and brain development (Heijtz et al., 2011). Microbiomes are important for the health of hosts and can affect the onset, duration, and severity of diseases, including intestinal diseases, metabolic diseases, obesity, cardiovascular diseases, and others (Kinross et al., 2011; Nicholson et al., 2012; Tu et al., 2020). Most knowledge of vertebrate-associated microbiomes derives from mammalian hosts (Bleich and Fox, 2015; Colston and Jackson, 2016; Davenport et al., 2017; Sharpton, 2018). Host genetics was originally identified as the main influence on the human microbiome composition (Goodrich et al., 2014), but human environment (i.e., living conditions and behavior, including diet) may be the larger driver (Rothschild et al., 2018). Whether mammalian microbiome results apply broadly is unknown (Hird, 2020; Song et al., 2020) and species-level microbiome information for non-model taxa provide important basic and contextual information about host-associated microbiomes.
Birds are important contributors to our environment, economy, and food sources, though few studies have experimentally investigated what influences their microbiome. The role of the external environment on the avian microbiome appears to vary across studies and systems. For example: in brown-headed cowbirds, sampling location is a larger correlate of microbiome diversity than host taxonomy or ecology (Hird et al., 2014). Similarly, the location in which the adult woodlark and skylark reside shapes their microbiome (van Veelen et al., 2017). Birds living in urban environments have more diverse microbiomes than those in rural environments (Phillips et al., 2018). Together these show the importance of the environment on the microbiome. Conversely, when 59 neotropical bird species were sampled, the environment was not shown to be a statistically significant correlate to microbial diversity (Hird et al., 2015). Nest parasitic birds have significantly different microbiomes than non-parasitic young raised in a shared nest, indicating a greater role for genetic than environmental influence (Ruiz-Rodríguez et al., 2009). Cloacal microbiomes of free-living rufous-collared sparrows were different between the different sexes and among the different seasons; male and female birds showed different cloacal microbial communities but both changed throughout the breeding season (Escallón et al., 2019). Contrastingly, sex has been not significant in other avian microbiome studies (Hird et al., 2015, 2018). While these studies show that intrinsic and extrinsic factors may affect the avian microbiome, causal studies are needed to determine the extent to which each does.
Hummingbirds (family: Trochilidae) have extremely small body sizes and high metabolic requirements (Beuchat and Chong, 1998). They live almost exclusively in states of hyperglycemia so extreme that similar conditions would likely cause severe tissue damage or death in mammals (Beuchat and Chong, 1998). Additionally, hummingbirds can live at high elevations with highly variable environmental conditions. Hummingbirds are well equipped to deal with most challenges of high elevation, like low ambient temperature, decreased air density, and low oxygen availability (Altshuler and Dudley, 2006). However, there are also physiological costs. At higher elevations, hummingbirds reduce their translational velocities, accelerations and decelerations, and rotational velocities while also making less frequent complex turns, showing behavioral compensation for the costs of living at high altitude (Segre et al., 2016). Anna’s hummingbirds (Calypte anna) disperse upslope during the summer months, extending their elevational range from sea level to approximately 2,500 m above sea level, but all move to lower elevations in the winter during the breeding season. At the higher elevations, Anna’s hummingbirds experience reduced competition, predation, and parasitism (Jankowski et al., 2013). There is also evidence that this species has only recently lived in high elevation habitats in the summer months, as historical data from the early 20th century in California indicates that the species was then only found in low-to-mid elevations throughout the year (Grinnell and Miller, 1986; Tingley et al., 2012).
Other systems indicate elevation can affect microbiomes. Coqui frogs (Eleutherodactylus coqui) sampled along an elevation gradient in eastern Puerto Rico show no significant alpha diversity changes in the microbiome, but beta diversity metrics consistently differed across the elevation changes (Hughey et al., 2017). How microbiomes may change with current and expected future elevational shifts is currently unknown, nor how that will affect the bird physiology.
The goal of our study was to assess how elevation affects microbiome richness and taxonomic composition in an experimental and semi-wild captive experiment. Anna’s hummingbirds were captured from three elevations across their natural range in the summer of 2018 in CA, United States, moved to a middle “Within Range” elevation, and later moved to a higher “Above Range” elevation while the fecal microbiome was sampled longitudinally (Figure 1). Fecal microbiome samples were collected at the two elevations allowing us to track the changes within individuals and thus infer causality.
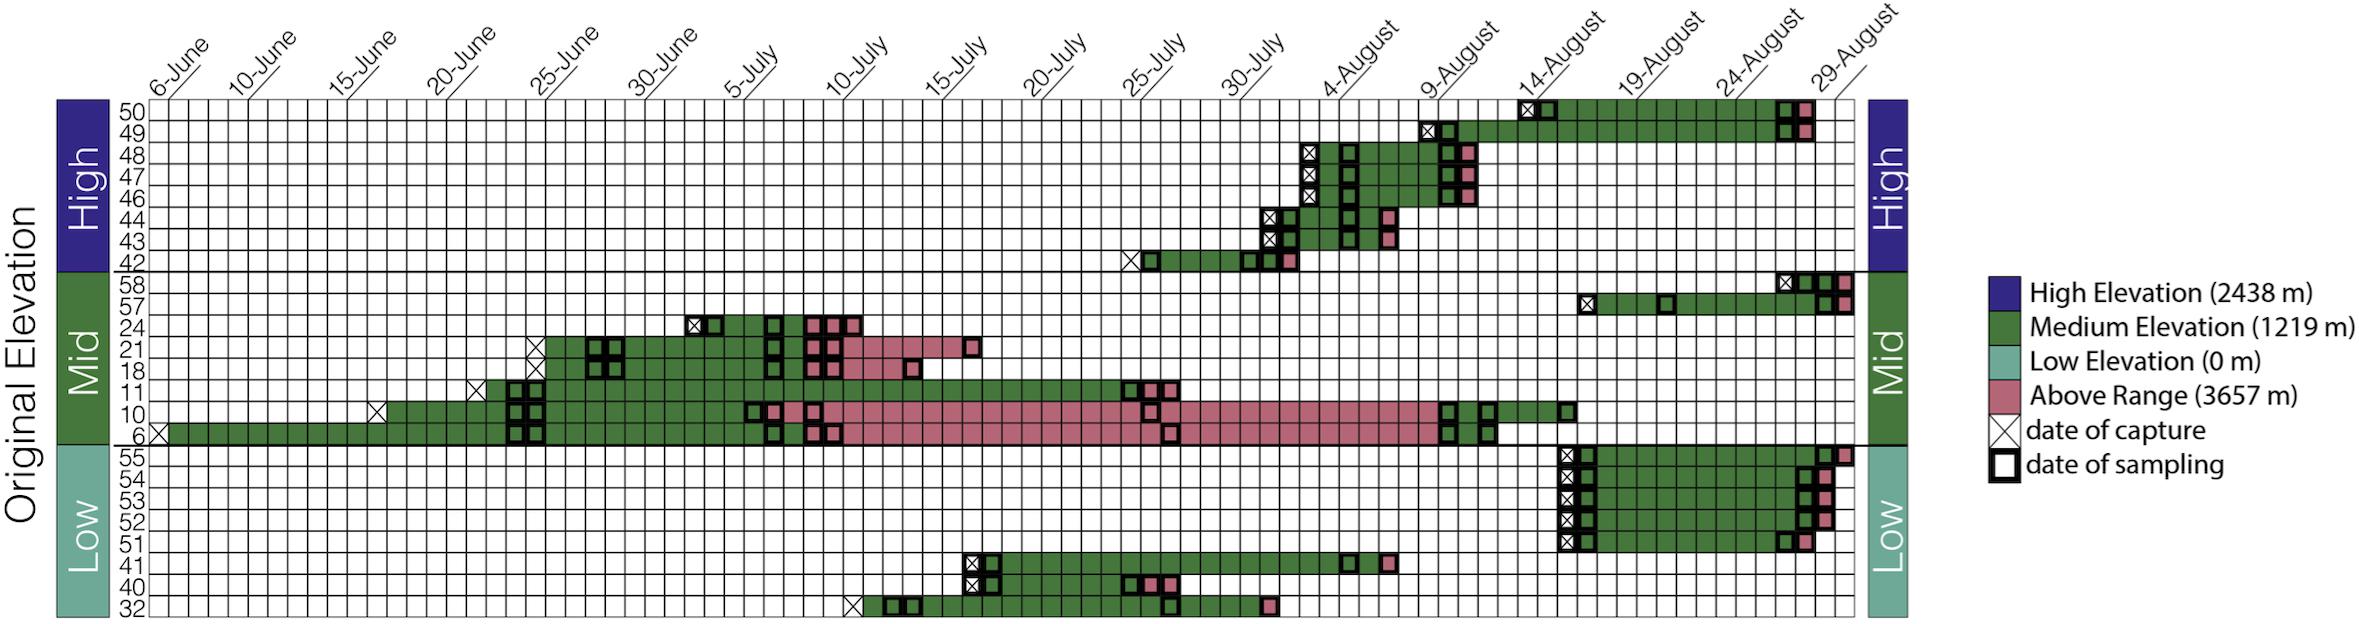
Figure 1. Sampling scheme: Each bird is represented by one row and each day within the study is represented as a separate column starting from June 6, 2018 and ending at August 30, 2018. The birds are grouped by capture elevation.
Materials and Methods
Sampling
Anna’s hummingbirds are a medium-sized hummingbird native to Western North America (Clark and Russell, 2020). In the summer of 2018, we captured Anna’s hummingbirds at three different elevations along their elevational distribution in the Central Valley and Sierra Nevada of CA, United States: 0 m (sea level, “Low”), 1,219 m (“Medium”), and 2,438 m (“High”). Eight birds were captured from each elevation and transported immediately, while fed every 45 min, to Big Pine, CA, United States (elevation: 1,219 m above sea level; 37.1649°N, 118.2895°W, “Within Range”). All hummingbirds were housed individually in wooden cubicles (0.75 m × 0.75 m × 0.75 m) with one single mesh wall to allow for natural air and lighting. Hummingbirds were provided ad libitum access to NEKTON-Nektar-Plus (NEKTON GmbH, Keltern, Germany)–a hummingbird-specific food that provides carbohydrates, proteins, and vitamins–as well as perches and water. Hummingbirds were kept at this “Within Range” site for a variable amount of time due to risks from inclement weather at high elevations and concern for animal well-being. Birds were kept Within Range for an average of 13 days (Figure 1) and a range of 3–20 days. The birds were subsequently moved to an elevation above their known natural range at Barcroft Station (elevation: 3,657 m above sea level; 37.5835°N, 118.2369°W, “Above Range”), in the White Mountains of California, and kept there for an average of 3 days. The longest amount of time spent at the Above Range elevation was 20 days and the shortest amount of time spent at the Above Range elevation was 1 day. Following the Above Range elevation, two birds were moved back to the Within Range elevation. One bird was kept there for 3 days and one bird was kept there for 7 days.
To collect fecal samples, wax paper was sterilized with a 10% bleach solution and left to air dry. Birds were housed individually and enclosures were lined with fresh wax paper daily. Every 24 h, the wax paper was removed and sterile toothpicks were used to transfer all of the fecal material from the wax paper to a sterile micro centrifuge tube. Samples were frozen at −20°C and shipped to the University of Connecticut for further processing. Additionally, 15 food samples were taken from the Within Range elevation over the course of the study and six food samples were taken from the Above Range elevation over the course of the study. All hummingbirds were captured and retained under United States Fish and Wildlife Service Permits MB087454-0 and MB087454-2 and California Fish and Wildlife Service Permit SC 006598. All methods were approved under University of Connecticut Institutional Animal Care and Use Committee Protocols A16-012 and A19-013.
Extraction
A subset of all fecal samples were selected for DNA extraction, targeting the first two samples and the last sample at each elevation (i.e., Within Range and Above Range) for each bird. This was to capture rapid shifts in the microbiome and to determine if the fecal microbiomes reached a stable microbiome prior to moving the birds to a different elevation. This resulted in a minimum of four samples per bird and up to nine samples per bird. Food samples were taken frequently at both sites. Six food samples were selected for DNA extraction: the first sample, middle sample, and last sample taken from each site. DNA was extracted using the QIAamp PowerFecal DNA (Qiagen, Hilden, Germany) kit. The manufacturer’s instructions were followed except for a 5 min extension of the bead beating step, to produce a final volume of 100 μl. A “trial” set of 14 samples was initially extracted and sequenced with its own DNA extraction control. The remainder of the samples were extracted together with their own DNA extraction control.
Sequencing
The samples were sequenced at the Microbial Analyses, Resources, and Service (MARS) facility at the University of Connecticut, Storrs, CT, United States on the Illumina MiSeq platform. The V4 region of the 16S rRNA gene was sequenced using the Earth Microbiome Project (EMP) primers and protocols (Caporaso et al., 2012). The “trial” set was sequenced with its one sequencing control and the remainder of the samples were divided across four sequencing runs, each with their own sequencing controls. Following standard protocol at the University of Connecticut Microbial Analysis, Resources, and Services, the Quant-iT PicoGreen kit was used to quantify the DNA extracts (Invitrogen, ThermoFisher Scientific). GoTaq (Promega) was used to amplify, in triplicate, 15 μL reactions of a variable region of the bacterial 16S rRNA genes [V4, 0.8 picomole each 515F and 806R with Illumina adapters and eight basepair dual indices (Kozich et al., 2013)] with the addition of 10 μg BSA (New England BioLabs). As most primers do not match the template priming site, 0.1 femtomole 515F and 806R that does not have barcodes and adapters was added to overcome initial primer binding inhibition. The PCR reaction began with a 95°C incubation step for 2 min followed by 30 cycles of 95°C for 30 s, 50°C for 60 s, and 72°C for 60 s. The final extension was completed at 72°C for 10 min. After pooling, the PCR products were visualized through the QIAexcel DNA Fast analysis (Qiagen) and normalized using the concentration of DNA from 350-420 base pairs. The QIAgility liquid handling robot was used to pool the DNA. Mag-Bind RxnPure Plus (Omega Bio-tek) was used to clean the pooled PCR products according to the manufacturer’s protocol. The MiSeq was used to sequence the cleaned pool using the v2 2 × 250 base pair kit (Illumina, Inc.).
Sequence Processing
The sequences were processed using DADA2 in R version 3.6.1 (Callahan et al., 2016; R Development Core Team, 2019). DADA2 stringently quality controls raw sequences and then identifies every unique amplicon sequence variants (ASVs) as an operational taxonomic unit. The sequences were aligned to the Silva reference database (v. 132) and assigned taxonomy with the RDP’s Naive Bayesian Classifier (Pruesse et al., 2007; Wang et al., 2007). Mitochondrial and chloroplast sequences were removed and the DECIPHER package in R was used to make a multiple alignment (Wright, 2015). The phangorn package version 2.5.5 was used to create a phylogenetic tree (Schliep, 2011). The decontam package in R was used to identify potential sequence contaminants in the negative extraction and PCR controls (Davis et al., 2018). The samples were divided into their respective sequencing runs when using the decontam package so that each run had the extraction and sequencing control that was used with those samples; all ASVs identified as likely contaminants were then removed. Following decontam, the phyloseq objects were re-merged into one phyloseq object (McMurdie and Holmes, 2013).
Analyses
R was used for all statistical analyses (R Development Core Team, 2019). For alpha (within sample) and beta (between samples) diversity analyses, all samples were rarefied to an equal sequencing depth of 7,675 sequences. We calculated alpha diversity using the Observed number of ASVs (richness) and the Shannon diversity index (Shannon and Weaver, 1949); these were calculated using the phyloseq package (McMurdie and Holmes, 2013). Rarefaction curves from the vegan package (Jari Oksanen et al., 2018) were used to assess whether the samples were sequenced in sufficient depth. Additionally, we conducted a sensitivity analysis to determine whether a single rarefied set of samples would adequately propagate uncertainty arising from the rarefaction process. We subsequently created 1,000 rarefied versions of our dataset and calculated that uncertainty arising from rarefaction was trivial–on average, only 0.06% of variation in Shannon diversity between samples could be attributed to rarefaction, and only 0.5% of variation in ASV richness of samples could be attributed to rarefaction. Consequently, our subsequent analyses were conducted on only a single rarefied set of samples.
The phyloseq and ggplot2 packages were used for microbial analyses and visualization of results (Wickham, 2009; McMurdie and Holmes, 2013). Non-metric Multidimensional Scaling (NMDS) visualized Bray–Curtis, unweighted UniFrac, and weighted UniFrac distances (Lozupone and Knight, 2005). Bray–Curtis is a count-based dissimilarity metric. Unweighted (sequence presence/absence) and weighted (sequence-abundance weighted) UniFrac distances are phylogenetic metrics. We chose these metrics to assess complementary aspects of the microbiome. Statistical significance of the following variables was determined using the adonis2 function (PERMANOVA) from the vegan package (McArdle and Anderson, 2001; Jari Oksanen et al., 2018): the elevations at time of sampling; the elevations on the date of capture; the sample taken on the date of capture; the first sample taken for each bird; the first sample at each elevation; the last sample at each elevation; each sex; the first, second, or last sample taken at each elevation; the sample types (fecal vs. food); and the sequencing runs.
For each bacterial taxon, we statistically tested for whether detection depended on elevation of capture, elevation at time of sampling, and days in captivity. Consequently, we used the rarefied sample abundances in a Generalized Linear Mixed Modeling (GLMM) framework to test for the effects of these variables for each taxa. Because only two birds were returned to the Within Range elevation after being moved to the Above range elevation, the samples taken from those birds at the Within Range elevation after Above Range elevation were excluded from this analysis. Given power limitations of small samples, we further limited analyses to only taxa that were detected in at least 15 different samples and had a total number of reads (i.e., abundance) greater than or equal to 20. These data requirements limited GLMM analyses to six phyla and 23 genera. We fit taxon-specific models using a (type 2) negative binomial distribution and a log link, with all three covariates as fixed effects. We additionally included individual bird IDs as a random effect, to account for the pseudoreplication of repeatedly sampling the same bird at different times. Many taxa were additionally zero-inflated, so for taxa where >10% of all sample reads were zeroes (21 of 29 taxa), we additionally added a hierarchical zero-inflation component to our model, where the frequency of zeroes was modeled with a single intercept. For two taxa (Asaia and Neokomagataea), the effect of testing elevation lacked identifiability, as the taxa were never found in samples from the High elevation site. In these two cases only, a single High elevation datapoint was randomly changed to the non-zero mean number of reads from all other samples of the taxa in order to make the model identifiable. Finally, given the large number of parameters estimated across all taxa and the risk of false discoveries, “significant” p-value thresholds were adjusted using the Benjamini–Hochberg procedure with a false discovery rate of 0.05 (Benjamini and Hochberg, 1995). Model fitting was conducted using the R package glmmTMB (Brooks et al., 2017).
To determine if bacterial taxa were differentially abundant the DESeq2 package in R was used (Love et al., 2014). Within the birds captured at the Low elevations, three of the birds were captured about 4.5–5.5 weeks before the remaining five birds were captured. Therefore, to test whether time of capture separately affects the microbiome, the first samples collected from these eight birds were compared in this package. Prior to further analyses, these eight samples were rarified to 14,289 sequences, the lowest number of sequences contained by one of the eight birds. Using DESeq2, plots were created that showed the logarithmic differences between the two groups of samples in the phyla and genera that were present using an alpha cutoff of 0.01.
Results
Sequencing and Initial Data Processing
A total of 7,197,010 reads came from 126 samples and seven controls; 7,171,655 were from samples only. After quality control, 6,364,521 high-quality reads remained; 6,354,811 from samples only. Using decontam, only one run, containing 72 total samples, was identified to have possible contamination. The four possible contaminated sequences were removed from all samples in the run. Following all filtering steps and decontam, there is an average of 52,339 ± 43,123 reads per sample. Samples were rarefied to 7,675 reads, the number of reads the sample with the lowest had after quality filtering steps (Supplementary Figure 1). Sequencing run was not significantly correlated with microbiome diversity (Table 1).
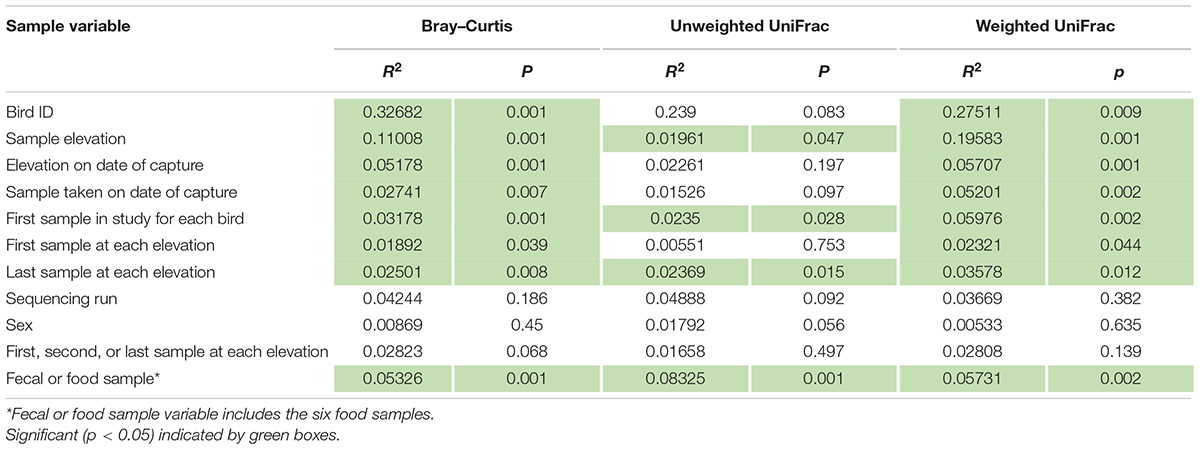
Table 1. Adonis2 results for sample variables using each beta-diversity matrix.
Microbiome Taxonomic Composition
There were a total of 742 ASVs present in the samples. Of those, 691 ASVs were present only in the fecal samples and 15 were present only in the food samples with 36 ASVs shared between the types of samples. The 36 ASVs found in both hummingbirds and food comprised 65.8% of the hummingbird microbiome and were primarily Firmicutes and Proteobacteria (Figure 2). The hummingbird fecal samples were dominated by four phyla: Actinobacteria (35.6%), Firmicutes (26.7%), Proteobacteria (21.8%), and Fusobacteria (15.2%) (Figures 2, 3A). These four phyla accounted for 99.28765% of all of the sequences and were consistently seen regardless of Bird ID or sampling elevation (Figure 2). There were 213 genera present in the samples, 10 genera had abundances greater than 1% of all sequences in the samples: Corynebacterium (32.1%), Leuconostoc (18.6%), Streptobacillus (13.0%), Klebsiella (10.3%), Fructobacillus (9.6%), Rothia (3.8%), Lactococcus (2.7%), Enterococcus (2.0%), Weissella (1.9%), and Escherichia/Shigella (1.8%).
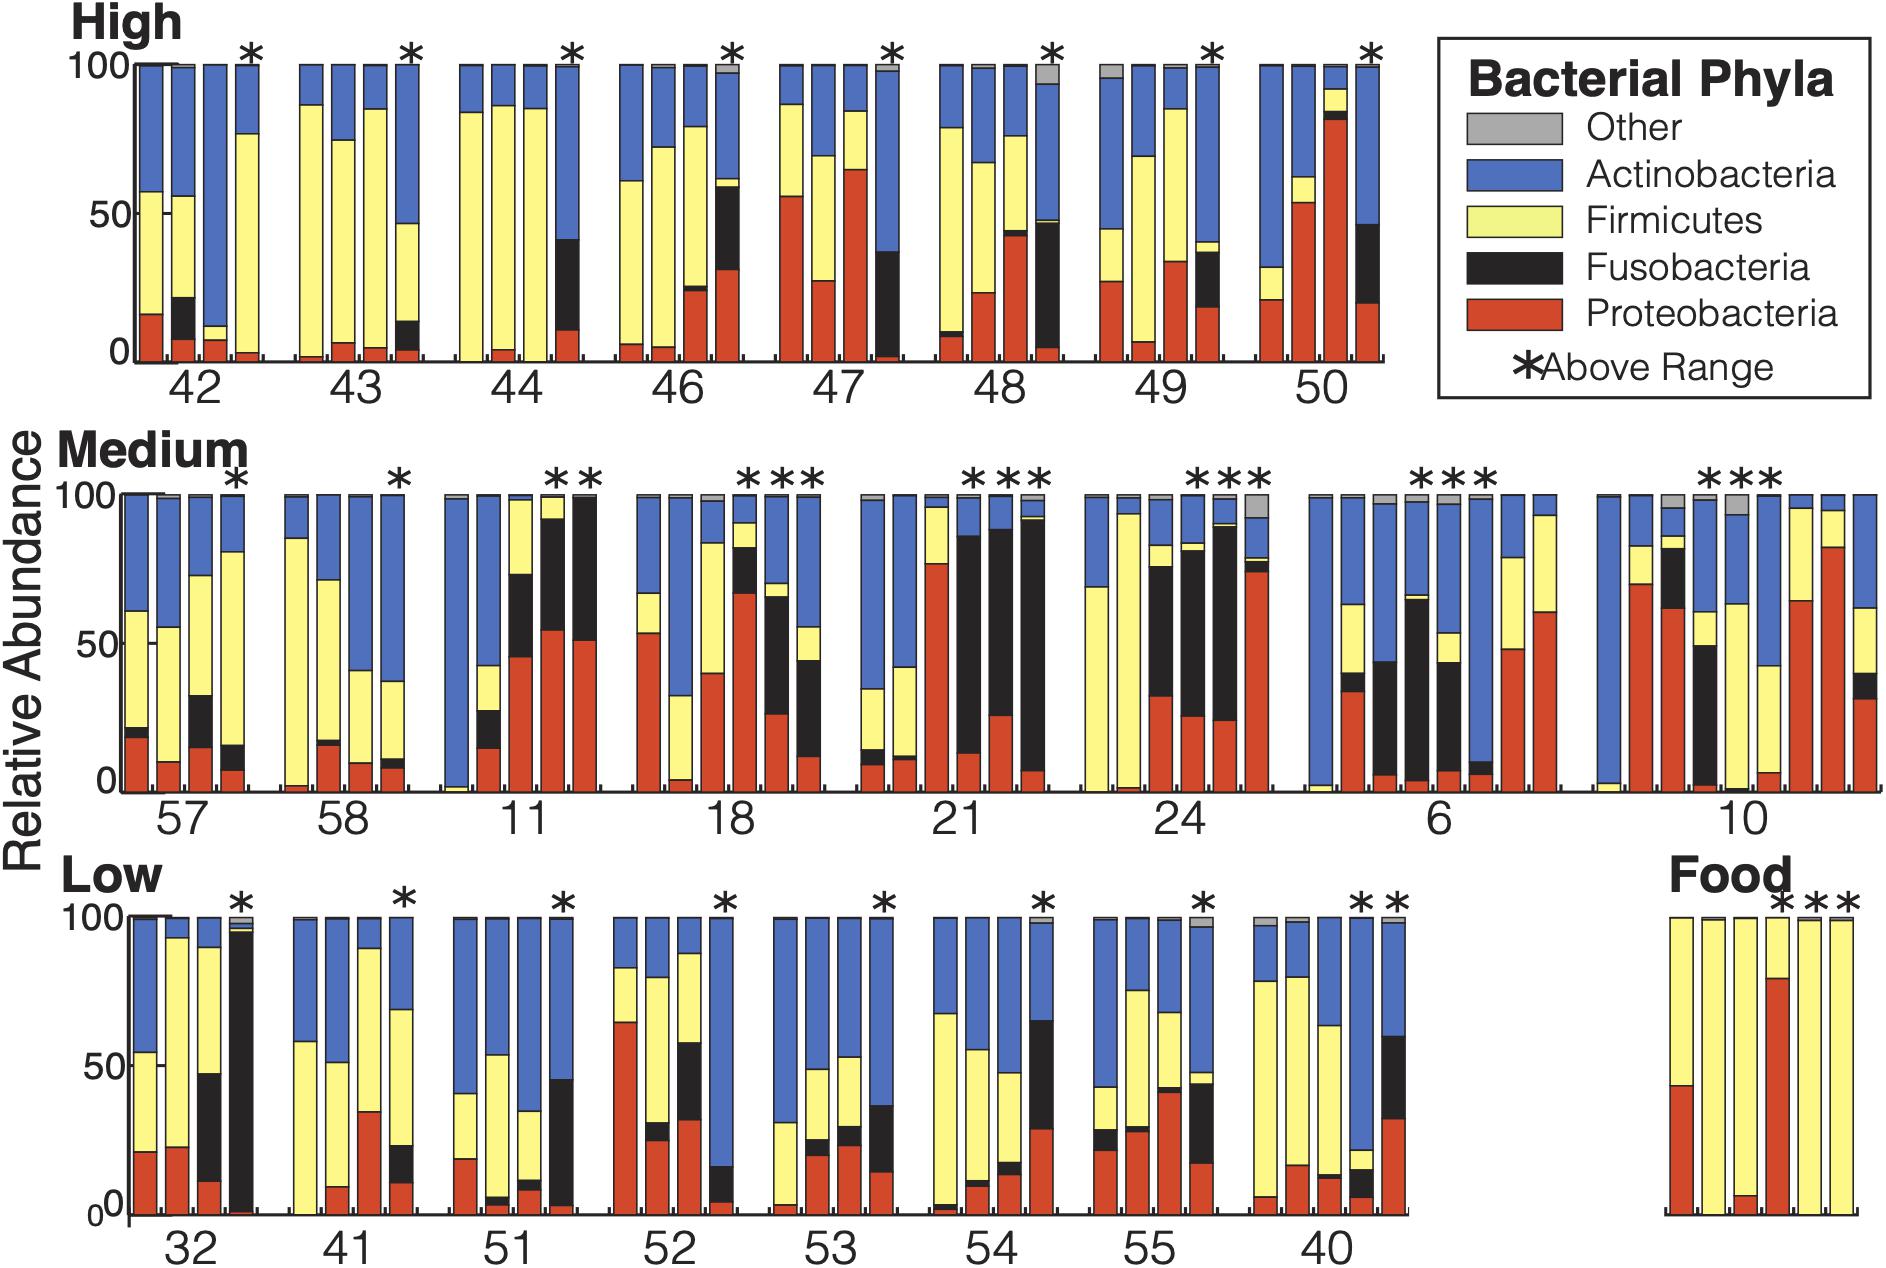
Figure 2. Bacterial composition of the Anna’s hummingbird fecal microbiome: All samples from each bird are grouped together and displayed chronologically. Birds are grouped by capture elevation. Samples taken at above range elevation have asterisks above them.
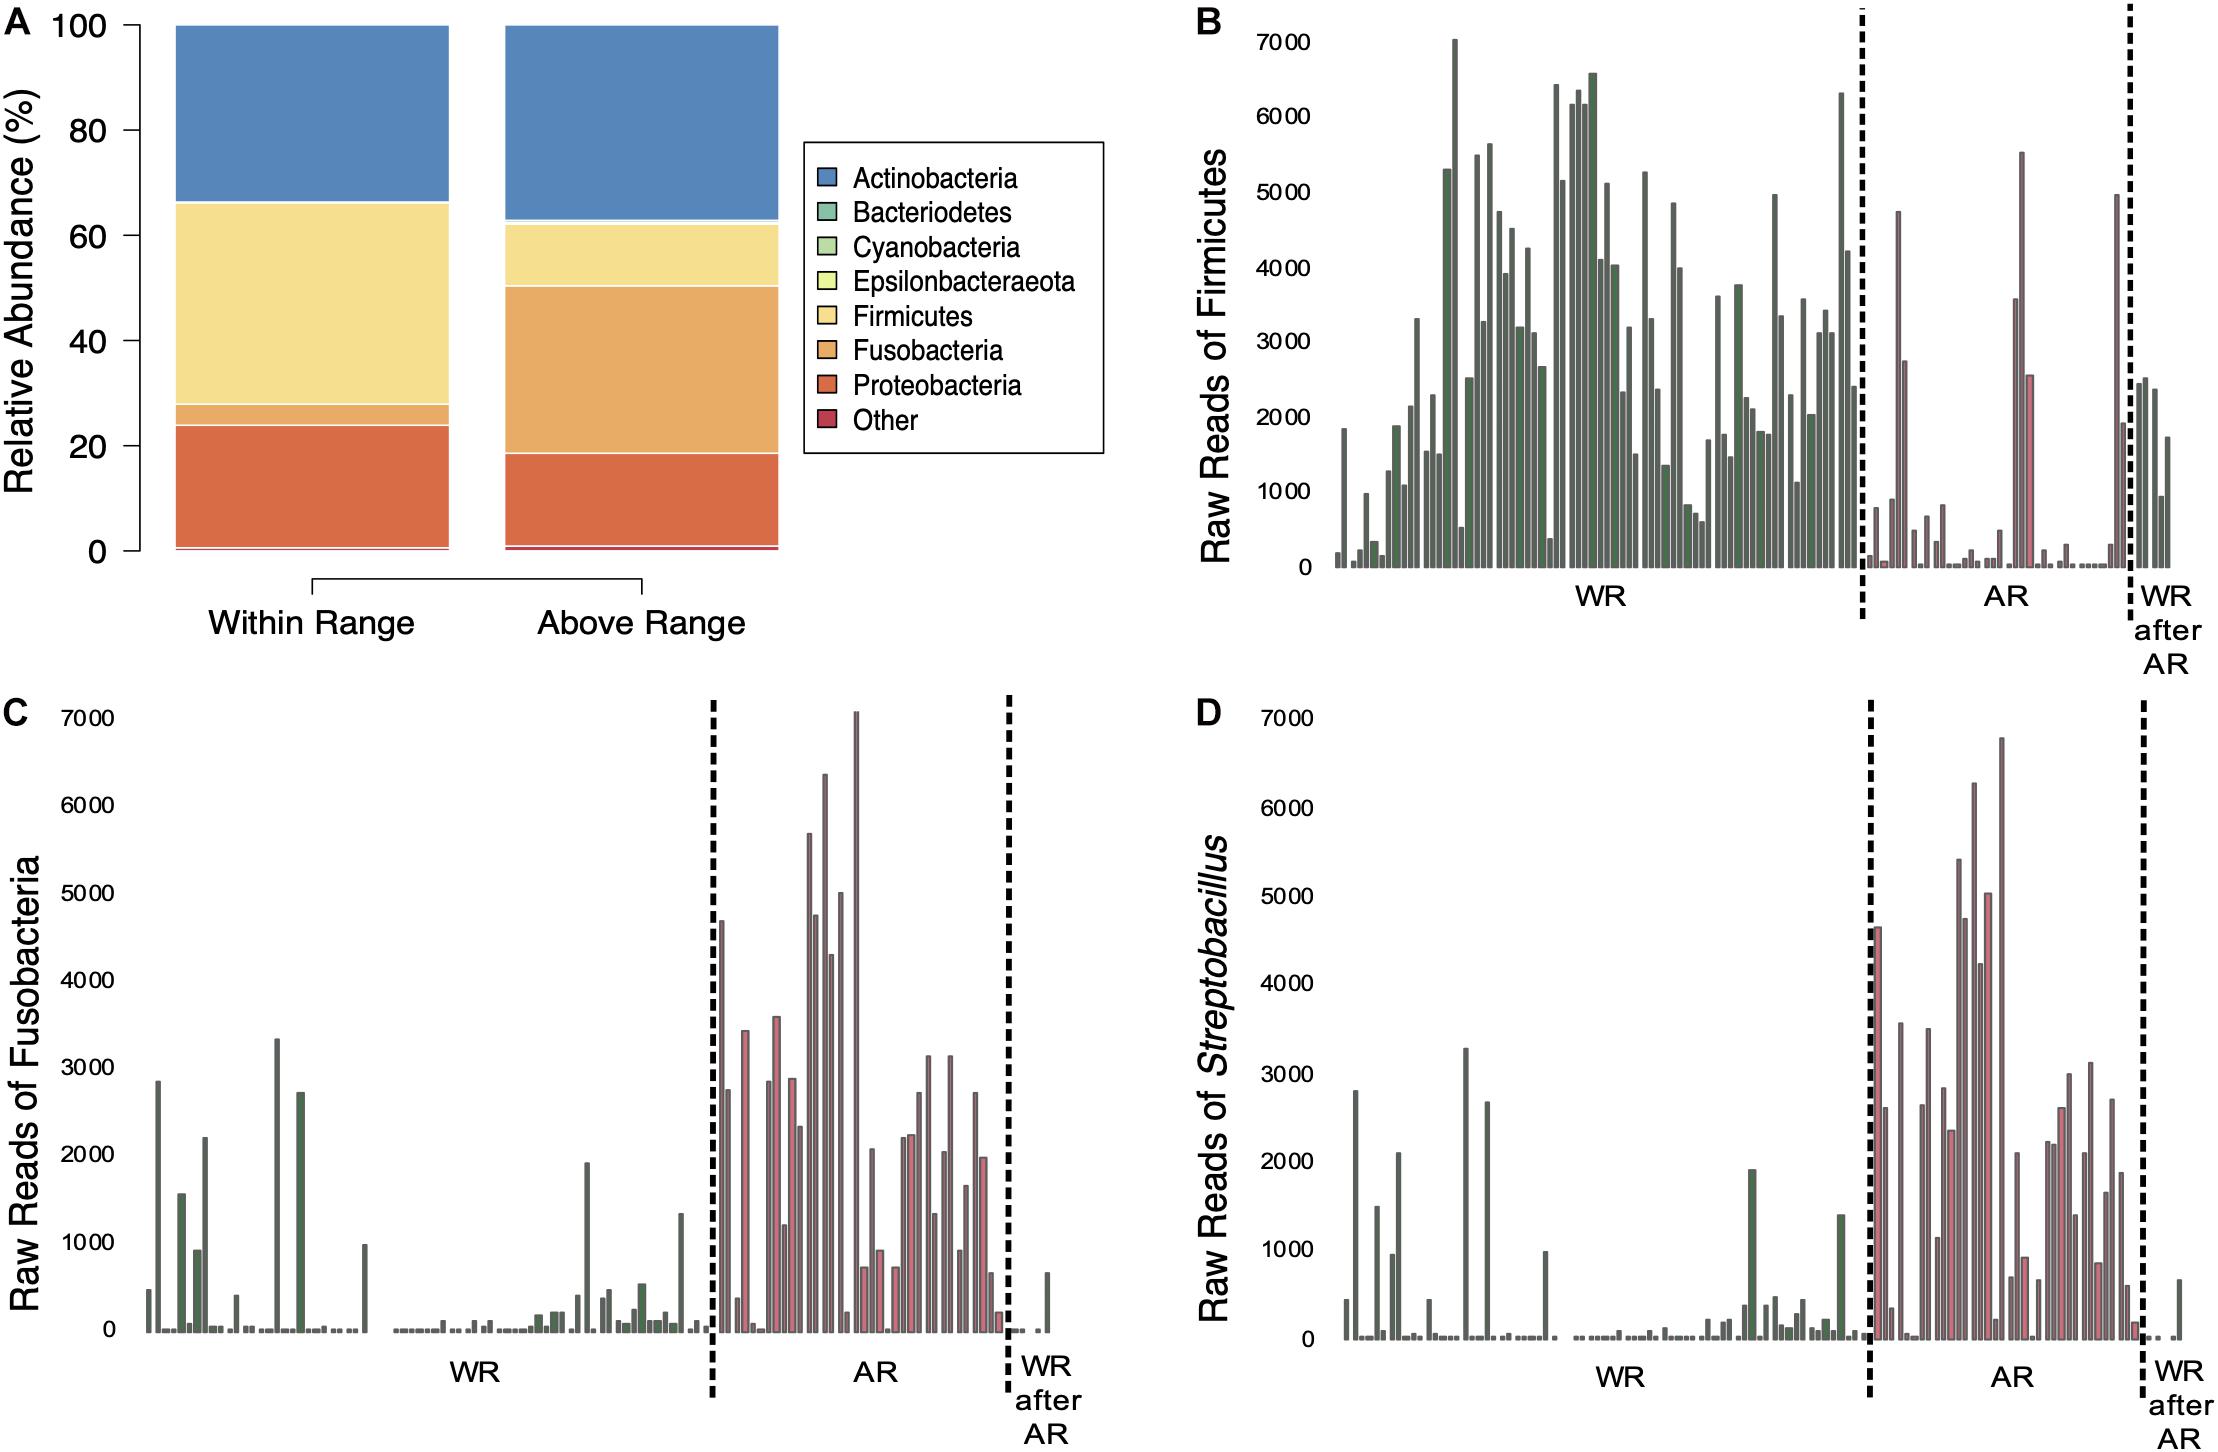
Figure 3. Comparisons of bacterial composition between sampling elevations. (A) Average relative abundances of samples taken at the two elevations. (B–D) Amount of sequences of Firmicutes (B), Fusobacteria (C), and Streptobacillus (D) in the samples separated by sampling elevation (dotted line); WR, within range; AR, above range; WR after AR, within range after above range.
Mixed-effects models were run on six phyla and 23 genera that met data requirements (see Methods). Of the resulting 29 GLMM models, one showed a lack of numerical convergence (Pseudomonas), likely due to low sample sizes. Consequently, we present results on the remaining 28 taxa and taxonomic groups with adequate model convergence (Supplementary Table 1).
Mixed-effects modeling showed significant differences (correcting for false discoveries, see Methods) between the fecal microbiomes sampled at the Within Range and Above Range elevations, and, to a lesser extent, as a function of how long birds had been in captivity (Figure 4). The phylum Fusobacteria was 7.0x more abundant at Above Range elevations while Firmicutes was 0.3x lower (Figures 3B,C, 4). These effects were predominantly caused by genera that were also significantly associated with one of the two elevations. In particular, Streptobacillus relative abundance was significantly higher in Above Range samples (6.9x; Figure 3D), as was–to a lesser (and non-significant) extent–Riemerella (2.4x). A number of taxa were significantly associated with the Within Range elevation. Two genera, Asaia and Neokomagataea were only found in samples from birds tested Within Range and were entirely absent from samples Above Range. In addition, Fructobacillus, Gluconobacter, Klebsiella, Lactococcus, Leuconostoc, Rothia, and Weissella all were significantly associated with the Within Range elevation (Figure 4).
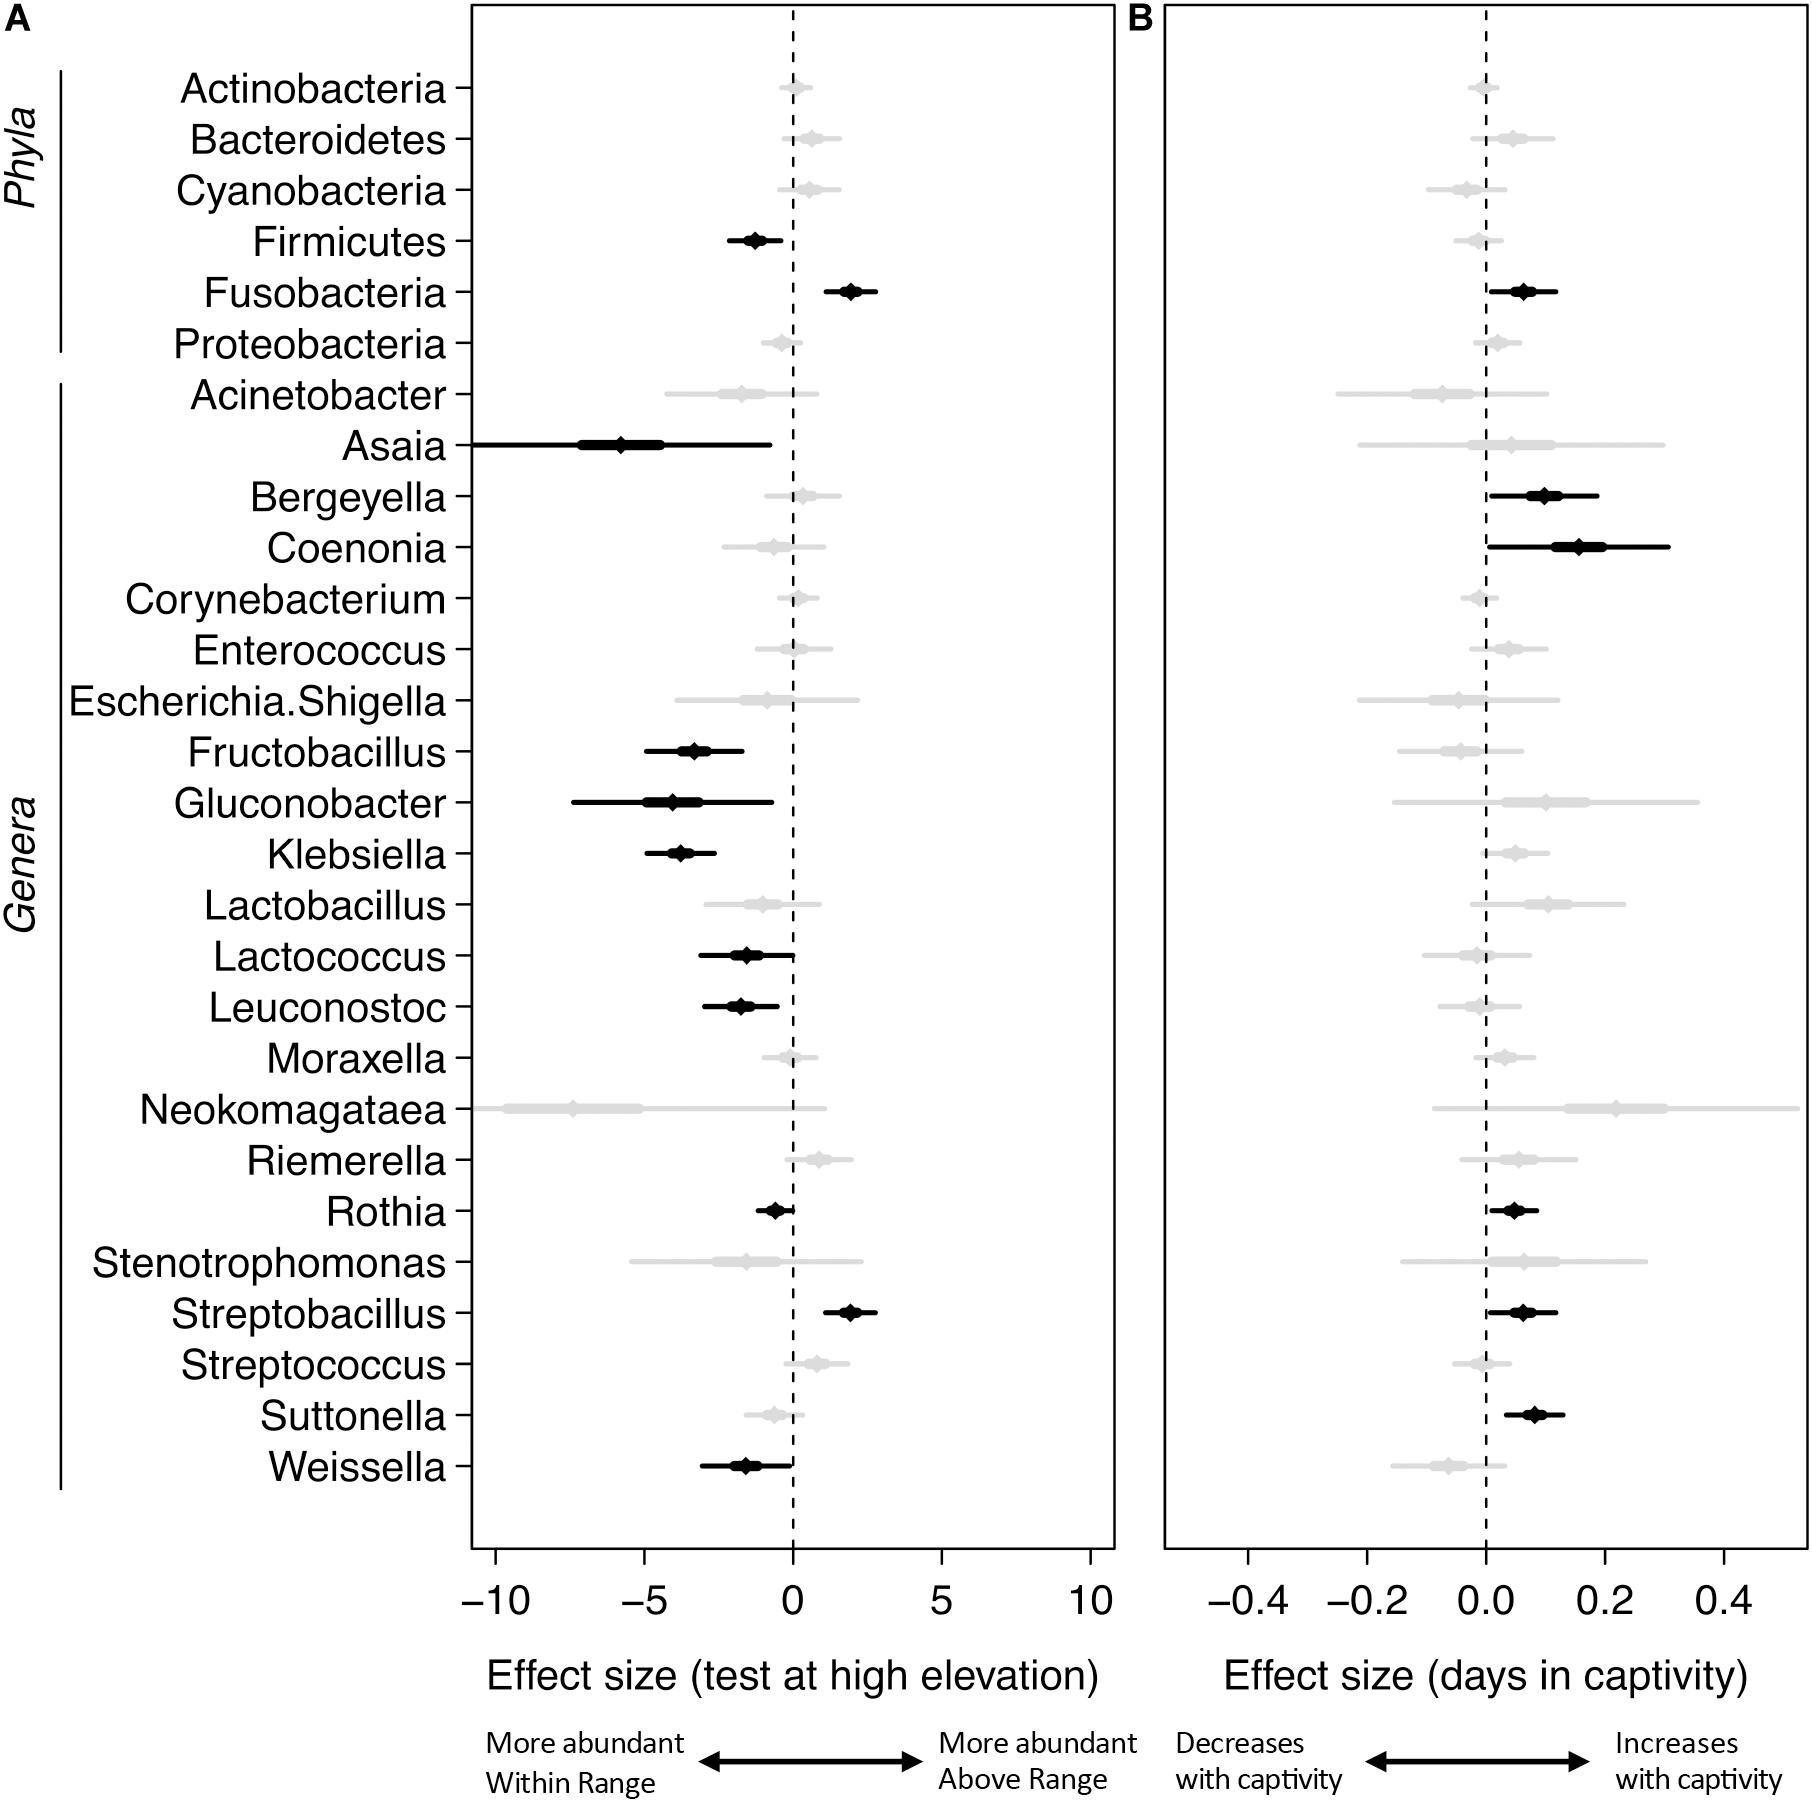
Figure 4. Mixed-effects modeling of sampling elevation (A) and days in captivity (B). The central diamond is the mean estimate, the thicker line shows the 50% confidence interval, and the thin line shows the 99% confidence interval. Black indicates significant results using a Benjamini–Hochberg adjustment with a false discovery rate of 0.05, gray are not significant at this value.
Our results also showed statistically significant changes in the microbiome as a result of how long birds stayed in captivity (Figure 4). In particular, the phylum Fusobacteria increased by 1.1x for each day the birds were kept in captivity. Several genera also increased significantly over time (Figure 4 and Supplementary Table 1), including the genera Bergeyella (1.1x), Coenonia (1.2x), Rothia (1.05x), Streptobacillus (1.06x), and Suttonella (1.08x). No taxa showed a significant decrease in relative abundance over time in captivity.
Comparatively, taxa were infrequently associated with capture elevation. Relative to birds captured at High elevations, there were no significant differences in the relative abundance of any taxa for birds captured at Low elevations (Supplementary Table 1). For birds captured at middle elevations, Cyanobacteria was significantly higher (6.4x), and the genera Coenonia (0.01x) and Weissella (0.04x) were significantly lower (Supplementary Table 1).
When comparing the first samples of the Low capture elevation birds in July to those captured in August, only two genera were differentially associated with an alpha of 0.01 (Supplementary Figure 2). Weissella was associated at >5-fold higher levels with the birds captured in August and Fructobacillus was associated at >10-fold higher levels with the birds caught in July.
Alpha Diversity
Across all fecal samples, the average rarefied ASV richness per sample is 30.7 ± 20.1 (range: 9.9–181.7; Supplementary Figure 3). The average rarefied ASV Shannon diversity per sample is 1.66 ± 0.50 (rangeI: 0.14–2.56).
Beta Diversity
Food samples modestly clustered away from the fecal samples and were statistically distinct (weighted UniFrac: r2 = 0.05731, p = 0.002; Figure 5). The food samples were removed for the remaining analyses.
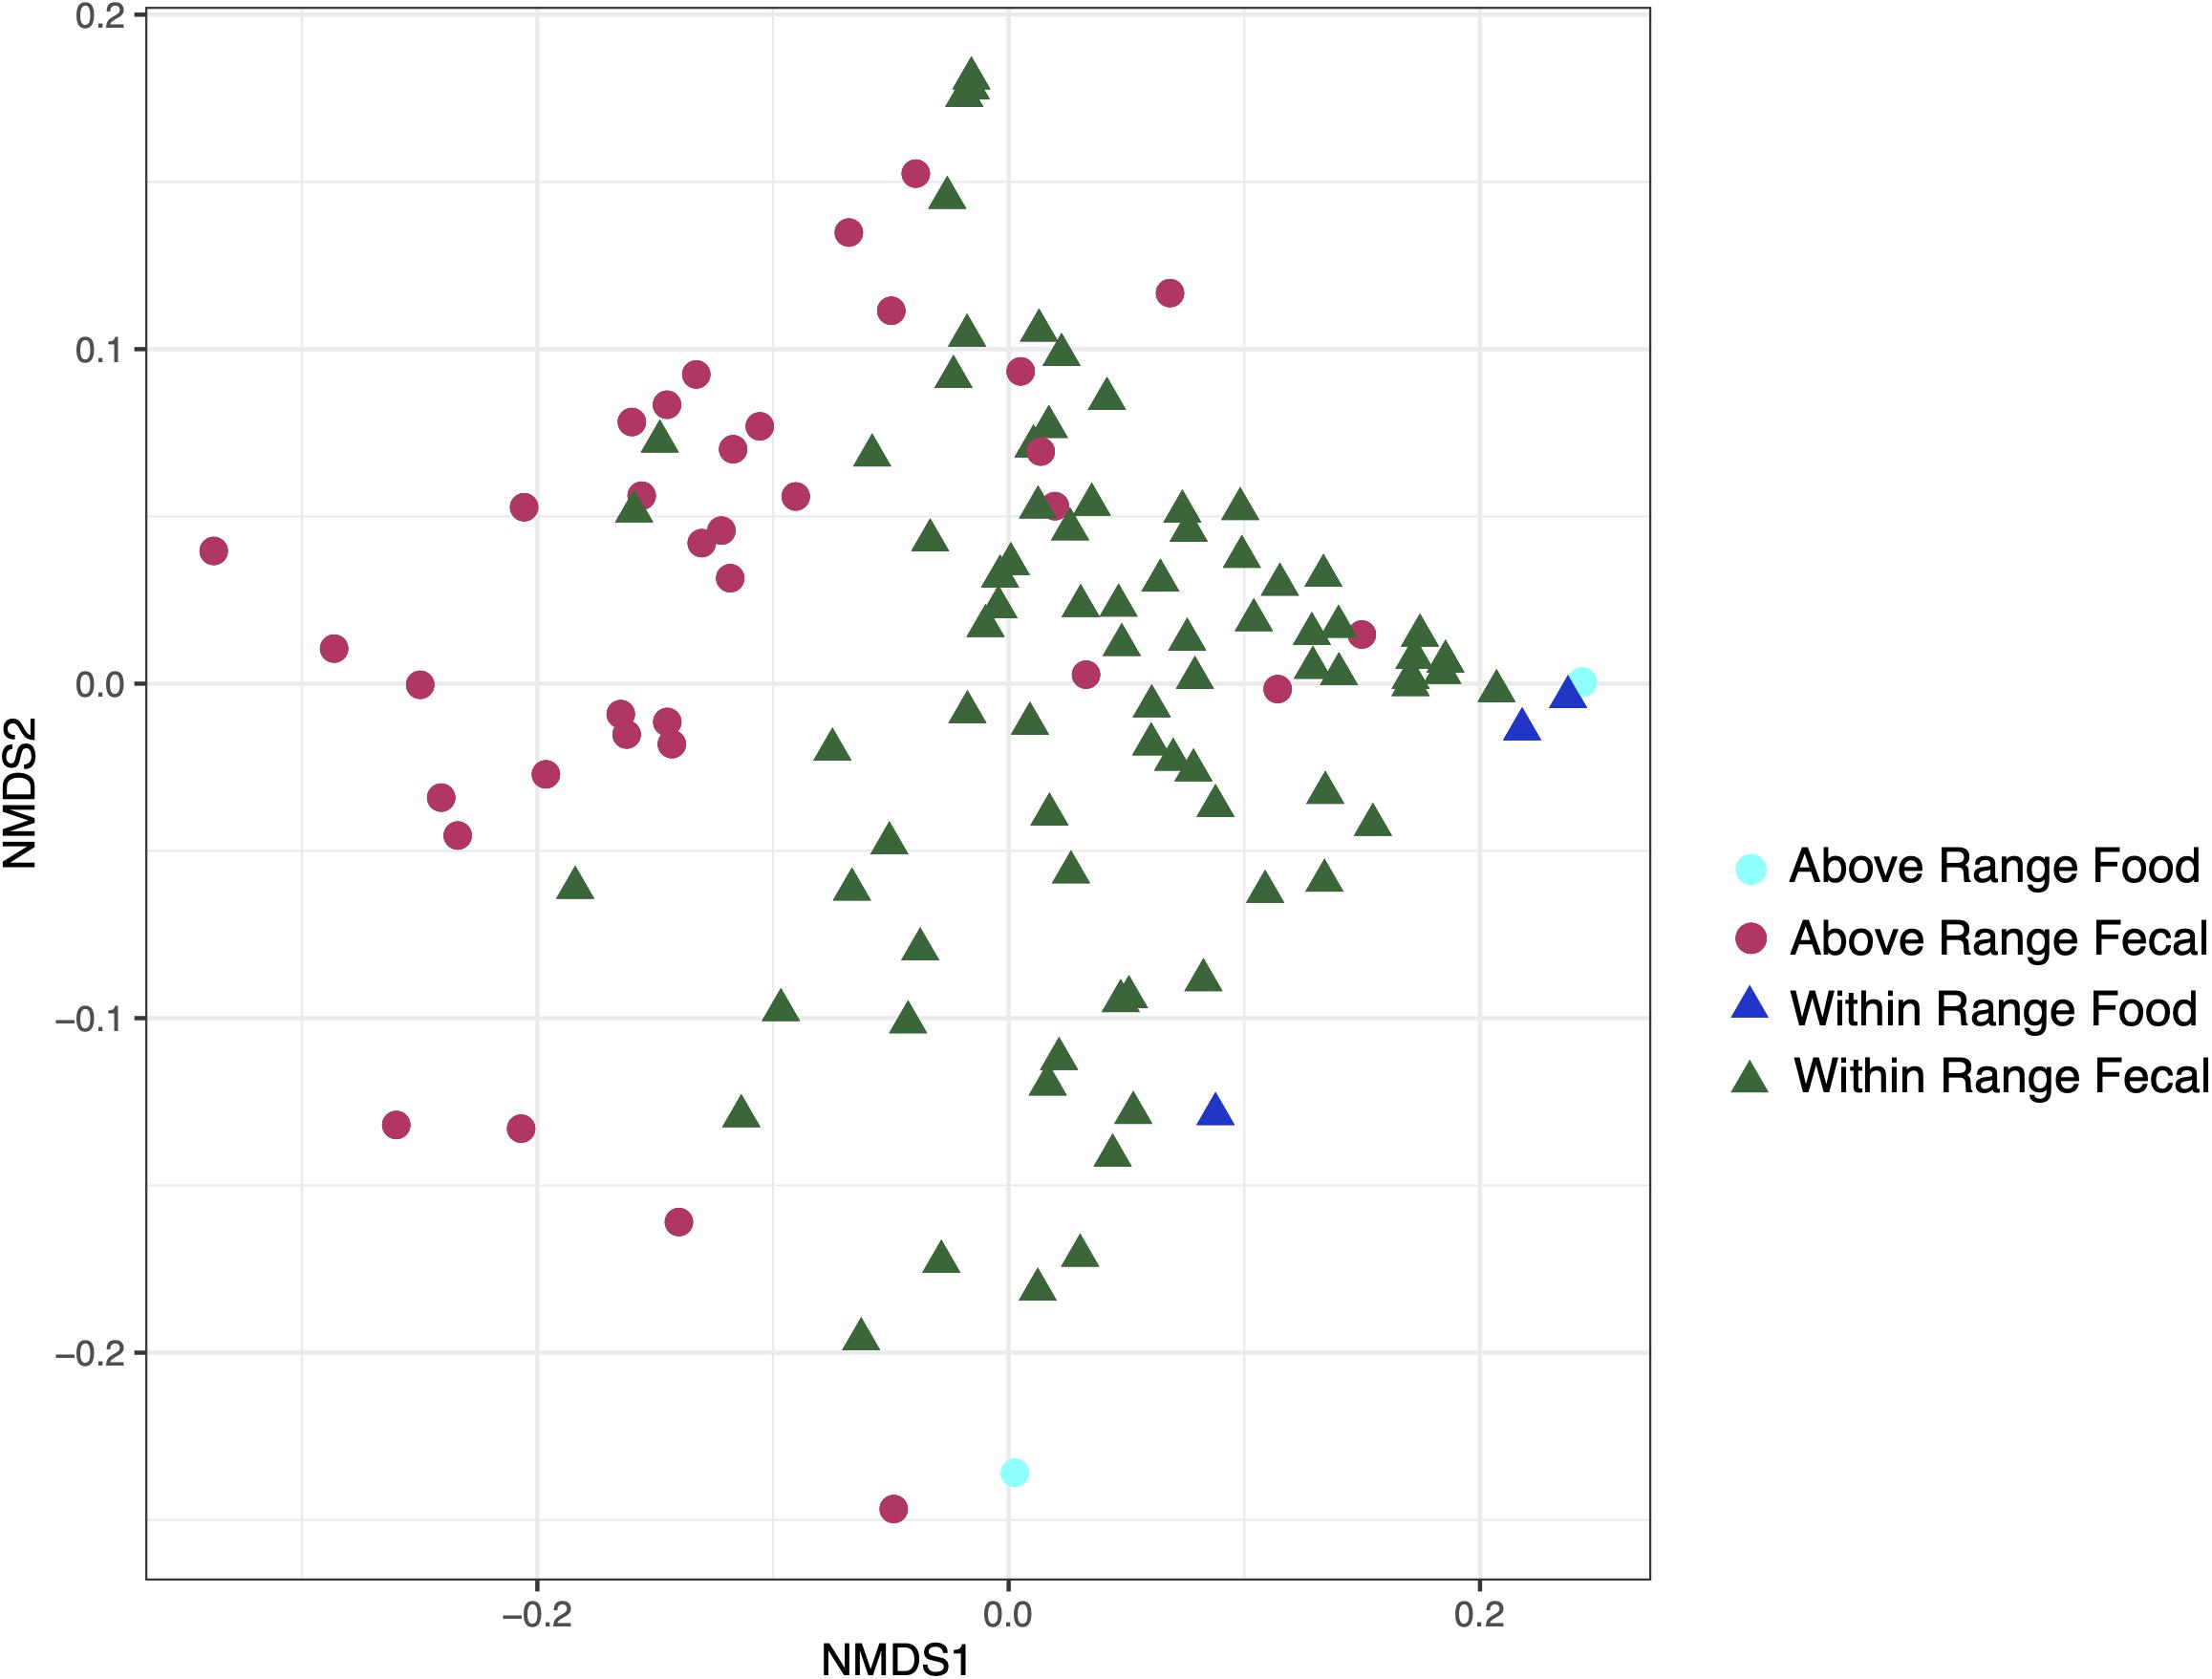
Figure 5. Non-metric multidimensional scaling ordination constructed from weighted UniFrac of fecal and food microbiome samples at the within range and above range elevations.
Bird ID, Capture Elevation, the sample taken on the date of capture, and the first sample taken at each elevation were all significant correlates to microbiome diversity (p < 0.05) for two of the three tested metrics: Bray–Curtis and weighted UniFrac. However, there were substantial differences in effect size and p-value depending on distance metric for each variable (Table 1). Sample elevation, the first sample taken from each bird, the last sample at each elevation, and the sample type (Fecal or Food) were significant for all three of the distance metrics. Individual Bird ID explained the most variation at 27.511% (p = 0.009; Supplementary Figure 4) using weighted UniFrac. The variable that explained the second highest amount of variation was Sample Elevation at 19.583% (p = 0.001; Figure 6A). Sample Elevation also had the largest discrepancy between different metrics as it explained 19.583% (p = 0.001) using weighted UniFrac but only 1.961% (p = 0.047) using unweighted UniFrac with Bray–Curtis falling between explaining 11.01% (p = 0.001; Figure 6).
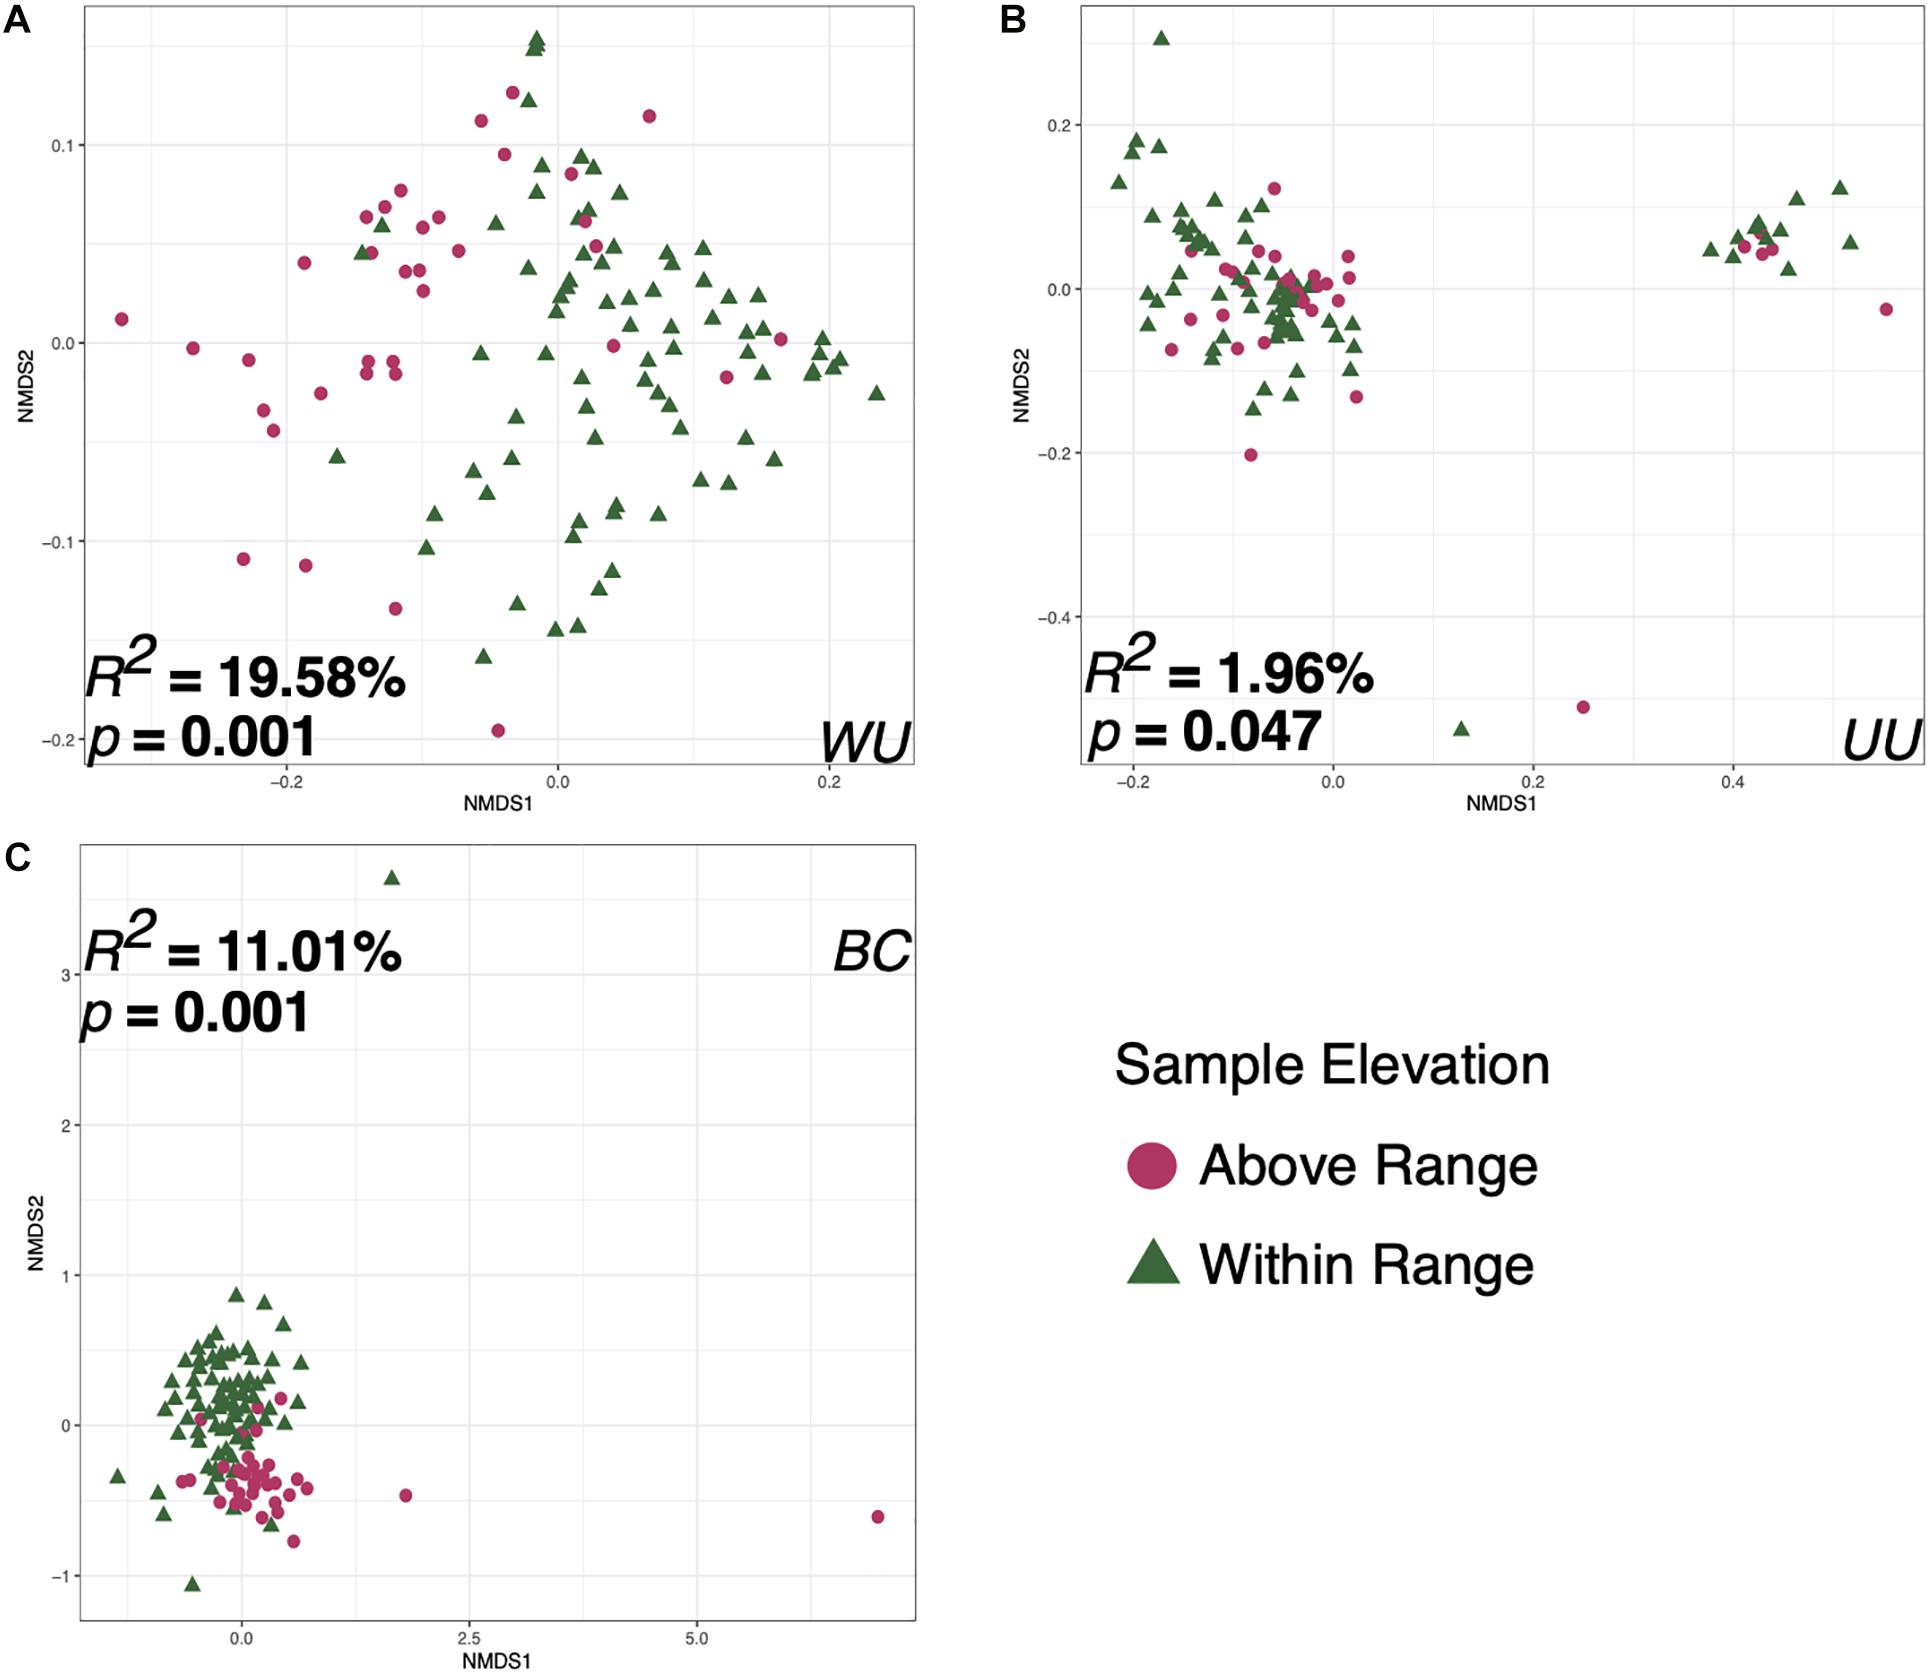
Figure 6. Non-metric multidimensional scaling ordination constructed from weighted UniFrac (A), unweighted UniFrac (B), and Bray–Curtis (C) matrices of fecal microbiomes collected from Anna’s hummingbirds in captivity at two elevations. Colors represent the two different sample elevations.
The sequencing run, sex, and whether the sample was the first, second, or last taken at the elevation were not significant (p > 0.05) for the three metrics tested (Supplementary Figures 5A,B).
Discussion
The microbiome is an important aspect of vertebrate health and fitness, yet how the microbiome assembles, persists and changes through time are largely unknown. Additionally, how external forces affect microbiomes, and particularly avian microbiomes, is poorly understood but could be significant to the health of the host. Due to the rising temperatures associated with anthropogenic climate change, many species are expected to shift their ranges to higher elevations (Tingley et al., 2012). Understanding how this shift affects the microbiome, and how microbiome changes affect the host, will allow us to better predict if future elevation shifts will be harmful to the birds.
This study shows that elevation can directly affect the Anna’s hummingbird fecal microbiome (Figures 2–4, 6 and Table 1). Many birds only have one sample at Above Range elevation, so we can not say that this is a long-term or permanent change in the microbial diversity. Comparing the phylum-level average relative abundances from Within Range and Above Range, the percentages of Actinobacteria and Proteobacteria remained relatively stable. However, the percentages of Firmicutes and Fusobacteria changed significantly. The Within Range average contained 0.3x as much Firmicutes while the Above Range average contained 7.0x as much Fusobacteria (false discovery rate of 0.05, Figures 3A–C, 4). The Within Range and Above Range samples cluster apart from each other in the weighted UniFrac NMDS plot with this statistic explaining 19.583% (p = 0.001) of the variation (Figure 6A). This is a 10-fold higher percent explained than the unweighted UniFrac, explaining only 1.961% (p = 0.047) of the variation (Figure 6B). Because unweighted UniFrac does not take abundance into account and weighted UniFrac does, this indicates that Within Range and Above Range samples contain overlapping ASVs, but their relative abundances shift due to elevation.
Firmicutes are negatively associated with the higher elevation. Firmicutes are diverse in their oxygen requirements, including some species that are anaerobic while others are obligate or facultative aerobes. Fusobacteria, the bacteria that are more relatively abundant at the higher elevation, are typically anaerobic. The genus Streptobacillus was specifically associated with the Above Range elevation and is typically microaerophilic. This was the only genus of Fusobacteria that showed any significant changes and is predominantly responsible for the increase in relative abundance of Fusobacteria at the higher elevation. Because of the lower effective oxygen concentrations available at the higher elevations, one hypothesis to explain our results is that Firmicutes may not be able to thrive at high elevations, and are outcompeted by Fusobacteria, specifically Streptobacillus. Experimental corroboration of this would need to be performed. To formally test this, competition assays could be performed in a laboratory setting and gut oxic levels could be monitored within the hummingbirds. Additionally, quantifying absolute abundance of Firmicutes, Fusobacteria, and Streptobacillus would be necessary to determine changes in population size.
One genus of Bacteroidetes, Riemerella, was detected at a higher level in the Above Range elevation (2.4x higher, Figure 4). This genus contains only three known species, two of which are considered avian pathogens: Riemerella anatipestifer, a pathogen that causes septicemia, and Riemerella columbina, a pathogen that causes a respiratory disease (Segers et al., 1993; Vancanneyt et al., 1999; Rubbenstroth et al., 2013). While hummingbirds have not been reported to contract these diseases, they did experience physiological challenges at the Above Range elevation that could potentially be due to, or facilitate invasion by, one of these pathogens.
Capture elevation explained 5.7% of the microbial diversity in the fecal microbiomes (weighted UniFrac, p = 0.001; Table 1 and Supplementary Figure 5C), showing that the elevations in which the birds were living have an effect on the relative abundances of phylogenetic lineages within microbiomes. Capture elevation was also significant using Bray–Curtis (R2 = 0.05178, p = 0.001), but not unweighted UniFrac (R2 = 0.02261, p = 0.197). This shows that capture elevation explains 5% of the variation when using simple counts of the taxa, but when phylogeny is taken into account, the counts are no longer significant until the abundances of those taxa are incorporated. Birds captured at middle elevation had significantly more Cyanobacteria (6.4x) and significantly less Coenonia (0.01x) and Weissella (0.04x) compared to birds captured at High elevation (Supplementary Table 1). Among Cyanobacteria, Coenonia, and Weissella, only Weissella also showed significant differences between Within Range and Above Range sampling, however, it is more abundant in Within Range samples and less abundant at Medium capture elevation samples. Therefore, living at a higher elevation within the species natural range does not appear to precondition the microbiome for living at an Above Range elevation. Together with the high abundance of Riemerella at the Above Range elevation, these data give rise to a new question: What are the physiological limits imposed on the host by the microbiome?
All birds were first transported to and housed at the Within Range elevation before being housed at the Above Range elevation; thus, (1) all birds underwent the same initial conditions and (2) time in captivity could be responsible for shifts in phylum and genus abundances. Due to the differences in time birds spent at the Within Range and Above Range elevations, controlling for the time spent in captivity was possible in our analyses. No genera or phyla responsible for shifts in sample elevation were as highly associated with time in captivity (Figure 4). Both Fusobacteria and Streptobacillus increased significantly per day, but only at 1.1x and 1.06x, respectively. This indicates that the time spent in captivity was not the driver of the changes shown in sample elevations.
Beyond identifying the differences in the Anna’s hummingbird fecal microbiome due to elevation changes, our results characterize the hummingbird fecal microbiome and the longitudinal changes within individuals. We show that the hummingbird fecal microbiome is relatively consistent with respect to the four main phyla: Actinobacteria, Firmicutes, Proteobacteria, and Fusobacteria (Figures 2, 3). Across many species, the gastrointestinal tract of birds has been shown to be predominantly Firmicutes and Proteobacteria with lower amounts of Bacteroidetes and Actinobacteria (e.g., Waite and Taylor, 2014; Grond et al., 2018; Capunitan et al., 2020), including in hummingbirds (Hird et al., 2015). The dominant phyla in Anna’s hummingbirds are commonly seen in other avian species, but with higher abundances of Actinobacteria and Fusobacteria than is commonly seen. The phyla break down into only ten genera represented at more than 1% in all of the samples: Corynebacterium, Leuconostoc, Streptobacillus, Klebsiella, Fructobacillus, Rothia, Lactococcus, Enterococcus, Weissella, and Escherichia/Shigella. Corynebacterium was the most dominant at 32.1% of all sequences in all of the samples, a result shown in other avian microbiome studies (García-Amado et al., 2018). While elevation explained a high amount of variation in the samples, Bird ID, or from which bird the sample actually came, explained the most variation in two of the three metrics used for beta diversity (Table 1 and Supplementary Figure 4). Using Bray–Curtis, Bird ID explained 33% (p = 0.001) and using weighted UniFrac, Bird ID explained 28% (p = 0.009). When using unweighted UniFrac, Bird ID was not statistically significant between the two groups, potentially showing that similar bacteria were present in the samples.
Sex did not explain the differences in the fecal microbiome of these samples in any of the three beta diversity distance metrics used (Table 1 and Supplementary Figure 3A), a result that has been found in other bird species (Hird et al., 2015, 2018). However, this may not be a consistent result throughout the year, as birds undergo significant physiological changes throughout the year and this sampling was conducted during the non-breeding season.
Diet is frequently an important driver of avian intestinal microbiomes (Grond et al., 2018). To determine the relationship between the supplied food and the hummingbird fecal microbiome, we sampled the food given to the hummingbirds in the study three times at each elevation the birds were housed and compared their microbial diversity to that of the fecal samples. 99.6% of the food microbiomes belonged to Firmicutes and Proteobacteria (Figure 2). There were no Fusobacteria found in any food samples. Thirty six of the ASVs present in the food samples were present in the fecal samples as well. Only 15 ASVs were present in the food samples and not present in the fecal samples, but 691 ASVs were unique to the fecal samples. Roughly 65.8% of the fecal microbiome sequences are from ASVs shared with food samples so there is high similarity between the fecal samples and the food samples. However, 34.2% of fecal microbiome sequences were not in the food samples, meaning more than one third of the fecal microbiome is not derived from the birds’ current food sources. The food that an Anna’s hummingbird eats is actively moved through the digestive tract for <15 min and is retained (including non-moving time) for 48 min on average (Karasov et al., 1986), the number of ASVs shared between their food and the fecal microbiome may be unsurprising. Instead, the greater than one-third of the fecal samples that come from unshared ASVs indicates Anna’s hummingbirds host a resident microbiome that does not solely come from the food immediately passing through them.
One of the main strengths of this study was that we experimentally manipulated elevation in wild animals under natural (semi-captive) conditions. However, because of the realities of field studies, there were variables outside of our control. There may be treatment-independent factors affecting the microbiomes in our study. One such factor is that these were wild birds that were captured at different times. This study may only be showing a portion of the variables affecting the Anna’s hummingbird fecal microbiome. One variable that could have a factor is date of capture. To determine if capture date did affect the samples, we compared the microbiomes of the first samples of the birds caught at Low elevation as three of the birds were caught approximately 1 month before the other five birds. Only two Firmicutes genera were differentially abundant due to when the birds were captured, showing that 1 month difference in sampling time has a small role in the microbiome samples, but more information is needed to show to what extent time of capture changes a microbiome.
Overall, this study showed elevation causes a change in the Anna’s hummingbird microbiome while birds also maintain some stability in their microbiome over time. Additional experiments are needed to assess the physiological outcomes and the specific limitations that the microbiomes imposes on the birds. Understanding these limitations posed by how external factors, like elevation, shape the biodiversity of the Anna’s hummingbird microbiome could lead to predictions of the consequences of future potential range shifts due to climate change.
Data Availability Statement
The sequences have been deposited to the NCBI Short Read Archive accession number PRJNA659540.
Ethics Statement
All hummingbirds were captured and retained under United States Fish and Wildlife Service Permits MB087454-0 and MB087454-2 and California Fish and Wildlife Service Permit SC 006598. All methods were approved under University of Connecticut Institutional Animal Care and Use Committee Protocols A16-012 and A19-013.
Author Contributions
EH participated in the conceptualization and methodology, conducted the investigation and formal analysis, created visualizations, and wrote the manuscript. AS participated in the conceptualization and methodology, conducted the investigation and resource collection, created visualizations, and acquired funding. MT participated in the formal analysis, supervision, and project administration (particularly within respect to permitting and data acquisition), in addition to writing. SH participated in the conceptualization, visualization, supervision, funding acquisition, and writing. All authors contributed to the article and approved the submitted version.
Funding
The authors would like to thank the University of Connecticut for startup funds to SH. This manuscript is based on work supported by the National Science Foundation Graduate Research Fellowship Program Grant No. DGE-1747453 and the White Mountain Research Center, both provided to AS.
Conflict of Interest
The authors declare that the research was conducted in the absence of any commercial or financial relationships that could be construed as a potential conflict of interest.
Acknowledgments
We would additionally like to thank Hannah LeWinter and Phillip Coontz for their help in collecting the samples. We would also like to thank Kirsten Grond for thoughtful comments on the manuscript.
Supplementary Material
The Supplementary Material for this article can be found online at: https://www.frontiersin.org/articles/10.3389/fevo.2020.597756/full#supplementary-material
References
Altshuler, D. L., and Dudley, R. (2006). The physiology and biomechanics of avian flight at high altitude. Integr. Comp. Biol. 46, 62–71. doi: 10.1093/icb/icj008
Bäckhed, F., Ley, R. E., Sonnenburg, J. L., Peterson, D. A., and Gordon, J. I. (2005). Host-bacterial mutualism in the human intestine. Science 307, 1915–1920. doi: 10.1126/science.1104816
Benjamini, Y., and Hochberg, Y. (1995). Controlling the false discovery rate: a practical and powerful approach to multiple testing. J. R. Stat. Soc. 57, 289–300. doi: 10.1111/j.2517-6161.1995.tb02031.x
Beuchat, C. A., and Chong, C. R. (1998). Hyperglycemia in hummingbirds and its consequences for hemoglobin glycation. Comp. Biochem. Physiol. Mol. Integr. Physiol. 120, 409–416. doi: 10.1016/s1095-6433(98)10039-9
Bleich, A., and Fox, J. G. (2015). The mammalian microbiome and its importance in laboratory animal research. ILAR J. 56, 153–158. doi: 10.1093/ilar/ilv031
Borre, Y. E., Moloney, R. D., Clarke, G., Dinan, T. G., and Cryan, J. F. (2014). The impact of microbiota on brain and behavior: mechanisms & therapeutic potential. Adv. Exp. Med. Biol. 817, 373–403. doi: 10.1007/978-1-4939-0897-4_17
Brooks, M. E., Kristensen, K., van Benthem, K. J., Magnusson, A., Berg, C. W., Nielsen, A., et al. (2017). glmmTMB balances speed and flexibility among packages for zero-inflated generalized linear mixed modeling. R J. 9, 378–400. doi: 10.32614/RJ-2017-066
Callahan, B. J., McMurdie, P. J., Rosen, M. J., Han, A. W., Johnson, A. J. A., Holmes, S. P., et al. (2016). DADA2: High-resolution sample inference from Illumina amplicon data. Nat. Methods 13, 581–583. doi: 10.1038/nmeth.3869
Caporaso, J. G., Lauber, C. L., Walters, W. A., Berg-Lyons, D., Huntley, J., Fierer, N., et al. (2012). Ultra-high-throughput microbial community analysis on the Illumina HiSeq and MiSeq platforms. ISME J. 6, 1621–1624. doi: 10.1038/ismej.2012.8
Capunitan, D. C., Johnson, O., Terrill, R. S., and Hird, S. M. (2020). Evolutionary signal in the gut microbiomes of 74 bird species from Equatorial Guinea. Mol. Ecol. 29, 829–847. doi: 10.1111/mec.15354
Clark, C. J., and Russell, S. M. (2020). “Anna’s Hummingbird (Calypte anna), version 1.0,” in Birds of the World, ed. A. F. Poole, (Ithaca, NY: Cornell Lab of Ornithology).
Colston, T. J., and Jackson, C. R. (2016). Microbiome evolution along divergent branches of the vertebrate tree of life: what is known and unknown. Mol. Ecol. 25, 3776–3800. doi: 10.1111/mec.13730
Davenport, E. R., Sanders, J. G., Song, S. J., Amato, K. R., Clark, A. G., Knight, R., et al. (2017). The human microbiome in evolution. BMC Biol. 15:127. doi: 10.1186/s12915-017-0454-7
Davis, N. M., Proctor, D. M., Holmes, S. P., Relman, D. A., and Callahan, B. J. (2018). Simple statistical identification and removal of contaminant sequences in marker-gene and metagenomics data. Microbiome 6:226. doi: 10.1186/s40168-018-0605-2
Escallón, C., Belden, L. K., and Moore, I. T. (2019). The cloacal microbiome changes with the breeding season in a wild bird. Integr. Org. Biol. 1:oby009. doi: 10.1093/iob/oby009
García-Amado, M. A., Shin, H., Sanz, V., Lentino, M., Martínez, L. M., Contreras, M., et al. (2018). Comparison of gizzard and intestinal microbiota of wild neotropical birds. PLoS One 13:e0194857. doi: 10.1371/journal.pone.0194857
Goodrich, J. K., Waters, J. L., Poole, A. C., Sutter, J. L., Koren, O., Blekhman, R., et al. (2014). Human genetics shape the gut microbiome. Cell 159, 789–799. doi: 10.1016/j.cell.2014.09.053
Grinnell, J. Jr., and Miller, A. H. (1986). The distribution of the birds of California. Condor 88:482. doi: 10.1093/condor/88.4.482
Grond, K., Sandercock, B. K., Jumpponen, A., and Zeglin, L. H. (2018). The avian gut microbiota: community, physiology and function in wild birds. J. Avian Biol. 49:e01788. doi: 10.1111/jav.01788
Heijtz, R. D., Wang, S., Anuar, F., Qian, Y., Björkholm, B., Samuelsson, A., et al. (2011). Normal gut microbiota modulates brain development and behavior. Proc. Natl. Acad. Sci. U. S. A. 108, 3047–3052. doi: 10.1073/pnas.1010529108
Hird, S. M. (2020). Context is key: comparative biology illuminates the vertebrate microbiome. mBio 11, 120–153. doi: 10.1128/mBio.00153-20
Hird, S. M., Carstens, B. C., Cardiff, S. W., Dittmann, D. L., and Brumfield, R. T. (2014). Sampling locality is more detectable than taxonomy or ecology in the gut microbiota of the brood-parasitic Brown-headed Cowbird (Molothrus ater). Peer J. 2:e321. doi: 10.7717/peerj.321
Hird, S. M., Ganz, H., Eisen, J. A., and Boyce, W. M. (2018). The cloacal microbiome of five wild duck species varies by species and influenza a virus infection status. mSphere 3, e381–e382. doi: 10.1128/mSphere.00382-18
Hird, S. M., Sánchez, C., Carstens, B. C., and Brumfield, R. T. (2015). Comparative gut microbiota of 59 neotropical bird species. Front. Microbiol. 6:1403. doi: 10.3389/fmicb.2015.01403
Hughey, M. C., Pena, J. A., Reyes, R., Medina, D., Belden, L. K., Burrowes, P. A., et al. (2017). Skin bacterial microbiome of a generalist Puerto Rican frog varies along elevation and land use gradients. Peer J. 5:e3688. doi: 10.7717/peerj.3688
Jankowski, J. E., Merkord, C. L., Rios, W. F., Cabrera, K. G., Revilla, N. S., Silman, M. R., et al. (2013). The relationship of tropical bird communities to tree species composition and vegetation structure along an Andean elevational gradient. J. Biogeogr. 40, 950–962. doi: 10.1111/jbi.12041
Jari Oksanen, F. G. B., Friendly, M., Kindt, R., Legendre, P., McGlinn, D., Minchin, P. R., et al. (2018). Vegan: community ecology package. R package version 2.
Karasov, W. H., Phan, D., Diamond, J. M., and Carpenter, F. L. (1986). Food passage and intestinal nutrient absorption in hummingbirds. Auk 103, 453–464. doi: 10.1093/auk/103.3.453
Kinross, J. M., Darzi, A. W., and Nicholson, J. K. (2011). Gut microbiome-host interactions in health and disease. Genome Med. 3:14. doi: 10.1186/gm228
Kozich, J. J., Westcott, S. L., Baxter, N. T., Highlander, S. K., and Schloss, P. D. (2013). Development of a dual-index sequencing strategy and curation pipeline for analyzing amplicon sequence data on the MiSeq Illumina sequencing platform. Appl. Environ. Microbiol. 79, 5112–5120. doi: 10.1128/AEM.01043-13
Love, M. I., Huber, W., and Anders, S. (2014). Moderated estimation of fold change and dispersion for RNA-seq data with DESeq2. Genome Biol. 15:550. doi: 10.1186/s13059-014-0550-8
Lozupone, C., and Knight, R. (2005). UniFrac: a new phylogenetic method for comparing microbial communities. Appl. Environ. Microbiol. 71, 8228–8235. doi: 10.1128/AEM.71.12.8228-8235.2005
McArdle, B. H., and Anderson, M. J. (2001). Fitting multivariate models to community data: a comment on distance-based redundancy analysis. Ecology 82, 290–297. doi: 10.2307/2680104
McMurdie, P. J., and Holmes, S. (2013). phyloseq: an R package for reproducible interactive analysis and graphics of microbiome census data. PLoS One 8:e61217. doi: 10.1371/journal.pone.0061217
Nicholson, J. K., Holmes, E., Kinross, J., Burcelin, R., Gibson, G., Jia, W., et al. (2012). Host-gut microbiota metabolic interactions. Science 336, 1262–1267. doi: 10.1126/science.1223813
Oliphant, K., and Allen-Vercoe, E. (2019). Macronutrient metabolism by the human gut microbiome: major fermentation by-products and their impact on host health. Microbiome 7:91. doi: 10.1186/s40168-019-0704-8
Phillips, J. N., Berlow, M., and Derryberry, E. P. (2018). The effects of landscape urbanization on the gut microbiome: an exploration into the gut of urban and rural white-crowned sparrows. Front. Eco. Evol. 6:148. doi: 10.3389/fevo.2018.00148
Pruesse, E., Quast, C., Knittel, K., Fuchs, B. M., Ludwig, W., Peplies, J., et al. (2007). SILVA: a comprehensive online resource for quality checked and aligned ribosomal RNA sequence data compatible with ARB. Nucleic Acids Res. 35, 7188–7196. doi: 10.1093/nar/gkm864
R Development Core Team. (2019). R: A Language and Environment for Statistical Computing. Available Online at: https://www.r-project.org
Rothschild, D., Weissbrod, O., Barkan, E., Kurilshikov, A., Korem, T., Zeevi, D., et al. (2018). Environment dominates over host genetics in shaping human gut microbiota. Nature 555, 210–215. doi: 10.1038/nature25973
Rubbenstroth, D., Ryll, M., Hotzel, H., Christensen, H., Knobloch, J. K.-M., Rautenschlein, S., et al. (2013). Description of Riemerella columbipharyngis sp. nov., isolated from the pharynx of healthy domestic pigeons (Columba livia f. domestica), and emended descriptions of the genus Riemerella, Riemerella anatipestifer and Riemerella columbina. Int. J. Syst. Evol. Microbiol. 63, 280–287.
Ruiz-Rodríguez, M., Soler, J. J., Lucas, F. S., Heeb, P., Palacios, M. J., Martín-Gálvez, D., et al. (2009). Bacterial diversity at the cloaca relates to an immune response in magpie Pica pica and to body condition of great spotted cuckooClamator glandarius nestlings. J. Avian Biol. 40, 42–48. doi: 10.1111/j.1600-048x.2008.04471.x
Schliep, K. P. (2011). phangorn: phylogenetic analysis in R. Bioinformatics 27, 592–593. doi: 10.1093/bioinformatics/btq706
Segers, P., Mannheim, W., Vancanneyt, M., De Brandt, K., Hinz, K.-H., Kersters, K., et al. (1993). Riemerella anatipestifer gen. nov., comb. nov., the causative agent of septicemia anserum exsudativa, and its phylogenetic affiliation within the Flavobacterium-Cytophaga rRNA homology group. Int. J. Syst. Evol. Microbiol. 43, 768–776. doi: 10.1099/00207713-43-4-768
Segre, P. S., Dakin, R., Read, T. J. G., Straw, A. D., and Altshuler, D. L. (2016). Mechanical constraints on flight at high elevation decrease maneuvering performance of hummingbirds. Curr. Biol. 26, 3368–3374. doi: 10.1016/j.cub.2016.10.028
Shannon, C. E., and Weaver, W. (1949). The mathematical theory of communication. Urbana: University of Illinois, 117.
Sharpton, T. J. (2018). Role of the gut microbiome in vertebrate evolution. mSystems 3, e117–e174. doi: 10.1128/mSystems.00174-17
Smith, P., Willemsen, D., Popkes, M., Metge, F., Gandiwa, E., Reichard, M., et al. (2017). Regulation of life span by the gut microbiota in the short-lived African turquoise killifish. Elife 6:e27014. doi: 10.7554/eLife.27014
Song, S. J., Sanders, J. G., Delsuc, F., Metcalf, J., Amato, K., Taylor, M. W., et al. (2020). Comparative analyses of vertebrate gut microbiomes reveal convergence between birds and bats. mBio 11, e2901–e2919. doi: 10.1128/mbio.02901-19
Tingley, M. W., Koo, M. S., Moritz, C., Rush, A. C., and Beissinger, S. R. (2012). The push and pull of climate change causes heterogeneous shifts in avian elevational ranges. Glob. Chang. Biol. 18, 3279–3290. doi: 10.1111/j.1365-2486.2012.02784.x
Tu, P., Chi, L., Bodnar, W., Zhang, Z., Gao, B., Bian, X., et al. (2020). Gut microbiome toxicity: connecting the environment and gut microbiome-associated diseases. Toxics 8:16. doi: 10.3390/toxics8010019
van Veelen, H. P. J., Salles, J. F., and Tieleman, B. I. (2017). Multi-level comparisons of cloacal, skin, feather and nest-associated microbiota suggest considerable influence of horizontal acquisition on the microbiota assembly of sympatric woodlarks and skylarks. Microbiome 5:156. doi: 10.1186/s40168-017-0371-6
Vancanneyt, M., Vandamme, P., Segers, P., Torck, U., Coopman, R., Kersters, K., et al. (1999). Riemerella columbina sp. nov., a bacterium associated with respiratory disease in pigeons. Int. J. Syst. Evol. Microbiol. 49, 289–295. doi: 10.1099/00207713-49-1-289
Waite, D. W., and Taylor, M. W. (2014). Characterizing the avian gut microbiota: membership, driving influences, and potential function. Front. Microbiol. 5:223. doi: 10.3389/fmicb.2014.00223
Wang, Q., Garrity, G. M., Tiedje, J. M., and Cole, J. R. (2007). Naive bayesian classifier for rapid assignment of rRNA sequences into the new bacterial taxonomy. Appl. Environ. Microbiol. 73, 5261–5267. doi: 10.1128/AEM.00062-07
Wickham, H. (2009). ggplot2: Elegant Graphics for Data Analysis. Berlin: Springer Science & Business Media.
Keywords: Riemerella, avian, altitude, Streptobacillus, Calypte, microbiome, 16S rRNA gene
Citation: Herder EA, Spence AR, Tingley MW and Hird SM (2021) Elevation Correlates With Significant Changes in Relative Abundance in Hummingbird Fecal Microbiota, but Composition Changes Little. Front. Ecol. Evol. 8:597756. doi: 10.3389/fevo.2020.597756
Received: 21 August 2020; Accepted: 31 December 2020;
Published: 20 January 2021.
Edited by:
Guillaume Chomicki, Durham University, United KingdomReviewed by:
Zakee L. Sabree, The Ohio State University, United StatesXavier A. Harrison, University of Exeter, United Kingdom
Copyright © 2021 Herder, Spence, Tingley and Hird. This is an open-access article distributed under the terms of the Creative Commons Attribution License (CC BY). The use, distribution or reproduction in other forums is permitted, provided the original author(s) and the copyright owner(s) are credited and that the original publication in this journal is cited, in accordance with accepted academic practice. No use, distribution or reproduction is permitted which does not comply with these terms.
*Correspondence: Sarah M. Hird, U2FyYWguSGlyZEB1Y29ubi5lZHU=