 Shubham K. Jaiswal1†
 Ankit Gupta1†
 Aaron B. A. Shafer2
 Vishnu Prasoodanan P. K.1
 Nagarjun Vijay3
 Vineet K. Sharma1*
- 1MetaBioSys Group, Department of Biological Sciences, Indian Institute of Science Education and Research Bhopal, Bhopal, India
- 2Forensic Science and Environmental & Life Sciences, Trent University, Peterborough, ON, Canada
- 3Computational Evolutionary Genomics Lab, Department of Biological Sciences, Indian Institute of Science Education and Research Bhopal, Bhopal, India
Sexual selection is a well-known biological process, yet the genomic basis and patterns of sexual selection are not fully understood. The extravagant ornamental plumage of peacock (Pavo cristatus) was instrumental in shaping Charles Darwin's theory of sexual selection and is considered to be an honest signal of its immunocompetence. Here, we used the recently generated draft genome sequence of peafowl (Pavo cristatus) and carried out a comparative analysis across 11 bird genomes that encompass a range of sexual selection and also had high-quality genomic and phenotypic data publically available to study the genomic basis of sexual selection. We found that varying degree of purifying selection was the predominant mechanism of action for sexual selection at the genome-wide scale and observed that sexual selection mostly influences genes regulating gene expression and protein processing. Specifically, the genome-wide phylogenetically corrected regression analysis supported the continuous or ongoing model of sexual selection. Genes involved in nucleic acid binding and gene expression regulation, including a specific regulator of sex-determination known as TRA2A to be under positive selection in the species with high post-copulatory sexual selection manifested as high sperm competition. We also detected specific feather-related and immune-related gene-pairs evolving under similar selection pressures across the 11 species, including peacock (Pavo cristatus), which is consistent with the Hamilton-Zuk hypothesis. The comparative genomics analysis of 11 avian taxa has provided new insights on the molecular underpinnings of sexual selection and identifies specific genomic regions for future in-depth analysis.
Introduction
Sexual selection is a mode of natural selection where increased reproductive success is achieved through adaptations that either attract females or help outcompete other males. Some of the best-known examples include the sword-tailed fish (Basolo, 1995), exaggerated antlers in cervids (Kruuk et al., 2002), complex songs of European warblers (Catchpole, 1980), and ornamented male plumage in birds of paradise (Irestedt et al., 2009) and peafowl (Loyau et al., 2005; Hosken and House, 2011). Importantly, sexual selection can be manifested in a variety of ways, including sperm competition, plumage dimorphism, competition for access to females, and preference to specific mates or mate choice, which can affect the development of associated phenotypes via positive feedback (Wade and Arnold, 1980).
Birds (Class Aves) have been the model organisms for studying sexual selection, with the classic example being the plumage patterns and large tail-coverts of peacock (Pavo cristatus). It was, in fact, Charles Darwin's fascination with the peacock that shaped his theory of sexual selection (Darwin, 1872, 1896, 1911). The male peacock's sexual display is among the most conspicuous in nature and consists of both a glittering train and crest plumage along with various behavioral traits. In peacock the mating success has been highly correlated with the coloration and length of feather train (Petrie and Williams, 1993; Loyau et al., 2007) which implies that ornamental plumage traits in birds are a consequence of sexual selection.
The available aves genomes provide an excellent resource to study sexual selection due to the existence of species with minimal to very high pre-copulatory and post-copulatory sexual selection (e.g., no plumage dimorphism to extreme plumage dimorphism, and very high to nearly null sperm competition). Comparative genomic approaches provide a single base-pair perspective on evolution and adaptation in nature and have revealed remarkable patterns of convergence and widespread orthology across taxa (Nam et al., 2010; Jarvis et al., 2014; Foote et al., 2015). Several international efforts such as B10K bird genome consortium are in progress to sequence the genomes of all extant bird species, and already more than 450 draft genomes have been sequenced by May 2019 (Hillier et al., 2004; Dalloul et al., 2010; Warren et al., 2010; Jarvis et al., 2014; Zhang et al., 2014b; Zhang, 2015; Stiller and Zhang, 2019) this will become an unprecedented resource that can be leveraged to comprehend the genetic basis of sexual selection at a genome-wide scale (Feng et al., 2020). However, only a total of 44 bird genomes are available in the reference genome sequence databases such as Ensembl Avianbase 2015 (Jarvis et al., 2014; Zhang et al., 2014a,b; Eöry et al., 2015). In this study species were selected using two stringent criteria: (a) the species show a range of pre-copulatory and post-copulatory sexual selection suitable for phylogenetically corrected regression analysis, and (b) they have high-quality genomic (genomes available on the standard reference database such as Ensembl Avianbase 2015) and phenotypic data publicly available. The first criterion was crucial to select only the relevant avian species to answer the specific biological question on the genomic basis of sexual selection, while the second criterion ensures a reliable and robust evolutionary analysis.
A few individual studies have associated the variation in coding and regulatory regions of specific-genes with the observed phenotypic variation arising from sexual selection (Nadeau et al., 2007; Martin-Coello et al., 2009; Wong, 2014). Considering the complex nature of phenotypes involved in sexual selection, in addition to the selection on specific traits or genes, it is likely that the selection on genetically correlated traits is important (Brooks and Endler, 2001). Therefore, exploration of the molecular evolution of genes at a genome-wide level while linking it to the phenotypic changes can provide useful insights into the proximate mechanisms of sexual selection.
A variety of genic and quantitative genetic models have been proposed to explain the evolutionary process of sexual selection. Some models predict a cyclical or ongoing evolution of the trait under selection and female mate preference, while others predict an equilibrium or stable outcome (Pomiankowski and Moller, 1995; Mead and Arnold, 2004). Notably, the models of ongoing evolution are consistent with the Fisherian runaway models, sexual conflict, and some good-genes models that allow for the continuous or prolonged changes in the coding sequences (Parker, 1979; Lande, 1981). The models of equilibrium or stable outcome rely on the purging of deleterious mutations, which will allow for minimal changes in the coding sequences. In addition, some models have predicted an increased mutation rate due to higher sperm competition (Bartosch-Härlid et al., 2003). The higher sperm competition would cause a higher rate of sperm production through a higher rate of meiosis, which may result in increased rates of mutations likely due to DNA replications errors.
Since the exaggerated male secondary sexual characters, that provide a reproductive advantage to the male through female mate choice, signals the presence of “good-genes” that eventually leads to better offspring's survival (Byers and Waits, 2006), a variety of “good-gene” models have been proposed for sexual selection. These models are dependent on a mutation-selection balance, which leads to variability in the traits evolving under sexual selection (Pomiankowski and Moller, 1995; Rowe and Houle, 1996; Houle and Kondrashov, 2002). The Hamilton-Zuk hypothesis (Hamilton and Zuk, 1982) or parasite theory is a “good-genes” model that proposes secondary sexual traits are honest indicators of immunity. By linking the secondary sexual traits to immune genes, Hamilton-Zuk explained the persistence of variation as a consequence of the arms-race between parasite and immune genes. The relevance of the Hamilton-Zuk hypothesis has been evaluated in birds with mixed support (Read, 1987; Dale et al., 1996; Brown, 1998; Balenger and Zuk, 2014).
Collectively, these models have been proposed based on patterns of evolution at the phenotypic level; however, linking such phenotypic changes to signatures of selection at the molecular level at genome-wide scale is challenging and sparsely addressed in the available literature (Jones et al., 2013; Harrison et al., 2015). In this study, we performed a genome-wide comparative analysis of coding-regions of genes to examine the genomic signatures of sexual selection in birds.
Materials and Methods
Orthologous Gene Set Construction, Alignment, and Filtering
Although numerous bird genomes have been sequenced to date, only 44 reference bird genomes were available in Ensembl Avianbase (2015) at the onset of this study, which are of sufficient quality that can be used for a reliable evolutionary analysis (Jarvis et al., 2014; Zhang et al., 2014b; Eöry et al., 2015). The genomes available on the standard reference database such as Ensembl Avianbase have been pre-evaluated for completeness and contiguity, annotated using standard pipelines, and published in reputed peer-reviewed journals, and thus are considered to be high-quality genomes. Moreover, the quality of one-to-one orthologs available on the Ensembl database is very high, which is required for robust analysis without false positives.
Eleven bird species were selected for this study using the stringent criteria of showing a range of sexual selection and the availability of high-quality genomic and phenotypic data suitable for the regression and correlation analysis. The selected species included 10 species from the Avian Phylogenomics Consortium (B10K Phase-1) (Jarvis et al., 2014; Zhang et al., 2014b; Eöry et al., 2015) i.e., Aptenodytes forsteri (Emperor penguin), Pygoscelis adeliae (Adélie penguin), Fulmarus glacialis (Northern fulmar), Melopsittacus undulates (Budgerigar), Claypte anna (Anna's hummingbird), Columba livia (Common pigeon/Rock dove), Gallus gallus (Chicken), Meleagris gallopavo (Turkey), Anas platyrhynchos (Mallard duck), Struthio camelus (common ostrich), and Indian peafowl from a recently published study (Jaiswal et al., 2018). The orthologous sequences for peacock were constructed using a mapping-based assembly of the corresponding chicken orthologous sequence. Mapping of peacock transcriptome data (Harrison et al., 2015) to the chicken genes was performed using BWA (v0.5.9) followed by the construction of consensus sequence using SAMtools v0.1.19. From the orthologs available for the 10 selected bird species from Avian Phylogenomics Consortium (B10K Phase-1) (Jarvis et al., 2014; Zhang et al., 2014a,b; Eöry et al., 2015), and the corresponding peacock orthologs constructed in this study, a total of 6,720 orthologs were identified for all the 11 species. Of these, 901 orthologs had premature stop codons and were not considered for further analysis.
SATé, an iterative program for sequence alignment, was used to generate alignments of the orthologous protein sequences (Liu et al., 2012). To control for the false positives and false negatives, a combination of Prank, muscle, and RaxML was used in SATé tool. The protein sequence guided codon alignment was produced using TRANALIGN program of EMBOSS v6.5.7 package. Since poorly aligned can significantly affect the maximum likelihood calculations, these regions were masked in the alignment using SWAMP: Sliding Window Alignment Master for PAML (Yang, 1997; Harrison et al., 2014). The average branch length of strict consensus species tree of the 1,000 trees downloaded from birdtree.org (Jetz et al., 2012) was utilized for SWAMP-based masking. After masking and removal of erroneous gene alignments, a total of 5,383 resultant protein-guided DNA (codon) alignments were used for maximum likelihood analysis with PAML.
Construction of Species Phylogenetic Tree
The strict consensus phylogeny was constructed using 1,000 phylogenetic tree topologies obtained from the birdtree.org (Jetz et al., 2012) for the selected species and was utilized in further analysis. This method was used as it could include all the selected species including peacock, and is also a standard method used in several recent studies (Gianuca et al., 2014; Bastazini et al., 2017; Rodríguez-Martínez and Galván, 2020; Skoracki et al., 2020).
Estimation of Selection, Synonymous Rate, and Non-synonymous Rate
The maximum likelihood estimation of dS (synonymous substitution rate), dN (non-synonymous substitution rate), and dN/dS referred to as “ω” (a measure of selection) for each gene was performed using codon-based substitution models in PAML (v4.9) (Yang, 2007). Branch-specific models were utilized to calculate dN, dS, and ω for each species under consideration. Statistical significance for the heterogeneity in the ω values was calculated using the likelihood ratio test at an FDR q-value cut-off of 0.05 named as heterogeneity test for ω.
The positively selected genes were identified using the results of branch-specific models in PAML. For a particular gene, if a branch showed ω > 1 in the branch-specific analysis, then this gene is considered to be positively selected for that branch. The positively selected genes were identified for each branch of the phylogenetic tree, including the ancestral and extant species branches. The genes which were positively selected in more than one extant species were identified using a matrix layout analysis performed using the “UpSetR” package in R (Lex and Gehlenborg, 2014; Conway et al., 2017).
For genome-wide check of Hamilton-Zuk or parasite hypothesis, pair-wise comparison of two species with extreme sexual dimorphism, namely peacock (with high sexual dimorphism in plumage color and pattern) and budgerigar (with no sexual dimorphism in plumage color and pattern) was performed. For pair-wise analysis, maximum likelihood estimation of NdN (number of non-synonymous substitutions), SdS (number of synonymous substitutions), dN, dS, and ω was performed using PAML in pair-wise mode (runmode = −2).
Estimation of Nucleotide Substitution Rate
For all the alignments, the phylogenetic testing of the different nucleotide substitution model was performed using the MODEL GENERATOR program (Keane et al., 2006), and the best suitable model was selected based on the hierarchical likelihood ratio tests. The gene sequence-based phylogenetic trees were constructed using the selected model by employing PhyML v3.1 (Guindon et al., 2010). The whole range of branch-length values for each species was generated using 100 bootstrap replicates, and the average value was considered as the overall nucleotide substitution rate in that gene for that particular species.
Phenotypic Measures of Sexual Selection
Since there exists an allometric relationship between the testis weight and body weight (Møller, 1988a,b; Calhim and Birkhead, 2006), we used the deviation from this relationship as a measure of postcopulatory sexual selection. Three parameters: the ratio of testis weight to body weight, and the relative and residual testis weights were used to quantify the deviation (Calhim and Birkhead, 2006). Data on body and testis mass were collected from literature for the breeding season (the time duration from 2 weeks preceding the start of egg laying until the last egg of the last clutch is laid) and used to calculate the ratio of testis weight to body weight (Moller, 1989, 1991; Calhim and Birkhead, 2006). The relative testis weight and residual testis weight were derived using the previously published regression fit and values collected from the literature (Moller, 1989; Calhim and Birkhead, 2006). The ratio of testis weight to body weight, relative testis weight, and residual testis weight of 11 species are mentioned in Supplementary Table 1. We generated sexual dichromatism data through the response of trained ornithologists that took a survey based on the scoring system published previously and known to be highly correlated with the strength of sexual selection (Owens and Bennett, 1994; Nadeau et al., 2007; Harrison et al., 2015). The dichromatism score was evaluated on a scale of 0–6 on the basis of three body regions (head and neck; back, wings and tail; chest, belly, and legs). For each region, a score from 0 to 2 was given, 0 for no color difference, 1 for shade or pattern difference, and 2 for color difference between male and female. The scoring was performed by seven ornithologists and is available in Supplementary Table 2. The scores from the respondents were highly correlated, suggesting a consensus on the scoring of different species. The dichromatism score was therefore used as the proxy phenotype for measuring the extent of precopulatory sexual selection, and the measures related to testis weight were used as the proxy phenotype for measuring the extent of postcopulatory sexual selection.
Identification of Genes Evolving Under the Effect of Sexual Selection
To identify the candidate genes involved in the sexual selection-related phenotypes, we performed the phylogenetically corrected generalized least squared (PGLS) regression of molecular evolution parameters (dN, dS, ω, and nucleotide substitution rate) with the phenotypic measures of sexual selection (pre-copulatory: dichromatism score, post-copulatory: relative testis weight). Interclass correlation between the parameters of adaptive evolution and sequence divergence was performed with the phenotypic measures of sexual selection. The PGLS regression fit was then performed, and the statistical significance was determined at the FDR q-value of 0.05 using the likelihood ratio test by employing BayesTraits v3 (Pagel and Meade, 2007). Additionally, the Bayes factor was also calculated for the PGLS fit to further evaluate the statistical significance of the obtained results. The genes showing FDR significance (q-value < 0.05) and r-squared value above 0.6 in the PGLS fit were considered to be evolving under sexual selection. The strict consensus species tree constructed in this study was used for phylogenetic correction.
Evaluating the Models of Sexual Selection
Three models of sexual selection, namely continuous or ongoing model, equilibrium or stable outcome model, and increased mutation rate model, were evaluated to identify their relative contribution in explaining the genomic basis of sexual selection. For each model, the specific predictions about the variations in the molecular evolutionary parameters with sexual selection were identified. The predictions and corresponding criteria for testing these predictions using the PGLS regression of molecular evolution parameters with the phenotypic measures of sexual selection are shown in Table 1. In summary, the IPoS (increased positive selection), RPuS (reduced purifying selection), ISyS (increased synonymous substitution rate), and INSyS (increased non-synonymous substitution rate) criteria correspond to continuous or ongoing model as all these criteria will lead to the continuous evolution of gene sequence. The RPoS (reduced positive selection), IPuS (increased purifying selection), RSyS (reduced synonymous substitution rate), RNSyS (reduced non-synonymous substitution rate) criteria corresponds to equilibrium or stable outcome model as all these criteria will lead to purging of deleterious substitutions and sequence stabilization. The INS (increased nucleotide substitution rate) criterion corresponds to the increased mutation rate model as it will lead to more substitutions in the gene sequence. The numbers of genes following each of the criteria were then identified; with a higher number of genes falling into a specific criterion will suggest higher support for the corresponding model.
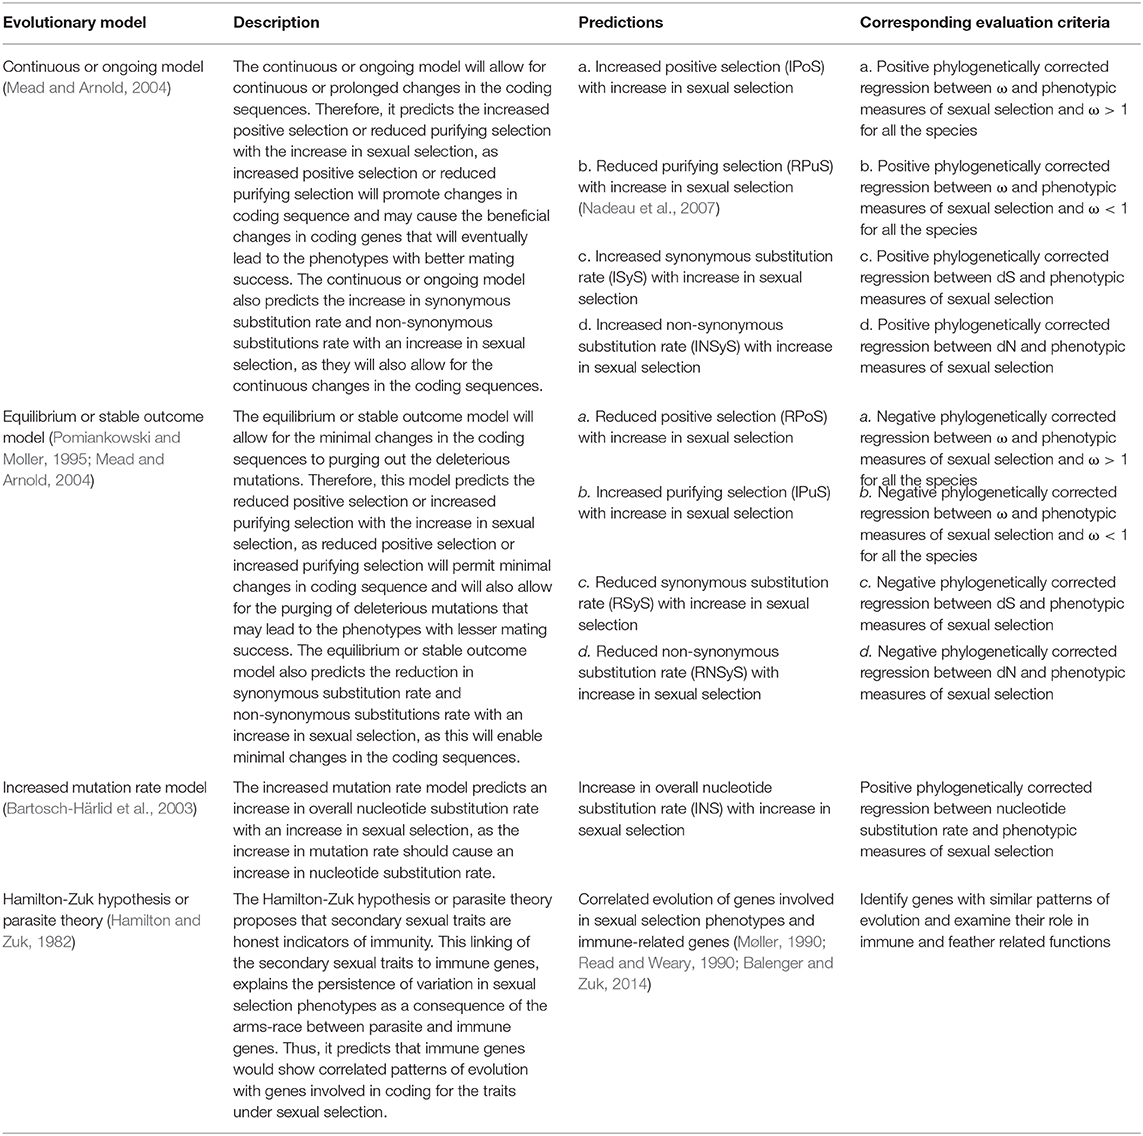
Table 1. Description of evolutionary models of sexual selection along with their predictions about the molecular evolutionary parameters, and the corresponding criteria to evaluate the predictions.
Identifying Genes With Correlated Patterns of Evolution
The ω values for each gene across the 11 species were used to perform the phylogenetically corrected regressions. The possible gene-pairs were constructed by making the pair-wise combinations of genes that qualified for the ω heterogeneity test and did not have abnormally high ω values. The phylogenetically corrected regressions were performed between the ω values from both the genes of a gene pair using the BayesTraits v3 (Pagel and Meade, 2007). The gene pairs with r-squared value >0.90 and FDR q-value <0.01 were considered to show the correlated patterns of evolution. Further, the functional annotations of these genes were manually curated to remove the genes with non-specific/ambiguous functions or without a standard gene symbol. The network representation for the gene pairs with the correlated patterns of evolution was generated using the “igraph” package in R. Only genes with a well-known functional annotation, and gene symbol were considered for the network representation. In the network, nodes represent the genes, and edges connect the genes with correlated patterns of evolution. The genes were categorized into specific cellular functional categories such as feather-related, immune-related, pigmentation-related, cell biogenesis, metabolism, protein processing, replication, transcription, translation, signal transduction, structural, and others by manual annotation. The nodes were colored based on these categories.
Selection Turnover Analysis
Another way of detecting continuous or cyclical evolution acting upon an individual locus is by looking for the change in selection from ancestor to extant species. Genes that underwent a 4-fold or greater change (increase or decrease) in the ω values from ancestor node to extant node were considered to have undergone a turnover in selection. In the majority of turnover cases, the selection regime has remained the same as purifying selection; however, a few cases showed switch in selection regime from purifying to positive selection or from positive to purifying selection. Moreover, a recent genome-wide study reported that sexual selection causes gene expression turnover (Harrison et al., 2015). Thus, the aim of this analysis was to evaluate if sexual selection has any correlation with selection turnover or can it also lead to selection turnover. Thus, we calculated the number of selection turnovers for each gene and also calculated the number of genes with selection turnover for each species, followed by the examination of the phylogenetically corrected continuous or discrete correlation of these turnover values with sexual selection.
Selection turnovers were calculated for each gene and along each branch of the phylogenetic tree. We specifically examined the selection turnover in the genes for the extant species with respect to their recent ancestor and analyzed the trends in selection turnover across the genes and species. To identify the species-specific patterns in selection turnover, hierarchical clustering of 10 species was performed (excluding common ostrich, which was an outgroup) based on the number of genes showing turnover in the extant species. The hierarchical clustering and heat map construction was performed in R using the packages “circlize,” “ComplexHeatmap,” and “gplots”.
Further, to evaluate if there is any pattern of discrete correlation between the selection turnover and sexual selection, the genes were categorized into three classes based on the number of turnovers each gene underwent, i.e., low turnover 0–4, moderate turnover 4–8, and high turnover >8. The proportion of genes for the specific turnover is calculated using the formula: number of genes showing the specific class of turnover (low, moderate, or high)/total number of genes selection turnover).
A comparison of the distribution of number of genes showing the different extent of turnover low, moderate, and high (as defined above) between species with extreme phenotypes: mallard duck (highest pre-copulatory sexual selection) vs. budgerigar (lowest pre-copulatory sexual seelction) and chicken (highest post-copulatory sexual selection) vs. hummingbird (lowest post-copulatory sexual selection) was performed.
Functional Annotation
For the functional annotation, homology search of the CDS sequences was performed against the standard databases such as KEGG, eggNOGs, and NCBI NR databases followed by manual curation of the hits (Kanehisa and Goto, 2000; Huerta-Cepas et al., 2016; O'leary et al., 2016). To functionally annotate the genes using reference databases, the homology search parameters cut-off values were E-value ≤ 0.001 and BLAST bit-score ≥ 60, which are also the default values used at the eggNOG-mapper tool. The genes were assigned to different COG functional categories using the eggNOG-mapper analysis followed by manual curation of the results (Tatusov et al., 2000; Huerta-Cepas et al., 2017). Further, the WebGestalt web server was used for the gene ontology enrichment or GO term enrichment analysis (Liao et al., 2019). In the enrichment analysis, the GO categories with the p-value <0.05 in the hypergeometric test were considered to be functionally enriched.
Results
The analyzed species and their corresponding clades in the modern bird phylogeny are shown in Figure 1A. We used relative testis weight as a proxy phenotype for post-copulatory sexual selection manifested as sperm competition, whereas dichromatism score was used as the proxy phenotype for pre-copulatory sexual selection manifested as plumage dimorphism (Supplementary Tables 1, 2). The ratio of testis weight to body weight showed a very high correlation with the relative testis weight (r2 = 0.87, P < 0.001), and residual testis weight (r2 = 0.94, P < 0.001). The residual testis weight showed early saturation in values (i.e., some species had very high negative values while others had near-zero values), which makes it unsuitable for regression analysis (Supplementary Figures 1, 2). Thus, the relative testis weight values were used as a measure of post-copulatory sexual selection for the further phylogenetic comparative analyses. The relative testis weight did not show any significant correlation with dichromatism score (Supplementary Figure 3).
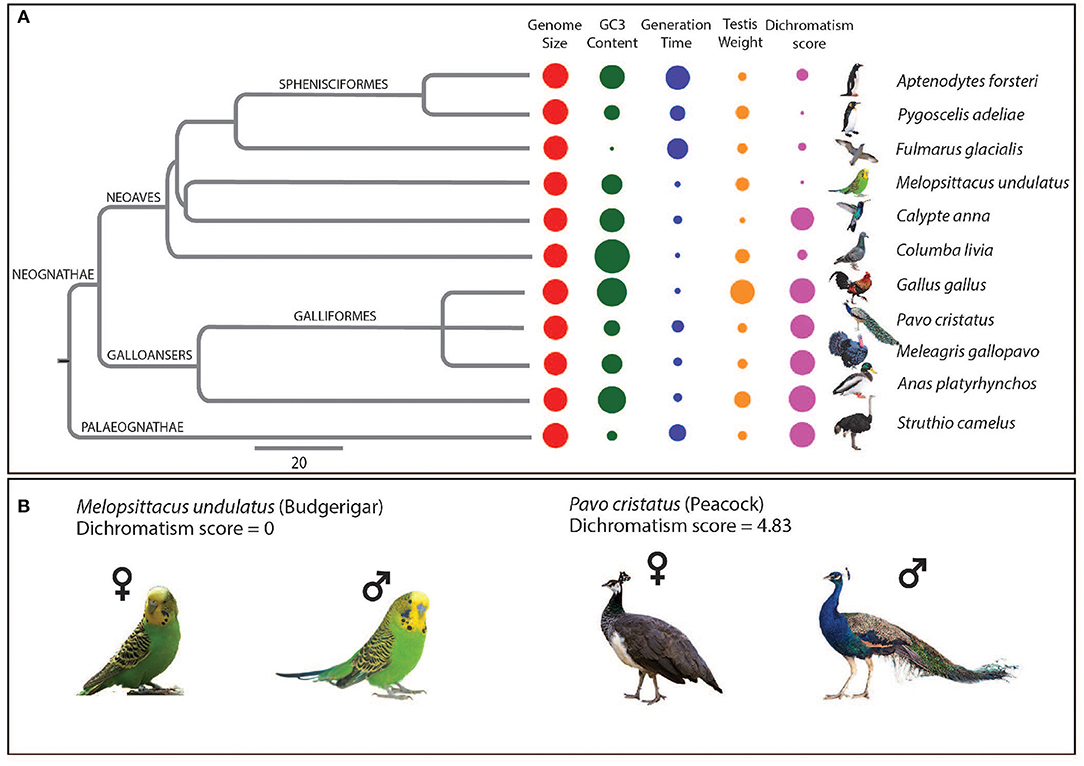
Figure 1. Framework of the analysis to study the genomic signatures of sexual selection in birds. (A) Phylogenetic tree showing the bird species with their corresponding genome size, GC3, Generation time, Relative testis weight, and Dichromatism score depicted as colored circles where the size of the circle indicates the magnitude of the parameter. The species from each of the clades of modern birds phylogenetic tree were represented by hummingbird (Calypte anna), emperor penguin (Aptenodytes forsteri), northern fulmar (Fulmaris glacialis), adélie penguin (Pygoscelis adeliae), budgerigar (Melopsittacus undulates), and rock dove (Columba livia) from clade Neoaves, and peacock (Pavo cristatus), chicken (Gallus gallus), turkey (Meleagris gallopavo), and mallard duck (Anas platyrhynchos) from the clade Galloanseres, and common ostrich (Struthio camelus) was included from the clade Palaeognathae. (B) Images of males and females for peacock (Pavo cristatus) and budgerigar (Melopsittacus undulatus) along with their mean dichromatism score obtained from a survey of seven trained ornithologists (Supplementary Table 2).
We observed variability in several life-history traits such as generation time, guanine and cytosine content at the third codon (GC3), and quantifiable phenotypic measures of sexual selection such as dichromatism score and testis weight (Figures 1A,B). GC3 can be considered as a genomic proxy for life-history traits since it shows a good correlation with the life-history traits such as body mass and generation time (Romiguier et al., 2010), and thus was analyzed here. Therefore, we evaluated the correlation of phenotypic measures of sexual selection with the life-history traits and did not observe any significant correlation among them (Supplementary Figures 4, 5). This suggests that besides the phenotypic measures of sexual selection, the life-history traits do not interfere with the phylogenetically corrected correlations between phenotypic measures of sexual selection and molecular evolution parameters performed in this study.
Identification of Genes Evolving Under the Influence of Sexual Selection
A total of 5,383 orthologous alignments were generated for the selected 11 species. Of these, 856 qualified for the ω heterogeneity test. These genes were further filtered for the presence of abnormally high ω values of more than three for any of the 11 species, which resulted in 577 genes (Künstner et al., 2010; Uebbing et al., 2016). The step of filtering the genes with abnormally high ω values was essential to remove the genes that showed spurious signals of evolution since abnormally high ω values occur due to unusually large dN values or unusually small dS values.
Before performing the PGLS analysis, we examined the distribution of raw ω values to detect any anomalies present in the raw data and to analyze the inherent species-specific patterns. Thus, as a part of exploratory data analysis, hierarchical clustering of the raw ω values for 577 orthologous alignments from 11 species was performed. Species from Galliformes and Sphenisciformes orders showed clustering according to their phylogeny; however, the remaining species clustered differently from their original phylogeny (Figure 2A). This suggests that for the evolution of coding-genes, all the species from Galliformes order show similar patterns, and all the species from Sphenisciformes order show similar patterns.
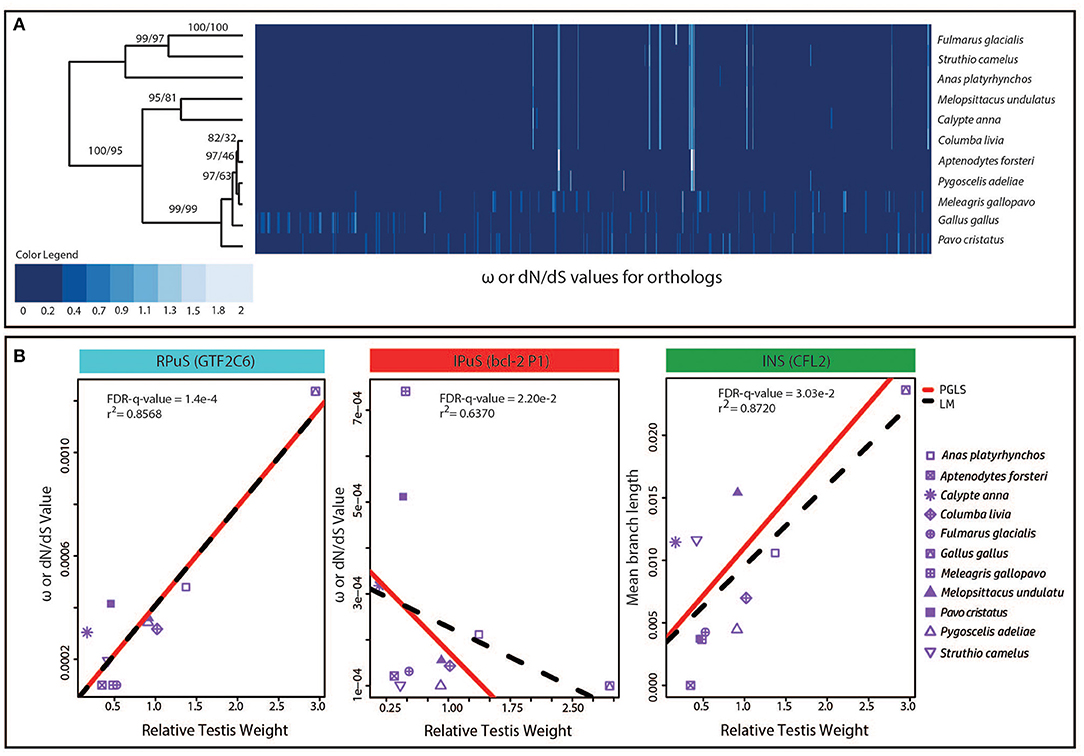
Figure 2. The contribution of continuous or cyclic evolution model to the proximate mechanism of sexual selection. (A) Heatmap with hierarchical clustering of 11 species based on the absolute ω values for 577 genes which qualified the heterogeneity test and ω quality check criteria. The approximate unbiased p-values (AUp) calculated using multiscale bootstrap resampling, and bootstrap probability (BP) values calculated using normal bootstrap resampling are shown on respective branches as AUp/BP. (B) The scatter plot between ω values and relative testis weight for the three representative genes belonging to the RPuS, IPuS, and INS criteria that supports the continuous or ongoing model of sexual selection. The best fit lines from PGLS and linear model (LM) regression fit are shown separately.
For the 577 genes, the PGLS fit of ω, dN, and dS values against relative testis weight was performed. In the PGLS fit of ω and relative testis weight, a total of 59 genes showed statistically significant regression. Whereas, in the PGLS fit of dN vs. relative testis weight and dS vs. relative testis weight, none of the genes showed statistically significant regression. Only one gene, CFL2, out of the 5,383 showed statistically significant regressions in the PGLS fit of nucleotide substitution rate against relative testis weight. However, in contrast to relative testis weight (a measure of post-copulatory sexual selection), none of the genes showed statistically significant regression coefficients for dichromatism score (a measure of post-copulatory sexual selection) against ω, dN, dS, and nucleotide substitution rate. Overall, this resulted in the identification of 60 genes that are potentially evolving under the effect of sexual selection based on the PGLS fit. The r-squared values, statistical significance values, Ensembl ID, gene function, and other parameters for the 60 genes are shown in Supplementary Table 3.
The top 10 enriched GO molecular function categories in these genes included protein dimerization activity, lyase activity, double-stranded DNA binding, sequence-specific DNA binding, regulatory region nucleic acid binding, and nucleic acid transcription factor activity (Supplementary Table 4). Interestingly, these genes included many regulators of gene expression such as ANKRD1, GABPA, GTF3C6, KIT, MYEF2, ZNF750, and ZHX1, and some of these are known to regulate the sexual dimorphism in gene expression (Huang et al., 2014; Duclot and Kabbaj, 2015; Creasy et al., 2016; Mayne et al., 2016; Yang et al., 2017).
Evaluating the Genome-Wide Relevance of Models of Sexual Selection
The predictions of continuous or ongoing model, equilibrium or stable outcome model, and increased mutation rate model along with the criteria to test these predictions using the PGLS regression between phenotypic measures of sexual selection and molecular evolution parameters are shown in Table 1. Out of the 60 genes that qualified to be evolving under the effect of sexual selection, 50 genes (83.3%) followed the RPuS criterion, nine genes (15%) followed the IPuS criterion, and one gene (1.7%) followed the INS criterion. None of the genes followed the remaining criteria. The PGLS and normal linear regression fit for the representative genes with best visual fit and high r-squared values that qualify the RPuS, IPuS, and INS criteria are shown in Figure 2B. For RPuS criterion, “GTF3C6” gene, had an r2 of 0.86 (FDR-q-value = 0.0001). Similarly, for IPuS criterion the “BCL2A1” gene had an r2 of 0.64 (FDR-q-value = 0.02). The only gene “CFL2” to fit the INS criterion had an r2 of 0.87 (FDR-q-value = 0.03) (Figure 2B).
Role of Positive Selection in Sexual Selection
All the positively selected genes in ancestral and extant species branches showed a low correlation (belonged to r-squared value bin: 0–0.4) between their ω values and post-copulatory measure of sexual selection across the 11 species (Figure 3A). Therefore, positive selection was mostly in the genes which could not be picked by the above-mentioned phylogenetically corrected regression analysis. Hence, this analysis complements the phylogenetically corrected regression analysis in revealing the proximate mechanism of sexual selection. Only a few genes were found to be positively selected across multiple species, and only one gene “SPCS1,” which is involved in peptide processing, was found to be positively selected across five of the 11 species. Similarly, in more than one species combination, only a maximum number of two genes could show positive selection in the different combinations (Figure 3B). In this case, only a few positively selected genes were found in common in more than one bird species, and different genes were under positive selection in the different bird species (Figure 3B).
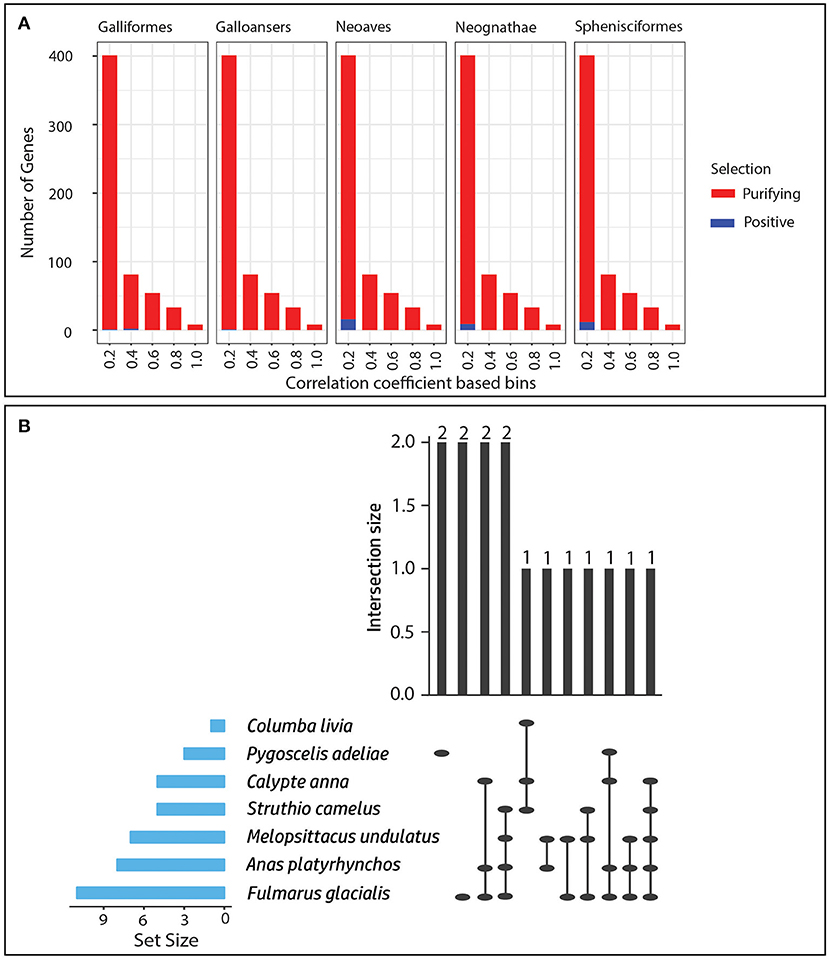
Figure 3. Role of positive selection in sexual selection. (A) Bar plot showing the genes that underwent positive or purifying selection in the ancestral branches. (B) Matrix layout for the intersection of positively selected genes from seven species which harbors positively selected genes. The blue horizontal bar depicts the absolute number of positively selected genes in different species. The vertical bar plot depicts the number of positively selected genes (top of bars) shared among the multiple species shown as intersection of ellipsoids at x-axis. The empty intersections were removed for the sake of clarity. The ellipsoids are placeholders for individual species. The layout was generated using the “UpsetR” package in R (Lex and Gehlenborg, 2014; Conway et al., 2017).
Out of the two species with the highest relative testis weight indicating the highest level of post-copulatory sexual selection among the 11 species, chicken had zero, and mallard duck had eight positively selected genes. Six of these genes (CREB3L1, TRA2A, SPCS1, VPS29, RBM22, and DYNLT1) had known functions, with three involved in nucleic acid binding and gene expression regulation, including TRA2A, which is a splicing factor and a sex determination factor in Drosophila genus (Chandler et al., 1997). CREB3L1 is a transcription factor involved in unfolded protein response, and RBM22 is an RNA binding protein involved in pre-mRNA splicing and cell division.
The Relevance of Hamilton-Zuk or Parasite Hypothesis in Explaining Sexual Selection
The existence of phenotypic variation despite directional selection can be explained by the Hamilton-Zuk or parasite hypothesis (Hamilton and Zuk, 1982). A total of 228 (39.51% of 577) genes that showed a statistically significant pattern of correlated evolution and had well-defined annotations were included in the network representation analysis. The network representation shows the genes with correlated pattern of evolution across the 11 species (Figures 4A,B). The list of genes with correlated evolution across 11 bird species and their functional categorization used for the network representation is provided in Supplementary Tables 5–7. In the network representation, many gene pairs were identified to be involved in immunity and feather development or pigmentation, which showed correlated patterns of evolution across the 11 bird species (Figure 4B). The observed immune and feather related gene pairs with correlated patterns of evolution support the predictions of Hamilton-Zuk or parasite hypothesis. Moreover, genes related immune functions were abundant in the gene pairs showing correlated patterns of evolution across the 11 bird species (Figure 4; Supplementary Figure 6).
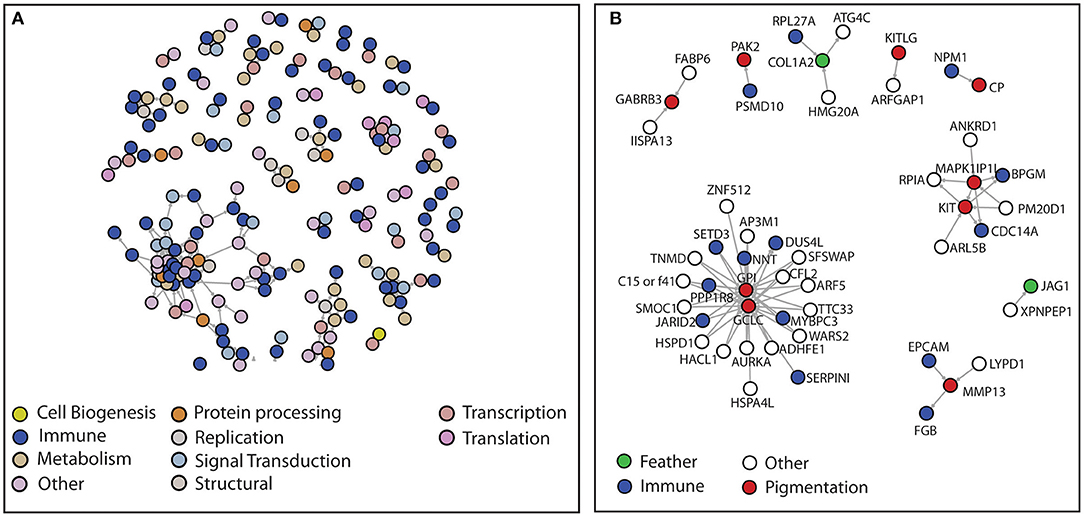
Figure 4. Evaluation of the Hamilton-Zuk hypothesis. (A) Network diagram of known functions and unambiguously annotated genes which passed the heterogeneity and quality test for ω. The nodes represent the genes and edges represent the phylogenetically corrected correlation (r-squared value >0.9 at FDR q-value <0.01) between the ω values of the two genes (nodes) across all the species. The color coding was done to highlight specific cellular functions (Supplementary Tables 5–7). (B) A sub-network from panel-A where only the immune-related, feather-related, and pigmentation-related nodes (genes) are highlighted.
We checked for the evidence of similar evolution for all the well-annotated immune-related and feather-related genes present in the peacock genome using a pair-wise comparison of peacock and budgerigar (Supplementary Text 1). This allowed for the use of more number of 7,497 orthologs in comparison to the analysis across 11 species, which could use only 5,383 orthologs for evolutionary analysis. The orthologs were divided into three classes: immune-related (403 of 7,497), feather-related (81 of 7,497), and others (7,013 of 7,497), and the values of molecular evolutionary parameters ω, dS, SdS, and NdN were compared across the three classes.
Feather-related genes were found to be under more purifying selection in peacock in comparison to immune genes and other genes (P < 0.01, based on two-sided Kruskal-Wallis test followed by pair-wise Conover's test) of the genome (Supplementary Figure 7A). Feather-related genes had a lower number of non-synonymous substitutions (NdN) in comparison to immune genes and other genes (P < 0.05, based on two-sided Kruskal-Wallis test followed by pair-wise Conover's test) of the genome (Supplementary Figure 7B). The immune genes had a higher number of synonymous substitutions (SdS) in comparison to feather and other genes (Supplementary Figure 7C). However, the synonymous substitution rate (dS) was similar for all the genes (Supplementary Figure 7D).
Evaluating the Consequence of Sexual Selection in Causing Selection Turnover
We examined the selection turnover in the genes for the extant species with respect to their recent ancestor, and the hierarchical clustering showed that Galliformes clustered based on their phylogeny (Figure 5A). The number of genes showing turnover in selection for the bin with r-squared values 0–0.2 (obtained from a regression between ω and relative testis weight across 11 species) was noticeably higher than the other bins (Figure 5A). This was expected because the total numbers of genes belonging to the r-squared bin of 0–0.2 were higher in comparison to the other bins with higher r-squared values. The two species with least sexual selection, budgerigar (zero dichromatism score) and hummingbird (lowest relative testis weight), that clustered together had the highest number of genes showing turnover (Figure 5A). To evaluate any direct correlation between sexual selection and selection turnover, the phylogenetically corrected regression of proportions of genes under selection turnover with the phenotypic measures of sexual selection was performed. Across the 10 species, no significant correlation between the selection turnover and the phenotypic measures of sexual selection was observed (Figure 5B).
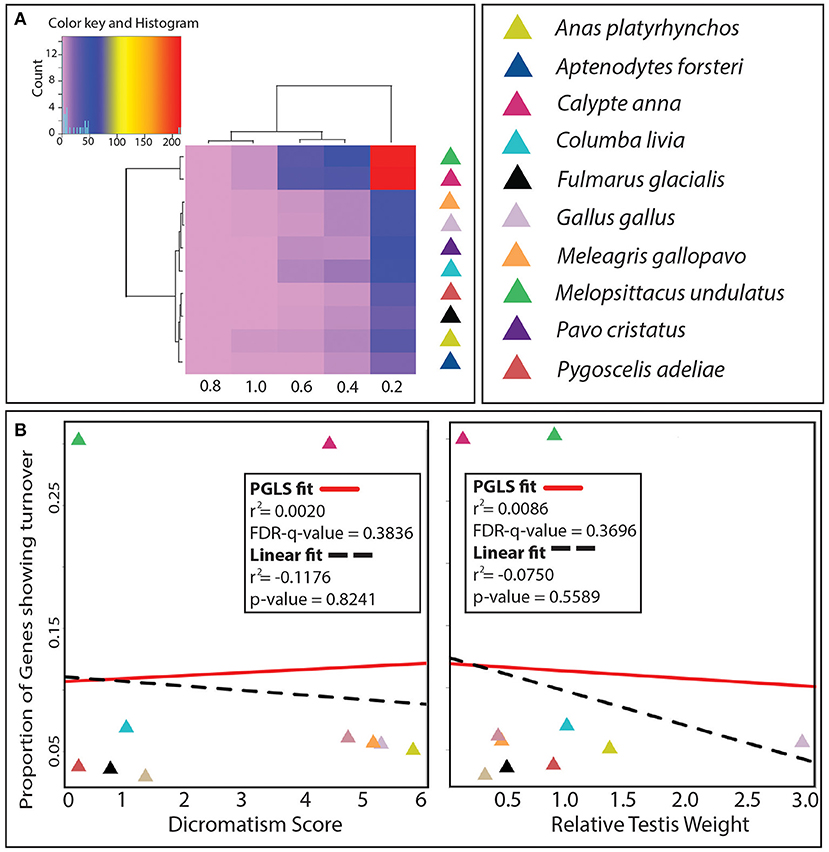
Figure 5. Selection turnover across species. (A) Hierarchical clustering of 10 species based on the number of genes showing turnover for these species and r-squared values (from PGLS fit between ω and relative testis weight) divided into different intervals named after their upper bound (0.2 = 0–0.2, 0.4 = 0.2–0.4, 0.6 = 0.4–0.6, 0.8 = 0.6–0.8, 1.0 = 0.8–1.0). (B) The PGLS and linear model (LM) regression fits for the proportions of genes showing turnover against the pre-copulatory (Dichromatism score) and post-copulatory (Relative testis weight) measures of sexual selection.
It was observed that the number of genes showing turnover was highest for the species with lowest sexual selection such as budgerigar and hummingbird in comparison to the other species (Figure 6A). The budgerigar had 317 genes and hummingbird had 316 genes that showed selection turnover, whereas other species had this number in the range of 30–71. The proportion of genes in the low and moderate turnover was high in the species with lower sexual selection such as (for both pre-copulatory and post-copulatory) in comparison to species with higher sexual selection (Figure 6B). In contrast, the proportion of genes in the high turnover was high in the species with higher sexual selection (for both pre-copulatory and post-copulatory) in comparison to species with lower sexual selection (Figure 6B).
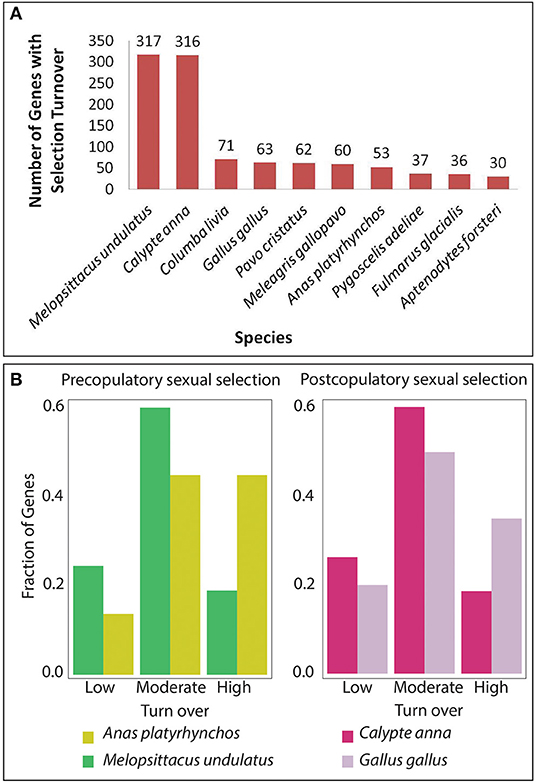
Figure 6. Discrete correlation of selection turnover with sexual selection. (A) A bar plot for the number of genes with selection turnover for each of the selected 11 species. (B) Distribution of genes across Low (0–4), Moderate (5–8), and High (>8) turnover for contrasting species mallard duck (Anas platyrhynchos) with high pre-copulatory sexual selection vs. budgerigar (Melopssitacus undulates) with low pre-copulatory sexual selection and chicken (Gallus gallus) with high post-copulatory sexual selection vs. hummingbird (Calypte anna) with low post-copulatory sexual selection.
Discussion
Sexual selection is a widely manifested phenomenon, but an important question remains: why are females so selective in mate choice in species where males provide only the sperm. In this regard, it is proposed that females use the specific male phenotypes (secondary sexual characters) to evaluate the genetic quality and compatibility of the males for the additive (good-genes) or non-additive (compatible-genes) genetic benefits (Neff and Pitcher, 2005). Although the evolution of several such phenotypic adaptations under the effect of sexual selection is known for different species, including birds, the molecular understanding of these adaptive traits and the role of selection at the genome level has been elusive.
The recent worldwide sequencing efforts are generating several draft bird genomes; yet, the public availability and quality of the genomic and phenotypic data remain a limiting factor in using this potentially valuable resource to gain novel evolutionary insights. Further, the evolutionary analysis is highly affected by the quality of sequence data (Mittal et al., 2019), and here, we sought to address an important evolutionary question of how sexual selection acts at the genomic level. Thus, to ensure a robust evolutionary analysis, we retrieved only the high-quality genomic sequences of bird species from the benchmark Ensembl genome database. The inclusion of peacock genome made the analysis more robust since it shows very high pre-copulatory and post-copulatory sexual selection, and hence was a critical data point while performing the phylogenetically corrected GLS regression between molecular evolutionary parameters and phenotypic measures of pre-copulatory and post-copulatory sexual selection. Further, to evaluate the relevance of Hamilton-Zuk hypothesis peacock genome was used as it shows very high sexual plumage dimorphism in comparison to the other species. Hence, comparative analysis of peacock with the species with no sexual plumage dimorphism (budgerigar) was useful to evaluate the Hamilton-Zuk hypothesis.
The phylogeny constructed in this study corroborates with the Jarvis et al. (2014) phylogeny except that budgerigar/parrot (Melopsittacus undulates) and hummingbird (Calypte anna) made a monophyletic clade in our phylogeny. However, according to the phylogeny of Jarvis et al. (2014), hummingbird should form a sister clade to the clade formed by penguins (Aptenodytes forsteri and Pygoscelis adeliae), fulmars (Fulmarus glacialis), and parrot (Jarvis et al., 2014). Further, as per the phylogeny reported by Prum et al. (2015) using 259 nuclear loci, hummingbird was a sister clade to the clade formed by fulmars, parrots, and rock dove (Columba livia) (Prum et al., 2015). In comparison, our phylogeny showed that hummingbird and parrot together formed a sister clade to penguins and fulmars. However, Reddy et al. (2017) generated a consensus phylogeny from both the Jarvis et al. (2014) and Prum et al. (2015) phylogenies with fulmars and penguins formed a sister clade and hummingbird and parrot together formed a sister clade and the same has also been observed in this study (Jarvis et al., 2014; Prum et al., 2015; Reddy et al., 2017). Thus, the phylogeny constructed in our study corroborates well with this recent phylogeny. The other species of Galloancers (Galliformes and Anseriformes) and Palaeognathae showed the same relative position in all the phylogenies including this study, Jarvis et al. (2014), Reddy et al. (2017), and Prum et al. (2015).
It is to be noted that the closeness of parrot and hummingbirds observed in this study was also observed in the phylogenetic trees constructed using protein-coding sequences by Jarvis et al. (2014). Thus, our phylogeny showed a convergence with the phylogenies constructed using protein-coding data as reported by Jarvis et al. (2014), Reddy et al. (2017), and Prum et al. (2015). Moreover, the studies by Reddy et al. (2017) and Jarvis et al. (2014) showed that phylogenetic trees constructed using only protein-coding sequences may yield a different topology than the trees constructed using rest of the genomic sequences, which could be one of the reasons for the observed differences between our phylogeny and the TENT (Total evidence nucleotide tree) phylogeny from Jarvis et al. (2014).
Sexual selection in birds has been the focus of numerous studies at the phenotypic level due to the existence of species with a wide range of pre-copulatory (from no plumage dimorphism to extreme plumage dimorphism), and post-copulatory (very high to nearly null sperm competition) sexual selection. The contribution of coding sequence of a few specific genes for specific traits in phenotypic variations under the effect of sexual selection is now recognized. However, such targeted approaches are susceptible to false discoveries, and while they identify the contribution of specific genes, the relative contribution from the other genes for genetically correlated traits are ignored. Moreover, along with specific traits, the selection on genetically correlated traits through comparative genomics is crucial for developing a holistic understanding of the phenotypic adaptations due to sexual selection (Brooks and Endler, 2001).
In previous studies, the phylogenetically corrected correlation between molecular parameters, such as the fraction of male-biased genes or ω values, with phenotypic measures of sexual selection has allowed the identification of genes and their expression pattern evolving under the influence of sexual selection (Nadeau et al., 2007; Martin-Coello et al., 2009; Harrison et al., 2015). This specific approach of using the phenotypic measures has helped to differentiate the genes evolving due to sexual selection from the genes which evolved under other forms of selection. Using this approach scaled to the genome-wide level, we observed that the evolution of coding sequences due to sexual selection happened in the genes involved in gene expression regulation and protein processing functions. This provides a plausible explanation for the previously observed sexual selection-driven turnover in gene expression (Harrison et al., 2015). In fact, changes at the regulatory level have been observed in earlier studies focused on individual genes (Nadeau et al., 2007; Martin-Coello et al., 2009).
The continuous or cyclical evolution detected through the RPuS (see Table 1 for the terminology) approach has been shown for genes involved in avian pigmentation (Nadeau et al., 2007) and was the primary mode of selection detected here. We found support for only three modes of selection: RPuS: 83.3%, IPuS: 15%, and INS: 1.7% (see Table 1 for the terminology), suggesting that sexual selection in birds predominantly works through varying degrees of purifying selection. Since purifying selection allows for sequence stability by purging of deleterious mutations, the relaxation in purifying selection will lead to a higher rate of mutation-selection process, and thus will allow for increased sequence divergence. Earlier studies have shown that sexual selection works through varying degrees of purifying selection in some avian pigmentation-related genes and other sex-related genes (Civetta and Singh, 1998; Nadeau et al., 2007).
From the results, it is apparent that the continuous or ongoing model was most supported, the equilibrium or stable outcome model was next most supported, and the increased mutation rate model was least supported. Previous studies with locus-specific analysis have also observed the most support for the continuous or ongoing model of sexual selection among the different models of sexual selection, including equilibrium or fixation and increased mutation rate model (Nadeau et al., 2007; Ramm et al., 2007). Also, most genes supported the criteria of reduction in purifying selection with the increase in sexual selection. It appears that the continuous or ongoing model is the most supported model of sexual selection and varying degrees of purifying selection is the major mechanism of action for this model of sexual selection in birds. Thus, our results corroborate with the previous studies suggesting that the varying degree of purifying selection can lead to faster coding sequence evolution, which was also observed for the genes on Z-chromosome (Dean et al., 2015).
In this genome-wide study, we observed that varying degrees of purifying selection is the major mechanism of sexual selection, however, positive selection is shown to be one of the mechanisms for sexual selection, which has also been reported elsewhere (Martin-Coello et al., 2009). Therefore, we evaluated the positively selected genes for each branch of the phylogenetic tree, including the ancestral and the 11 extant species with a spectrum of sexual selection. For the ancestral branches, Neoaves had sixteen, Sphenisciformes had twelve, Neognathae had nine, Galliformes had three, and Galloansers had one gene(s) under positive selection. It is apparent that Neoaves, Sphenisciformes, and Neognathae had a higher number of positively selected genes in comparison to Galliformes and Galloansers. Among the 11 extant species, only seven species, northern fulmar, mallard duck, budgerigar, common ostrich, hummingbird, adélie penguin, and rock dove had positively selected genes.
Sexual selection is known to cause positive selection for a few sperm-related genes such as protamine-1, protamine-2, GAPDS, SAM1, and ADAM1 in the species with high sperm competition (Torgerson et al., 2002; Martin-Coello et al., 2009). We identified eight genes that were positively selected in the species with high pre-copulatory and post-copulatory measures of sexual selection. Out of these, three genes (TRA2A, CREB3L1, and RBM22) were involved in nucleic acid binding and gene expression regulation. Until now, positive selection for only sperm-related proteins have been reported in the context of sexual selection; however, the identification of gene expression related genes in birds provides a plausible explanation for the previous observations that sexual selection leads to the rapid expression turnover in birds for the male-biased genes (Harrison et al., 2015). Moreover, positive selection of “TRA2A” gene in the species with high sexual selection that is a splicing factor and involved in sex determination suggests the involvement of a sex-related genes in the molecular mechanism of sexual selection (Chandler et al., 1997).
These observations indicate that in birds, sexual selection also operates through positive selection, but the actual number of genes affected is less compared to purifying selection. Since a vast majority of the genes have crucial and conserved functions, it is expected that they may remain under purifying selection to maintain the conserved function. Changes in very few regulatory genes can lead to large changes in the regulatory program, and it appears that sexual selection in birds is more focused toward purifying selection than positive selection (Mead and Arnold, 2004), which is consistent with the Fisherian and good-genes models (Lande, 1981). However, these results should be interpreted with caution, as the bird genome assemblies are of different quality, which may lead to biased results toward detecting more of conservation than an evolutionary novelty.
The features of peacock feathers such as residual train length and the number and size of ocelli, have been correlated with the immune-competence of the organism, suggesting the role of honest signaling in the evolution of feathers and immune system in peacock (Møller and Petrie, 2002; Jaiswal et al., 2018). Since immune genes are under constant arms race with parasite genes, they are constantly evolving due to the fast evolution of the parasite genomes. Thus, the high abundance of immune-related genes among the genes that show correlated patterns of evolution across species with a range of sexual selection, and the observed immune and feather related gene pairs with correlated patterns of evolution, is not surprising and provides a “mechanistic link” or a connection between genome and phenotypic coevolution which in such cases would include plumage color and other secondary sexual characters responsible for sexual selection and honest signaling. Therefore, the Hamilton-Zuk explanation for the persistence of variation in the phenotypes of sexual selection as a consequence of the arms-race between parasite and immune genes is substantiated by this study.
Selection turnover was examined at individual loci to understand the role of Fisherian and good-genes models in the manifestation of sexual selection via continuous or cyclical evolution. We found that parrots and hummingbirds with least sexual selection had a higher number of genes under selection turnover, which suggests that sexual selection show correlation with selection turnover. The parrots and hummingbirds showed similar patterns with respect to sexual selection perhaps because both are vocal learners, and the genomes of vocal learners are known to evolve very rapidly (Nottebohm, 1972; Wheatcroft and Qvarnström, 2015). Further, we found no significant correlation between the selection turnover and phenotypic measures of sexual selection. However, the species with the stronger sexual selection in terms of phenotypic measures showed a lesser number of genes with turnover, but the proportion of genes with a high number of turnover was high in comparison to species with weaker sexual selection. This suggests that perhaps sexual selection could lead to an increase in the number of selection turnover for the coding sequence of genes, although the total number of genes with selection turnover may decrease due to an increase in sexual selection. However, considering the large differences in the absolute number of genes showing turnover between the selected species, the observed results may need further investigation with inclusion of more species when the high-quality genomic and phenotypic data is available.
The presented work reveals the genomic signatures of sexual selection in birds and also provides mechanistic insights into the action of sexual selection at genome-wide scale. This study also presents a comprehensive methodology to evaluate evolutionary phenomenon and models at the genome-wide scale using the available genomic and phenotypic data.
Conclusion
The analysis of the coding genome for 11 high-quality bird species, which display a broad range of sexual selection allowed us to reveal the genomic signatures of sexual selection in birds. Selection pressure on genes involved in protein processing and gene expression regulation shows a higher correlation with the phenotypic measures of sexual selection. Our results suggest that sexual selection works on gene expression and protein processing by modifying the coding sequence of the genes involved in these two processes. The continuous or ongoing model was the most supported model of sexual selection, and the varying degree of purifying selection seems to be a predominant explanation for the proximate mechanism of sexual selection, although positive selection on specific genes in the species with elevated levels of sexual selection may also play some role. Across the 11 species, there were specific feather and immune-related gene-pairs showing correlated patterns of evolution, providing evidence for the Hamilton-Zuk hypothesis in birds. The selection turnover analysis revealed that sexual selection could also lead to high selection turnover in the genes, although the overall number of genes with turnover might decrease due to an increase in sexual selection. In summary, the current study provides novel insights on the genomic signatures of sexual selection in birds and reveals the role of sexual selection in shaping genome evolution. Future studies with the inclusion of more species can benefit from our innovative approach to study the genetics of sexual selection.
Data Availability Statement
Publicly available datasets were analyzed in this study. This data can be found here: The peacock genome data set is available in Short Read Archive under project number SRP083005 (BioProject accession: PRJNA340135, Biosample accession: SAMN05660020) and accession codes: SRR4068853 and SRR4068854. The data set for the other 10 bird genomes could be found at http://gigadb.org/dataset/101000. The phenotype data is available in the Supplementary Information. The scripts used for analysis during the current study are available from the corresponding author on reasonable request.
Author Contributions
VS conceived and coordinated the project. SKJ with the input from NV, VS, AG, and AS designed the computational framework of the study. AG and SKJ constructed the gene set. AG constructed reference-based gene set. SKJ and AG performed the genome annotations. SKJ performed the phylogenetic tree, sequence divergence, positive selection, phylogenetically corrected regression, phylogenetically corrected correlation, selection turnover, matrix layout, network, and statistical analysis. SKJ, AG, NV, AS, and VS analyzed the results. SKJ with the critical input from NV, AS, and VS interpreted the data. SKJ and VP constructed the figures with the input from NV, VS, AS, and AG. SKJ, AG, AS, NV, and VS wrote and revised the manuscript. All authors read and approved the final version of the manuscript.
Funding
The authors SKJ and AG thank the Department of Science and Technology for the DST-INSPIRE fellowship. We also thank the intramural research funds provided by IISER Bhopal.
Conflict of Interest
The authors declare that the research was conducted in the absence of any commercial or financial relationships that could be construed as a potential conflict of interest.
Acknowledgments
We thank the HPC facility and NGS facility at IISER Bhopal.
Supplementary Material
The Supplementary Material for this article can be found online at: https://www.frontiersin.org/articles/10.3389/fevo.2021.538498/full#supplementary-material
Abbreviations
IPuS, Increased purifying selection; IPoS, Increased positive selection; ISyS, Increased synonymous substitution rate; INSyS, Increased non-synonymous substitution rate; RPuS, Reduced purifying selection; RPoS, Reduced positive selection; RSyS, Reduced synonymous substitution rate; RNSyS, Reduced non-synonymous substitution rate; INS, Increased nucleic acid substitution rates; PGLS, Phylogenetic generalized least squared; LM, Linear regression model; GTF3C6, General Transcription Factor IIIC Subunit 6; CFL2, Cofilin 2; ANKRD1, Ankyrin Repeat Domain 1; GABPA, GA Binding Protein Transcription Factor Alpha Subunit; SPCS1, Signal peptidase complex subunit 1; KIT, KIT Proto-Oncogene Receptor Tyrosine Kinase MYEF2, Myelin Expression Factor 2; ZNF750, Zinc Finger Protein 750; ZHX1, Zinc Fingers And Homeoboxes 1; CREB3L1, CAMP Responsive Element Binding Protein 3 Like 1; TRA2A, Transformer 2 Alpha Homolog; SPCS1, Signal Peptidase Complex Subunit 1; VPS29, Vesicle Protein Sorting 29; RBM22, RNA Binding Motif Protein 22; DYNLT1, Dynein Light Chain Tctex-Type 1; GC3, GC content in the third codon position; BUSCO, Benchmarking Universal Single-Copy Orthologs; SWAMP, Sliding Window Alignment Masker for PAML.
References
Balenger, S. L., and Zuk, M. (2014). Testing the Hamilton–Zuk hypothesis: past, present, and future. Integr. Comp. Biol. 54, 601–613. doi: 10.1093/icb/icu059
Bartosch-Härlid, A., Berlin, S., Smith, N. G., Møller, A. P., and Ellegren, H. (2003). Life history and the male mutation bias. Evolution 57, 2398–2406. doi: 10.1554/03-036
Basolo, A. L. (1995). Phylogenetic evidence for the role of a pre-existing bias in sexual selection. Proc. Royal Soc. B 259, 307–311. doi: 10.1098/rspb.1995.0045
Bastazini, V. A., Ferreira, P. M., Azambuja, B. O., Casas, G., Debastiani, V. J., Guimarães, P. R., et al. (2017). Untangling the tangled bank: a novel method for partitioning the effects of phylogenies and traits on ecological networks. Evol. Biol. 44, 312–324. doi: 10.1007/s11692-017-9409-8
Brooks, R., and Endler, J. A. (2001). Direct and indirect sexual selection and quantitative genetics of male traits in guppies (Poecilia reticulata). Evolution 55, 1002–1015. doi: 10.1554/0014-3820(2001)055[1002:DAISSA]2.0.CO;2
Brown, J. L. (1998). The new heterozygosity theory of mate choice and the MHC. Genetica 104, 215–221. doi: 10.1023/A:1026409220292
Byers, J. A., and Waits, L. (2006). Good genes sexual selection in nature. Proc. Natl. Acad. Sci. U. S. A.103, 16343–16345. doi: 10.1073/pnas.0608184103
Calhim, S., and Birkhead, T. R. (2006). Testes size in birds: quality versus quantity—assumptions, errors, and estimates. Behav. Ecol.18, 271–275. doi: 10.1093/beheco/arl076
Catchpole, C. K. (1980). Sexual selection and the evolution of complex songs among european warblers of the genus acr ocephal us. Behaviour 74, 149–165. doi: 10.1163/156853980X00366
Chandler, D., Mcguffin, M. E., Piskur, J., Yao, J., Baker, B. S., and Mattox, W. (1997). Evolutionary conservation of regulatory strategies for the sex determination factor transformer-2. Mol. Cell. Biol. 17, 2908–2919. doi: 10.1128/MCB.17.5.2908
Civetta, A., and Singh, R. S. (1998). Sex-related genes, directional sexual selection, and speciation. Mol. Biol. Evol. 15, 901–909. doi: 10.1093/oxfordjournals.molbev.a025994
Conway, J. R., Lex, A., and Gehlenborg, N. (2017). UpSetR: an R package for the visualization of intersecting sets and their properties. Bioinformatics 33, 2938–2940. doi: 10.1093/bioinformatics/btx364
Creasy, K. T., Jiang, J., Ren, H., Peterson, M. L., and Spear, B. T. (2016). Zinc fingers and homeoboxes 2 (Zhx2) regulates sexually dimorphic Cyp gene expression in the adult mouse liver. Gene Expr. 17:7. doi: 10.3727/105221616X691712
Dale, S., Kruszewicz, A., and Slagsvold, T. (1996). Effects of blood parasites on sexual and natural selection in the pied flycather. J. Zool. 238, 373–393. doi: 10.1111/j.1469-7998.1996.tb05401.x
Dalloul, R. A., Long, J. A., Zimin, A. V., Aslam, L., Beal, K., Blomberg, L. A., et al. (2010). Multi-platform next-generation sequencing of the domestic turkey (Meleagris gallopavo): genome assembly and analysis. PLoS Biol 8:e1000475. doi: 10.1371/journal.pbio.1000475
Darwin, C. (1872). The Descent of Man, and Selection in Relation to Sex. New York, NY; London: D. Appleton. doi: 10.5962/bhl.title.2112
Darwin, C. (1896). The Descent of Man and Selection in Relation to Sex. New York, NY; London: D. Appleton.
Darwin, F. (1911). Letter to Asa Gray, dated 3 April 1860, The Life and Letters of Charles Darwin. New York, NY; London: D. Appleton and Company 2, 90–91.
Dean, R., Harrison, P. W., Wright, A. E., Zimmer, F., and Mank, J. E. (2015). Positive selection underlies faster-Z evolution of gene expression in birds. Mol. Biol. Evol. 32, 2646–2656. doi: 10.1093/molbev/msv138
Duclot, F., and Kabbaj, M. (2015). The estrous cycle surpasses sex differences in regulating the transcriptome in the rat medial prefrontal cortex and reveals an underlying role of early growth response 1. Genome Biol. 16:256. doi: 10.1186/s13059-015-0815-x
Eöry, L., Gilbert, M. T. P., Li, C., Li, B., Archibald, A., Aken, B. L., et al. (2015). Avianbase: a community resource for bird genomics. Genome Biol. 16, 1–4. doi: 10.1186/s13059-015-0588-2
Feng, S., Stiller, J., Deng, Y., Armstrong, J., Fang, Q., Reeve, A. H., et al. (2020). Dense sampling of bird diversity increases power of comparative genomics. Nature 587, 252–257. doi: 10.1038/s41586-020-2873-9
Foote, A. D., Liu, Y., Thomas, G. W., Vinar, T., Alföldi, J., Deng, J., et al. (2015). Convergent evolution of the genomes of marine mammals. Nat. Genet. 47, 272–275. doi: 10.1038/ng.3198
Gianuca, A. T., Dias, R. A., Debastiani, V. J., and Duarte, L. D. (2014). Habitat filtering influences the phylogenetic structure of avian communities across a coastal gradient in southern B razil. Austral. Ecol. 39, 29–38. doi: 10.1111/aec.12042
Guindon, S., Dufayard, J.-F., Lefort, V., Anisimova, M., Hordijk, W., and Gascuel, O. (2010). New algorithms and methods to estimate maximum-likelihood phylogenies: assessing the performance of PhyML 3.0. Syst. Biol. 59, 307–321. doi: 10.1093/sysbio/syq010
Hamilton, W. D., and Zuk, M. (1982). Heritable true fitness and bright birds: a role for parasites? Science 218, 384–387. doi: 10.1126/science.7123238
Harrison, P. W., Jordan, G. E., and Montgomery, S. H. (2014). SWAMP: sliding window alignment masker for PAML. Evol. Bioinform. Online 10:197. doi: 10.4137/EBO.S18193
Harrison, P. W., Wright, A. E., Zimmer, F., Dean, R., Montgomery, S. H., Pointer, M. A., et al. (2015). Sexual selection drives evolution and rapid turnover of male gene expression. Proc. Natl. Acad. Sci. U. S. A.112, 4393–4398. doi: 10.1073/pnas.1501339112
Hillier, L. W., Miller, W., Birney, E., Warren, W., Hardison, R. C., Ponting, C. P., et al. (2004). Sequence and comparative analysis of the chicken genome provide unique perspectives on vertebrate evolution. Nature 432, 695–716. doi: 10.1038/nature03154
Hosken, D. J., and House, C. M. (2011). Sexual selection. Curr. Biol. 21, R62–R65. doi: 10.1016/j.cub.2010.11.053
Houle, D., and Kondrashov, A. S. (2002). Coevolution of costly mate choice and condition-dependent display of good genes. Proc. Royal Soc. B 269, 97–104. doi: 10.1098/rspb.2001.1823
Huang, Z., Ruan, H.-B., Xian, L., Chen, W., Jiang, S., Song, A., et al. (2014). The stem cell factor/Kit signalling pathway regulates mitochondrial function and energy expenditure. Nat. Commun. 5:4282. doi: 10.1038/ncomms5282
Huerta-Cepas, J., Forslund, K., Coelho, L. P., Szklarczyk, D., Jensen, L. J., Von Mering, C., et al. (2017). Fast genome-wide functional annotation through orthology assignment by eggNOG-mapper. Mol. Biol. Evol. 34, 2115–2122. doi: 10.1093/molbev/msx148
Huerta-Cepas, J., Szklarczyk, D., Forslund, K., Cook, H., Heller, D., Walter, M. C., et al. (2016). eggNOG 4.5: a hierarchical orthology framework with improved functional annotations for eukaryotic, prokaryotic and viral sequences. Nucleic Acids Res. 44, D286–293. doi: 10.1093/nar/gkv1248
Irestedt, M., Jønsson, K. A., Fjeldså, J., Christidis, L., and Ericson, P. G. (2009). An unexpectedly long history of sexual selection in birds-of-paradise. BMC Evol. Biol. 9:235. doi: 10.1186/1471-2148-9-235
Jaiswal, S. K., Gupta, A., Saxena, R., Prasoodanan, V. P., Sharma, A. K., Mittal, P., et al. (2018). Genome sequence of peacock reveals the peculiar case of a glittering bird. Front. Genet. 9:392. doi: 10.3389/fgene.2018.00392
Jarvis, E. D., Mirarab, S., Aberer, A. J., Li, B., Houde, P., Li, C., et al. (2014). Whole-genome analyses resolve early branches in the tree of life of modern birds. Science 346, 1320–1331. doi: 10.1126/science.1253451
Jetz, W., Thomas, G., Joy, J., Hartmann, K., and Mooers, A. (2012). The global diversity of birds in space and time. Nature 491, 444–448. doi: 10.1038/nature11631
Jones, J. C., Fan, S., Franchini, P., Schartl, M., and Meyer, A. (2013). The evolutionary history of X iphophorus fish and their sexually selected sword: a genome-wide approach using restriction site-associated DNA sequencing. Mol. Ecol. 22, 2986–3001. doi: 10.1111/mec.12269
Kanehisa, M., and Goto, S. (2000). KEGG: kyoto encyclopedia of genes and genomes. Nucleic Acids Res. 28, 27–30. doi: 10.1093/nar/28.1.27
Keane, T. M., Creevey, C. J., Pentony, M. M., Naughton, T. J., and Mclnerney, J. O. (2006). Assessment of methods for amino acid matrix selection and their use on empirical data shows that ad hoc assumptions for choice of matrix are not justified. BMC Evol. Biol. 6:29. doi: 10.1186/1471-2148-6-29
Kruuk, L. E., Slate, J., Pemberton, J. M., Brotherstone, S., Guinness, F., and Clutton-Brock, T. (2002). Antler size in red deer: heritability and selection but no evolution. Evolution 56, 1683–1695. doi: 10.1111/j.0014-3820.2002.tb01480.x
Künstner, A., Wolf, J. B., Backström, N., Whitney, O., Balakrishnan, C. N., Day, L., et al. (2010). Comparative genomics based on massive parallel transcriptome sequencing reveals patterns of substitution and selection across 10 bird species. Mol. Ecol. 19, 266–276. doi: 10.1111/j.1365-294X.2009.04487.x
Lande, R. (1981). Models of speciation by sexual selection on polygenic traits. Proc. Natl. Acad. Sci. U. S. A. 78, 3721–3725. doi: 10.1073/pnas.78.6.3721
Lex, A., and Gehlenborg, N. (2014). Points of view: sets and intersections. Nat. Methods 11, 779–779. doi: 10.1038/nmeth.3033
Liao, Y., Wang, J., Jaehnig, E. J., Shi, Z., and Zhang, B. (2019). WebGestalt 2019: gene set analysis toolkit with revamped UIs and APIs. Nucleic Acids Res. 47, W199–W205. doi: 10.1093/nar/gkz401
Liu, K., Warnow, T. J., Holder, M. T., Nelesen, S. M., Yu, J., Stamatakis, A. P., et al. (2012). SATe-II: very fast and accurate simultaneous estimation of multiple sequence alignments and phylogenetic trees. Syst. Biol. 61:90. doi: 10.1093/sysbio/syr095
Loyau, A., Gomez, D., Moureau, B., Théry, M., Hart, N. S., Jalme, M. S., et al. (2007). Iridescent structurally based coloration of eyespots correlates with mating success in the peacock. Behav. Ecol. 18, 1123–1131. doi: 10.1093/beheco/arm088
Loyau, A., Saint Jalme, M., Cagniant, C., and Sorci, G. (2005). Multiple sexual advertisements honestly reflect health status in peacocks (Pavo cristatus). Behav. Ecol. Sociobiol. 58, 552–557. doi: 10.1007/s00265-005-0958-y
Martin-Coello, J., Dopazo, H., Arbiza, L., Ausió, J., Roldan, E. R., and Gomendio, M. (2009). Sexual selection drives weak positive selection in protamine genes and high promoter divergence, enhancing sperm competitiveness. Proc. Royal Soc. B 276, 2427–2436. doi: 10.1098/rspb.2009.0257
Mayne, B. T., Bianco-Miotto, T., Buckberry, S., Breen, J., Clifton, V., Shoubridge, C., et al. (2016). Large scale gene expression meta-analysis reveals tissue-specific, sex-biased gene expression in humans. Front. Genet. 7:183. doi: 10.3389/fgene.2016.00183
Mead, L. S., and Arnold, S. J. (2004). Quantitative genetic models of sexual selection. Trends Ecol. Evol. 19, 264–271. doi: 10.1016/j.tree.2004.03.003
Mittal, P., Jaiswal, S. K., Vijay, N., Saxena, R., and Sharma, V. K. (2019). Comparative analysis of corrected tiger genome provides clues to its neuronal evolution. Sci. Rep. 9, 1–11. doi: 10.1038/s41598-019-54838-z
Moller, A. (1989). Ejaculate quality, testes size and sperm production in mammals. Funct. Ecol. 3, 91–96. doi: 10.2307/2389679
Møller, A. P. (1988a). Ejaculate quality, testes size and sperm competition in primates. J. Hum. Evol. 17, 479–488. doi: 10.1016/0047-2484(88)90037-1
Møller, A. P. (1988b). Testes size, ejaculate quality and sperm competition in birds. Biol. J. Linn. Soc. 33, 273–283. doi: 10.1111/j.1095-8312.1988.tb00812.x
Møller, A. P. (1990). Effects of a haematophagous mite on the barn swallow (Hirundo rustica): a test of the Hamilton and Zuk hypothesis. Evolution 44, 771–784. doi: 10.1111/j.1558-5646.1990.tb03804.x
Moller, A. P. (1991). Sperm competition, sperm depletion, paternal care, and relative testis size in birds. Am. Nat. 137, 882–906. doi: 10.1086/285199
Møller, A. P., and Petrie, M. (2002). Condition dependence, multiple sexual signals, and immunocompetence in peacocks. Behav. Ecol. 13, 248–253. doi: 10.1093/beheco/13.2.248
Nadeau, N. J., Burke, T., and Mundy, N. I. (2007). Evolution of an avian pigmentation gene correlates with a measure of sexual selection. Proc. Royal Soc. B 274, 1807–1813. doi: 10.1098/rspb.2007.0174
Nam, K., Mugal, C., Nabholz, B., Schielzeth, H., Wolf, J. B., Backström, N., et al. (2010). Molecular evolution of genes in avian genomes. Genome Biol. 11:R68. doi: 10.1186/gb-2010-11-6-r68
Neff, B. D., and Pitcher, T. E. (2005). Genetic quality and sexual selection: an integrated framework for good genes and compatible genes. Mol. Ecol. 14, 19–38. doi: 10.1111/j.1365-294X.2004.02395.x
O'leary, N. A., Wright, M. W., Brister, J. R., Ciufo, S., Haddad, D., Mcveigh, R., et al. (2016). Reference sequence (RefSeq) database at NCBI: current status, taxonomic expansion, and functional annotation. Nucleic Acids Res. 44, D733–745. doi: 10.1093/nar/gkv1189
Owens, I. P., and Bennett, P. M. (1994). Mortality costs of parental care and sexual dimorphism in birds. Proc. Royal Soc. B 257, 1–8. doi: 10.1098/rspb.1994.0086
Pagel, M., and Meade, A. (2007). BayesTraits. Computer Program and Documentation. Available online at: http://www.evolution.rdg.ac.uk/BayesTraits.html (accessed August, 2017).
Parker, G. (1979). “Sexual selection and sexual conflict,” in Sexual Selection and Reproductive Competition in Insects, eds M. S. Blum and N. A. Blum (Waltham, MA: Academic Press), 123–166. doi: 10.1016/B978-0-12-108750-0.50010-0
Petrie, M., and Williams, A. (1993). Peahens lay more eggs for peacocks with larger trains. Proc. Royal Soc. B 251, 127–131. doi: 10.1098/rspb.1993.0018
Pomiankowski, A., and Moller, A. (1995). A resolution of the lek paradox. Proc. Royal Soc. B 260, 21–29. doi: 10.1098/rspb.1995.0054
Prum, R. O., Berv, J. S., Dornburg, A., Field, D. J., Townsend, J. P., Lemmon, E. M., et al. (2015). A comprehensive phylogeny of birds (Aves) using targeted next-generation DNA sequencing. Nature 526, 569–573. doi: 10.1038/nature15697
Ramm, S. A., Oliver, P. L., Ponting, C. P., Stockley, P., and Emes, R. D. (2007). Sexual selection and the adaptive evolution of mammalian ejaculate proteins. Mol. Biol. Evol. 25, 207–219. doi: 10.1093/molbev/msm242
Read, A. F. (1987). Comparative evidence supports the Hamilton and Zuk hypothesis on parasites and sexual selection. Nature 328:68. doi: 10.1038/328068a0
Read, A. F., and Weary, D. M. (1990). Sexual selection and the evolution of bird song: a test of the Hamilton-Zuk hypothesis. Behav. Ecol. Sociobiol. 26, 47–56. doi: 10.1007/BF00174024
Reddy, S., Kimball, R. T., Pandey, A., Hosner, P. A., Braun, M. J., Hackett, S. J., et al. (2017). Why do phylogenomic data sets yield conflicting trees? Data type influences the avian tree of life more than taxon sampling. Syst. Biol. 66, 857–879. doi: 10.1093/sysbio/syx041
Rodríguez-Martínez, S., and Galván, I. (2020). Juvenile pheomelanin-based plumage coloration has evolved more frequently in carnivorous species. Ibis 162, 238–244. doi: 10.1111/ibi.12770
Romiguier, J., Ranwez, V., Douzery, E. J., and Galtier, N. (2010). Contrasting GC-content dynamics across 33 mammalian genomes: relationship with life-history traits and chromosome sizes. Genome Res. 20, 1001–1009. doi: 10.1101/gr.104372.109
Rowe, L., and Houle, D. (1996). The lek paradox and the capture of genetic variance by condition dependent traits. Proc. Royal Soc. B 263, 1415–1421. doi: 10.1098/rspb.1996.0207
Skoracki, M., Sikora, B., Jerzak, L., and Hromada, M. (2020). Tanopicobia gen. nov., a new genus of quill mites, its phylogenetic placement in the subfamily Picobiinae (Acariformes: Syringophilidae) and picobiine relationships with avian hosts. PLoS ONE 15:e0225982. doi: 10.1371/journal.pone.0225982
Stiller, J., and Zhang, G. (2019). Comparative phylogenomics, a stepping stone for bird biodiversity studies. Diversity 11:115. doi: 10.3390/d11070115
Tatusov, R. L., Galperin, M. Y., Natale, D. A., and Koonin, E. V. (2000). The COG database: a tool for genome-scale analysis of protein functions and evolution. Nucleic Acids Res. 28, 33–36. doi: 10.1093/nar/28.1.33
Torgerson, D. G., Kulathinal, R. J., and Singh, R. S. (2002). Mammalian sperm proteins are rapidly evolving: evidence of positive selection in functionally diverse genes. Mol. Biol. Evol. 19, 1973–1980. doi: 10.1093/oxfordjournals.molbev.a004021
Uebbing, S., Künstner, A., Mäkinen, H., Backström, N., Bolivar, P., Burri, R., et al. (2016). Divergence in gene expression within and between two closely related flycatcher species. Mol. Ecol. 25, 2015–2028. doi: 10.1111/mec.13596
Wade, M. J., and Arnold, S. J. (1980). The intensity of sexual selection in relation to male sexual behaviour, female choice, and sperm precedence. Anim. Behav. 28, 446–461. doi: 10.1016/S0003-3472(80)80052-2
Warren, W. C., Clayton, D. F., Ellegren, H., Arnold, A. P., Hillier, L. W., Künstner, A., et al. (2010). The genome of a songbird. Nature 464, 757–762. doi: 10.1038/nature08819
Wheatcroft, D., and Qvarnström, A. (2015). A blueprint for vocal learning: auditory predispositions from brains to genomes. Biol. Lett. 11:20150155. doi: 10.1098/rsbl.2015.0155
Wong, A. (2014). Covariance between testes size and substitution rates in primates. Mol. Biol. Evol. 31, 1432–1436. doi: 10.1093/molbev/msu091
Yang, D., Zhang, Z., Liang, S., Yang, Q., Wang, Y., and Qin, Z. (2017). A novel role of Krüppel-like factor 4 in Zhikong scallop Chlamys farreri during spermatogenesis. PLoS ONE 12:e0180351. doi: 10.1371/journal.pone.0180351
Yang, Z. (1997). PAML: a program package for phylogenetic analysis by maximum likelihood. Bioinformatics 13, 555–556. doi: 10.1093/bioinformatics/13.5.555
Yang, Z. (2007). PAML 4: phylogenetic analysis by maximum likelihood. Mol. Biol. Evol. 24, 1586–1591. doi: 10.1093/molbev/msm088
Zhang, G., Jarvis, E. D., and Gilbert, M. T. P. (2014a). A flock of genomes. Science 346:1308. doi: 10.1126/science.346.6215.1308
Keywords: sexual selection, avian evolution, comparative genomics, purifying selection, dN/dS (ω), turnover, Hamilton-Zuk hypothesis
Citation: Jaiswal SK, Gupta A, Shafer ABA, P. K. VP, Vijay N and Sharma VK (2021) Genomic Insights Into the Molecular Basis of Sexual Selection in Birds. Front. Ecol. Evol. 9:538498. doi: 10.3389/fevo.2021.538498
Received: 27 February 2020; Accepted: 04 January 2021;
Published: 28 January 2021.
Edited by:
Fulvio Cruciani, Sapienza University of Rome, ItalyReviewed by:
Erich David Jarvis, Duke University, United StatesEmma Whittington, University of Oslo, Norway
Copyright © 2021 Jaiswal, Gupta, Shafer, P. K., Vijay and Sharma. This is an open-access article distributed under the terms of the Creative Commons Attribution License (CC BY). The use, distribution or reproduction in other forums is permitted, provided the original author(s) and the copyright owner(s) are credited and that the original publication in this journal is cited, in accordance with accepted academic practice. No use, distribution or reproduction is permitted which does not comply with these terms.
*Correspondence: Vineet K. Sharma, dmluZWV0a3NAaWlzZXJiLmFjLmlu
†These authors have contributed equally to this work