 Rubén Torices
 Lucía DeSoto
 Eduardo Narbona
 José María Gómez2
 John Richard Pannell
- 1Área de Biodiversidad y Conservación, Departamento de Biología y Geología, Física y Química Inorgánica, Universidad Rey Juan Carlos, Móstoles, Spain
- 2Departamento de Ecología Funcional y Evolutiva, Estación Experimental de Zonas Áridas, Consejo Superior de Investigaciones Científicas, Almería, Spain
- 3Área de Botánica, Departamento de Biología Molecular e Ingeniería Bioquímica, Universidad Pablo de Olavide, Seville, Spain
- 4Department of Ecology and Evolution, University of Lausanne, Lausanne, Switzerland
The reproductive success of plants depends both on their phenotype and the local neighbourhood in which they grow. Animal-pollinated plants may benefit from increased visitation when surrounded by attractive conspecific individuals, via a “magnet effect.” Group attractiveness is thus potentially a public good that can be exploited by individuals, with selfish exploitation predicted to depend on genetic relatedness within the group. Petal colour is a potentially costly trait involved in floral signalling and advertising to pollinators. Here, we assessed whether petal colour was plastically sensitive to the relatedness of neighbours in the annual herb Moricandia moricandioides, which produces purple petals through anthocyanin pigment accumulation. We also tested whether petal colour intensity was related to nectar volume and sugar content in a context-dependent manner. Although both petal colour and petal anthocyanin concentration did not significantly vary with the neighbourhood configuration, plants growing with kin made a significantly higher investment in petal anthocyanin pigments as a result of the greater number and larger size of their flowers. Moreover the genetic relatedness of neighbours significantly modified the relationship between floral signalling and reward quantity: while focal plants growing with non-kin showed a positive relationship between petal colour and nectar production, plants growing with kin showed a positive relationship between number of flowers and nectar volume, and sugar content. The observed plastic response to group relatedness might have important effects on pollinator behaviour and visitation, with direct and indirect effects on plant reproductive success and mating patterns, at least in those plant species with patchy and genetically structured populations.
Introduction
Because plants are sessile and establish from seeds that are often dispersed over short distances, their neighbours are frequently also their relatives (Harper, 1977; Valverde et al., 2016). This fact may counteract the strength of local competitive interactions. While survival and reproduction require successful competition with neighbours for resources (Antonovics and Levin, 1980), inclusive fitness (Hamilton, 1964a,b) might actually be optimised by less aggressive behaviour towards neighbours if they are closely related. The possibility that plants evolve such altruistic behaviour in response to kin selection has received increasing theoretical attention and experimental support in recent years, particularly with respect to traits influencing vegetative competition (Heil and Karban, 2010; Chen et al., 2012; Gagliano et al., 2012; Pierik et al., 2014; Dudley, 2015). However, kin selection should also shape the evolution of reproductive traits affecting competition for pollinators (Torices et al., 2018; Iritani, 2020; Sun et al., 2021).
In agreement with the expected sensitivity of a plant’s flowering strategy to the relatedness of its neighbours, Torices et al. (2018) recently showed that individuals of Moricandia moricandioides, a self-incompatible annual herb of arid habitats of south-eastern Spain, produced larger floral displays when close neighbours were related than when they were unrelated. The authors interpreted this behaviour as evidence for kin recognition and speculated that it might reflect kin selection for altruism. Plants flowering in the same patch may benefit mutually by increasing their joint attractiveness to pollinators through a “magnet effect” (Moeller, 2004; Hegland, 2014). This investment in advertising as a public good should be favoured by selection more when those sharing the benefits are related to one another, since this will increase the inclusive fitness of related plants. A recent mathematical model supports this prediction, showing that floral display increases with increasing relatedness of neighbouring plants when there is magnet effect attracting more pollinators to the patch (Sun et al., 2021).
Torices et al. (2018) studied simple floral display size, yet pollinators respond in complex ways to signals of attraction (Avarguès-Weber et al., 2014; Howard et al., 2017; Koethe et al., 2020). First, the nature of a signal may be multidimensional, with the possibility of positive or negative associations among different floral traits (Smith, 2016) or floral allocations (Torices and Méndez, 2014). And second, the optimal implementation of advertising signals may be further complicated by how honestly they are linked to the reward being advertised (Belsare et al., 2009; Howard et al., 2019). All of this implicates possible resource trade-offs between attractive and rewarding traits. For example, increasing display size, as observed by Torices et al. (2018), may compromise investment towards attractiveness such as colour. However, there remains disagreement over the extent to which producing flower colour pigments is costly (Archetti, 2009; Del Valle et al., 2019), and thus over whether such trade-offs should be expected (but see Sletvold et al., 2016). Moreover, the combination of size and colour may affect attractiveness to pollinators in non-additive ways, and may strongly depend on pollinator identity (Wertlen et al., 2008; de Ibarra et al., 2015; Stewart et al., 2015).
The visitation rate and foraging decisions of many pollinators are influenced by floral colour (Ômura and Honda, 2005; Schaefer and Ruxton, 2011; Dötterl et al., 2014; de Ibarra et al., 2015; Fattorini and Glover, 2020). As such, floral colour influences pollination success, seed production, and siring success (Jones and Reithel, 2001; Caruso et al., 2010; Shang et al., 2011; Veiga et al., 2015; Sletvold et al., 2016), although selection intensity on floral colour frequently depends on environmental conditions (Caruso et al., 2019; Sletvold, 2019). Importantly, the effect of floral colour on pollinator behaviour and plant reproductive success may also depend on the distribution of rewards offered by other competing flowers in the pollination market (Chittka and Schürkens, 2001; Benitez-Vieyra et al., 2014).
Although pollinators have innate preferences for specific colours, they can quickly adapt their preferences by associative learning, based on reward quality and quantity (Kelber and Osorio, 2010; Schiestl and Johnson, 2013). In this sense, we might expect the local intraspecific neighbourhood to have important consequences for an individual plant’s optimal strategy of both display and reward (Bartkowska and Johnston, 2014). Cohen and Shmida (1993) modelled the association between floral advertisement and reward, with specific attention to flower density. Their model predicts that allocation to signalling traits should increase when flower density is low, thereby facilitating visibility, whereas allocation to rewards should be favoured under conditions of high flower density or low visitation rates so as to favour revisitation of their flowers, i.e., by promoting favourable pollinator choice (Cohen and Shmida, 1993). However, to our knowledge, we still lack formal theoretical foundations for predicting the potential kinship effects on the relationship between floral signalling and reward.
Here, we ask whether plants modify their allocation to advertising, estimated as floral colour, depending on the relatedness of their neighbours. We analysed petal colour, estimated pigment allocation to petals, and measured nectar production of the plant M. moricandioides (Boiss.) Heywood (Brassicaceae) in an experiment in which both plant density and kin structure were manipulated. This species produces purple petals coloured by the accumulation of anthocyanin pigments (Tatsuzawa et al., 2012), and pigment concentration varies among individuals of a population (Del Valle et al., 2018). Our study is based on measurement of a subsample of the plants investigated previously by Torices et al. (2018), who focused on floral display size rather than colour, as summarised above. In the current study, we specifically asked: (i) Does the neighbourhood size affect petal colour? (ii) Does the genetic relatedness of neighbours and its interaction with neighbourhood size affect petal colour? Additionally, (iii) we estimated the individual plant investment into petal anthocyanin pigments to assess whether the higher advertising effort observed in terms of petal biomass was translated into higher total pigment allocation, or whether plants produced larger but less colourful flower (e.g., as a result of an allocation trade-off). Finally, (iv) we explored whether variation in petal colour correlated with nectar production, and whether this relationship depended on the neighbourhood size or the genetic relatedness of the neighbours.
Materials and Methods
Experimental Design
We evaluated the effect of the number and the genetic relatedness of neighbours on the petal colour of individuals of M. moricandioides, which relies entirely on insect pollinators for its reproduction, mainly Antophorini bees (Gómez, 1996; González-Megías and Menéndez, 2012; Gómez et al., 2016). We collected seeds from 50 different mothers from the same population near Granada, Spain (37°07′11.8″ N 3°43′47.2″ W), collected in June 2015. The present study used a subset of these plants from Torices et al.’s (2018) experiment in which floral colour was measured by means of digital images (see below). This subset of plants (146 focal plants, from 25 different maternal families) corresponds to the maternal families with focal plants flowered at the dates we took the pictures. Torices et al.’s (2018) experiment involved growing target individuals (focal plants) in pots with zero, three or six neighbours that were either related as half sibs (“kin,” sampled from the same open-pollinated mother and thus likely half-sibs but possible also including full-sibs) or unrelated (“non-kin,” sampled randomly from the population).
Seeds were sown individually, and seedlings were then re-potted into the experimental neighbourhood in pots with 1.5 L of soil between April 7th and 18th, 2016, when they had produced at least one leaf. All focal plants from the same maternal family and their respective experimental neighbourhood were re-potted the same day. Each treatment was replicated once for each maternal family, totalising 25 focal plants, one per family, in each treatment. Plants were grown at a constant temperature of 24°C under a 16:8 h day-night regime in a mixture of 50% sterilised compost and 50% topsoil (agricultural-garden soil), with a pH 7.4. All pots were irrigated with 135 mL of water daily. Further details of this experiment can be found in Torices et al. (2018).
Inflorescences of M. moricandioides are racemes of usually more than 20 flowers that open sequentially (Gómez, 1996). Because petal mass declines to some extent from the bottom to the top of the inflorescences (Torices et al., 2018), we recorded each flower’s relative position in its inflorescence. Flowers of the same individual show similar petal colour intensity and anthocyanin concentration (Gómez et al., unpublished data).
Colour Measurement
Moricandia moricandioides’ petals have a purple colour frequently patterned with darker venation (Figure 1). This purple colour is the result of the accumulation of anthocyanins, specifically cyanidin and peonidin derivatives (Tatsuzawa et al., 2012). We analysed petal colour and estimated anthocyanin pigment concentration in the petals of one flower of focal plants from 25 maternal families using digital images following the procedure described by Del Valle et al. (2018). This non-invasive method uses colour indices derived from red–green–blue (RGB) values of digital images and has been used to accurately quantify pigment concentrations in floral tissues of several species with anthocyanin-based colours, including M. moricandioides (Del Valle et al., 2018; Peach et al., 2020). To describe differences in petal colour, we calculated four colour indices: anthocyanin content-chroma ratio (ACCR), anthocyanin content-chroma basic (ACCB), the red:green ratio (R:GR), and the strength of green (Sgreen). As all indices were highly correlated between them (r > 0.9 in all cases, n = 103), for describing petal colour we show only results using the red:green ratio, which also had the best coefficient of determination when regressed with the relative petal anthocyanin concentration determined by spectrophotochemical methods (r2 = 0.83, P < 0.001, n = 101; Del Valle et al., 2018). Specifically, we used regression to estimate anthocyanin concentration in petals (hereafter, “petal anthocyanin concentration”) in terms of the red:green ratio. In addition, we estimated the plant-level allocation to petal anthocyanins (hereafter, “total petal anthocyanins per plant”) by multiplying “petal anthocyanin concentration” with the total number of flowers per plant. To account for size differences between flowers and plants, “petal anthocyanin concentration” was scaled by petal area and expressed as absorbance units (AU) cm–2, whereas “total petal anthocyanins per plant” was scaled by above-ground plant biomass, and expressed as AU g–1.
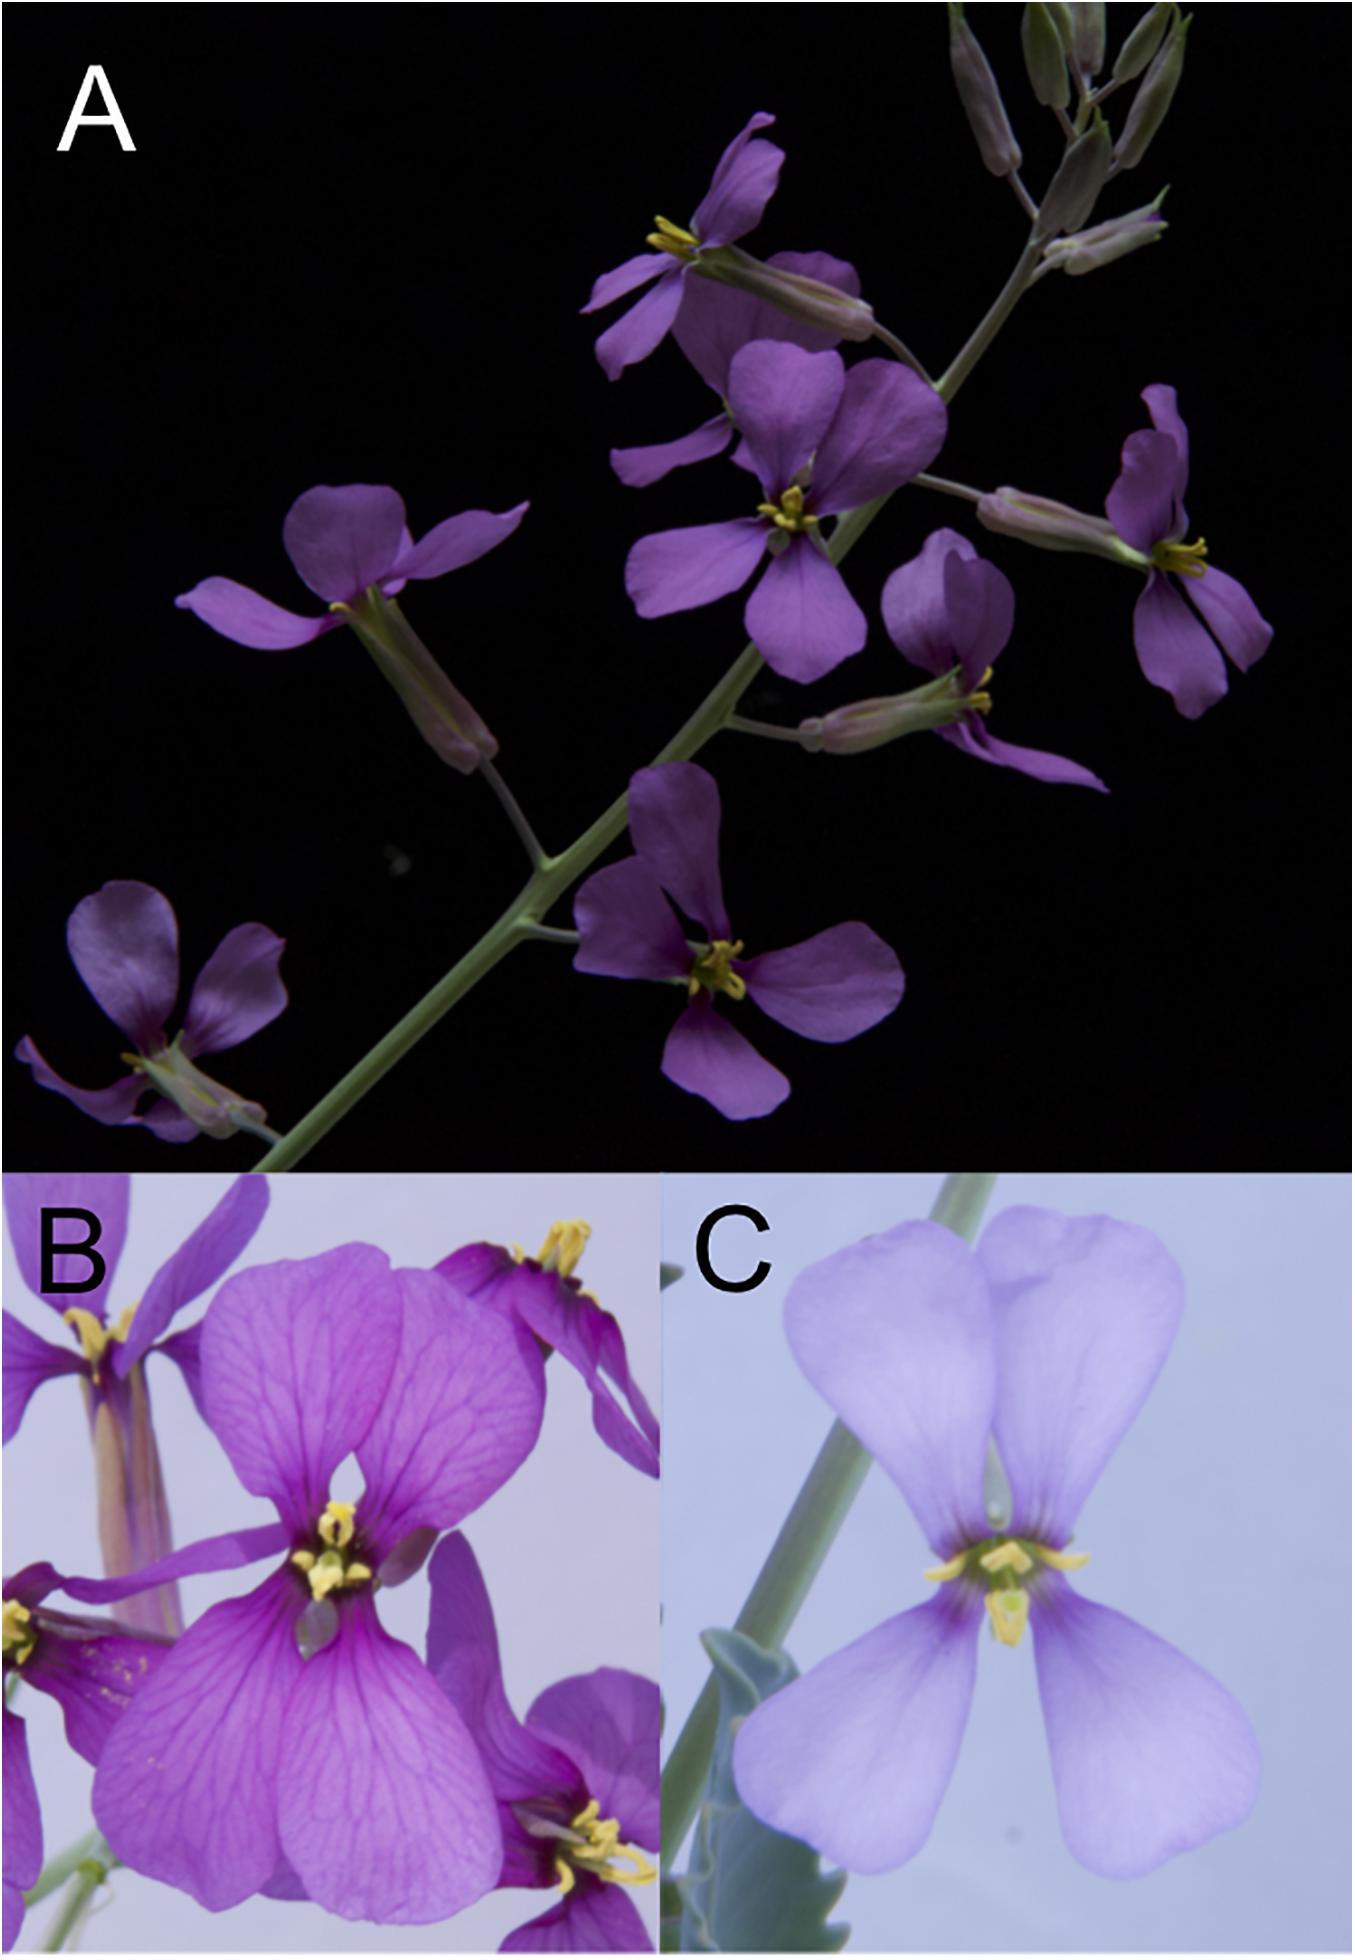
Figure 1. The floral display of Moricandia moricandiodes (A). (B,C) show sampled flowers with contrasting petal colours.
Digital images were obtained with a Nikon D90 camera (Nikon, Japan) equipped with a 105 mm autofocus lens. This camera has a 23.6 × 15.8 mm sensor (4,288 × 2,848 pixels). Following instructions in Troscianko and Stevens (2015), we manually adjusted these settings for all samples: lens aperture of f18, ISO 200, white balance fixed at 4500k, and shutter speed of 1/30. Photographs were underexposed by +1.7 to prevent colour “clipping” or saturation (Stevens et al., 2007). Images were captured in the Nikon raw format (NEF). Each flower sampled was photographed with a ColorChecker Passport card (X-Rite Inc., Grand Rapids, MI, United States) for standardisation across light conditions. Photographs were taken under natural light conditions in the glasshouse, with plants placed in shade to prevent excessive contrast and brightness (Kendal et al., 2013).
We calibrated digital photographs (Stevens et al., 2007; Akkaynak et al., 2014) using the freeware “Image Calibration and Analysis Toolbox” (Troscianko and Stevens, 2015) for ImageJ software (Schneider et al., 2012). Calibrations were performed by selecting two grey standards of the ColorChecker (Neutral 3.5 and Neutral 8, with 9.11 and 60.90% reflectance, respectively), and used the setting for “visible” photography and “aligned normalised 32-bit” files; calibrations performed using these two grey standards produce statistically similar results when compared with calibrations with all six grey standards (Del Valle et al., 2018). The calibration process successfully linearised the RGB values. The four petals of one flower were selected in each image and the mean values of the RGB channels were extracted.
Nectar Collection and Quantification
We estimated the amount of nectar of at least four flowers per focal plant from which potential flower visitors had been excluded. We sampled nectar production on the second day of flowering because our preliminary measurements indicated that, under our experimental conditions, nectar production increased progressively during a flower’s lifespan, peaking on the day just before its wilting. After nectar extraction with 2 μL microcapilars (Drummond Scientific Co., Broomall, PA, United States), nectar sugar concentration (g sucrose per 100 g solution) was quantified in situ by means of a hand-refractometer modified for small volumes (Bellingham & Stanley Ltd., Tunbridge Wells, Untied Kingdom). Nectar sugar content per flower (mg) was calculated as dvC/100, where v is the volume calculated (μL) and d is the density of a sucrose solution at a concentration C, as read on the refractometer (Prys-Jones and Corbet, 1991). The density was obtained from Prys-Jones and Corbet (1991) as d = 0.0000178C2 + 0.0037921C + 0.9988603. We estimated the mean flower production of nectar for each individual plant, taking into account the relative position of the sampled flowers within their inflorescence. We thus fitted a linear model that included the relative position of each flower and the focal plant identity. We later extracted from the model marginal means of nectar production for each focal plant.
Statistical Analyses
We fitted linear mixed models (LMMs) to assess the effect of experimental neighbourhoods on petal colour and anthocyanin allocation to petals, as well as to assess the relationship between reward and flower signalling. First, we assessed the effect of relatedness and group size, including its interaction in an analysis in which all focal plants growing in groups were included (excluding consequently the solitary treatment). Here, we fitted models for red:green ratio (hereafter, petal colour), petal anthocyanin concentration and total petal anthocyanin per plant, with the maternal family of the focal plant included as a random blocking factor. We included in the models the advertising effort as the proportion of aboveground plant biomass allocated to petals (see Torices et al., 2018) to control simultaneously for the potential cofounding effects of plant size, number of flowers, and petal mass. All response variables were modelled assuming a Normal distribution; we verified that the distribution of residuals distributions were not patterned (Zuur et al., 2010). Petal anthocyanin concentration was log-transformed before fitting the model. Interactions were assessed using type-III tests; where these were not significant, main effects were subsequently assessed by type-II tests.
Second, we assessed the effect of experimental neighbours on petal colour. We followed the same approach as above. We fitted a LMM for each response, though in this case we included solitary plants and thus had five different treatment levels (solitary, neighbourhood of three kin, neighbourhood of six kin, neighbourhood of three non-kin, and neighbourhood of six non-kin). In these analyses, we fitted an additional model including the relative floral display (number of flowers divided by aboveground biomass) as an additional response variable to explore whether the differences between treatments in total petal anthocyanins per plant were affected by differences in the number of flowers per plant.
To assess the relationship between reward and petal colour, we fitted LMMs in which nectar volume, sugar concentration and sugar content were modelled against all the main components of the floral display: petal colour, petal mass, and flower number in separate models. Petal colour was scaled by corolla size by multiplying the red:green ratio with corolla diameter. As described above, we fitted two complementary sets of LMMs. First, we excluded solitary plants to assess the effect of the relatedness of neighbours on the relationship between nectar production and floral signalling components. The three flower-signalling components (petal colour, petal mass, and flower number) and their interactions with group size were included as explanatory variables, with maternal family of the focal plant included as a random blocking factor. Previously we checked that the triple interaction (petal colour × group size × relatedness) was non-significant and could thus be excluded to avoid over-parameterisation. We also excluded group size and its interaction with relatedness, as none had significant effects and models without them showed a better goodness of fit than with them (results not shown).
Second, we included solitary plants to assess the effect of group size on the relationship between flower signalling traits and nectar production, and consequently the effect of neighbour relatedness on the focal plant was not tested. As above, the three flower-signalling components and, in this case, their interaction with neighbourhood size, were included as explanatory variables, with maternal family of the focal plant included as random factor.
All analyses were conducted in R version 3.5.2. (R Core Team, 2018), using the “lme4” package (Bates et al., 2015); type-II and type-III effects were assessed with the “car” package (Fox and Weisberg, 2019). Statistical differences between treatment levels were assessed by least-square mean differences, using the package “emmeans” (Lenth, 2020). P-values for post hoc comparisons were corrected using Holm’s adjustment. All analyses were based on measurements of focal plants in which all individuals in the pot had survived for the whole experiment. We excluded from our analysis all three- and six-neighbour groups in which at least one and two neighbouring plants failed to flower, respectively.
Results
Effects of Neighbour Relatedness on Petal Colour and Anthocyanin Allocation to Petals
Our experimental plants showed variation in petal colour intensity (Figure 1); the coefficient of variation for the four colour indices ranged from 7.12 to 12.37. Because of the differences in flower size, this petal colour variation was lower than variation in petal anthocyanin concentration per flower (CV = 30.88).
Neighbour relatedness did not significantly affect petal colour or anthocyanin concentration (Table 1 and Figures 2A,B). Although plants growing with kin produced petals similar in colour to those growing with non-kin, the investment in petal anthocyanin pigments was significantly greater than that of plants growing with non-kin or growing alone (Table 1 and Figure 2D). This kinship effect was mostly the result of a higher relative flower production of plants growing among kin (Figure 2C) and not a consequence of large differences in petal colour (Figure 2A). Petal colour and anthocyanin concentration did not significantly vary with neighbourhood size, although petals of plants in large groups tended to have a lighter purple colour and lower anthocyanin concentration than petals of plants growing in small groups (Table 1 and Figures 2A,B). Regardless of the neighbourhood configuration, plants allocating a higher proportion of aboveground biomass to petals displayed significantly darker petals and had a higher concentration of anthocyanin pigments (Table 1).
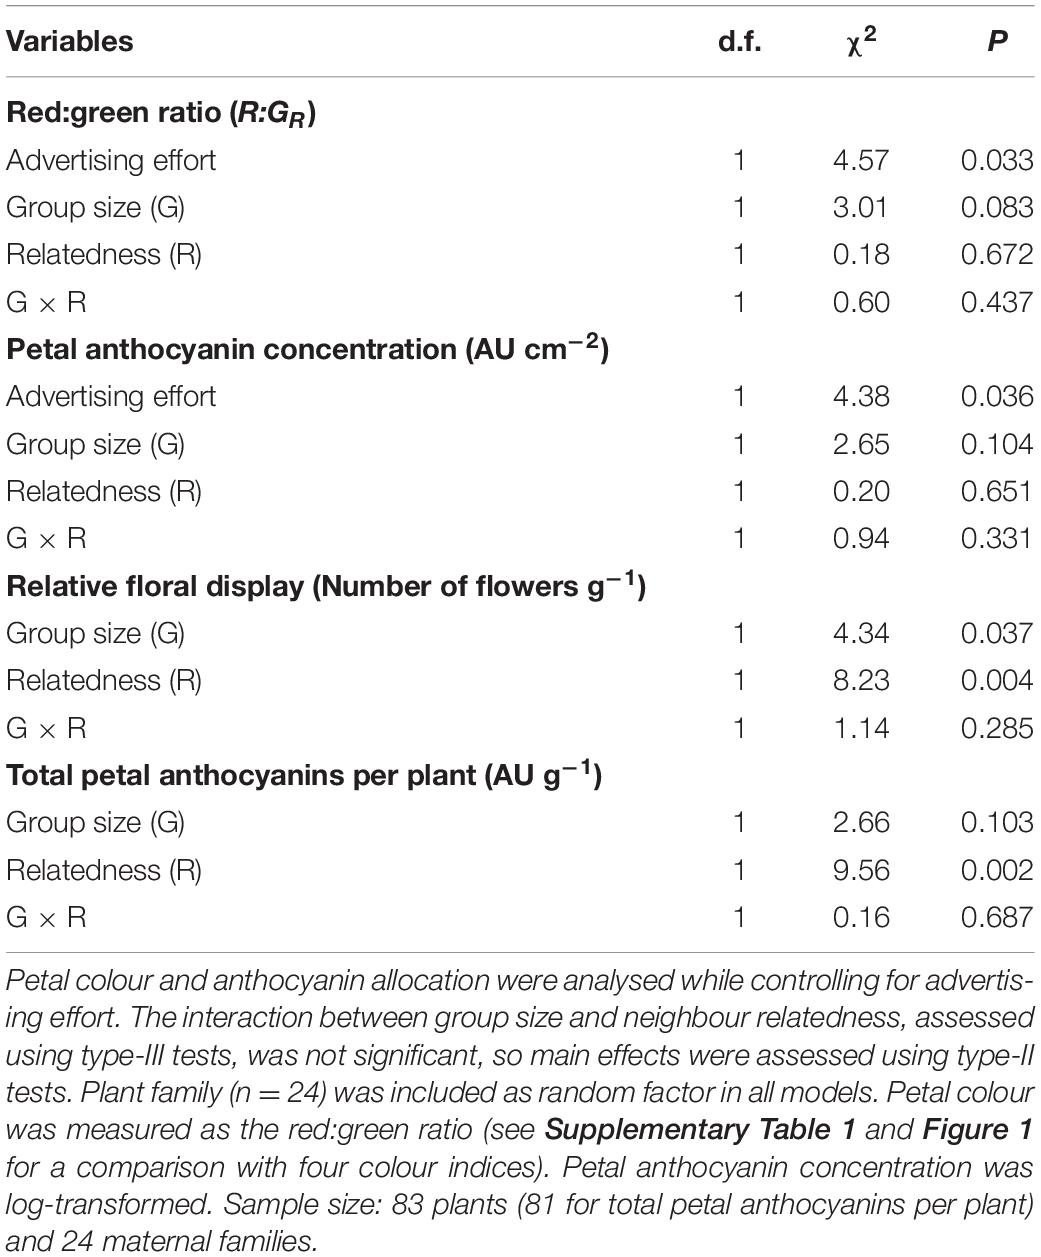
Table 1. Effects of group size and neighbour relatedness on the petal colour and anthocyanin allocation of focal plants and relative floral display.
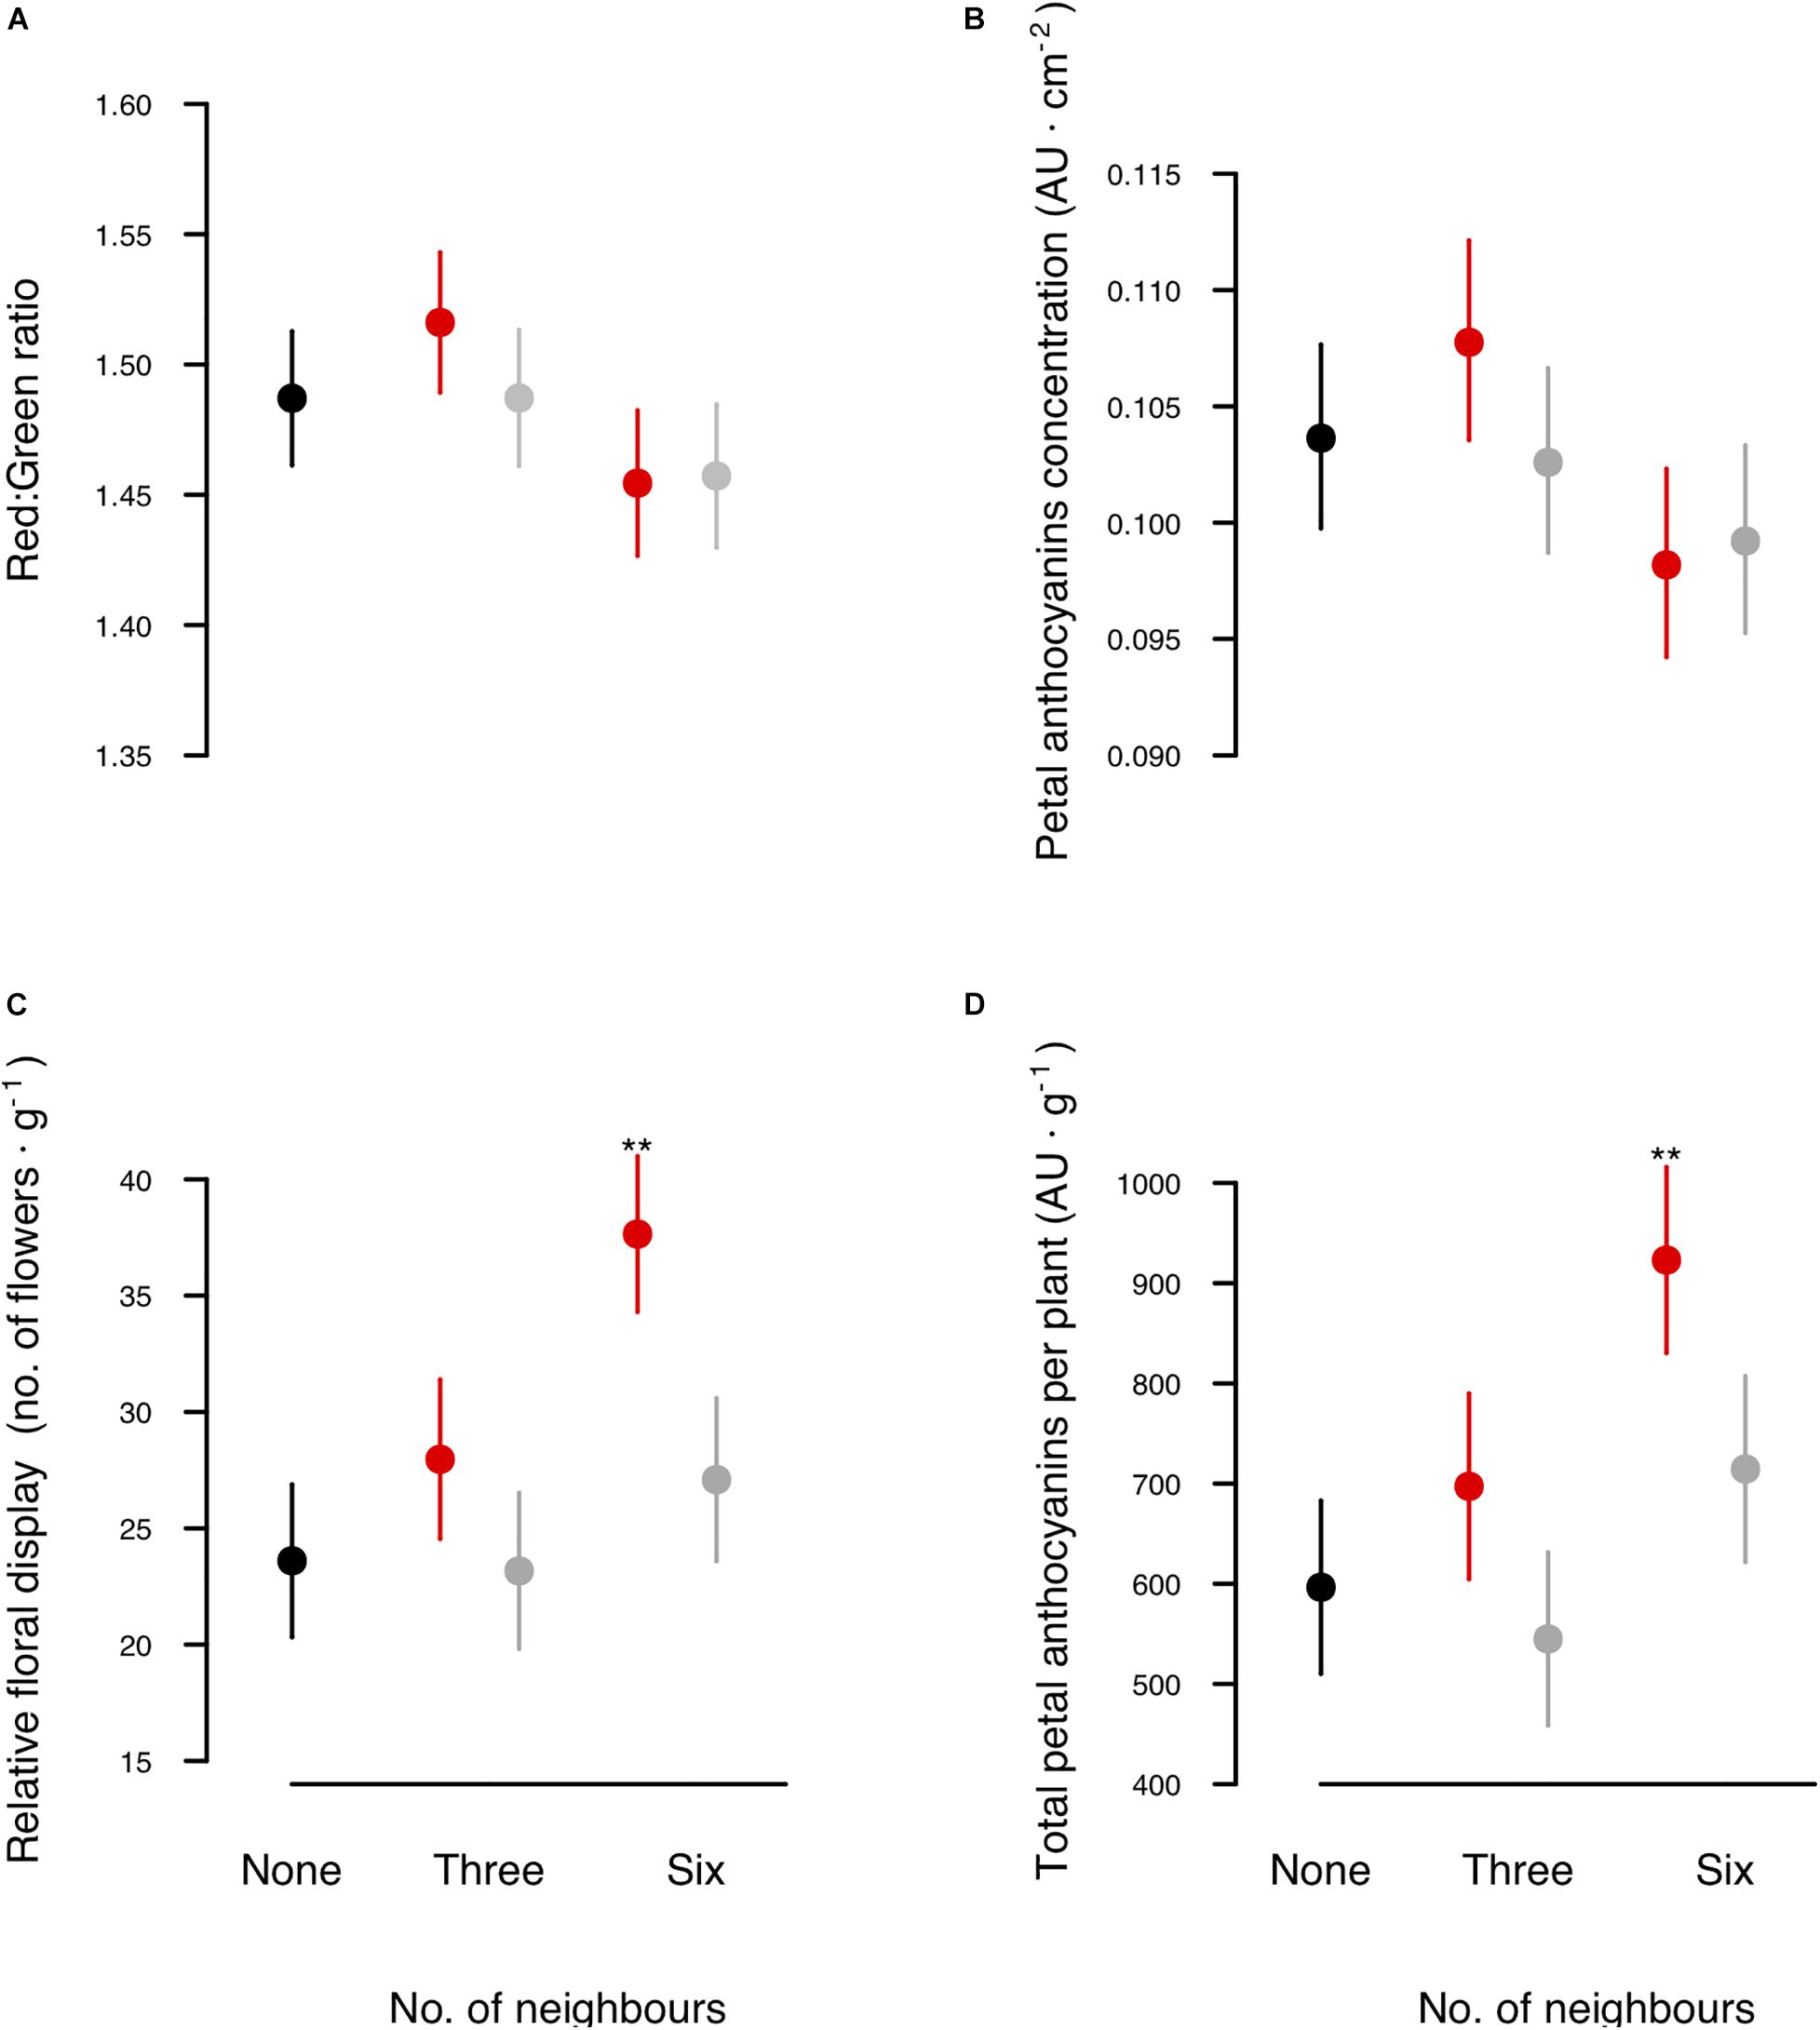
Figure 2. Effect of the relatedness of neighbours on floral colour and anthocyanin allocation. Shown are least-square means (±SEM) of (A) red:green ratio; (B) petal anthocyanin concentration (AU cm–2); (C) individual relative floral display (number of flowers g–1); and (D) total petal anthocyanins per plant (AU g–1). Focal plants were grown either alone (black dots), with three neighbours, or with six neighbours, which were either kin (red dots) or non-kin (grey dots). Asterisks above dots highlight significant differences against control plants without neighbours (post hoc comparison of LMM analysis, P < 0.01, Supplementary Table 2).
Effects of Neighbour Relatedness on the Relationship Between Flower Signalling and Reward
The relationship between nectar production and flower-signalling traits depended on the relatedness of neighbours (Table 2). Specifically, the relationship between nectar production and both size-scaled petal colour and flower number was shaped by the relatedness of neighbours in opposite ways. First, the interaction between size-scaled petal colour and the relatedness of neighbours had a significant effect on nectar volume and sugar content (Table 2). Both nectar volume and sugar content increased with size-scaled petal colour when growing with non-kin but not when growing with kin (Figures 3A–C). This pattern persisted even when petal colour was not scaled by corolla diameter, although the effect of the interaction with relatedness on nectar volume became marginally significant (Supplementary Figure 2 and Supplementary Table 3). Second, the interaction between flower number and the relatedness of neighbours also had a significant effect on nectar volume and sugar content (Table 2). In contrast to petal colour, nectar volume, and sugar content increased with the number of flowers when focal plants were growing with kin, but not with non-kin (Figures 3D–F). Lastly, neither nectar traits were correlated with petal mass when focal plants were growing with neighbours (Table 2), nor there was any effect of the genetic relatedness of neighbours on the relationship between nectar traits and petal mass (Figures 3G–I).
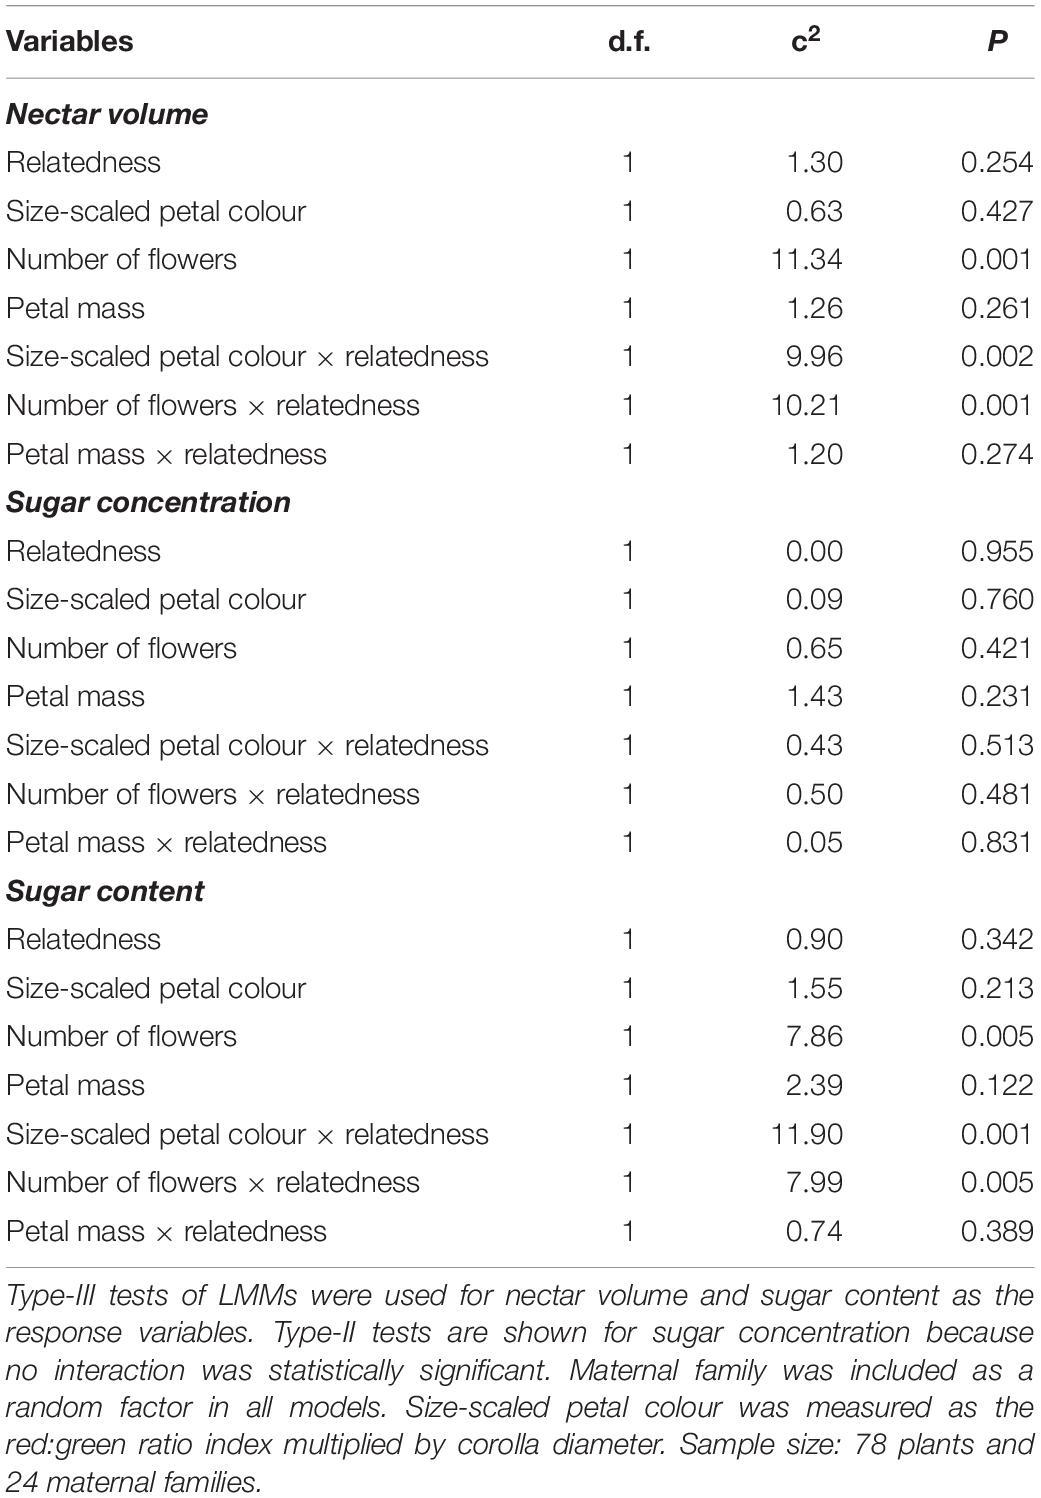
Table 2. Effects of relatedness of the neighbouring plants on the relationship between flower signalling and reward.
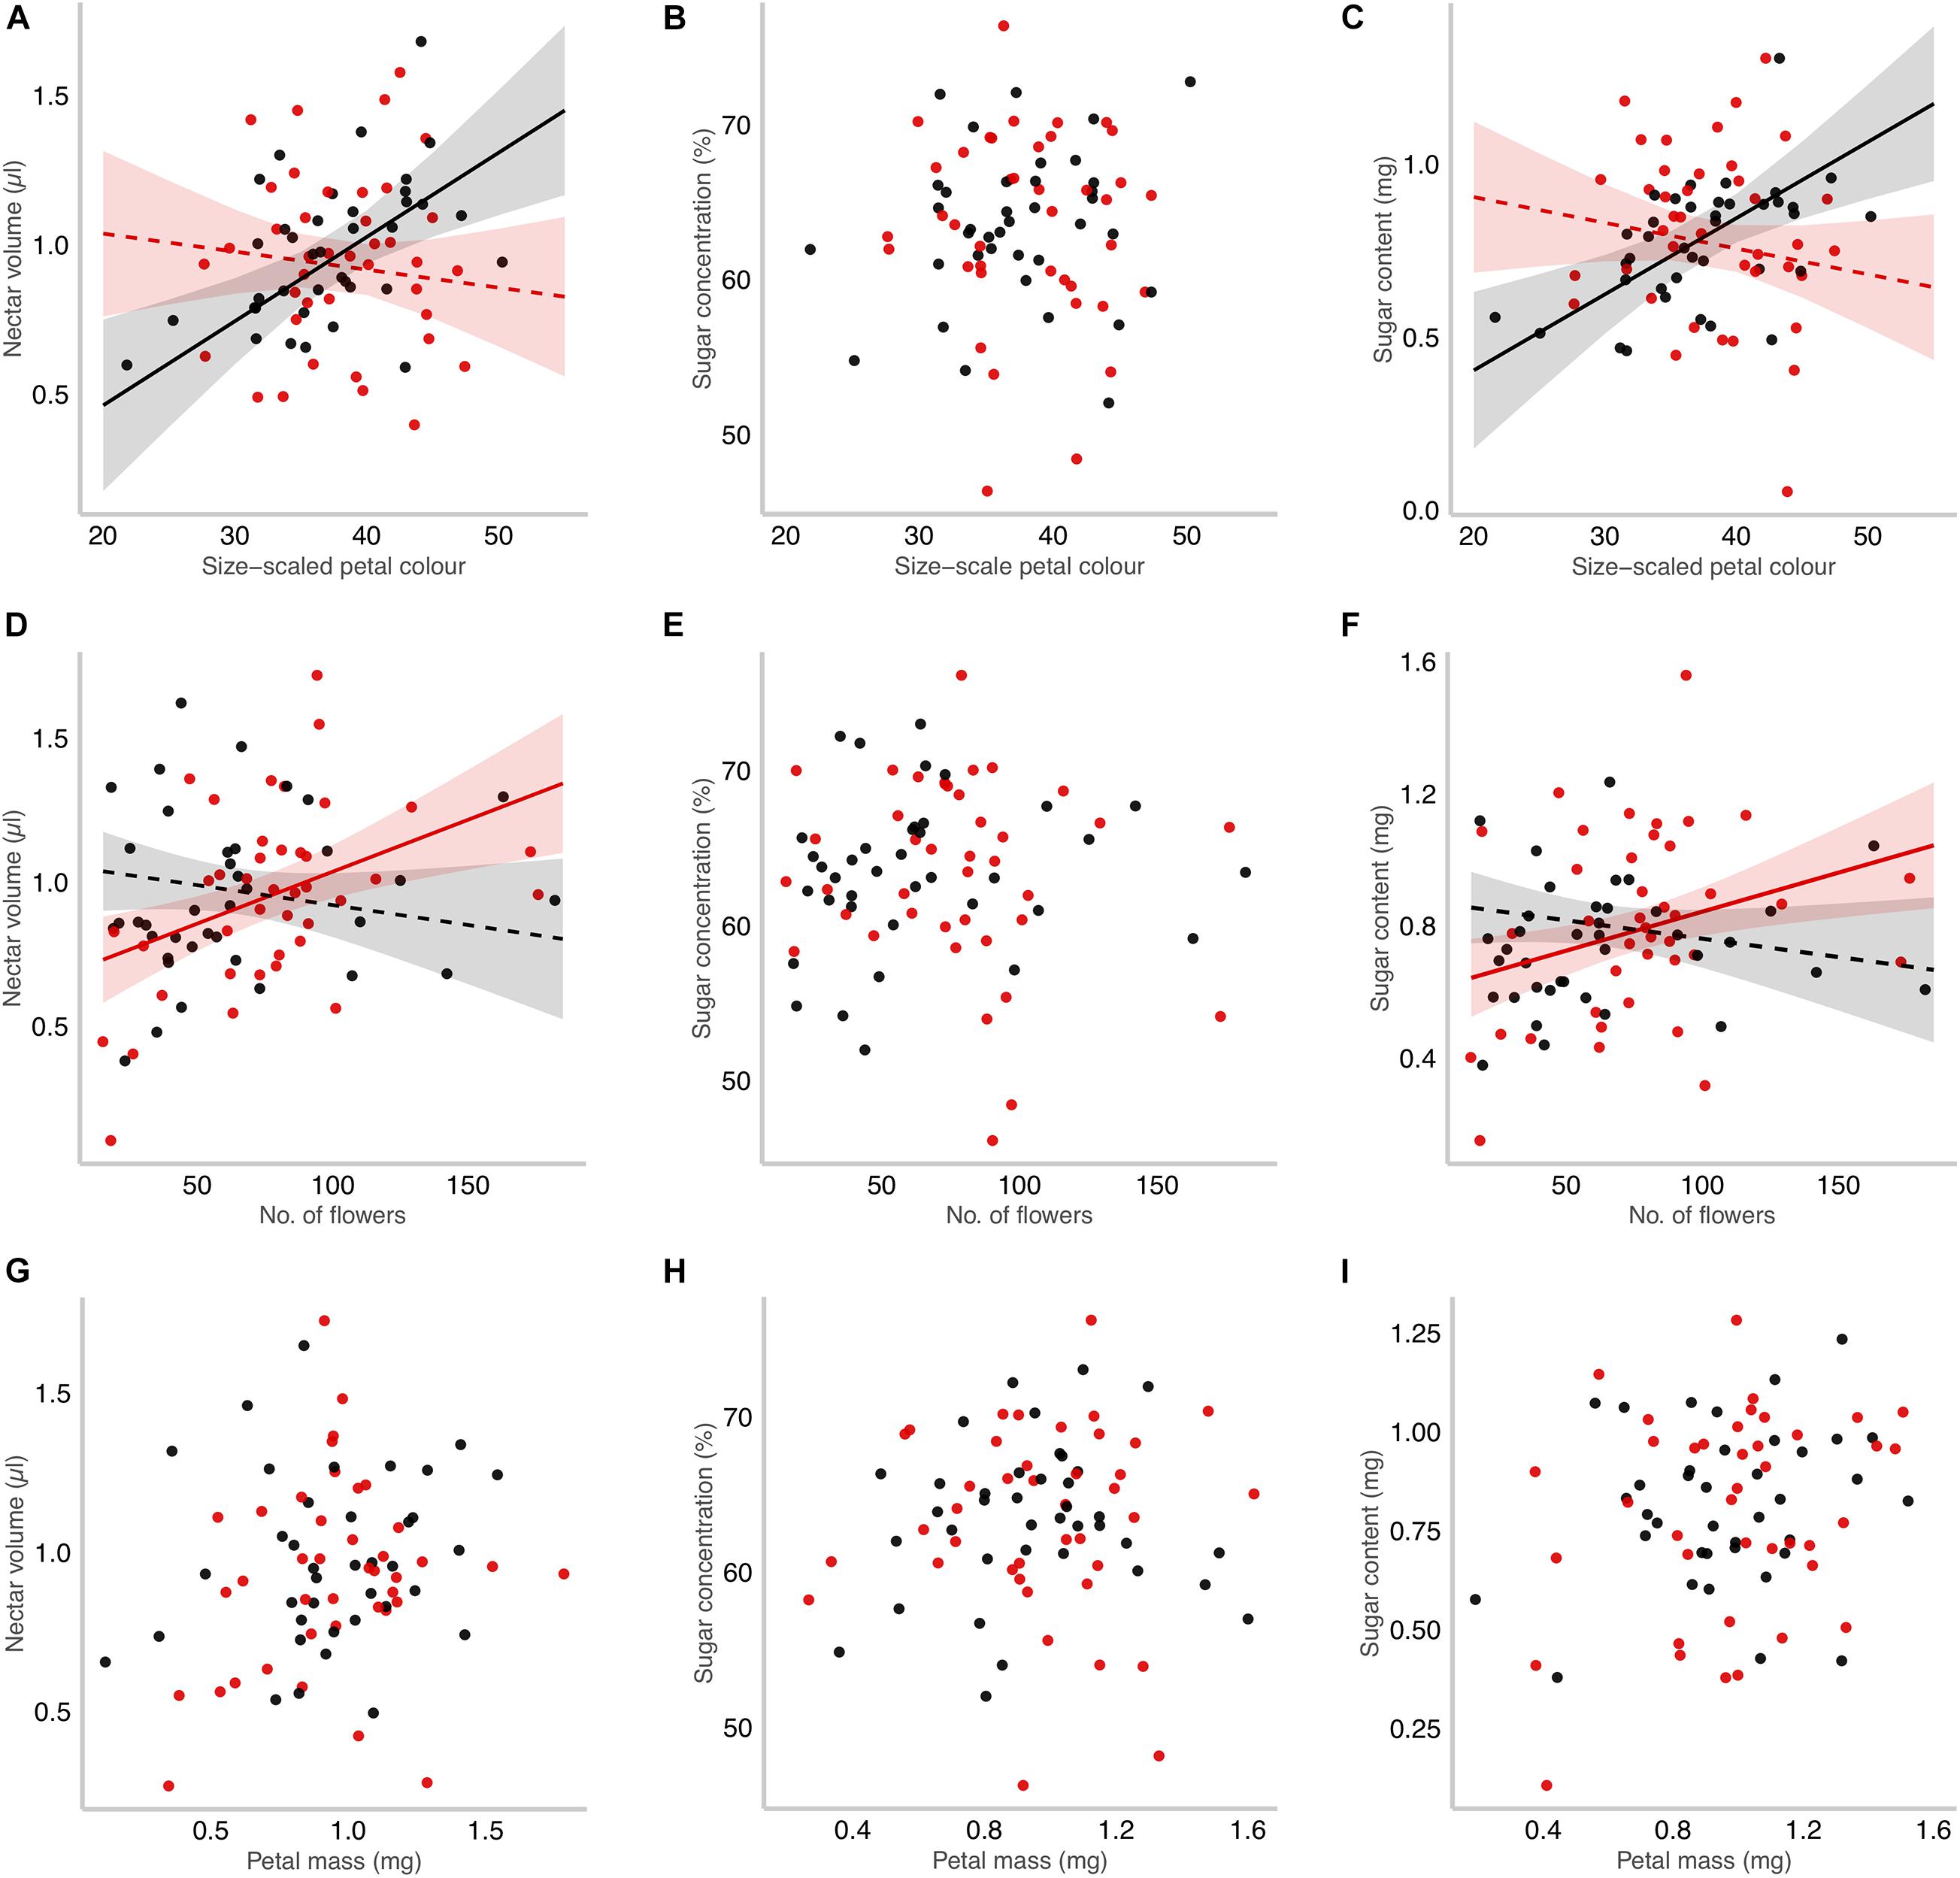
Figure 3. Kinship effects on the floral signalling and reward relationship in Moricandia moricandioides. The floral signalling was characterised by three components: size-scaled petal colour measured as the red:green ratio index, and then multiplied by corolla size measured as corolla diameter (A–C), flower number (D–F), and petal mass (G–I). Reward was quantified as nectar volume (A,D,G), sugar concentration (B,E,H), and nectar sugar content (C,F,I). Slopes from LMM analyses and 95% confidence intervals are shown when the interaction between each floral signalling trait and neighbourhood relatedness were significant (Table 2). Slopes significantly different from zero are also indicated with solid lines. Focal plants were grown with kin (red dots and line) or with non-kin neighbours (grey dots and line).
Group size did not affect the relationship between flower signalling and reward traits (Supplementary Table 4). Only the interaction between petal mass and group size was marginally significant for nectar sugar content (Supplementary Table 4 and Supplementary Figure 3).
Discussion
Our results are consistent with the importance of the intraspecific neighbourhood environment on the relationship between floral signalling and reward. Although manipulation of neighbour relatedness in M. moricandioides did not elicit any changes in petal colour, it mediated the relationship between petal colour and nectar production. Specifically, plants growing with non-kin showed a stronger positive relationship between petal colour intensity and nectar volume and sugar content, with plants producing darker-coloured petals also producing more nectar with a higher total sugar content (as sugar concentration did not change). Conversely, when growing with kin, plants producing darker petals did not increase either nectar volume nor sugar content, though they increased nectar volume and sugar content with increases in flower number. Below, we consider the implications of these plant responses to neighbour density and identity for pollinator behaviour, and its possible consequences on direct and indirect components on plant fitness.
Our study suggests that the honesty of floral signals might depend on the relatedness of the neighbours. Petal colour was an honest signal, with the intensity of the signal being positively correlated with the reward, yet only for plants growing with non-kin: plants with darker-coloured flowers also provisioned them with higher rewards, whereas plants growing with kin did not adjust petal colour intensity to reward. Modelling has shown that under increasing flower density, flower choice by pollinators becomes more important than flower detection (Cohen and Shmida, 1993), so that, once a dense patch of flowers is detected, distinguishing and remembering the reward obtained from different plants within the patch should be more efficient if flowers of individual plants are clearly identifiable (Ne’eman and Kevan, 2001). Because some pollinators, e.g., bumble bees, can learn the exact location of flowers even at very small scales (Thomson, 1988; Wertlen et al., 2008), we should expect floral signals to correlate with nectar production under higher density conditions – assuming that competitive interactions favour honest signalling, thereby fostering better learning by pollinators and the discrimination and re-visitation of attractive rewarding flowers. Thus, our results suggest that when closely surrounded by other displaying competitors, highly rewarding flowers should be advertised with stronger floral signals to render them more easily remembered by visitors.
Yet in our experiment focal plants growing with kin did not fit this prediction. As the accuracy of floral signals should have positive effects on individual plant fitness (Benitez-Vieyra et al., 2010), it is difficult to explain our result without assessing the potential effects of this signalling strategy in the whole group. In particular, this disagreement might indicate that plants growing with kin benefit less from monopolising pollinators than from sharing pollinators with their neighbours. As pollinators can only detect deceitful advertising after visiting and probing a flower, we expect bout lengths to decrease at the individual level (Cresswell, 1990), which might favour pollinator movement to other individuals in the patch, eventually reducing inequality in pollinator visitation among group members. Although the expected decline in bout length could reduce the fitness cost of pollen discounting and geitonogamy (Klinkhamer and de Jong, 1993), it could also increase negative effects of biparental inbreeding if it leads to higher intra-patch matings between relatives (Cresswell and Osborne, 2004). Certainly it seems plausible, but needs to be shown, that the observed plastic responses to neighbour relatedness could affect plant fitness, and could thus be a target of kin selection.
The reverse pattern observed between individual flower number and nectar production might be a consequence of different effects on pollinator behaviour of this signal compared to petal colour. In contrast to petal colour, nectar production increased with flower number when focal plants were growing with kin neighbours, but not when growing with non-kin. Although both petal colour and flower number may affect pollinator decisions, they could do it in different ways. For instance, the number of flowers is usually more important for long-distance pollinator detection, resulting in a higher frequency of pollinator approaches to the patch (Ohashi and Yahara, 2001; Bauer et al., 2017). This behaviour has been observed in a field experiment with the congeneric species Moricandia arvensis (Torices et al., in preparation). In this experiment, more insects approached patches with a higher number of flowers per plant, and visited more plants – although the visitation rate per flower was lower than in groups with fewer flowers per plant. We speculate that an increase in individual flower number might favour group attractiveness by increasing the probability of pollinator approach to the group and the number of plants visited within the group, whereas increasing petal colour intensity might favour only each flower by increasing the probabilities of pollinator choice and thus contributing to competition for pollinator visits within the group.
Despite the small petal colour differences, plants growing with kin made a significantly higher investment in total petal anthocyanin pigments as a result of the greater number and larger size of their flowers. However, whether this greater investment was costly is not clear. Certainly, there does not seem to have been a direct trade-off between display size and petal pigmentation, as plants with larger floral displays did not reduce the concentration of their floral pigments. Although petal thickness and the anatomical structure of petal surface and interior layers can also significantly contribute to petal reflectance spectra, petal colouration is mostly pigmentary (Moyroud and Glover, 2017; van der Kooi et al., 2019). Thus, producing a colourful detectable flower requires the allocation of resources to floral parts to produce pigments. While some authors postulate that pigment production, specifically anthocyanins, can be expensive due to associated costs of some metabolic reactions such as glycosylation or acetylation (Chalker-Scott, 2002; Steyn et al., 2002), others have argued that the cost might in fact be low (Tanaka et al., 2008). It is also worth noting that anthocyanins provide colouration even at very low concentrations (van der Kooi et al., 2019; Narbona, unpublished data), and that this colouration is conspicuous to pollinators and can affect their behaviour (Papiorek et al., 2013) or even the attraction to certain groups (Gómez et al., 2020). Even if the direct cost of producing floral pigment is low, the production of more greatly coloured flowers might incur an additional indirect cost of higher herbivory damage if it is associated with easier detection by herbivores (Strauss and Whittall, 2006). Conversely, this increase in floral anthocyanins may have direct consequences on plant fitness due to its deterrent properties against florivorous insects (Johnson et al., 2008). It thus remains an open question whether the higher pigment production of focal plants growing with kin implies a trade-off with other reproductive or vegetative plant functions, or whether it reflects more efficient resource use by kin compared to non-kin groups.
Conclusion
In conclusion, our study has shown that although the petal colour of M. moricandioides’ individuals was not affected by the neighbourhood context, the reward associated to this floral signal did depend on the relatedness of their neighbours. As floral signals and rewards may influence pollinator visitation behaviour and consequently plant fitness of focal and neighbouring plants in subtle and intricate ways, our study opens a new perspective that may help to disentangle the complexity of plant-pollinator interactions. Furthermore, other floral signals, such as floral scents, might also be sensitive to the genetic composition of the local neighbourhood; this possibility deserves investigation. Certainly, our study indicates that the relationship between signal and reward in animal-pollinated plants can depend on the relatedness of the neighbours, and thus that kin selection could play an important role in floral trait evolution, at least for plants with patchy and genetically structured populations.
Data Availability Statement
The raw data supporting the conclusions of this article are available at ZENODO: http://doi.org/10.5281/zenodo.4663298.
Author Contributions
RT co-designed the experiments, collected and analysed the data, and wrote the first draft. JG and JP co-designed the experiments and provided critical input and edits to the manuscript. LD and EN collected and analysed the data and provided critical input and edits to the manuscript. All authors contributed to the article and approved the submitted version.
Funding
This work was part of a project that has received funding from the European Union’s Horizon 2020 Research and Innovation Programme under the Marie Skłodowska-Curie Grant Agreement No. 655653 and from Fundación BBVA (PR17-ECO-0021) and the Spanish Ministerio de Economia y Competitividad (CGL2017-86626-C2-1-P). Additional funding was provided by grant 31003A_163384 to JP from the Swiss National Science Foundation.
Conflict of Interest
The authors declare that the research was conducted in the absence of any commercial or financial relationships that could be construed as a potential conflict of interest.
Acknowledgments
We thank Sarah Beuvier, Yves Cuenot, Adela González-Megías, Félix Gréverath, Ana Machado, and Nicolas Ruch for assistance with seed collection, plant growing and data collection. We also thank Casper Van de Kooi for preliminary spectral reflectance exploration of petals and M. Méndez for discussion on the cost of pigment allocation to petals.
Supplementary Material
The Supplementary Material for this article can be found online at: https://www.frontiersin.org/articles/10.3389/fevo.2021.589781/full#supplementary-material
References
Akkaynak, D., Treibitz, T., Xiao, B., Gürkan, U. A., Allen, J. J., Demirci, U., et al. (2014). Use of commercial off-the-shelf digital cameras for scientific data acquisition and scene-specific color calibration. J. Opt. Soc. Am. 31, 312–321. doi: 10.1364/JOSAA.31.000312
Antonovics, J., and Levin, D. A. (1980). The ecological and genetic consequences of density-dependent regulament. Annu. Rev. Ecol. Syst. 11, 411–452.
Archetti, M. (2009). Decoupling vigour and quality in the autumn colours game: weak individuals can signal, cheating can pay. J. Theor. Biol. 256, 479–484. doi: 10.1016/j.jtbi.2008.10.012
Avarguès-Weber, A., d’Amaro, D., Metzler, M., and Dyer, A. G. (2014). Conceptualization of relative size by honeybees. Front. Behav. Neurosci. 8:80. doi: 10.3389/fnbeh.2014.00080
Bartkowska, M. P., and Johnston, M. O. (2014). The sexual neighborhood through time: competition and facilitation for pollination in Lobelia cardinalis. Ecology 95, 910–919.
Bates, D., Mächler, M., Bolker, B., and Walker, S. (2015). Fitting linear mixed-effects models using lme4. J. Stat. Softw. 67, 1–48.
Bauer, A. A., Clayton, M. K., and Brunet, J. (2017). Floral traits influencing plant attractiveness to three bee species: consequences for plant reproductive success. Am. J. Bot. 104, 772–781. doi: 10.3732/ajb.1600405
Belsare, P. V., Sriram, B., and Watve, M. G. (2009). The co-optimization of floral display and nectar reward. J. Biosci. 34, 963–967.
Benitez-Vieyra, S., Fornoni, J., Pérez-Alquicira, J., Boege, K., and Dominguez, C. A. (2014). The evolution of signal–reward correlations in bee-and hummingbird-pollinated species of Salvia. Proc. Royal Soc. B: Biol. Sci. 281:20132934. doi: 10.1098/rspb.2013.2934
Benitez-Vieyra, S., Ordano, M., Fornoni, J., Boege, K., and Domínguez, C. A. (2010). Selection on signal-reward correlation: limits and opportunities to the evolution of deceit in Turnera ulmifolia L. J. Evol. Biol. 23, 2760–2767. doi: 10.1111/j.1420-9101.2010.02132.x
Caruso, C. M., Eisen, K. E., Martin, R. A., and Sletvold, N. (2019). A meta-analysis of the agents of selection on floral traits. Evolution 73, 4–14. doi: 10.1111/evo.13639
Caruso, C. M., Scott, S. L., Wray, J. C., and Walsh, C. A. (2010). Pollinators, herbivores, and the maintenance of flower color variation: A case study with Lobelia siphilitica. Int. J. Plant Sci. 171, 1020–1028. doi: 10.1086/656511
Chalker-Scott, L. (2002). Do anthocyanins function as osmoregulators in leaf tissues? Adv. Bot. Res. 37, 104–129.
Chen, B. J. W., During, H. J., and Anten, N. P. R. (2012). Detect thy neighbor: identity recognition at the root level in plants. Plant Sci. 195, 157–167. doi: 10.1016/j.plantsci.2012.07.006
Cohen, D., and Shmida, A. (1993). The evolution of flower display and reward. Evol. Biol. 27, 197–243.
Cresswell, J. E. (1990). How and why do nectar-foraging bumblebees initiate movements between inflorescences of wild bergamot Monarda fistulosa (Lamiaceae)? Oecologia 82, 450–460.
Cresswell, J. E., and Osborne, J. L. (2004). The effect of patch size and separation on bumblebee foraging in oilseed rape: implications for gene flow. J. Appl. Ecol. 41, 539–546. doi: 10.1111/j.0021-8901.2004.00912.x
de Ibarra, N. H., Langridge, K. V., and Vorobyev, M. (2015). More than colour attraction: behavioural functions of flower patterns. Curr. Opin. Insect Sci. 12, 64–70. doi: 10.1016/j.cois.2015.09.005
Del Valle, J. C., Alcalde-Eon, C., Escribano-Bailón, M. T., Buide, M. L., Whittall, J. B., and Narbona, E. (2019). Stability of petal color polymorphism: the significance of anthocyanin accumulation in photosynthetic tissues. BMC Plant Biol. 19:496. doi: 10.1186/s12870-019-2082-6
Del Valle, J. C., Gallardo-López, A., Buide, M. L., Whittall, J. B., and Narbona, E. (2018). Digital photography provides a fast, reliable, and noninvasive method to estimate anthocyanin pigment concentration in reproductive and vegetative plant tissues. Ecol. Evol. 8, 3064–3076. doi: 10.1002/ece3.3804
Dötterl, S., Glück, U., Jürgens, A., Woodring, J., and Aas, G. (2014). Floral reward, advertisement and attractiveness to honey bees in dioecious Salix caprea. PLoS One 9:e0093421. doi: 10.1371/journal.pone.0093421
Fattorini, R., and Glover, B. J. (2020). Molecular mechanisms of pollination biology. Ann. Rev. Plant Biol. 71, 487–515. doi: 10.1146/annurev-arplant-081519-040003
Fox, J., and Weisberg, S. (2019). An R Companion to Applied Regression, 3rd Edn. Thousand Oaks, CA: Sage.
Gagliano, M., Renton, M., Duvdevani, N., Timmins, M., and Mancuso, S. (2012). Out of sight but not out of mind: alternative means of communication in plants. PLoS One 7:e37382. doi: 10.1371/journal.pone.0037382
Gómez, J. M. (1996). Predispersal reproductive ecology of an arid land crucifer, Moricandia moricandioides: effect of mammal herbivory on seed production. J. Arid Environ. 33, 425–437. doi: 10.1006/jare.1996.0078
Gómez, J. M., Perfectti, F., Armas, C., Narbona, E., González-Megías, A., Navarro, L., et al. (2020). Within-individual phenotypic plasticity in flowers fosters pollination niche shift. Nat. Commun. 11:4019. doi: 10.1038/s41467-020-17875-1
Gómez, J. M., Torices, R., Lorite, J., Klingenberg, C. P., and Perfectti, F. (2016). The role of pollinators in the evolution of corolla shape variation, disparity and integration in a highly diversified plant family with a conserved floral bauplan. Ann. Bot. 117, 889–904. doi: 10.1093/aob/mcv194
González-Megías, A., and Menéndez, R. (2012). Climate change effects on above- and below-ground interactions in a dryland ecosystem. Philos. Trans. R. Soc. B Biol. Sci. 367, 3115–3124. doi: 10.1098/rstb.2011.0346
Hamilton, W. D. (1964a). The genetical evolution of social behaviour. I. J. Theor. Biol. 7, 1–16. doi: 10.1016/0022-5193(64)90038-4
Hamilton, W. D. (1964b). The genetical evolution of social behaviour. II. J. Theor. Biol. 7, 17–52. doi: 10.1016/0022-5193(64)90039-6
Hegland, S. J. (2014). Floral neighbourhood effects on pollination success in red clover are scale-dependent. Funct. Ecol. 28, 561–568. doi: 10.1111/1365-2435.12223
Heil, M., and Karban, R. (2010). Explaining evolution of plant communication by airborne signals. Trends Ecol. Evol. 25, 137–144. doi: 10.1016/j.tree.2009.09.010
Howard, S. R., Avargues-Weber, A., Garcia, J., and Dyer, A. G. (2017). Free-flying honeybees extrapolate relational size rules to sort successively visited artificial flowers in a realistic foraging situation. Anim. Cogn. 20, 627–638. doi: 10.1007/s10071-017-1086-6
Howard, S. R., Shrestha, M., Schramme, J., Garcia, J. E., Avarguès-Weber, A., Greentree, A. D., et al. (2019). Honeybees prefer novel insect-pollinated flower shapes over bird-pollinated flower shapes. Curr. Zool. 65, 457–465. doi: 10.1093/cz/zoy095
Iritani, R. (2020). Gametophytic competition games among relatives: when does spatial structure select for facilitativeness or competitiveness in pollination? J. Ecol. 108, 1–13. doi: 10.1111/1365-2745.13282
Johnson, E. T., Berhow, M. A., and Dowd, P. F. (2008). Colored and white sectors from star-patterned petunia flowers display differential resistance to corn earworm and cabbage looper larvae. J. Chem. Ecol. 34, 757–765. doi: 10.1007/s10886-008-9444-0
Jones, N. K., and Reithel, J. S. (2001). Pollinator−mediated selection on a flower color polymorphism in experimental populations of Antirrhinum (Scrophulariaceae). Am. J. Bot. 88, 447–454. doi: 10.2307/2657109
Kelber, A., and Osorio, D. (2010). From spectral information to animal colour vision: experiments and concepts. Proc. Royal Soc. B Biol. Sci. 277, 1617–1625. doi: 10.1098/rspb.2009.2118
Kendal, D., Hauser, C. E., Garrard, G. E., Jellinek, S., Giljohann, K. M., and Moore, J. L. (2013). Quantifying plant colour and colour difference as perceived by humans using digital images. PLoS One 8:e72296. doi: 10.1371/journal.pone.0072296
Klinkhamer, P. G. L., and de Jong, T. J. (1993). Attractiveness to pollinators: a plant’s dilemma. Oikos 66, 180–184.
Koethe, S., Fischbach, V., Banysch, S., Reinartz, L., Hrncir, M., and Lunau, K. (2020). A comparative study of food source selection in stingless bees and honeybees: scent marks, location, or color. Front. Plant Sci. 11:516. doi: 10.3389/fpls.2020.00516
Lenth, R. (2020). emmeans: Estimated Marginal Means, aka Least-Squares Means. R package version 1.4.6. Avaliable at: https://CRAN.R-project.org/package=emmeans (accessed March 21, 2021).
Moeller, D. A. (2004). Facilitative interactions among plants via shared pollinators. Ecology 85, 3289–3301. doi: 10.1890/03-0810
Moyroud, E., and Glover, B. J. (2017). The physics of pollinator attraction. New Phytol. 216, 350–354. doi: 10.1111/nph.14312
Ne’eman, G., and Kevan, P. G. (2001). The effect of shape parameters on maximal detection distance of model targets by honeybee workers. J. Comp. Physiol. A 187, 653–660. doi: 10.1007/s003590100237
Ohashi, K., and Yahara, T. (2001). “Behavioral responses of pollinators to variation in floral display size and their influences on the evolution of floral traits,” in Cognitive Ecology of Pollination - Animal Behaviour and Floral Evolution, eds L. Chittka and J. D. Thomson (Cambridge: Cambridge University Press), 274–296.
Ômura, H., and Honda, K. (2005). Priority of color over scent during flower visitation by adult Vanessa indica butterflies. Oecologia 142, 588–596. doi: 10.1007/s00442-004-1761-6
Papiorek, S., Rohde, K., and Lunau, K. (2013). Bees’ subtle colour preferences: how bees respond to small changes in pigment concentration. Naturwissenschaften 100, 633–643.
Peach, K., Liu, J. W., and Mazer, S. J. (2020). Climate predicts UV floral pattern size, anthocyanin concentration, and pollen performance in Clarkia unguiculata. Front. Plant Sci. 11:847. doi: 10.3389/fpls.2020.00847
Pierik, R., Ballaré, C. L., and Dicke, M. (2014). Ecology of plant volatiles: taking a plant community perspective. Plant. Cell Environ. 37, 1845–1853. doi: 10.1111/pce.12330
R Core Team (2018). R: A Language and Environment for Statistical Computing. Vienna: R Foundation for Statistical Computing. Available online at: https://www.R-project.org/.
Schaefer, H. M., and Ruxton, G. (2011). Plant-animal Communication. New York, NY: Oxford University Press.
Schiestl, F. P., and Johnson, S. D. (2013). Pollinator-mediated evolution of floral signals. Trends Ecol. Evol. 28, 307–315. doi: 10.1016/j.tree.2013.01.019
Schneider, C. A., Rasband, W. S., and Eliceiri, K. W. (2012). NIH Image to ImageJ: 25 years of image analysis. Nature Methods 9, 671–675. doi: 10.1038/nmeth.2089
Shang, Y., Venail, J., Mackay, S., Bailey, P. C., Schwinn, K. E., Jameson, P. E., et al. (2011). The molecular basis for venation patterning of pigmentation and its effect on pollinator attraction in flowers of Antirrhinum. New Phytol. 189, 602–615. doi: 10.1111/j.1469-8137.2010.03498.x
Sletvold, N. (2019). The context dependence of pollinator-mediated selection in natural populations. Int. J. Plant Sci. 180, 934–943. doi: 10.1086/705584
Sletvold, N., Trunschke, J., Smit, M., Verbeek, J., and Ågren, J. (2016). Strong pollinator-mediated selection for increased flower brightness and contrast in a deceptive orchid. Evolution. 70, 716–724. doi: 10.1111/evo.12881
Smith, S. D. (2016). Pleiotropy and the evolution of floral integration. New Phytol. 209, 80–85. doi: 10.1111/nph.13583
Stevens, M., Párraga, C. A., Cuthill, I. C., Partridge, J. C., and Troscianko, T. S. (2007). Using digital photography to study animal coloration. Biol. J. Linn. Soc. 90, 211–237. doi: 10.1111/j.1095-8312.2007.00725.x
Stewart, F. J., Kinoshita, M., and Arikawa, K. (2015). The roles of visual parallax and edge attraction in the foraging behaviour of the butterfly Papilio xuthus. J. Exper. Biol. 218, 1725–1732. doi: 10.1242/jeb.115063
Steyn, W. J., Wand, S. J. E., Holcroft, D. M., and Jacobs, G. (2002). Anthocyanins in vegetative tissues: a proposed unified function in photoprotection. New Phytol. 155, 349–361. doi: 10.1046/j.1469-8137.2002.00482.x
Strauss, S. Y., and Whittall, J. B. (2006). “Non-pollinator agents of selection on floral traits,” in Ecology and Evolution of Flowers, eds L. D. Harder and S. C. H. Barret (Oxford: Oxford University Press), 120–138.
Sun, S., Broom, M., Johanis, M., and Rychtáø, J. (2021). A mathematical model of kin selection in floral displays. J. Theor. Biol. 509:110470. doi: 10.1016/j.jtbi.2020.110470
Tanaka, Y., Sasaki, N., and Ohmiya, A. (2008). Biosynthesis of plant pigments: anthocyanins, betalains and carotenoids. Plant J. 54, 733–749. doi: 10.1111/j.1365-313X.2008.03447.x
Tatsuzawa, F., Ito, K., Muraoka, H., Namauo, T., Kato, K., Takahata, Y., et al. (2012). Triacylated peonidin 3-sophoroside-5-glucosides from the purple flowers of Moricandia ramburii Webb. Phytochemistry 76, 73–77. doi: 10.1016/j.phytochem.2011.12.019
Thomson, J. D. (1988). Effects of variation in inflorescence size and floral rewards on the visitation rates of traplining pollinators of Aralia hispida. Evol. Ecol. 2, 65–76.
Torices, R., Gómez, J. M., and Pannell, J. R. (2018). Kin discrimination allows plants to modify investment towards pollinator attraction. Nat. Commun. 9:2018. doi: 10.1038/s41467-018-04378-3
Torices, R., and Méndez, M. (2014). Resource allocation to inflorescence components is highly integrated despite differences between allocation currencies and sites. Int. J. Plant Sci. 175, 713–723. doi: 10.1086/676622
Troscianko, J., and Stevens, M. (2015). Image calibration and analysis tool- box—a free software suite for objectively measuring reflectance, colour and pattern. Methods Ecol. Evol. 6, 1320–1331. doi: 10.1111/2041-210X.12439
Valverde, J., Gómez, J. M., García, C., Sharbel, T. F., Jiménez, M. N., and Perfectti, F. (2016). Inter-annual maintenance of the fine-scale genetic structure in a biennial plant. Sci. Rep. 6:37712. doi: 10.1038/srep37712
van der Kooi, C. J., Dyer, A. G., Kevan, P. G., and Lunau, K. (2019). Functional significance of the optical properties of flowers for visual signalling. Ann. Bot. 123, 263–276. doi: 10.1093/aob/mcy119
Veiga, T., Guitián, J., Guitián, P., Guitián, J., and Sobral, M. (2015). Are pollinators and seed predators selective agents on flower color in Gentiana lutea? Evol. Ecol. 29, 451–464. doi: 10.1007/s10682-014-9751-6
Wertlen, A. M., Niggebrügge, C., Vorobyev, M., and de Ibarra, N. H. (2008). Detection of patches of coloured discs by bees J. Exper. Biol. 211, 2101–2104. doi: 10.1242/jeb.014571
Keywords: anthocyanins, floral advertisement, floral display, floral signalling, kin selection, neighbourhood context, phenotypic plasticity, reward
Citation: Torices R, DeSoto L, Narbona E, Gómez JM and Pannell JR (2021) Effects of the Relatedness of Neighbours on Floral Colour. Front. Ecol. Evol. 9:589781. doi: 10.3389/fevo.2021.589781
Received: 31 July 2020; Accepted: 29 March 2021;
Published: 15 April 2021.
Edited by:
Alexei B. Ryabov, University of Oldenburg, GermanyReviewed by:
Amparo Lázaro, Mediterranean Institute for Advanced Studies (IMEDEA), SpainEric Imbert, Université de Montpellier, France
Copyright © 2021 Torices, DeSoto, Narbona, Gómez and Pannell. This is an open-access article distributed under the terms of the Creative Commons Attribution License (CC BY). The use, distribution or reproduction in other forums is permitted, provided the original author(s) and the copyright owner(s) are credited and that the original publication in this journal is cited, in accordance with accepted academic practice. No use, distribution or reproduction is permitted which does not comply with these terms.
*Correspondence: Rubén Torices, cnViZW4udG9yaWNlc0B1cmpjLmVz