 Saeid Alirezazadeh1,2†
 Paulo A. V. Borges3
 Pedro Cardoso3,4Rosalina Gabriel3
 François Rigal3,5
 Luís Borda-de-Água1,2*
- 1CIBIO/InBio, Centro de Investigação em Biodiversida de e Recursos Genéticos, Universidade do Porto, Vairão, Portugal
- 2CIBIO/InBio, Centro de Investigação em Biodiversida de e Recursos Genéticos, Laboratório Associado, Instituto Superior de Agronomia, Universidade de Lisboa, Tapada da Ajuda, Lisbon, Portugal
- 3cE3c–Centre for Ecology, Evolution and Environmental Changes/Azorean Biodiversity Group, Faculdade de Ciências e Engenharia do Ambiente, Universidade dos Açores, Angra do Heroísmo, Portugal
- 4Laboratory for Integrative Biodiversity Research (LIBRe), Finnish Museum of Natural History Luomus, University of Helsinki, Helsinki, Finland
- 5CNRS—Université de Pau et des Pays de l’Adour—E2S UPPA, Institut Des Sciences Analytiques et de Physico Chimie pour L’environnement et les Materiaux UMR 5254, Pau, France
Ecology, biogeography and conservation biology, among other disciplines, often rely on species identity, distribution and abundance to perceive and explain patterns in space and time. Yet, species are not independent units in the way they interact with their environment. Species often perform similar roles in networks and their ecosystems, and at least partial redundancy or difference of roles might explain co-existence, competitive exclusion or other patterns reflected at the community level. Therefore, considering species traits, that is, the organisms’ functional properties that interact with the environment, might be of utmost importance in the study of species relative abundances. Several descriptive measures of diversity, such as the species-area relationship (SAR) and the species abundance distribution (SAD), have been used extensively to characterize the communities and as a possible window to gain insight into underlying processes shaping and maintaining biodiversity. However, if the role of species in a community is better assessed by their functional attributes, then one should also study the SAR and the SAD by using trait-based approaches, and not only taxonomic species. Here we merged species according to their similarity in a number of traits, creating functional units, and used these new units to study the equivalent patterns of the SAR and of the SAD (functional units abundance distributions - FUADs), with emphasis on their spatial scaling characteristics. This idea was tested using data on arthropods collected in Terceira island, in the Azorean archipelago. Our results showed that diversity scales differently depending on whether we use species or functional units. If what determines species communities’ dynamics is their functional diversity, then our results suggest that we may need to revaluate the commonly assumed patterns of species diversity and, concomitantly, the role of the underlying processes.
Introduction
Species diversity, or simply biodiversity, encompasses several scales, from the genetic (phylogenetic diversity at the species level) to that of species (taxonomic diversity), populations and ecosystem functions (functional diversity) (Wilcox, 1984; United Nations Environment Programme [UNEP], 1992). One of the major goals of ecology is to describe this diversity at different spatial and temporal scales and seek for the processes shaping and maintaining it. However, species do not exist in isolation, they interact with each other and are influenced, and influence, abiotic processes in the environments where they exist. Therefore, a major challenge is to connect the description of taxonomic diversity with the processes by which species interact with their environments. Functional diversity has the potential to link these two views of a community (Asner et al., 2017). Our main purpose here is to study patterns of functional diversity using tools commonly used to assess patterns of species taxonomic diversity with an emphasis on its scaling properties.
By functional diversity we mean: “the values and range in the values, for the species present in an ecosystem, of those organismal traits that influence one or more aspects of the functioning of an ecosystem” (Tilman, 2001). As (Petchey and Gaston, 2006) pointed out, this is a relatively narrower definition than that found in original studies, and that emphasizes the importance of “measuring functional trait diversity, where functional traits are components of an organism’s phenotype that influence ecosystem level processes” (Petchey and Gaston, 2006). An important aspect highlighted by functional diversity is that species often overlap in their traits, leading communities with different species (taxonomic) composition to having a similar functional composition (Cardoso et al., 2014). Therefore, because the emphasis is no longer on taxonomic differences, as recently highlighted by Wong et al. (2019).
The main novelty of our work is its emphasis on the spatial scaling attributes of functional diversity by looking at the equivalent to the species-area relationship (hereafter SAR) that we will call the functional units-area relationship (hereafter FUAR), and the equivalent to the species abundance distribution (hereafter SAD), that we will call the functional units abundance distribution (hereafter FUAD) and where we adopted the following definition of functional units: a set of organisms sharing the same unique combination of attributes. Concerning the FUAD, as we elaborate later, our purpose is not to discuss which distribution gives the best fit at one spatial scale, but how the distributions change as a function of scale. To do this we will use the (raw) moments of the distributions. This is done with an aim to providing new tools and, importantly, to discerning new quantitative patterns associated with functional diversity.
One the most studied patterns of species taxonomic richness is the species-area relationship (e.g., Rosenzweig, 1995). The species-area relationship describes how the number of species changes as a function of area size. However, as shown by Scheiner (2003), there are different types of SARs depending on how data are collected and presented. For example, some SARs describe how the number of species change as a function of the size of islands in an archipelago (Whittaker et al., 2014), while others describe how the number of species accumulates as sampled (nested or non-nested) areas increase (Matthews et al., 2016); in this study we look at the SAR of non-nested areas. An important aspect of SAR studies is that they implicitly assume a scaling approach and try to identify a pattern. Which function best describes this scaling pattern has been a topic of contention among ecologists, as reviewed by Rosenzweig (1995). One of the most popular functions is a power law of the form, S = cAz, where S is the number of species, A the area size, and c and z constants to be determined. In our analyses we will compute the equivalent to the SAR but using species functional units instead of species and will compare functional units-area relationships, the FUAR, and taxonomic-based SAR curves of the same dataset. Smith et al. (2013) have already introduced the concept of functional-diversity-area relationship, to explore the scaling properties of individual traits alone, and when extending the concept to multiple traits they used the concept of convex hull model introduced by Cornwell et al. (2006), while here we group taxonomic species based on their traits to form functional units.
Although species richness and how it changes as a function of sample or area size are important attributes of a community, they do not provide information on the species relative abundances. There are several ways to account for species abundance, but probably the most intuitive, and the one we will use here, is the number of individuals. Typically, species relative abundances are depicted using a histogram, called a species abundance distribution, relating the number of species (the y-axis) with the number of individuals (the x-axis), with the latter usually expressed on a logarithmic scale of base 2 (e.g., McGill et al., 2007); logarithms are used in order to accommodate the wide range of abundances usually encountered in a community sample. In other words, a SAD answers the question of how many species exist within a given range of number of individuals. In line with our previous delineated approach of functional units, we will analyze SADs based on species functional units, the functional units abundance distributions, or FUAD, and, again, we will compare these distributions with the taxonomic SADs of the same dataset.
In contrast with the SAR, that looks at the number of species at different scales, the SAD is often computed and studied at one single scale (e.g., McGill et al., 2007). However, Borda-de-Água et al. (2012, 2017) argued that SADs should also be studied as a function of scale, because histograms (i.e., the distributions) change considerably depending on the size of a sample (or area size). The visual description by Preston (1948) of a veil-line progressively revealing more classes of the distribution as sample size increases, provides a good visual representation of the way the distributions change: for small sample sizes SADs are usually monotonically decreasing functions with the maximum occurring for the singleton class, while for larger sample sizes the distributions become bell-shaped. Once we realize that the SADs change as a function of sample size, an important task is to characterize that change, that is, the scaling properties of the distributions. Borda-de-Água et al. (2012, 2017) used the raw moments of the distribution to describe the scaling of the SADs (see section “Materials and Methods” for the definition of raw moments). The characterization of the distributions at different scales based on their moments, enables the SADs to be extrapolated to larger areas, whose sizes pose sampling problems because of economical or other practical reasons. Here, and for the same reasons, we will study how SAD based on functional groups instead of species (i.e., functional units abundance distributions) change as a function of scale and will use the raw moments to describe their scaling properties.
In summary, the rationale of our study is the following. If functional units provide a more accurate description of how species interact among them and the environment, then the above scaling patterns of species richness and relative abundance should be reformulated in terms of the species’ functional units and not of the species taxonomical identities. As we will see, using data on arthropods collected in the Azores archipelago, describing the scaling proprieties of the diversity of a community using species’ functional units leads to quantitatively different results from those obtained when using taxonomic species.
Materials and Methods
Study Sites and Sampling Strategy
We used data on arthropod species collected in Terceira island, Azores (Figure 1). The Azores archipelago (37°–40° N; 25°–31° W) consists of nine islands and it is one of the world’s most isolated archipelagos. Terceira is the island for which we have the most data (see Borda-de-Água et al., 2017), hence we will focus our analysis on this island. Terceira is the third largest island of the archipelago with an area of 402 km2 and it is currently estimated to be 0.40 million years old (Calvert et al., 2006). We gathered data in native forest reserves from 39 transects, each 150 m long and 5 m wide. We sampled all transects with the same sampling effort using standardized methods; for more details see Borges et al. (2005) or Rigal et al. (2018). We have identified 181 arthropod species for Terceira island, and for each species we have also recorded the number of individuals sampled.
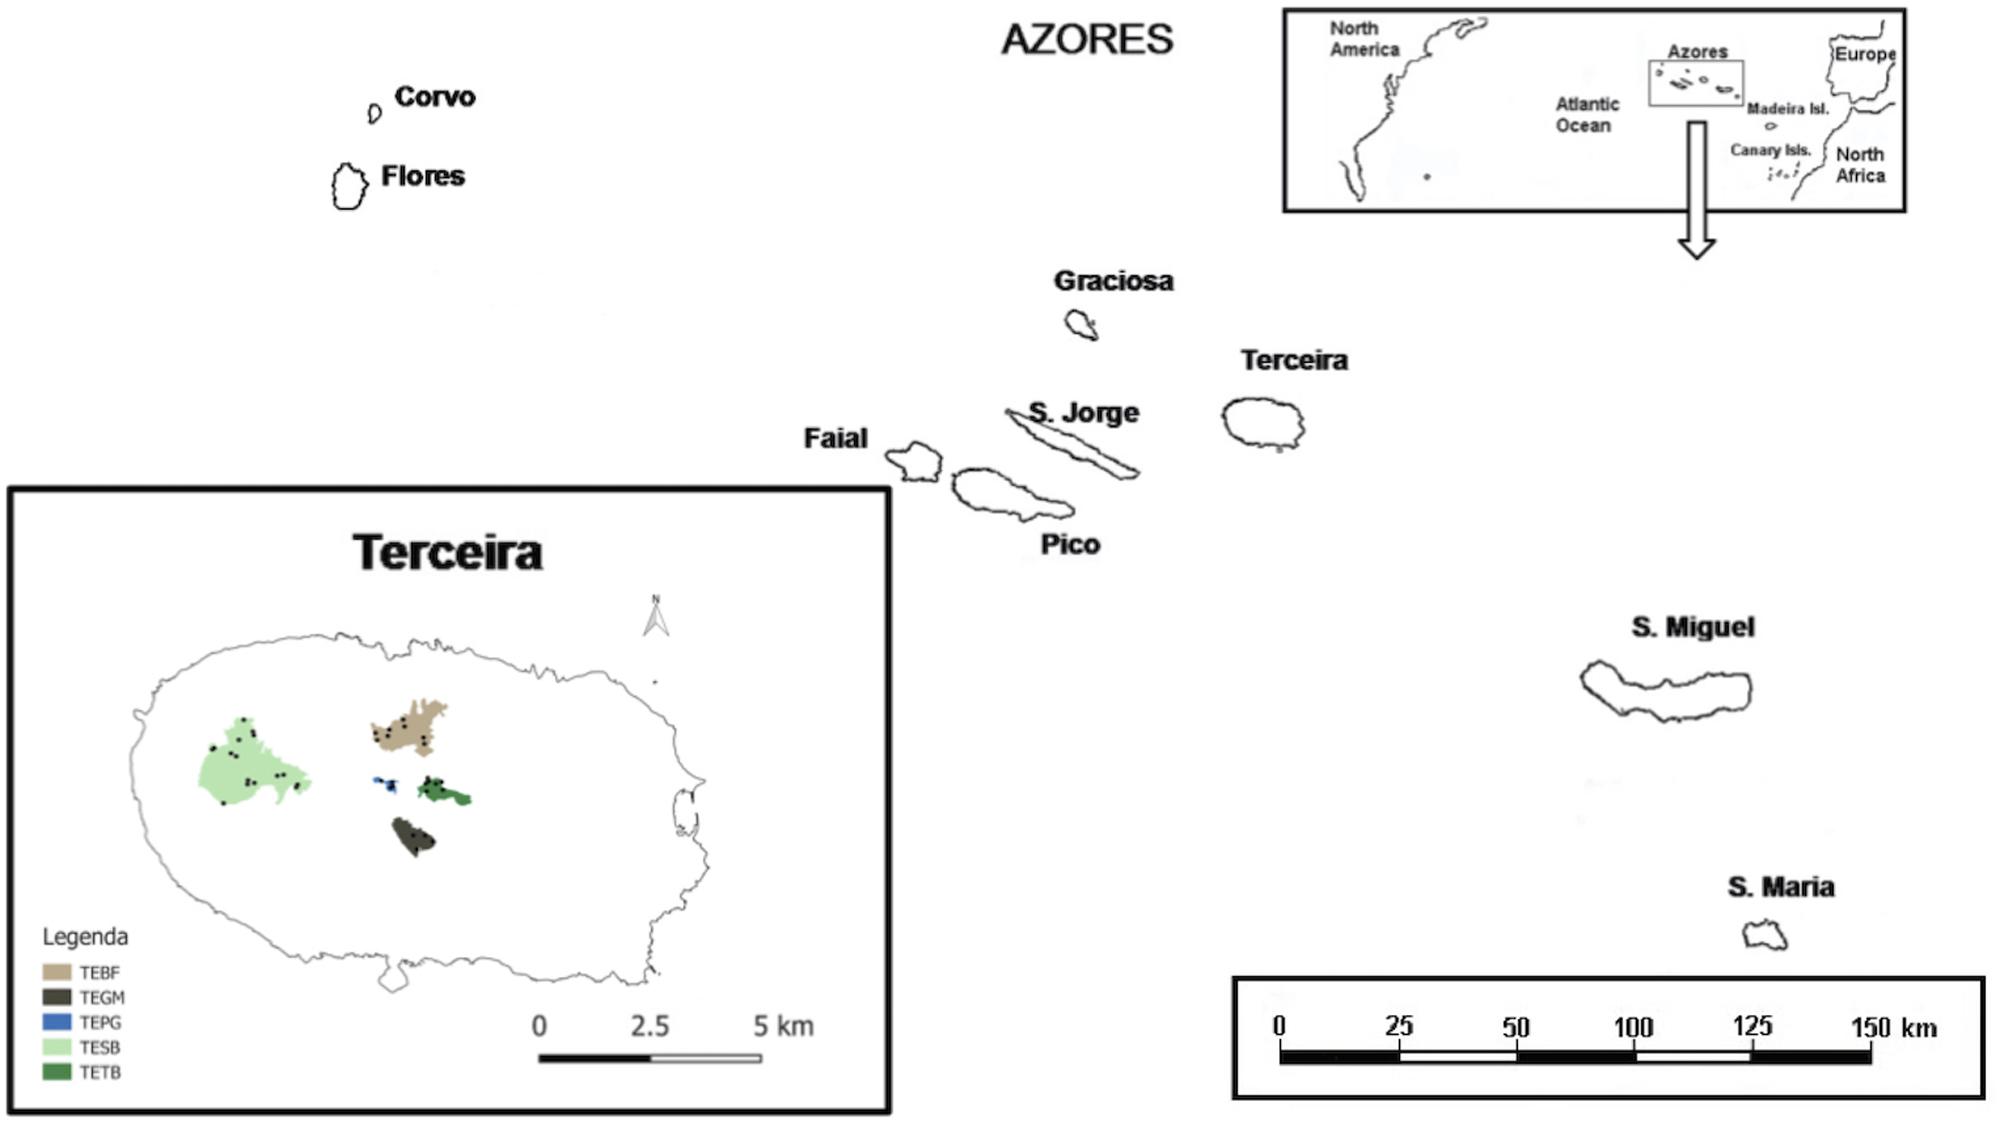
Figure 1. The Azorean archipelago with a detailed map of Terceira Island. The acronyms correspond to the following vegetation fragments: TEBF, Biscoito da Ferraria; TEGM, Guilherme Moniz; TEPG, Pico Galhardo; TESB, Santa Bárbara; TETB, Terra Brava. Maps were generated in Open Source QGis.
Species Identification
The arthropods collected were identified in the laboratory at the species level for the taxa Araneae, Opiliones, Pseudoscorpiones, Diplopoda, Chilopoda and Insects (excluding Collembola, Diplura, Diptera and Hymenoptera). Taxonomic identification was performed in two steps: (i) trained parataxonomists sorted samples into morphospecies (i.e., recognizable taxonomic units, sensu Oliver and Beattie, 1996) using a non-complete reference collection; (ii) experienced taxonomists assisted in the identification of the morphospecies. All species were classified as indigenous or exotic. Indigenous species comprise Azorean endemics and other native non-endemics. Exotic species are those considered to have colonized via human mediation, many of which have a cosmopolitan distribution (Borges et al., 2010). As in some of our previous studies (e.g., Borges et al., 2005; Gaspar et al., 2008), we dealt with unidentified morphospecies as follows. When other species in the same genus, subfamily or family were present in the archipelago and all belonged to the same colonization category (according to Borges et al., 2010), the unknown morphospecies were classified similarly. If no information was available, we assumed the species to be native since exotics are usually widespread and easier to identify (Borges et al., 2010).
Functional Data
Different species interact with the environment and other organisms in different ways. Yet, standardization across taxa is not only possible but provides important insights (e.g., Chichorro et al., 2019, Chichorro et al., 2020). Often a trait-based approach has to be adapted to accommodate such differences, by using different proxies that are equivalent for contrasting taxa. In our case, as we only studied arthropods, which share many characteristics, standardization was relatively easy. In fact, in this last decade recent efforts have been made to develop trait database for arthropods as a whole (See Schweiger et al., 2005; Simons et al., 2016; Rigal et al., 2018). Functional traits were then selected based on the known life-history of the taxa analyzed as representing different ways the organisms can be affected in their probability of survival and hence abundance in the studied forests. This way we are implicitly studying mechanisms that affect species abundances in the native forests of the Azores and how such abundances change depending on the spatial scale.
For all arthropod species, we collated data for five traits namely, body size, dispersal abilities, trophic level, microhabitat and origin. Body size was measured for the individuals sampled in this study and was coded using ordered size classes delimited by the intervals (0, 0.5), (0.5, 1.5) … (40.5, 41.5). Both dispersal abilities and trophic level were collected from an extensive literature search, including manuscripts with the first descriptions of the species, first species records for the Azores, brief notes and ecological studies. Information was also obtained from experts who have identified the specimens or from experts of a given taxonomic group when information for a particular species was not available. Functional information was assigned to each species according to their adult characteristics, except for Lepidoptera, where traits were assigned with reference to the larval stage. For the unidentified morphospecies, we assigned functional traits of the nearest taxonomic resolution (genus, family), except for body size which was measured directly from the individuals.
Specifically, for the trait “dispersal ability,” the species were categorized into high and low dispersal classes based on ecological attributes and morphological characteristics. This could be for instance, the presence of active wings for beetles (Coleoptera) and bugs (Hemiptera), ballooning for spiders and evidence of flying ability for endemics and general natural history guides for the other species. To be considered as a good disperser, a species has to be able to disperse between fragments of native forest and surpass the current matrix of man-made habitats (e.g., pastures). For origin we identified three classes: “endemic,” “introduced,” or “native non-endemic.” One can argue that the “origin” of a species is not a relevant trait to how a species functions within a community. We use this category because introduced species may have (new) traits that are not present among the native species and, for a similar reason, we identify endemic species because they may have unique traits adapted to particular conditions of the archipelago or, in the case of single island endemics, of an island (see also Rigal et al., 2018).
Thus, each species was categorized based on five traits:
• Average body size classes;
• Dispersal ability, with two classes: “high” or “low”;
• Trophic level, with two classes: “herbivore” or “predator”;
• Microhabitat, with two classes: “canopy” or “pitfall”;
• Origin, with three classes: “endemic,” “introduced,” or “native non-endemic.”
For each species we determined the combination arising from the five above traits. For instance, a species could have the following combination (average body size = 3.5, dispersal = “low,” location = “canopy,” origin = “native,” trophic level = “herbivore”). From a functional perspective, we think of all species with the same traits’ combination as being just one functional unit. Thus, we identified all species with the same traits’ combination and added their number of individuals to form a functional unit; obviously, the number of functional units is necessarily smaller or equal to the number of species.
Statistical Procedures
In order to obtain the species and functional units-area relationships (FUAR) we started from a random transect and added the species of the nearest transect, and then of the next nearest transect until reaching the desired number of transects. By adding the nearest transect we better replicate a spatial sampling process that avoids overinflating the effect of beta diversity that would happen if sites were added, irrespectively, of spatial distance. The final SAR and FUAR curves are the average of the curves obtained from different starting transects. This procedure leads to one of the six types of species-area relationship described by Scheiner (2003), and it has the advantage of retaining information of the relative distance between the transects.
We construct histograms of functional units abundance distributions (FUAD) as the classical taxonomic species abundance distributions (SADs). Figure 2 shows some examples. On the y-axis we plot the number of functional units and on the x-axis the number of individuals on a logarithmic scale of base 2, with the classes of the number of individuals defined as 1, 2–3, 4–7, et seq. When a species abundance distribution resulted from the accumulation of data from two or more plots, we always added the data from the nearest transect, as we did for the SARs. Also, as before, the final SAD and FUAD curves are the average of the distributions obtained from different starting transects.
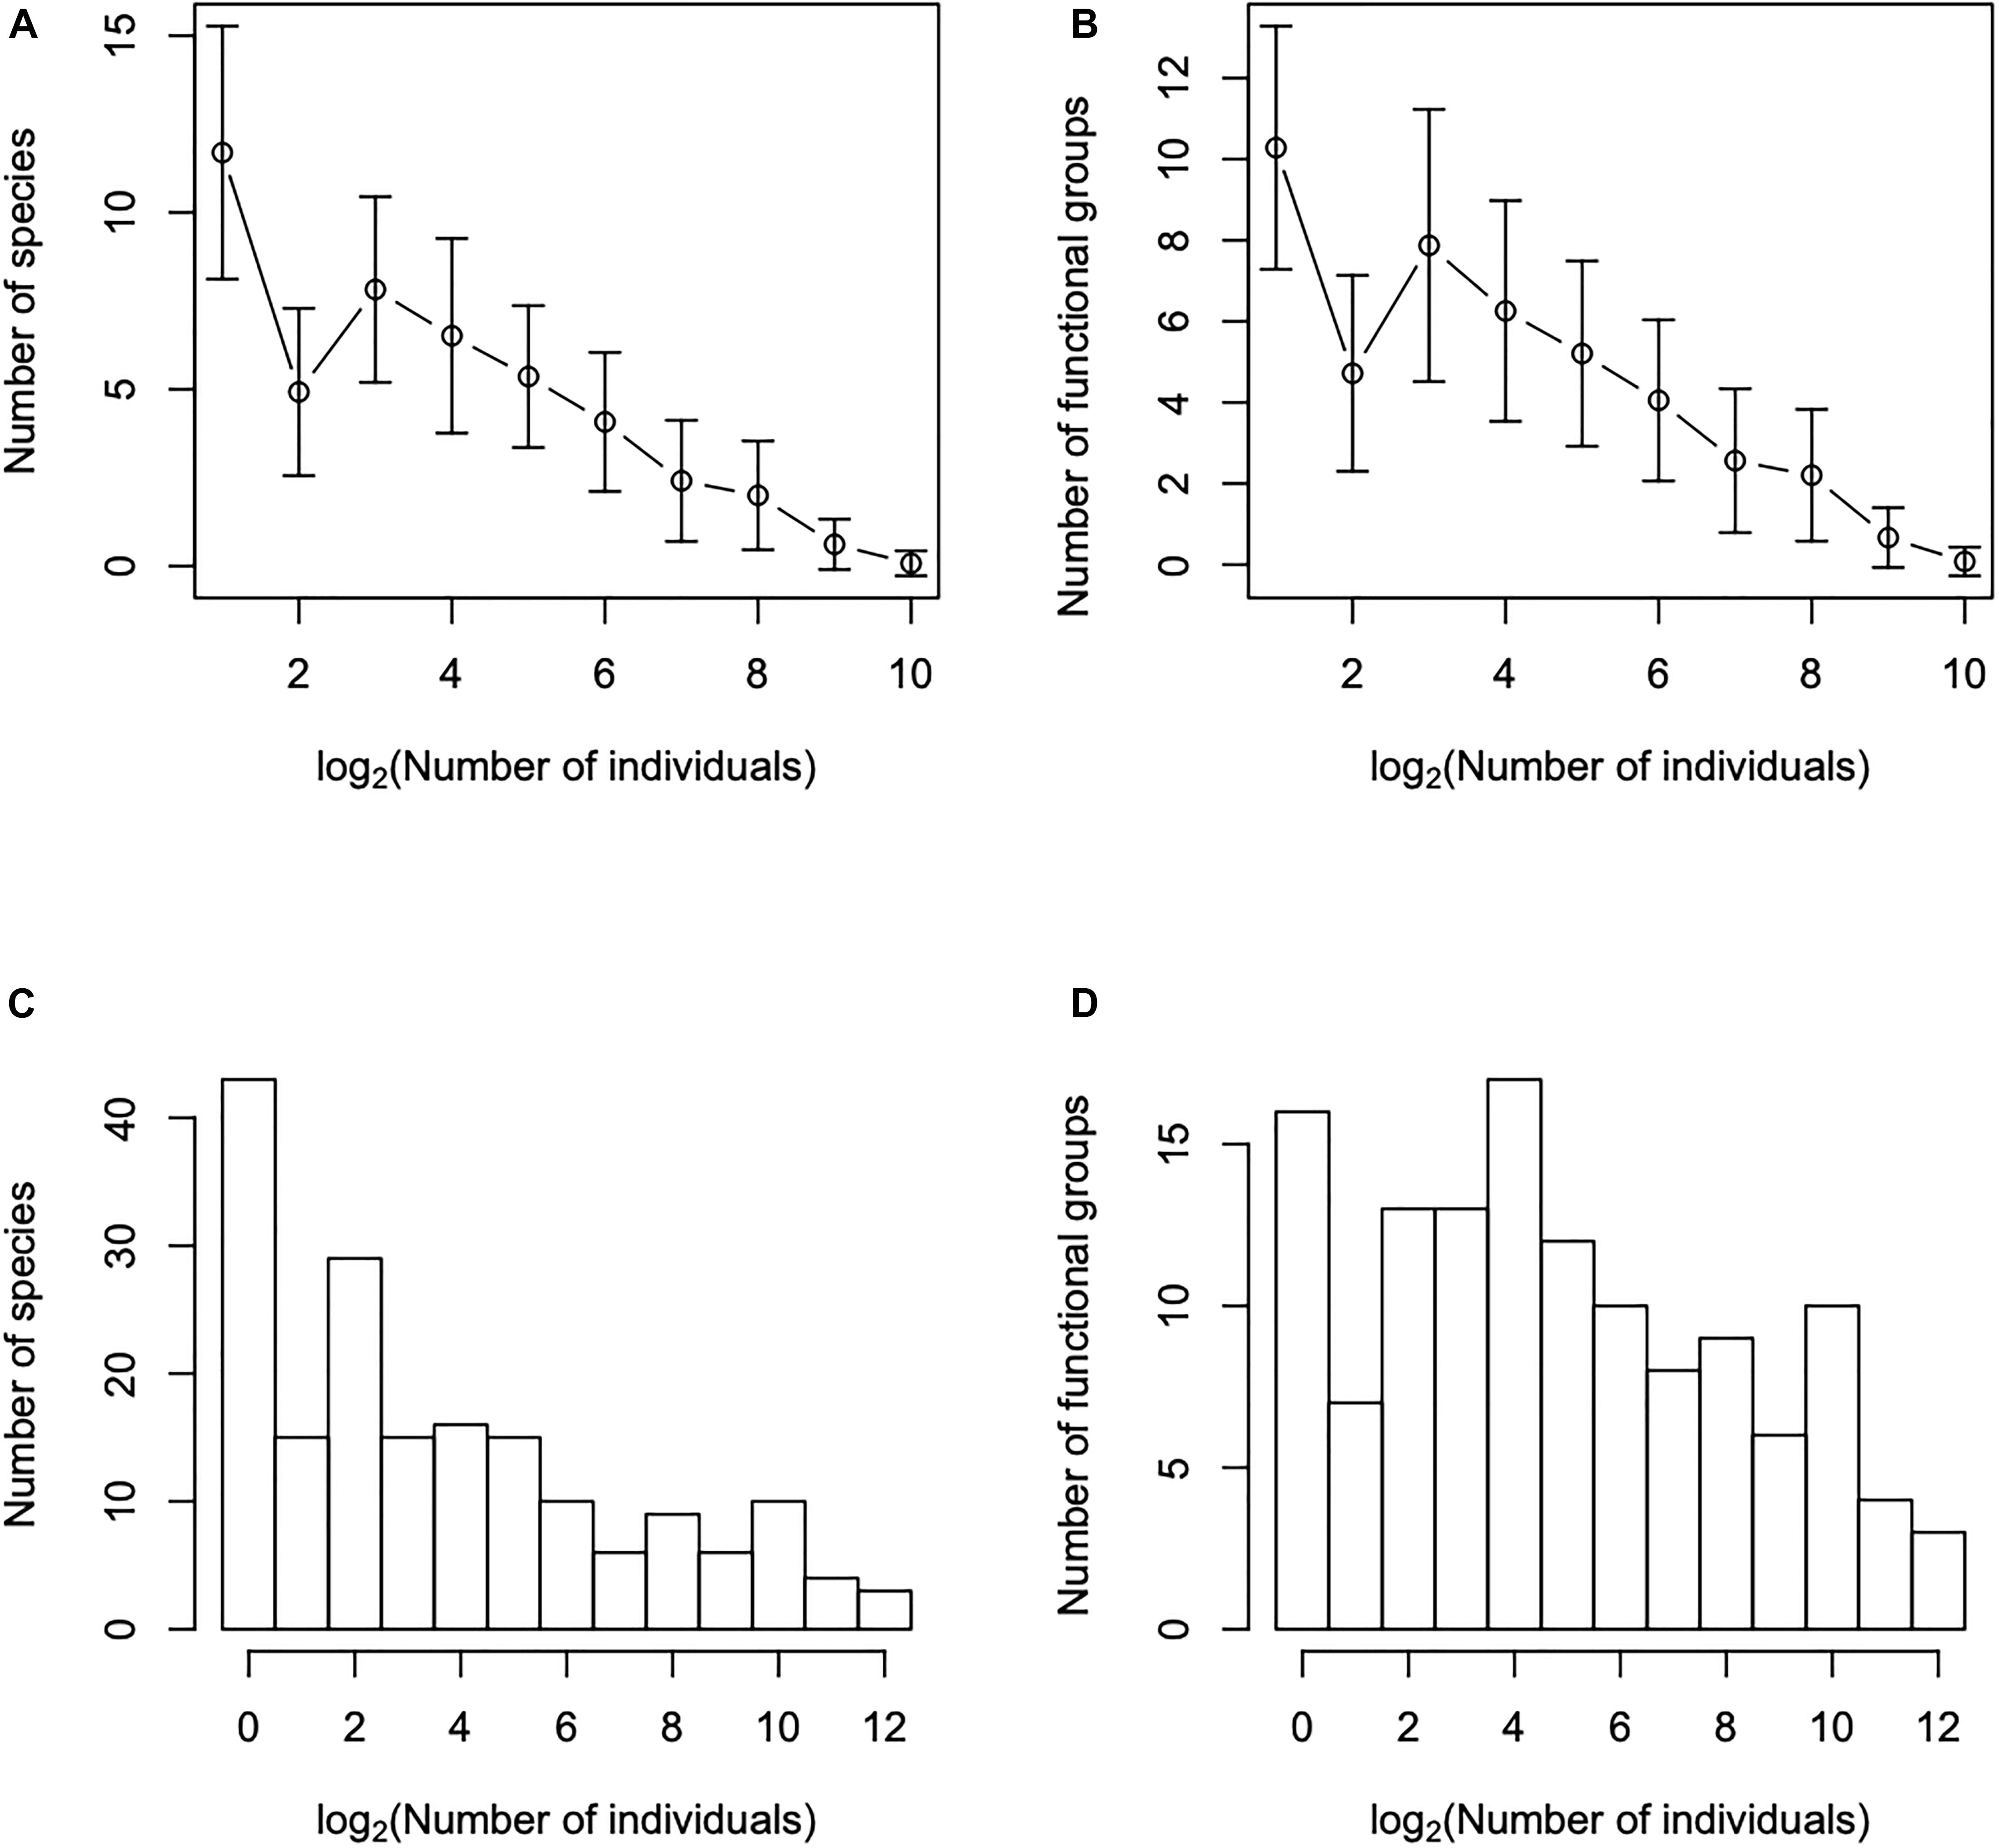
Figure 2. Species abundance distributions, plots (A,C), and functional units abundance distributions, plots (B,D); functional units are the functional entities obtained by aggregating species with the same trait combinations. Plots (A,B) are obtained after averaging the abundance distributions of all transects and the bars correspond to two standard deviations, while plots (C,D) are obtained after adding all transects. Notice that the shape of the distributions changed when we consider the average of all transects and when we all add all transects.
In order to characterize the scaling properties of the FUADs, we use their raw moments (occasionally, when there is not risk of confusion, we call them simply “moments”) as we have done previously for SADs (Borda-de-Água et al., 2012, 2017). If a community is made of SFG functional units and xj = log2(Xj), where Xj is the number of individuals of the j functional unit, then the raw moment of order n, Mn, is calculated from
notice that M0 is equal to 1, and M1 corresponds to the average. Other, more familiar moments, such as the variance (the second central moment), can be obtained as combinations of the raw moments.
The Extrapolation Procedure
Here we used an improved method to extrapolate the distributions based on that described in Borda-de-Água et al. (2012, 2017). The basic idea consists of estimating the moments, using formula (1), up to a given order n, plotting these values and fitting the curves of each order moment and then, using these curves, estimating the moment values for the new areas. In order to reproduce the abundance distribution based on the extrapolated moments, we used an improved version (Mukundan, 2004) of the scale discrete Tchebichef moments and polynomials first introduced by Mukundan et al. (2001). We refer the details to the Supplementary Material.
Results
Based on the traits described in the section “Materials and Methods,” there are 648 possible trait combinations. Since, there are 181 arthropod species identified in the Terceira arthropod dataset, there are, at the maximum, 181 observable combinations. From this we only observe 117 trait combinations, or 117 functional units. Notice that from all the classes ascribed to the average body size, species only occurred in 27 (from classes 0 to 22 and then in classes 25, 33, 37, 40, and 41).
We start by presenting the SAR and the FUAR (Figure 3); because all transects have the same dimensions, we equate the number of transects with area size. The obvious difference between the two curves is that the FUAR in a log-log plot starts exhibits a plateau, showing clear signs of starting to “saturate,” while the traditional species-area curve reveals the typical (almost) straight line in a log-log plot, that is the number of taxonomic species keeps increasing until the very last transect considered. In a sense, given that the number of functional units is a subset of the number of species, one could expect this to happen, but notice that the possible plateau only starts to appear at a large number of transects.
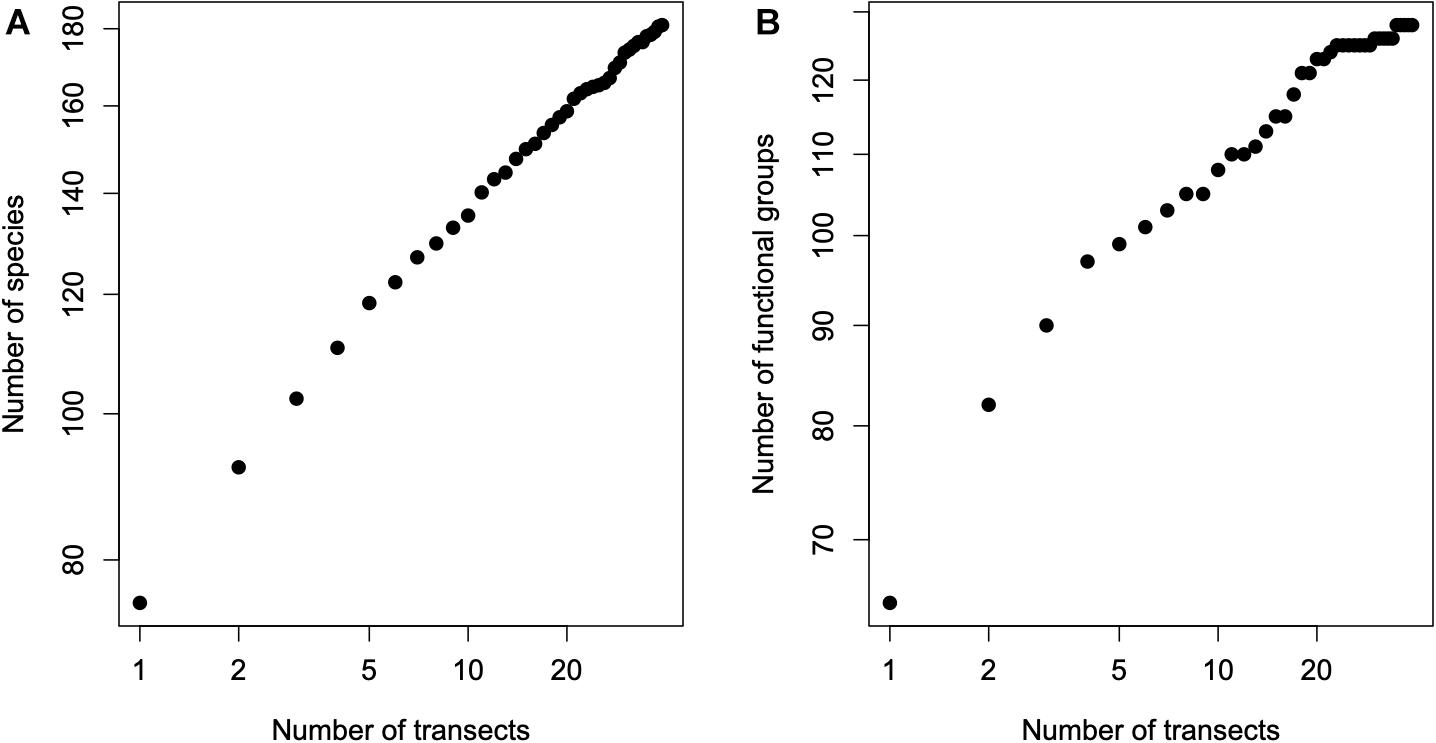
Figure 3. The species-area relationship (SAR), plot (A), and the functional units area relationship (FUAR), plot (B). Recall that all transects have the same dimensions, thus we equate the number of transects with area size. Both plots are on double logarithmic scales. Notice that the SAR exhibits the typical linear relationship when plotted on double logarithmic scales (i.e., it is approximately a power law relationship) while the FUAR shows some signs of reaching a plateau.
We showed in Figure 2 the SADs and FUADs: plots a and c were obtained after averaging the distributions of individual transects and plots b and d when we added the data from all the transects. Notice that at the level of one transect (plots A and B) the SAD and FUAD are very similar, being almost monotonically decreasing curves. From here on, we will describe curves that have such a monotonically decreasing shape as “logseries-like,” but we do not ascertain that the logseries distribution would provide the best fit, it is, hence, just a terminology to describe the general shape of the curve. On the other hand, when all transects are added together they are very different (plots C and D). Specifically, while the SAD of the 39 transects retains a logseries-like shape, the FUAD has its maximum at an intermediate class and, although it still has a large number of singletons, overall it has a bell shape. In other words, the FUAD evolves faster from a logseries-like distribution to a bell-shaped distribution than the species-based SAD. From here on, we will describe curves with a bell-shape distribution, thus with the maximum at intermediate classes, as “lognormal-like” without implying that the lognormal would provide the best fit; as with the terminology for the “logseries-like” distributions, it just a general description of the shape of the distribution.
We estimated the moments of the FUAD using Eq. 1, Figure 4. The overall behavior of the moments of the functional units as a function of the number of transects is not very different from those of taxonomical diversity (Borda-de-Água et al., 2017), that is, above a certain number of transects (or area) the moments are approximately linear in log-log scales. Using the procedure described in the Supplementary Material, we extrapolate these moments for a larger number of transects and used them to reconstruct the FUAD (Figure 5); for sake of comparison we applied the same procedure to the traditional taxonomical SAD. The SAD evolves from an almost monotonically decreasing function to a curve with a clear peak when we extrapolate the distribution for 70 transects (the green line in Figure 5A). However, the appearance of a peak for the SAD is slow compared to that of the FUAD, whose peak for intermediate classes is already clear in the FUAD for 39 transects. When we increase the number of transects the maximum peak for the extrapolated curves shifts to higher abundance classes, and there is a reduction in the number of singletons.
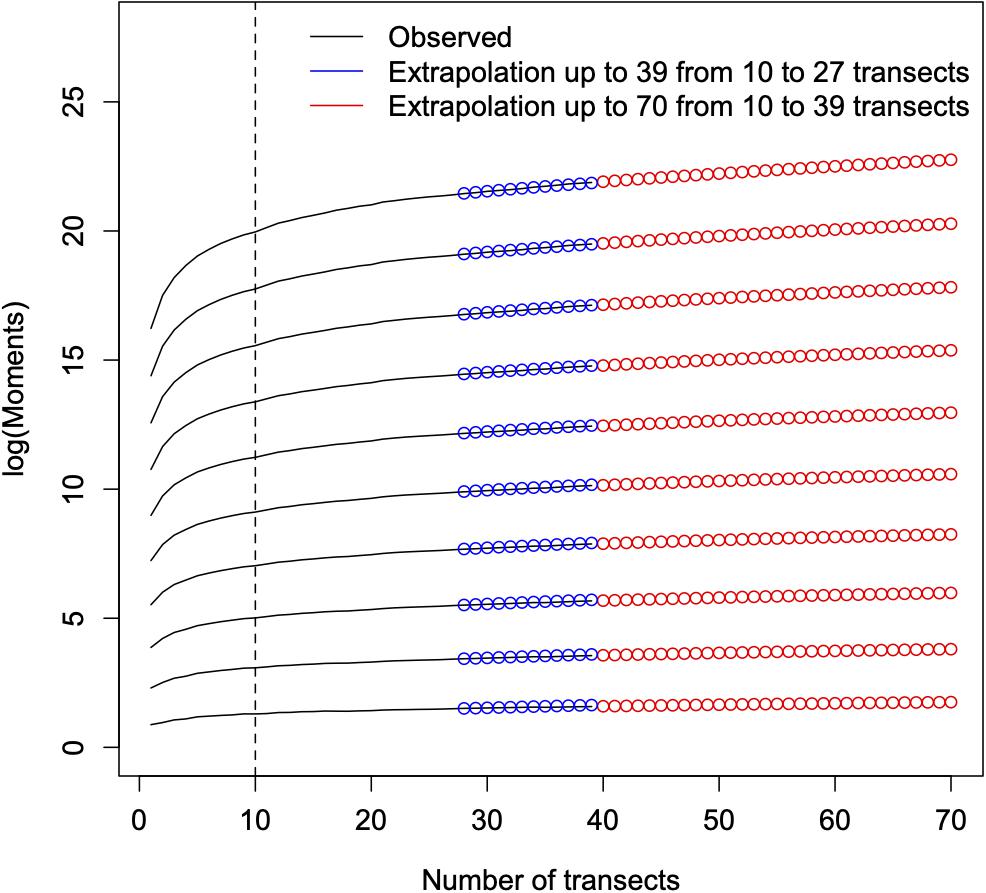
Figure 4. The raw moments up to order 10 as a function of the number of transects. The full lines are the values calculated from the data, the blue circles are the values obtained by extrapolating the observed values from 10 to 27 transects and are, then, used to assess the method of extrapolation, and, finally, the red circles are the values obtained by extrapolating the observed values from 10 to 39 transects. The dashed vertical line corresponds to the threshold above which data are used to extrapolate the abundance distributions.
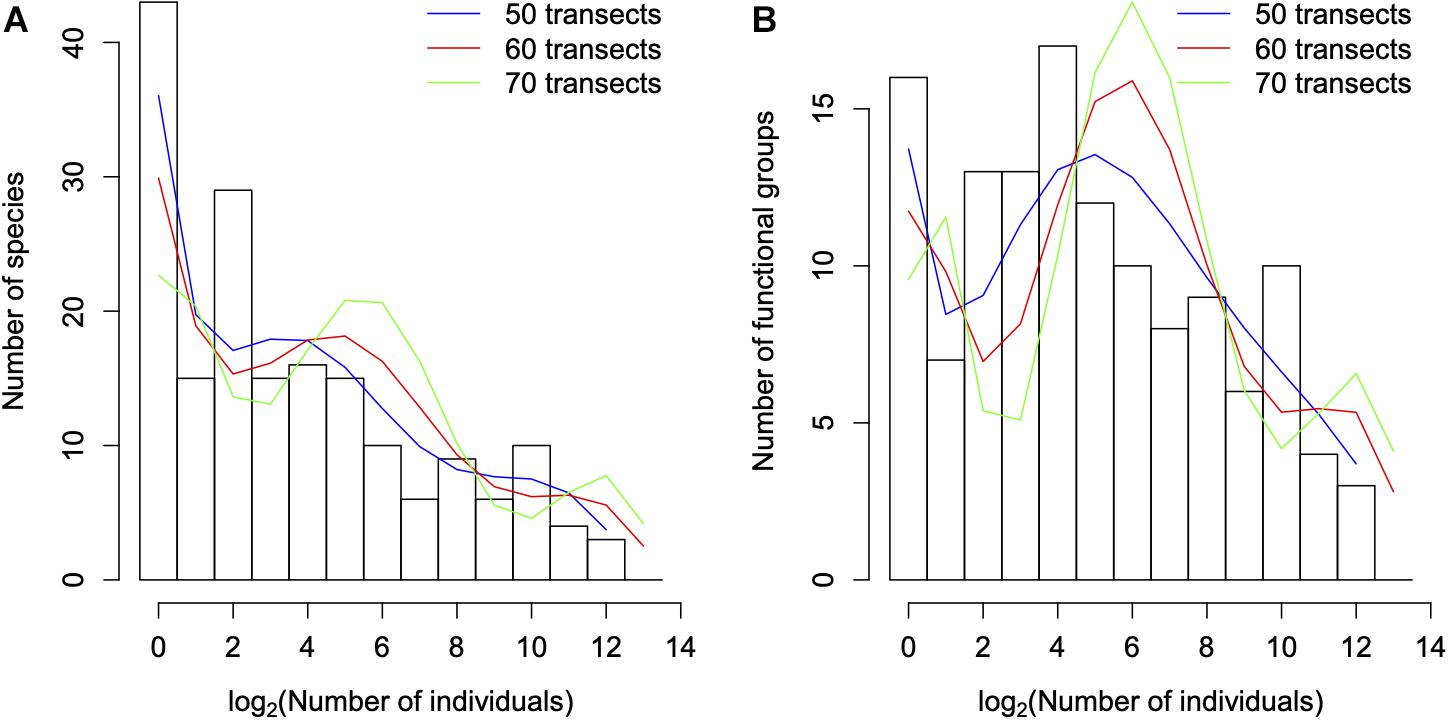
Figure 5. The histograms correspond to the species (A) and functional units (B) abundance distributions of the arthropod species for Terceira’s 39 transects, and as a reference, the extrapolations to 50, 60, and 70 transects are plotted in the blue, red, and green lines, respectively. Notice, in both cases, the reduction in the number of singletons when the number of transects increases. For the species abundance distribution there is a clear development of a peak for intermediate classes, while for the functional units such a peak is already present for 39 transects, but it increases when the number of transects increases.
Discussion
Under the premise that functional units have a more meaningful correspondence with the underlying processes of maintenance and generation of species diversity (Tilman, 2001), we applied several procedures commonly used on studies of communities but using, instead of taxonomical species, functional units, that is, entities resulting from aggregating species with identical traits. Common criticisms often leveled at studies of functional diversity can also be raised here, namely, that the results depend on the choice of the traits, on the way traits are coded (e.g., number of categories identified) and on the scales used to identify traits (e.g., Ricotta, 2005). Undoubtedly, we would have obtained quantitatively different results if we had chosen a different set of traits or a different scale for the average body size, for instance. However, we describe this work as a first exploratory attempt to determine how diversity scaling changes depending on whether we use species or functional units.
These exploratory results showed that the scaling behavior of the species and of the functional units is quantitatively different. For instance, the FUAR relationship does not have a linear relation when plotted on log-log scales and shows a clear plateau, and contrary to the SAR, when area increases the FUAD develops a peak earlier than the corresponding SAD. Concerning the FUAR we acknowledge that its shape is a function of the number of traits chosen. For instance, if we had chosen fewer traits, the plateau would have been reached even earlier, because there would have been fewer functional units. Although it is outside the scope of the work, a pattern that is worth analysing in the future is how the FUAR shape changes in a community as a function of the number of traits used. Furthermore, to overcome the problem of trait dimension in driving FUAD patterns, we could also use a null model approach to test whether FUAR was simply a product of species richness (see Whittaker et al., 2014, for example).
To understand the faster transition in a FUAD, it is important to understand the transitions in a typical SAD. Using computer simulations, Borda-de-Água et al. (2007) conclude that the SADs undergo three regimes when area increases (their Fig. 17.9). For very small sample sizes, the distributions are monotonically decreasing curves, thus the maximum occurs for the singleton class, and they can be described as logseries-like distributions. When the sample size increases the number of singleton species, and those of other rare classes, decreases and the distributions develop a peak for intermediate abundance classes, having a lognormal like shape, although with some singletons and other rare species still being present. This shift in the shape of the species abundance distribution can be observed in real data, such as the data on tropical tree species of a 50 ha plot in Barro Colorado Island, Panama; see for example Borda-de-Água et al. (2012; Figure 1). The explanation for such a transition is the following: (i) when the number of individuals is small and several species are present, the number of individuals per species is small and most species are rare; (ii) once more individuals are collected some, if not most, belong to species already present, thus, species accumulate more individuals and they move away from the rarity classes toward those classes corresponding to more abundant species, therefore, overall, intermediate abundant classes start having more species and the curve becomes more bell shaped. When sample size increases further, the distribution becomes again monotonically decreasing, resembling again a logseries distribution. The explanation for such transition is the following: most species are rare for very small sample sizes, but only a few are really rare in the (meta)community, therefore, those that are not truly rare move to more abundant classes when sample sizes increase, but those that are truly rare remain in the classes of the rare species. For very large samples, we collect species from different regions of the community, each region containing rare species, thus at the level of the entire community there are a large number of rare species that are added to the rare abundance classes. The presence of a large number of rare species can also be the result of the temporal evolution of community. In fact, hyperdominance (i.e., few species having most of the individuals) may happen due to few winners dominating the community and the addition of mostly rare species to the regional pool with speciation operating on long timescales (McGill et al., 2019). As new species are added at a regional scale through evolution, hyper-rarity and hyperdominance are generated. Consequently, in time, the number of such (truly) rare species can be very high and the SAD is a monotonically decreasing function. We suggest that the latter transition from a lognormal to a logseries is difficult to observe in real data because it requires large sample sizes. However, in addition to the evidence from simulations (Borda-de-Água et al., 2007), theoretical results based on Neutral theory (Hubbell, 2001) and data on Amazon tree genera do suggest that the SAD for very large communities is logseries-like (Ter Steege et al., 2006; Hubbell et al., 2008; Hubbell, 2013; Ter Steege et al., 2013).
The previous description for the three regimes observed for SADs may not apply when we look at the abundance distributions of functional units. The first transition from the logseries-like to the lognormal-like may still be present, as revealed by Figure 5, though it occurs faster than the corresponding SAD. This is not surprising given that functional units are collections of species, thus a faster increase in the number of intermediate abundance functional units and a decrease in the number of rare functional units is not surprising. However, we speculate that the transition from lognormal-like to logseries-like for large scales may never occur for FUADs, because, though we expect more rare species to enter the sample, these may have the same set of traits of other species already present in the community, thus the number of functional units in the rare classes will not increase. In fact, we expect the number of functional units in rare abundance classes to decrease. In other words, although the number of species is likely to increase when the number of sampled individuals increase, the number of trait combinations, and thus that of functional units (but not their abundance as measured by the number of individuals), is likely to remain approximately constant. If this is indeed the case, and if the functioning of the community is (partially) determined by the relative abundance of the functional units, then communities at large scales are mainly characterized by lognormal-like distributions and not logseries-like distributions. This has implications for the investigation of the mechanisms and patterns that govern communities. The important mechanisms shaping a community may lead to FUADs that are inherently lognormal-like.
We finalize with an observation that points to future work. Once we group species based on their similarity, it is implicit that some species may be redundant. Such a view, however, should be taken carefully because we only identified a subset of all possible traits. It is possible that some non-identified traits may correspond to a species role in the ecosystem that is irreplaceable, and whose absence could lead to profound transformations in the community, including the loss of other species. In this respect it is worth noting that several works have shown that communities exhibit approximately the same number of species, S, and individuals, N, over time, that is, there is a regulation of temporal trends of species diversity (Brown et al., 2001; Gotelli et al., 2017; Blowes et al., 2019). This is a remarkable result, although the mechanisms of such regulation are not (fully) understood. One question that remains is whether such regulatory trends also occur if temporal community diversity is analyzed in terms of functional diversity. In fact, some studies have shown that functional diversity changes over time in some communities (e.g., Mendez et al., 2012; White et al., 2018; Dolezal et al., 2020). However, if regulation is even stronger when we consider functional units, this suggests that one possible way to identify functional units, would be to consider several trait combinations, and identify which trait combinations lead to the smallest variation of the number of functional units and their abundances over time. This approach could provide an objective choice of the traits and respective functional entities. Finally, we define functional units using categorical traits but some traits are usually recorded as continuous variables (e.g., morphological traits), therefore requiring alternative measures of functional units such as clustering methods (Villéger et al., 2012).
Data Availability Statement
Publicly available datasets were analyzed in this study. This data can be found here: https://doi.org/10.3897/BDJ.4.e10948.
Author Contributions
LB-Á, PC, and PB designed the original research. SA did most of the analytic work. All the authors contributed to writing up the article.
Funding
SA was financed by the Fundação para a Ciência e a Tecnologia project PTDC/BIA-BIC/5558/2014. LB-Á was financed by the Portuguese national funds through FCT—Fundação para a Ciência e a Tecnologia, I.P., under the Norma Transitória—DL57/2016/CP1440/CT0022.
Conflict of Interest
The authors declare that the research was conducted in the absence of any commercial or financial relationships that could be construed as a potential conflict of interest.
Acknowledgments
We thank H. M. Pereira for discussions related to functional diversity metrics.
Supplementary Material
The Supplementary Material for this article can be found online at: https://www.frontiersin.org/articles/10.3389/fevo.2021.607177/full#supplementary-material
References
Asner, G. P., Martin, R. E., Knapp, D. E., Tupayachi, R., Anderson, C. B., Sinca, F., et al. (2017). Airborne laser-guided imaging spectroscopy to map forest trait diversity and guide conservation. Science 355, 385–389. doi: 10.1126/science.aaj1987
Blowes, S. A., Supp, S. R., Antão, L. H., Bates, A., Bruelheide, H., Chase, J. M., et al. (2019). The geography of biodiversity change in marine and terrestrial assemblages. Science 366, 339–345.
Borda-de-Água, L., Borges, P. A., Hubbell, S. P., and Pereira, H. M. (2012). Spatial scaling of species abundance distributions. Ecography 35, 549–556. doi: 10.1111/j.1600-0587.2011.07128.x
Borda-de-Água, L., Hubbell, S. P., and He, F. (2007). Scaling Biodiversity Under Neutrality. Scaling Biodiversity. (Cambridge: Cambridge University Press), 347–375.
Borda-de-Água, L., Whittaker, R. J., Cardoso, P., Rigal, F., Santos, A. M., Amorim, I. R., et al. (2017). Dispersal ability determines the scaling properties of species abundance distributions: a case study using arthropods from the Azores. Sci. Rep. 7:3899.
Borges, P. A., Aguiar, C., Amaral, J., Amorim, I. R., André, G., Arraiol, A., et al. (2005). Ranking protected areas in the Azores using standardised sampling of soil epigean arthropods. Biodivers. Conserv. 14, 2029–2060. doi: 10.1007/s10531-004-4283-y
Borges, P. A., Vieira, V., Amorim, I. R., Bicudo, N., Fritzén, N., Gaspar, C., et al. (2010). “List of arthropods (Arthropoda),” in A List of the Terrestrial and Marine Biota from the Azores, eds P. A. V. Borges, A. Costa, R. Cunha, R. Gabriel, V. A. Gonçalves, F. Martins, et al. (Cascais: Princípia), 179–246.
Brown, J. H., Ernest, S. M., Parody, J. M., and Haskell, J. P. (2001). Regulation of diversity: maintenance of species richness in changing environments. Oecologia 126, 321–332. doi: 10.1007/s004420000536
Calvert, A. T., Moore, R. B., McGeehin, J. P., and da Silva, A. M. R. (2006). Volcanic history and 40Ar/39Ar and 14C geochronology of Terceira Island, Azores, Portugal. J. Volcanol. Geotherm. Res. 156, 103–115. doi: 10.1016/j.jvolgeores.2006.03.016
Cardoso, P., Rigal, F., Borges, P. A., and Carvalho, J. C. (2014). A new frontier in biodiversity inventory: a proposal for estimators of phylogenetic and functional diversity. Methods Ecol. Evol. 5, 452–461. doi: 10.1111/2041-210x.12173
Chichorro, F., Juslén, A., and Cardoso, P. (2019). A review of the relation between species traits and extinction risk. Biol. Conserv. 237, 220–229. doi: 10.1016/j.biocon.2019.07.001
Chichorro, F., Urbano, F., Teixeira, D., Väre, H., Pinto, T., Brummitt, N., et al. (2020). Species traits predict extinction risk across the tree of life. bioRxiv [Preprint]. doi: 10.1101/2020.07.01.183053
Cornwell, W. K., Schwilk, D. W., and Ackerly, D. D. (2006). A trait-based test for habitat filtering: convex hull volume. Ecology 87, 1465–1471. doi: 10.1890/0012-9658(2006)87[1465:attfhf]2.0.co;2
Dolezal, J., Fibich, P., Altman, J., Leps, J., Uemura, S., Takahashi, K., et al. (2020). Determinants of ecosystem stability in a diverse temperate forest. Oikos 129, 1692–1703. doi: 10.1111/oik.07379
Gaspar, C., Borges, P. A. V., and Gaston, K. J. (2008). Diversity and distribution of arthropods in native forests of the Azores archipelago. Arquipélago Life Mar. Sci. 25, 1–30.
Gotelli, N. J., Shimadzu, H., Dornelas, M., McGill, B., Moyes, F., and Magurran, A. E. (2017). Community-level regulation of temporal trends in biodiversity. Sci. Adv. 3:e1700315. doi: 10.1126/sciadv.1700315
Hubbell, S. P. (2001). The Unified Neutral Theory of Biodiversity and Biogeography (MPB-32). Princeton, NJ: Princeton University Press.
Hubbell, S. P. (2013). Tropical rain forest conservation and the twin challenges of diversity and rarity. Ecol. Evol. 3, 3263–3274.
Hubbell, S. P., He, F., Condit, R., Borda-de-Água, L., Kellner, J., and ter Steege, H. (2008). How many tree species are there in the Amazon and how many of them will go extinct? Proc. Natl. Acad. Sci. U.S.A. 105(Suppl. 1), 11498–11504. doi: 10.1073/pnas.0801915105
Matthews, T. J., Triantis, K. A., Rigal, F., Borregaard, M. K., Guilhaumon, F., and Whittaker, R. J. (2016). Island species–area relationships and species accumulation curves are not equivalent: an analysis of habitat island datasets. Glob. Ecol. Biogeogr. 25, 607–618. doi: 10.1111/geb.12439
McGill, B. J., Chase, J., Hortal, J., Overcast, I., Rominger, A., Rosindell, J., et al. (2019). Unifying Macroecology and Macroevolution to answer fundamental questions about biodiversity. Glob. Ecol. Biogeogr. 28, 1925–1936. doi: 10.1111/geb.13020
McGill, B. J., Etienne, R. S., Gray, J. S., Alonso, D., Anderson, M. J., Benecha, H. K., et al. (2007). Species abundance distributions: moving beyond single prediction theories to integration within an ecological framework. Ecol. Lett. 10, 995–1015. doi: 10.1111/j.1461-0248.2007.01094.x
Mendez, V., Gill, J. A., Burton, N. H., Austin, G. E., Petchey, O. L., and Davies, R. G. (2012). Functional diversity across space and time: trends in wader communities on British estuaries. Divers. Distrib. 18, 356–365. doi: 10.1111/j.1472-4642.2011.00868.x
Mukundan, R. (2004). Some computational aspects of discrete orthonormal moments. IEEE Trans. Image Process. 13, 1055–1059. doi: 10.1109/tip.2004.828430
Mukundan, R., Ong, S. H., and Lee, P. A. (2001). Image analysis by Tchebichef moments. IEEE Trans. Image Process. 10, 1357–1364. doi: 10.1109/83.941859
Oliver, I., and Beattie, A. J. (1996). Invertebrate morphospecies as surrogates for species: a case study. Conserv. Biol. 10, 99–109. doi: 10.1046/j.1523-1739.1996.10010099.x
Petchey, O. L., and Gaston, K. J. (2006). Functional diversity: back to basics and looking forward. Ecol. Lett. 9,, 741–758. doi: 10.1111/j.1461-0248.2006.00924.x
Preston, F. W. (1948). The commonness, and rarity, of species. Ecology 29, 254–283. doi: 10.2307/1930989
Ricotta, C. (2005). Through the jungle of biological diversity. Acta Biotheor. 53, 29–38. doi: 10.1007/s10441-005-7001-6
Rigal, F., Cardoso, P., Lobo, J. M., Triantis, K. A., Whittaker, R. J., Amorim, I. R., et al. (2018). Functional traits of indigenous and exotic ground-dwelling arthropods show contrasting responses to land-use change in an oceanic island, Terceira, Azores. Divers. Distrib. 24, 36–47. doi: 10.1111/ddi.12655
Rosenzweig, M. L. (1995). Species Diversity in Space and Time. Cambridge: Cambridge University Press.
Scheiner, S. M. (2003). Six types of species-area curves. Glob. Ecol. Biogeogr. 12, 441–447. doi: 10.1046/j.1466-822x.2003.00061.x
Schweiger, O., Maelfait, J. P., Wingerden, W. V., Hendrickx, F., Billeter, R., Speelmans, M., et al. (2005). Quantifying the impact of environmental factors on arthropod communities in agricultural landscapes across organizational levels and spatial scales. J. Appl. Ecol. 42, 1129–1139. doi: 10.1111/j.1365-2664.2005.01085.x
Simons, N. K., Weisser, W. W., and Gossner, M. M. (2016). Multi-taxa approach shows consistent shifts in arthropod functional traits along grassland land-use intensity gradient. Ecology 97, 754–764.
Smith, A. B., Sandel, B., Kraft, N. J., and Carey, S. (2013). Characterizing scale-dependent community assembly using the functional-diversity–area relationship. Ecology 94, 2392–2402. doi: 10.1890/12-2109.1
Ter Steege, H., Pitman, N. C., Phillips, O. L., Chave, J., Sabatier, D., Duque, A., et al. (2006). Continental-scale patterns of canopy tree composition and function across Amazonia. Nature 443, 444–447. doi: 10.1038/nature05134
Ter Steege, H., Pitman, N. C., Sabatier, D., Baraloto, C., Salomão, R. P., Guevara, J. E., et al. (2013). Hyperdominance in the Amazonian tree flora. Science 342:1243092.
United Nations Environment Programme [UNEP] (1992). Convention on Biological Diversity. Nairobi: United Nations Environment Programme.
Villéger, S., Miranda, J. R., Hernandez, D. F., and Mouillot, D. (2012). Low functional β-diversity despite high taxonomic β-diversity among tropical estuarine fish communities. PLoS One 7:e40679. doi: 10.1371/journal.pone.0040679
White, H. J., Montgomery, W. I., Pakeman, R. J., and Lennon, J. J. (2018). Spatiotemporal scaling of plant species richness and functional diversity in a temperate semi-natural grassland. Ecography 41, 845–856. doi: 10.1111/ecog.03111
Whittaker, R. J., Rigal, F., Borges, P. A., Cardoso, P., Terzopoulou, S., Casanoves, F., et al. (2014). Functional biogeography of oceanic islands and the scaling of functional diversity in the Azores. Proc. Natl. Acad. Sci. U.S.A. 111, 13709–13714. doi: 10.1073/pnas.1218036111
Wilcox, B. A. (1984). In situ Conservation of Genetic Resources: Determinants of Minimum Area Requirements. National parks, Conservation, and Development: The Role of Protected Areas in Sustaining Society. (Washington, DC: Smithsonian Institution Press), 825.
Keywords: functional diversity, moments, functional species abundance distribution, functional species-area relationship, traits combination
Citation: Alirezazadeh S, Borges PAV, Cardoso P, Gabriel R, Rigal F and Borda-de-Água L (2021) Spatial Scaling Patterns of Functional Diversity. Front. Ecol. Evol. 9:607177. doi: 10.3389/fevo.2021.607177
Received: 16 September 2020; Accepted: 29 January 2021;
Published: 22 February 2021.
Edited by:
Ruscena P. Wiederholt, Everglades Foundation, United StatesReviewed by:
Buntarou Kusumoto, University of the Ryukyus, JapanCong Liu, Harvard University, United States
Copyright © 2021 Alirezazadeh, Borges, Cardoso, Gabriel, Rigal and Borda-de-Água. This is an open-access article distributed under the terms of the Creative Commons Attribution License (CC BY). The use, distribution or reproduction in other forums is permitted, provided the original author(s) and the copyright owner(s) are credited and that the original publication in this journal is cited, in accordance with accepted academic practice. No use, distribution or reproduction is permitted which does not comply with these terms.
*Correspondence: Luís Borda-de-Água, bGJhZ3VhQGdtYWlsLmNvbQ==
†Present address: Saeid Alirezazadeh, C4–Cloud Computing Competence Centre (C4-UBI), UBIMedical, Covilhã, Portugal