 Rocco F. Notarnicola
 Adrienne B. Nicotra
 Loeske E. B. Kruuk
 Pieter A. Arnold
- Division of Ecology and Evolution, Research School of Biology, The Australian National University, Canberra, ACT, Australia
Climate change is generating both sustained trends in average temperatures and higher frequency and intensity of extreme events. This poses a serious threat to biodiversity, especially in vulnerable environments, like alpine systems. Phenotypic plasticity is considered to be an adaptive mechanism to cope with climate change in situ, yet studies of the plastic responses of alpine plants to high temperature stress are scarce. Future weather extremes will occur against a background of warmer temperatures, but we do not know whether acclimation to warmer average temperatures confers tolerance to extreme heatwaves. Nor do we know whether populations on an elevational gradient differ in their tolerance or plasticity in response to warming and heatwave events. We investigated the responses of a suite of functional traits of an endemic Australian alpine herb, Wahlenbergia ceracea, to combinations of predicted future (warmer) temperatures and (relative) heatwaves. We also tested whether responses differed between high- vs. low-elevation populations. When grown under warmer temperatures, W. ceracea plants showed signs of acclimation by means of higher thermal tolerance (Tcrit, T50, and Tmax). They also invested more in flower production, despite showing a concurrent reduction in photosynthetic efficiency (Fv/Fm) and suppression of seed production. Heatwaves reduced both photosynthetic efficiency and longevity. However, we found no evidence that acclimation to warmer temperatures conferred tolerance of the photosynthetic machinery to heatwaves. Instead, when exposed to heatwaves following warmer growth temperatures, plants had lower photosynthetic efficiency and underwent a severe reduction in seed production. High- and low-elevation populations and families exhibited limited genetic variation in trait means and plasticity in response to temperature. We conclude that W. ceracea shows some capacity to acclimate to warming conditions but there is no evidence that tolerance of warmer temperatures confers any resilience to heatwaves.
Introduction
Global climate change is threatening biodiversity and increasing extinction risk across diverse taxa and natural systems (Williams et al., 2008). Climate change is manifested as both gradual rises in average temperatures and increased frequency of extreme weather events such as heatwaves (rare and intense climatic conditions; Harris et al., 2018). A heatwave is an extreme weather event in which air temperatures are substantially elevated above the mean for several consecutive days; these events are predicted to continue to increase in frequency, intensity (+3°C) and duration into the future (Cowan et al., 2014). Extreme events in concert with the sustained increase of mean temperature will likely affect species abundance and persistence, as well as interactions, and thus may affect community and ecosystem structure, function and food webs (Grimm et al., 2013; Wernberg et al., 2013; Kortsch et al., 2015; Harris et al., 2018).
Extreme events may exert stronger selection pressures on natural populations of plants and animals than more gradual, sustained changes in mean climatic parameters (Reyer et al., 2013; Kingsolver and Buckley, 2017). Heatwaves are associated with decreased biomass production and survival in plants (French et al., 2017; 2019). Previous studies have shown that plants can withstand heatwave events (Hoover et al., 2014; Poirier et al., 2012), but are negatively affected when heatwaves are concurrent with other stressors such as drought (De Boeck et al., 2016). Although heatwaves in future will occur in conjunction with warmer mean temperatures, to the best of our knowledge, the interaction between gradual warming and extreme heatwaves has only been investigated in two studies. Aspinwall et al. (2019) found that Eucalyptus species were more susceptible to heatwaves if grown under warmer temperatures, while Drake et al. (2018) found no differences in tolerance of heatwaves when Eucalyptus parramattensis was grown in warmer environments. Thus, to date, relatively little is known about the combined impact of exposure to both rising mean temperature and extreme events, or the extent to which exposure to the former might confer some form of resilience to the latter.
The effect of climate change is also expected to be stronger in vulnerable environments, such as alpine ecosystems (i.e., the portion of a mountain above the treeline), where mean air temperatures have increased twice as fast as lowland environments during the last century (Gobiet et al., 2014). Species endemic to alpine environments are further restricted by physical limitations on dispersal (Lara-Romero et al., 2014; Morgan and Venn, 2017), such that high elevation species may be increasingly confined to ever higher mountain peaks. These species are predicted to be progressively replaced at lower elevations by invasive or more competitive species from warmer sites as temperatures rise, and in some places species composition changes have already occurred (Pauli et al., 2012; French et al., 2017; Steinbauer et al., 2018). Further, to our knowledge, no study has looked at the interactions between warmer temperatures and heatwaves in alpine plants.
Within alpine environments, elevation is a key driver of climatic differences. While microclimatic conditions can vary at the same elevations because they are modulated by interactions of topographic and abiotic factors (Körner, 2003), climatic trends can be identified along elevation gradients. For example, solar radiation under a clear sky increases with elevation, while air temperature, atmospheric pressure, mineralization processes in the soil, and plant evapotranspiration all decrease (Körner, 2003, 2007). Snow cover lasts for longer at higher elevations, resulting in shorter growing seasons (spring and summer; Körner, 2003). It is therefore plausible that intraspecific phenotypic differentiation and adaptation occur between relatively high and relatively low elevation populations of alpine species (from now on, high- and low-elevation populations). Indeed, intraspecific trait differentiation along altitudinal gradients has been found in several plant species in morphology, phenology and growth (Vitasse et al., 2014; Nicotra et al., 2015; Halbritter et al., 2018). However, it is still not clear whether high- and low-elevation populations, adapted to their local climate, may also respond differently to the ongoing climate warming (Frei et al., 2014a; Vitasse et al., 2014; Hernández-Fuentes et al., 2015; Nicotra et al., 2015) or to weather extremes such as heatwaves.
Despite lower air temperatures at high elevations, alpine plants are frequently exposed to heat stress. Air and leaf temperatures are often decoupled: leaf temperatures can be up to 20°C above ambient temperatures on bright and warm days (Salisbury and Spomer, 1964). Higher solar radiation at high elevation exacerbates the decoupling because of passive warming by radiative heat, especially for metabolically active leaves (Körner, 2003). The leaf-air temperature decoupling is considered an adaptation to low air temperatures, since some typical alpine plant growth forms (prostrate and cushion) work as heat traps (Salisbury and Spomer, 1964; Körner, 2003; Buchner et al., 2015), but it may also expose plants to overheating (Buchner et al., 2015). Despite the frequency of heat stress events in alpine environments and the alarming threat imposed by climate change (both of which are accelerating), we currently know little about the ecophysiological responses of alpine plants to heat stress (Geange et al., 2021). To some extent, intraspecific variation in functional traits and plasticity over elevation gradients may alleviate the impact of climate change by providing standing genetic variation upon which selection can operate. Therefore, understanding how local adaptation influences plant responses to climate change is important to accurately predict resilience of alpine plants and the fate of alpine environments.
Phenotypic plasticity, defined as the capacity of individuals (or genotypes) to produce different phenotypes under different environments (Bradshaw, 1965), is commonly assumed to be an adaptive mechanism to cope with changing environmental conditions and persist in situ. Plastic changes have been documented for several plant functional traits under warming conditions (e.g., Atkin et al., 2006; Nicotra et al., 2008; Cochrane et al., 2015). Flowering time is frequently observed to shift to earlier in spring for most species under warmer temperatures (Frei et al.,2014a,b; Gugger et al., 2015). When water is not limiting, many plant species may benefit from mildly higher average growing temperature in terms of increasing above-ground biomass, which is constrained at low temperatures (De Frenne et al., 2011; Frei et al., 2014b; Rodríguez et al., 2015). The effect of warmer temperatures on plant reproduction (fitness) is highly species-specific, where some species increase flower production with higher temperatures (Frei et al., 2014a), others decrease (Scheepens and Stöcklin, 2013), or are unaffected (Choi et al., 2019). Seed production is less commonly used as fitness proxy in response to thermal stress, but studies on agricultural plants demonstrate that warming or heat stress during flowering strongly reduces seed production and individual seed weight (Young et al., 2004; Hampton et al., 2013; Alsajri et al., 2020), which can negatively affect seed viability and germination (Ledgard and Cath, 1983; Veselá et al., 2020; Ge et al., 2020).
The physiological status of plants, as well as the efficiency and rate of photosynthesis, can be measured using chlorophyll fluorescence that takes advantage of the light re-emitted as fluorescence to estimate the amount of light used in photosynthetic reactions, given that the two processes are antagonistic (Maxwell and Johnson, 2000). The basal chlorophyll fluorescence (F0, measured in the absence of photosynthetic light) measured while leaves are gradually heated generates temperature-fluorescence curves (T-F0 curves) to investigate thermal tolerance of plants. The critical temperature (Tcrit), corresponding to the temperature where a spike in F0 occurs, and T50 and Tmax, respectively the temperature at 50 and 100% relative F0, are thermal metrics associated with damage to the photosynthetic machinery and represent upper thermal limits of plant tolerance (Neuner and Pramsohler, 2006; Ducruet et al., 2007; Ilík et al., 2007). Thermal safety margins (the difference between Tcrit and maximum temperatures during treatments) can then be used to infer species’ vulnerability to climate change (Leon-Garcia and Lasso, 2019) because they identify temperature ranges that can significantly reduce species performance.
Plastic increases in Tcrit are associated with acclimation to higher temperatures (higher thermal tolerance) in many plant species (Downton et al., 1984; Weng and Lai, 2005; Buchner et al., 2017). In some cases, increases in Tcrit and Tmax can be induced after just a few minutes under high temperatures (Havaux, 1993), potentially giving resilience to short term fluctuations. Such plasticity is not universal; indeed, while for many plant species from different environments Tcrit can rise by up to 9°C under warmer temperatures (Downton et al., 1984; Buchner et al., 2017), for others changes in Tcrit are not observed, probably meaning that the plant is already operating close to its thermal limits in its natural environment (Krause et al., 2010, 2013). To our knowledge, no study has investigated the effect of a simulated heatwave on T-F0 parameters and it is still not clear whether the potential acclimation and plasticity in Tcrit or Tmax that some species demonstrate under warmer growth temperatures will enable them to cope better with heatwaves, especially in ecosystems that are most vulnerable to climate warming.
In this study, we examined plastic responses to climate warming and extreme heatwaves of an Australian endemic alpine herb, Wahlenbergia ceracea, from an elevation gradient. In Australia, the mean temperature has risen by 0.5°C since 1970 and is projected to increase up to 5°C by 2,100 (Harris et al., 2018). We grew plants in conditions mimicking historical and future (projected for 2,100) temperatures of the Australian Alps (Harris et al., 2016). During this period, half the plants in each treatment were also exposed to a heatwave (+5°C above their temperature treatment for 5 days). We measured a range of functional traits pertaining to the biology and ecology of the species, and used these measures to: (1) characterize plastic responses of W. ceracea families in response to warming and/or extreme heatwaves; (2) test for differences between high- and low-elevation populations in their plastic responses to temperature and heatwaves; and (3) evaluate whether there is variation in the extent of plastic responses between families (intraspecific variation in plasticity).
Materials and Methods
Study Species
Wahlenbergia ceracea Lothian (Campanulaceae; ‘waxy bluebell’) (Figure 1) is a short-lived perennial/biennial herb that grows in moist sites on high elevations in alpine and sub-alpine environments (Nicotra et al., 2015). This species is an Australian endemic that grows over a wide elevation gradient (1,550–2,100 m; Atlas of Living Australia, 2020) in Australian alpine regions. This species is hermaphroditic and facultatively autogamous, however, rates of autogamy in the wild are unknown. W. ceracea can be 10–60 cm tall and usually grows among shrubs and grasses in grassy herbfields above the treeline or in inverted treeline valleys and floodplains. From a previous investigation by Nicotra et al. (2015), W. ceracea plants grown at relatively warm temperatures (30/20°C day/night) emerge earlier, grow taller, and produce more leaves and capsules than individuals grown at relatively cool temperatures (20/10°C day/night). Individuals from lower elevations also express higher levels of plasticity compared to higher elevation conspecifics (Nicotra et al., 2015).
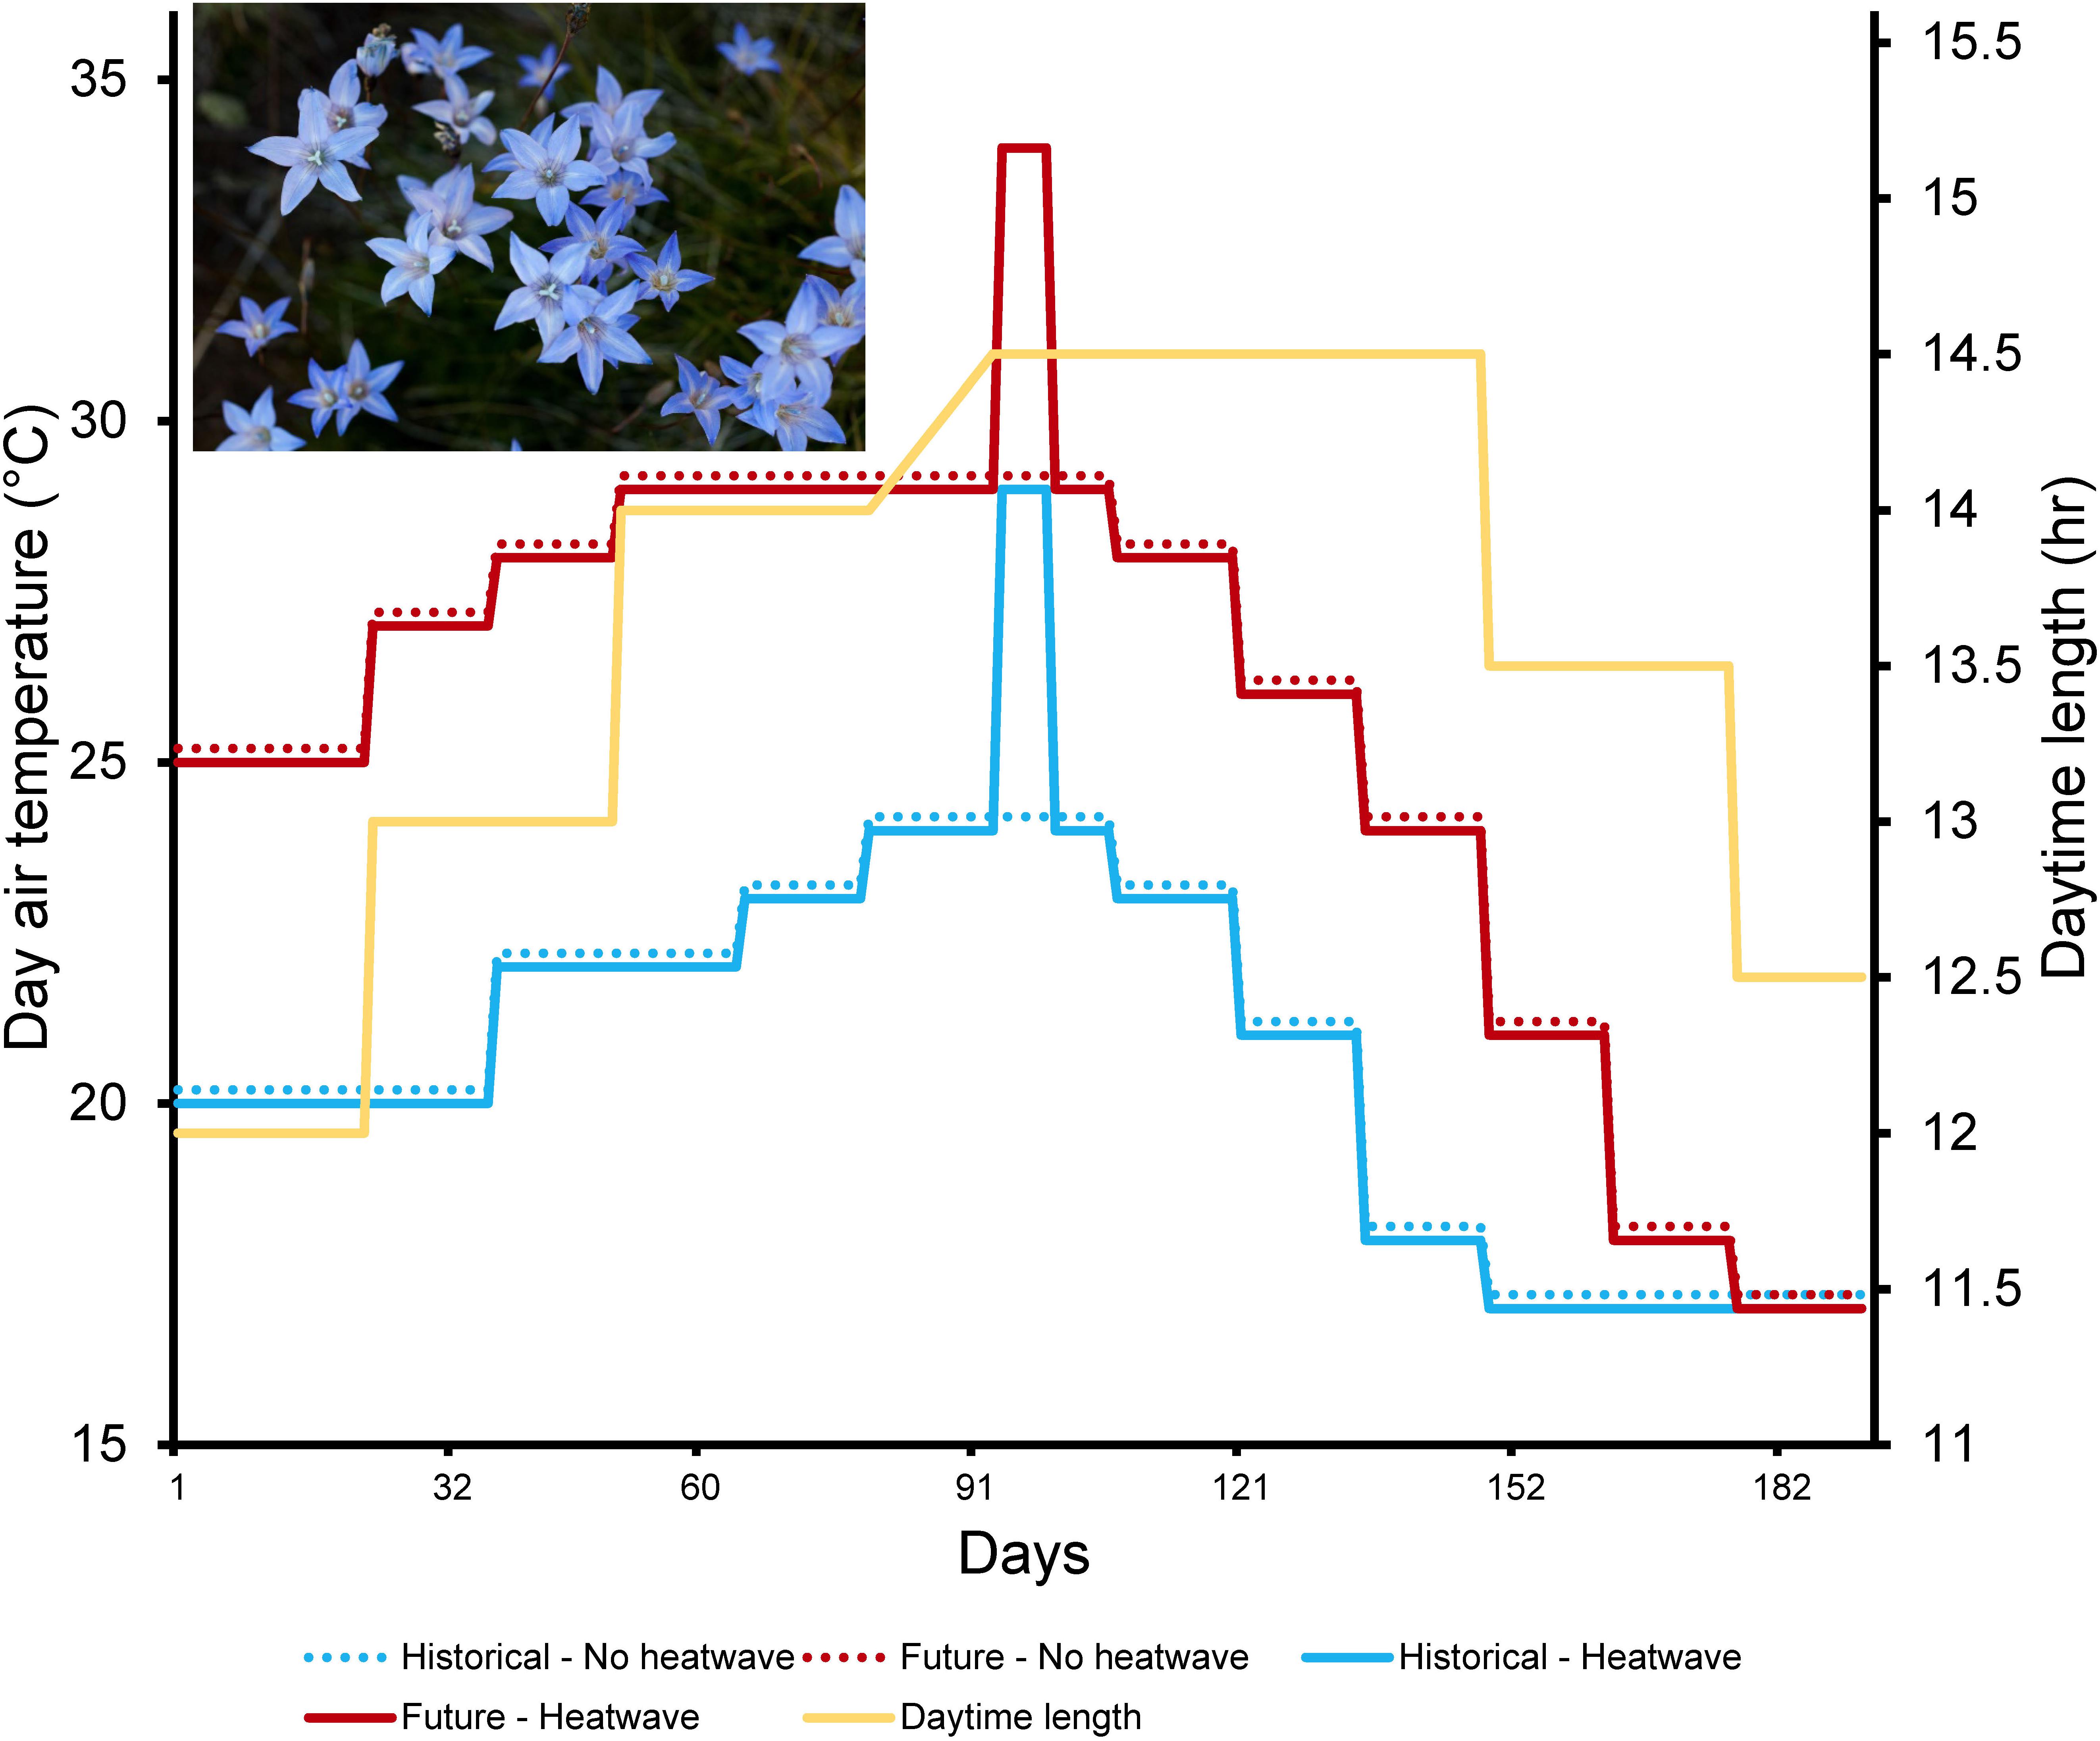
Figure 1. Day temperatures and photoperiod across the duration of the experiment. Toward the middle of summer individuals were exposed to a 5-day heatwave treatment (solid lines), while control individuals remained under constant conditions of a historical and future scenario (dotted lines). Light blue = historical climate scenario; red = future climate scenario; yellow = photoperiod. To ease the view of the lines, which would be otherwise overlapping, 0.2°C were added to the groups “Historical – No heatwave” and “Future – No heatwave” only for the purposes of drawing the graph. Inset: Wahlenbergia ceracea. Credit: T Hayashi, February 2015, Kosciuszko National Park.
Parental (F0) Seed Collection and Crossing to Generate F1
Seeds of W. ceracea were collected directly from capsules of plants in the field during two spring collection trips in mid-March 2015 and mid-April 2016, to form a base (F0) generation. The natural elevational range of the species was divided in two to select seeds from relatively low (1,590–1,765 m a.s.l.) to high (1,837–2,095 m a.s.l.) elevation populations, from Charlotte’s Pass up to Mount Kosciuszko (NSW, Australia), from plants that were growing at least 50 m apart. Individuals from these two elevation ranges have small, but significant genetic differentiation (Nicotra et al., 2015).
To minimize maternal effects and to ensure that each individual resulted from an outcross rather than self-cross of the mother plant, we generated an F1 generation by crossing F0 individuals. The F0 seeds (five seeds per pot from 100 plants, then reduced to one plant per pot) were grown from 20th July 2016 in soil in the glasshouse under controlled conditions of 20/15°C day/night, under natural photoperiod and then lights as natural daylight decreased. To maintain differences associated with elevation, we crossed F0 plants that on average differed in elevation by 21 m (minimum difference = 0 m, maximum difference = 48 m) but were not less than 50 m distance apart (altitudes where parental F0 seeds were collected and spatial distance of each parental pairs are presented in Supplementary Table 1). Parents of each family were on average 2.33 km apart. There were 65 F0 crosses that produced F1 seeds, and 52 of them were successful with at least 500 F1 seeds produced. Below, we refer to each cross as a family. From these, we chose the 15 families from the highest elevation crosses, and 15 from the lowest elevation crosses; these F1 families constitute full siblings.
Plant Materials, Growth Conditions and Temperature Treatments
We sowed seeds of each family in seed raising mix in 50 mm diameter pots (three seeds per pot) that were then placed in two growth chambers (Phoenix room; Phoenix Research, Envirotec Pty. Ltd.; SA, Australia) at 25/15°C day/night to encourage early growth (12/12 h day/night length; photosynthetically active photon flux density (PPFD) = 330 μmol s–1 m–2; RH = 70 ± 10%). Four to six weeks after germination, when the diameter of the rosette (tip-to-tip between the largest two leaves) was at least 15 mm, we selected 12 seedlings from each family and transplanted them into larger pots (80 mm × 80 mm). For each family, seedlings of similar size were paired and then randomly allocated: one of each pair to each of two temperature treatments, which was repeated until all 12 seedlings in a family had been allocated to the two temperature treatments (2 elevation × 15 families × 2 temperatures × 6 replicate individuals = 360 plants). Within each chamber, we randomly assigned plants to one of three blocks, corresponding to different positions in the chamber. Each block contained two trays with one replicate of each family (five rows × six columns in each tray). Plants were given 7 days to recover from transplant shock before the historical and future climate scenario conditions were applied: one growth chamber with the ‘historical’ climate, and one growth chamber with the ‘future’ climate. Day 1 of the experiment is taken as the day on which the temperature treatments were applied.
Treatment temperatures (Supplementary Table 2 and Figure 1) were based on projections made using the Coupled Model Intercomparison Project Phase 6 (CMIP6) using the worst-case climate scenario (Representative Concentration Pathways, RCP8.5; Harris et al., 2014). The historical scenario treatment corresponds to the base period in the projection (1960–1970), while the future scenario treatment corresponds to the projected period (2090–2100). We call the baseline period ‘historical’ because it reflects the recent climate to which natural systems are adapted to according to the World Meteorological Organization (WMO), although some changes in temperature have clearly happened since then (Harris et al., 2014). We averaged the base and projected maximum and minimum 10-year temperatures in 15-day intervals. We then corrected day temperatures to account for the difference between air and leaf temperature (see Salisbury and Spomer, 1964 and Supplementary Material) thus generating inside the chambers leaf temperatures experienced in the field. Temperature conditions in the growth chambers were then changed fortnightly, based on the averaged maximum (day) and minimum (night) historical base and future projected temperatures. Projected conditions resulted in higher temperatures (summer maximum day temperature: historical scenario = 24°C; future scenario = 29°C) and in a longer growing season (summer peak temperatures lasted 30 days under historical and 60 days under future scenario). Other conditions were held constant for both chambers (relative humidity = 80%; PPFD = 330 μmol s–1 m–2). The focus of this experiment was plastic responses to temperature in isolation, therefore plants were watered to saturation daily, twice per day during the seedling stage and the warmest weeks, under all treatments to ensure they were not water stressed. The experiment started with temperatures mimicking late spring (November) and finished with temperatures mimicking early autumn (early April). To induce senescence in the plants, we also changed day length in concert with each temperature change (Supplementary Table 2 and Figure 1), according to the relative period of the year. We note that since the growth chambers could not cope with large differences between day and night temperatures (which are typical of the Australian climate) for the future scenario, the night temperature was held at 20°C during the warmest weeks (Supplementary Table 2 and Figure 1). Selected night temperatures (Supplementary Table 2) depended on the chambers capacity to reach those temperatures and maintain temperature excursion between night and day.
In the middle of the experimental summer, we exposed half the plants in each temperature treatment to a heatwave. One tray per block from each growth chamber was transferred to one of two ‘heatwave chambers’ (TPG-2400-TH; Thermoline Australia Pty Ltd.; NSW, Australia), which was set to +5°C above the growth chamber’s temperature (29/17°C day/night for historical climate scenario, and 34/25°C for the future climate; Figure 1); other conditions were identical to the growth chambers. Trays were moved to the heatwave chamber sequentially starting day 88 and ending day 94 of the experiment, and then remained in the heatwave chambers for 5 days (heatwave: ‘hw’), after which they were moved back to their original growth chambers; the last group of plants therefore left the heatwave chambers on the 98th day of experiment. All non-heatwave (‘no hw’) plants remained in their original growth chambers throughout this time (Figure 1). From day 100 onward, plants continued in the future vs. historical climate conditions, and the experiment was ended at day 191 (from when the temperature treatments were first applied).
Traits Measured
We measured a range of phenotypic traits reflecting different aspects of the phenology, physiology, growth and reproduction of W. ceracea. Measures were made on a total of 321 plants (out of the 360, see above) because 39 individuals died prior to exposure to the heatwaves.
Thermal Physiology
Chlorophyll content was measured by means of a SPAD-meter (SPAD-502; Konica Minolta, Inc., Tokyo, Japan) on the same day that the plant produced its first flower (maturity), therefore before the heatwave treatment. Measurements were taken as the average value of three spot measurements on the youngest fully-expanded green leaf from the main stem.
After the 5-day heatwave treatment, we removed one leaf per plant from both heatwave and non-heatwave plants to measure the potential quantum efficiency of photosystem II (Fv/Fm) and the temperature dependence of basal chlorophyll fluorescence. Harvested leaves were placed on a Peltier plate (CP-121HT; TE Technology, Inc., Traverse City, MI, United States) set to a constant ambient temperature (21 ± 1°C) and leaves were dark-adapted for 30 min.
After dark adaptation, we measured minimum chlorophyll fluorescence (F0) (i.e., fluorescence in absence of photosynthetic light) and maximum fluorescence (Fm) (i.e., fluorescence after delivering to a saturating pulse for a short duration). Chlorophyll fluorescence was measured by means of a chlorophyll fluorescence imaging system (MAXI-Imaging-PAM; Heinz Walz GmbH, Effeltrich, Germany). We used the initial F0 and Fm parameters to calculate Fv/Fm as the ratio of (Fm − F0)/Fm (n = 276). Unfortunately, the Fv/Fm measurements for 43 individuals were not recorded due to software errors.
After measuring Fv/Fm, we raised the temperature of the Peltier plate from 21 to 60°C at a heating rate of 60°C h–1 (Schreiber and Berry, 1977; Arnold et al., 2020). We recorded F0 values every 10 s. The temperature of the leaf samples was measured using two type-T thermocouples that were attached to the underside of two randomly selected leaves. We logged the thermocouple data using a dual-channel data logger (EL-GFX-DTC; Lascar Electronics Ltd., Salisbury, United Kingdom). The average temperature of these two thermocouples was then used for all subsequent temperature calculations.
We visualized the temperature-fluorescence (T-F0) curves and extracted values for critical hot temperature (Tcrit), the temperature at 50% fluorescence (T50) and the temperature at maximum fluorescence (Tmax) values using the R Environment for Statistical Computing v3.5.2 (R Development Core Team, 2019) (Supplementary Figure 1). Tcrit (n = 319) corresponds to the inflection point in the curve, i.e., the temperature at which an abrupt increase in F0 is observed. We extracted Tcrit as the intersection between the two straight lines tangential to the flat and steep part of the curve, using a break-point regression analysis conducted with the ‘segmented’ R package (Muggeo, 2017). For those curves that reached a maximum F0 and then declined (n = 300) we were able to extract Tmax and T50. We included in the analysis the 19 individuals that did not reach a maximum F0 considering them as having Tmax = 61°C and calculating their T50 (see Supplementary Material). Removing those 19 individuals from the analysis did not change the pattern of the results.
We measured thermal safety margins for each individual as the difference between their Tcrit and the maximum temperature they experienced under the respective treatment (historical/no heatwave = 24°C; future/no heatwave = 29°C; historical/heatwave = 29°C; future/heatwave = 34°C).
Additional information about the Peltier plate and chlorophyll fluorescence imaging system and data extraction can be found in the Supplementary Materials of this paper and in Arnold et al. (2020).
Phenology, Longevity and Biomass
Flowering onset was recorded as the day since the imposition of historical and future scenarios treatments on which the first flower opened (n = 295 plants). Flowering phenology was recorded every day during the first 56 days, then as flowering rate declined, plants were checked every 10 days for the next 35 days. Sampling for flowering onset was ended at the beginning of the heatwave treatment. Of the 26 individuals (8.1%) for which we do not have phenological data, eight (2.5% of the total) did not flower, while 18 plants (5.6% of the total) flowered after the heatwave imposition and were included in the analysis as flowering on the 98th day (corresponding to 1 week after the last sampling event that happened on the 92nd day). Individuals recorded as flowering on day 98 were evenly spread among climate scenarios, however, 14 out of 18 were from low elevations. 12 families had at least one such individual; family F1.118 had three unsampled individuals and family F1.125 had four.
After the heatwave we recorded the day of death of all the individuals that died before the end of the experiment. Longevity following the heatwaves was monitored every 3–4 days throughout the experiment. The exception to this was the first 3 weeks after the heatwave period, for which detailed mortality dates were not recorded. For the 49 plants that died in this 3 weeks period, we assigned them an estimated death date of 11 days (Exclusion of these plants from the analysis did not change the conclusions). Longevity was defined as days since the end of the heatwave (n = 321).
Of the total 321 plants that were alive at the time of the heatwave treatment, 161 plants died prior to the end of the experiment. Of these, most plants died after the changing of photoperiod, which was progressively reduced starting from the 149th day (Supplementary Table 2 and Figure 1). Death of these plants was therefore mostly due to either the effect of our temperature treatments or to senescence. For the remaining 160 plants, at the end of the experiment (at 191 days since the imposition of climate treatments), we harvested the above-ground organs of all the plants that were still alive, placed them in bags and dried them at 70°C for at least 72 h, and then weighed the above-ground biomass. Therefore, we only measured the above-ground biomass on those individuals that survived until the end of the experiment.
Reproduction
We recorded the total number of flowers that each plant produced during the experiment and collected all seed capsules when these were mature. Seed capsules were stored in seed envelopes and stored in a desiccator for at least 36 weeks.
At the end of the experiment, we measured the total seed mass of the 236 plants that produced seed. We weighed three replicates of 50 seeds, calculated the average mass of 50 seeds and then obtained the average individual seed weight by dividing it by 50 (n = 233 plants). We estimated the total number of seeds produced (total seed production, n = 318) by one of three ways: (i) for the individuals with estimates of average individual seed weight, as the ratio between total seed mass and average individual seed weight; (ii) for seven individuals that produced fewer than 50 seeds, seeds were counted directly and the average individual seed weight was obtained as the ratio between total seed mass and total seed production; and (iii) for the 85 individuals that did not produce any seeds we assigned values of zero (results of the analysis without this last set of individuals are presented in Supplementary Table 3). Three individuals had unrealistically large estimates of the total seed production and were removed from the analysis. We also analyzed the probability of producing any seeds, assigning zero to individuals that did not produce seeds (85 individuals) and 1 to those that did (236 individuals).
Statistical Analysis
All traits were analyzed using linear mixed effect regression models fit by restricted maximum likelihood using the lmer function in ‘lme4’ R package (Bates et al., 2015) in R v3.5.2. Flowering onset and total seed weight were natural log-transformed before the analysis to obtain an approximately normal distribution, while Fv/Fm was multiplied by 10. The fixed effects were elevation (‘high’ or ‘low’), climate scenario (‘historical’ or ‘future’), heatwave (‘no heatwave’ or ‘heatwave’), the interactions between these factors and block (3 blocks), whereas random effects were ‘family’ (30 families) and ‘position’ within the block (30 positions). We fitted position as a random effect because plants that were at the edges of blocks experienced less shading and lower competition for light than plants in the middle, whereas plants in the middle of blocks may have received on average more water because of pooling on the benches. There was evidence for significant variance in the effect of position for longevity and biomass, and it explained a small amount of variance for the other traits. Therefore, we do not think position has affected the pattern of results. We removed random effects from the model structure when explaining zero variance: ‘family’ for Fv/Fm and Tmax and ‘position’ for seed production and individual seed weight.
We tested for all interactions, but as three-way interactions were never significant, we examined only two-way interactions (climate scenario × heatwave, elevation × climate scenario, elevation × heatwave); this is referred to as the ‘full random-intercept model’ from now on. Given that unconditioned main effects are incorrectly predicted when interactions are included in the model (because interactions contain the main effects they are composed of and because regression coefficients for one factor are estimated considering the other factors to be zero) we used models without any interactions between the main effects. To define whether there was statistical support for an effect of factors and interactions on traits, we evaluated P-values from each model, using the summary function of the ‘lmerTest’ R package (Kuznetsova et al., 2017).
We tested for variance in the intercept of plastic responses between families by means of a likelihood ratio test between the full random-intercept model and a model without the random effect of ‘family.’ We then fitted a model with additional random factors of the interaction between family and either climate scenario and heatwave treatment, a ‘full random-slopes model’ (specified as ‘climate scenario| family’ and/or ‘heatwave| family’). We tested for significant variation in the slopes of plastic responses of families to climate scenario and heatwave by means of a likelihood ratio test between the full random intercept model and full random slope models. The interaction between family and heatwave was never significant so we do not present results for it.
Date to first flower and chlorophyll content were recorded before the heatwave treatment, therefore the model for these trait did not include the fixed effects of heatwave treatment. All traits were fitted with lmer assuming a normal error distribution, with the exception of the number of flowers, total seed production and the probability of producing seeds. Of these, number of flowers and total seed production were analyzed using a generalized mixed effect model with a negative binomial distribution (glmer.nb function in ‘lme4’). The probability of producing seeds was analyzed using generalized mixed effects models (glmer function in ‘lme4’) with a binomial distribution. Longevity was analyzed using a proportional hazards Cox mixed effects model (coxme function in ‘coxme’ R package; Therneau, 2020). Again, the structure of fixed and random effects was identical to that for the other phenotypic traits.
Results for the traits seed mass, chlorophyll content and total seed production with lmer as well as details of the models are presented in Supplementary Tables 3, 4, respectively, and Supplementary Figure 2.
Results
Thermal Physiology
Both warmer average growth temperatures and exposure to heatwaves altered thermal physiology in W. ceracea, however, there was no evidence of differences between high- versus low-elevation families in these responses.
The photosynthetic efficiency (Fv/Fm) of W. ceracea was reduced by both growth under future temperatures and heatwaves (Table 1 and Figures 2A,B). Plants grown under future conditions showed a more extreme reduction in Fv/Fm when also exposed to a heatwave (Figure 2B) than did the plants grown under historical conditions (Table 1 and Figure 2A), however the effect of the interaction between climate treatment and heatwave was marginal (P-value = 0.025).
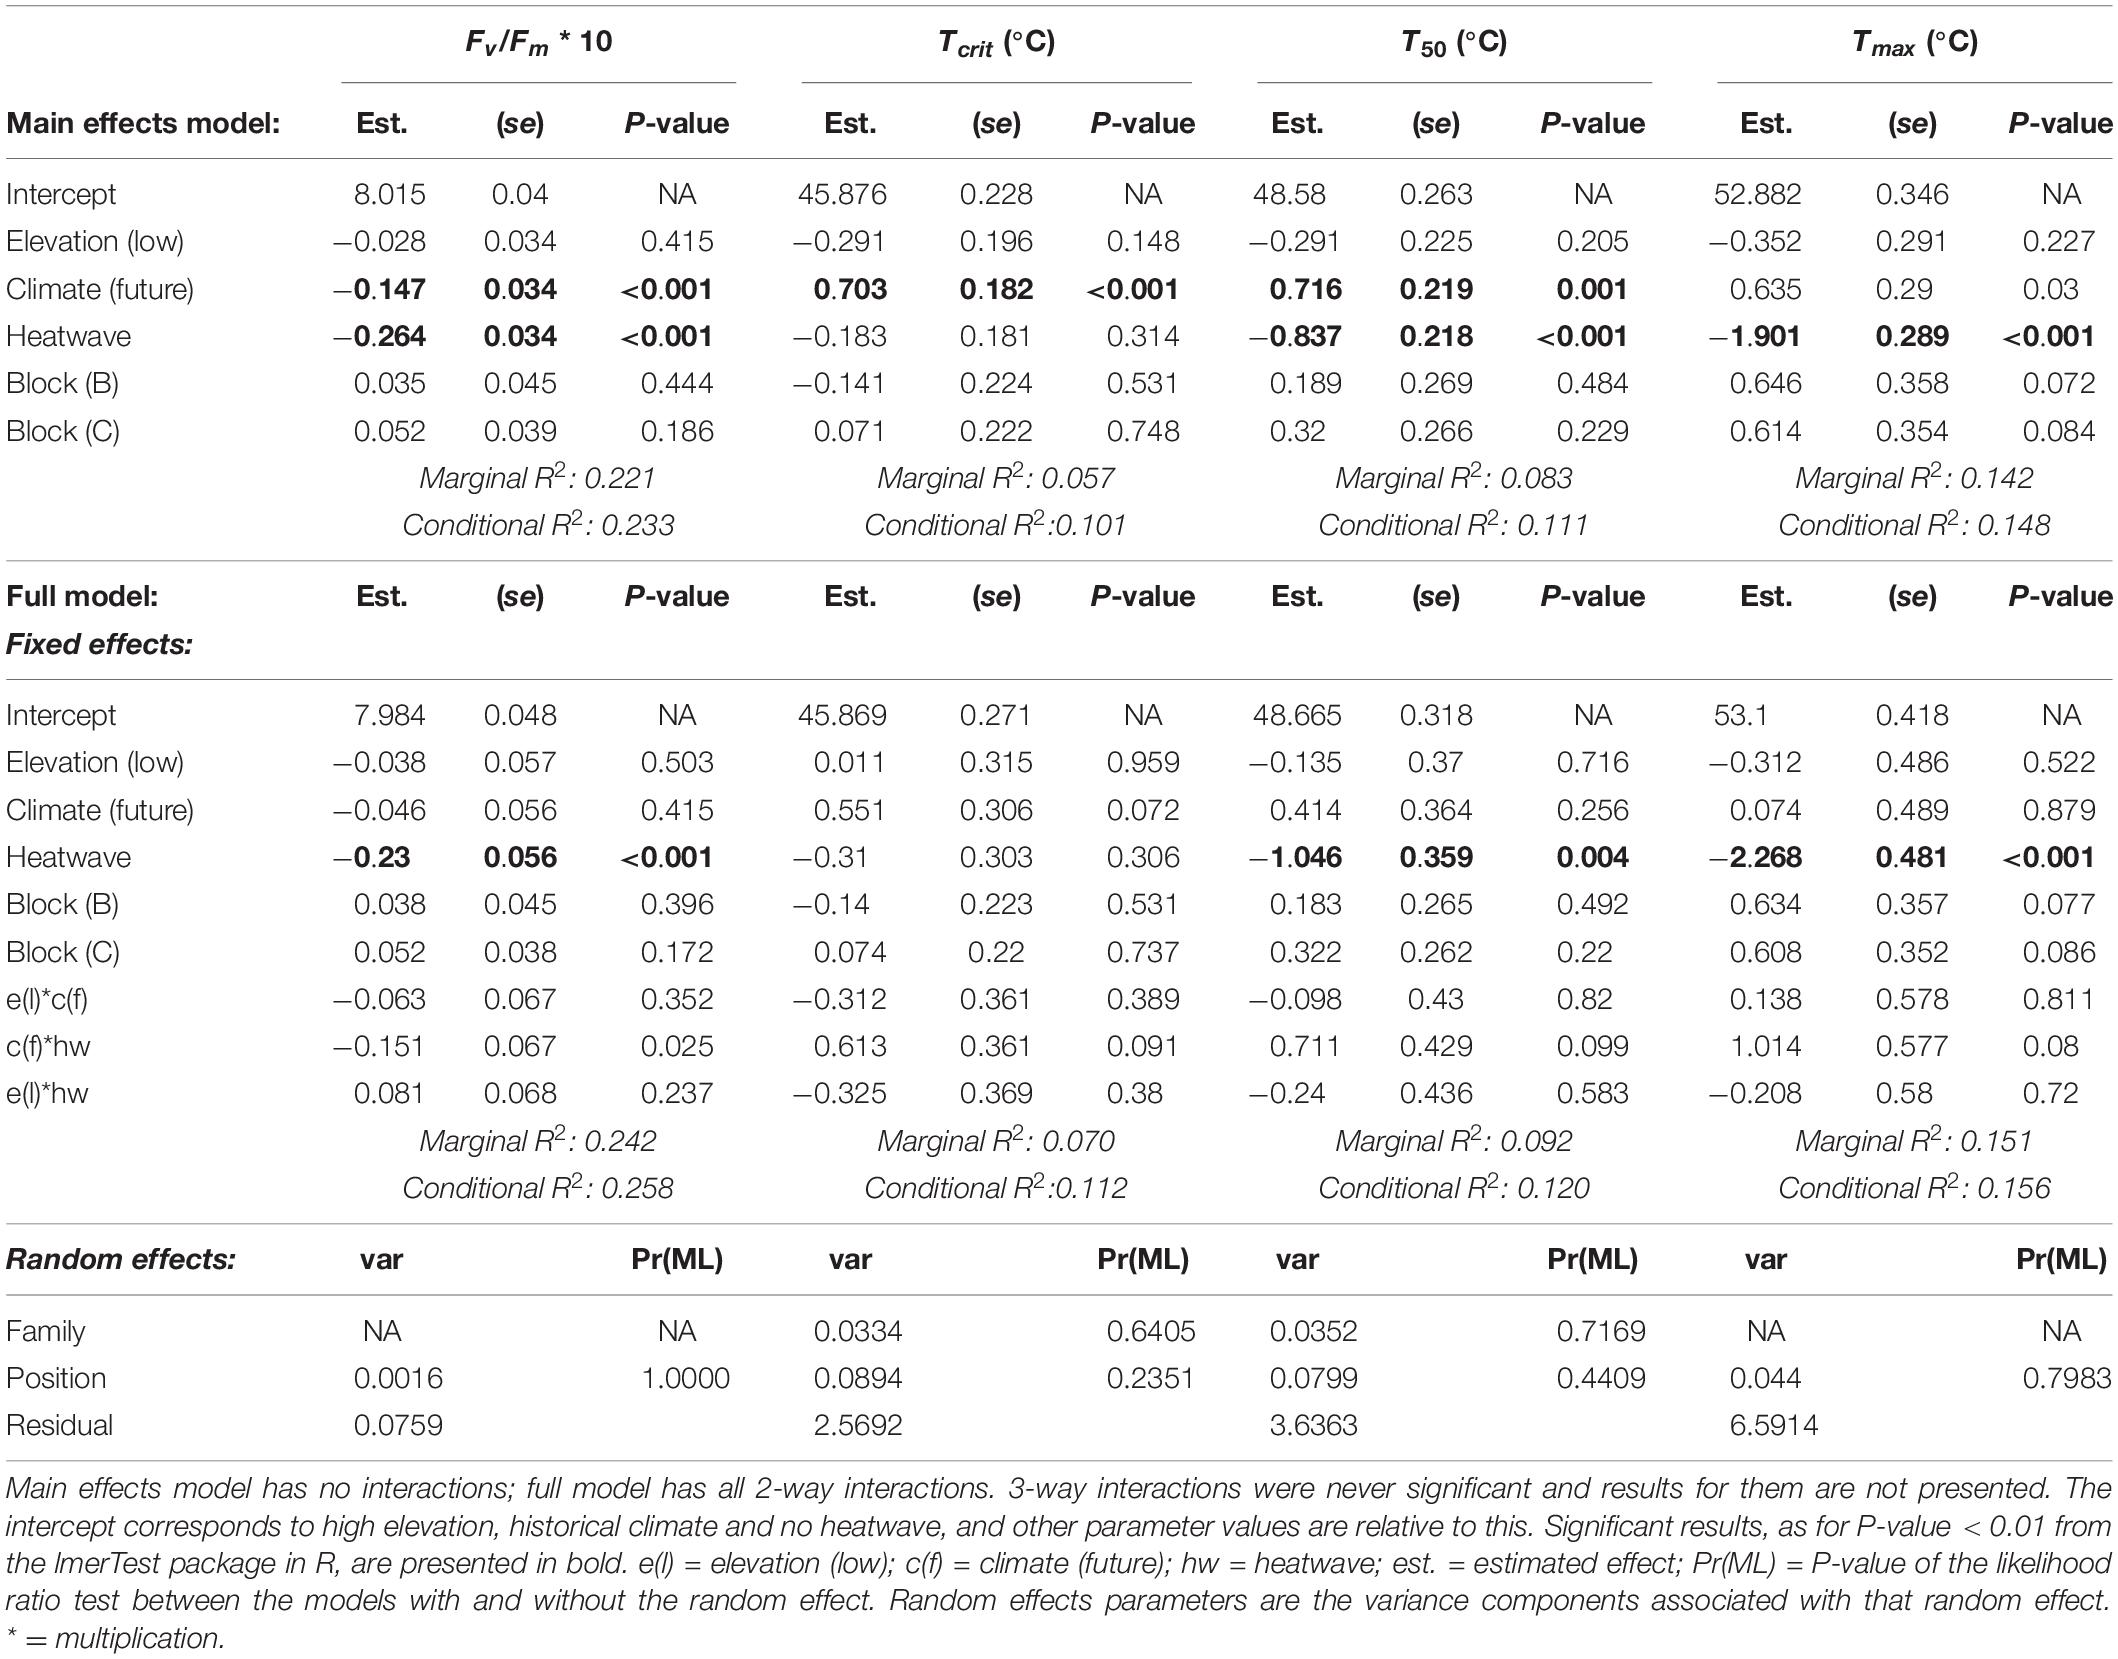
Table 1. Effects of temperature treatments on thermal physiology traits: results from linear random intercept models.
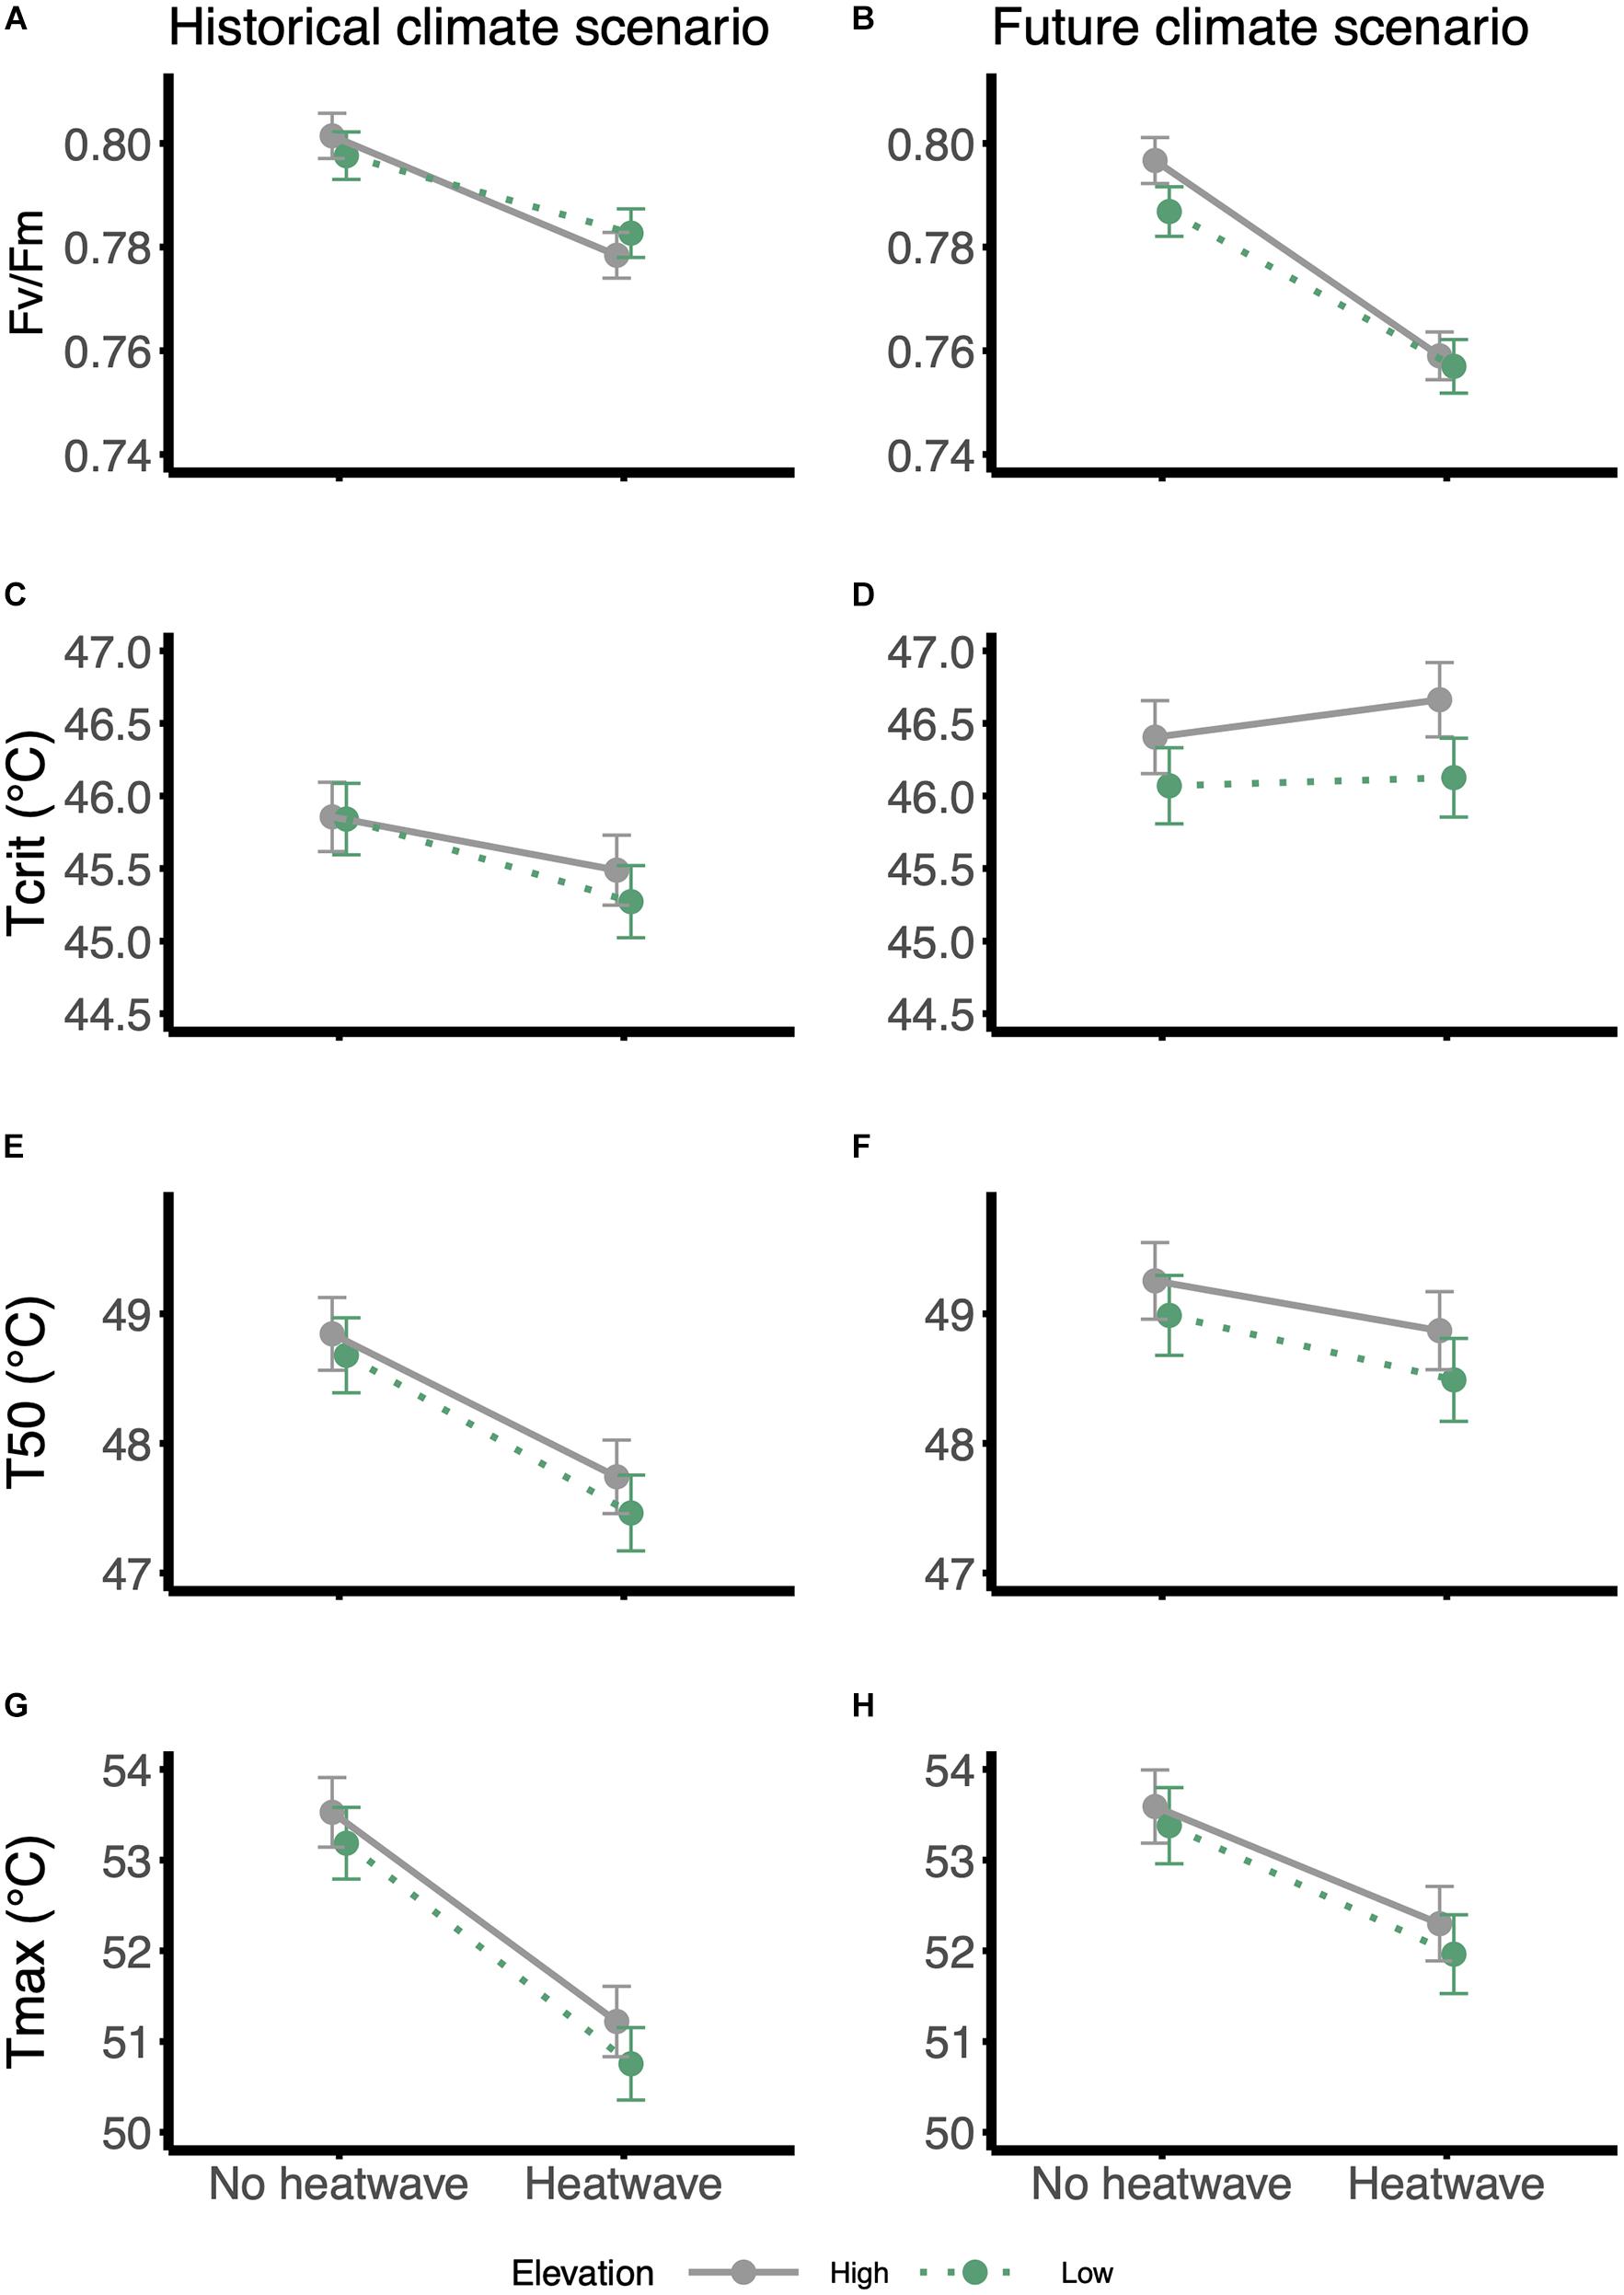
Figure 2. Reaction norms for thermal physiology traits in response to the heatwave treatment: (A,B) Fv/Fm, (C,D) Tcrit, (E,F) T50 and (G,H) Tmax. Panels on the left: historical climate scenario; panels on the right: future climate scenario. Gray and solid lines = high-elevation families; green and dotted lines = low-elevation families. Values were estimated from the models using the emmeans function in ‘emmeans’ package, in R; error bars are standard errors.
Despite the impairment of Fv/Fm, growth under future, warmer temperatures induced an increase in thermal tolerance limits of leaves (Table 1 and Figures 2C–H). Tcrit was on average 0.7°C higher under the future scenario (46.3 ± 0.1°C SE) than the historical (45.6 ± 0.1°C SE), and this difference is maintained in the other two parameters derived from the T-F0 curves, the temperature at 50% fluorescence (T50), and the temperature at maximum fluorescence (Tmax) (Table 1 and Figures 2C–H).
In contrast to the effects of growth conditions, exposure to a transient heatwave led to a reduction in both T50 and Tmax, but not in Tcrit, regardless of growth temperatures (Table 1 and Figures 2C–H). This trend was visible under both climate scenarios, but it was more pronounced under future temperatures where Tcrit was not affected by the heatwave (no hw = 46.2 ± 0.19°C SE vs. hw = 46.4 ± 0.20°C SE; Figure 2D), while under a historical scenario the heatwave consistently reduced thermal tolerance (no hw = 45.8 ± 0.18°C SE vs. hw = 45.4 ± 0.18°C SE; Figure 2C).
We did not find any evidence that the acclimation to future, warmer temperatures conferred resilience to heatwaves, as the effect of the interaction between heatwave and climate scenario on thermal tolerance metrics was negligible (Table 1). There was also no evidence of any effect of elevation (either as a main effect, or in an interaction) for any of the thermal physiology traits (Table 1).
Phenology, Longevity and Biomass
Families of W. ceracea from higher elevations flowered 9.6 ± 2.2 days SE earlier than families from lower elevations (Table 2 and Figure 3A). However, growth under a future, warmer scenario had little effect on flowering time, with plants flowering on average 1.0 ± 2.3 SE days earlier (Table 2 and Figure 3A).
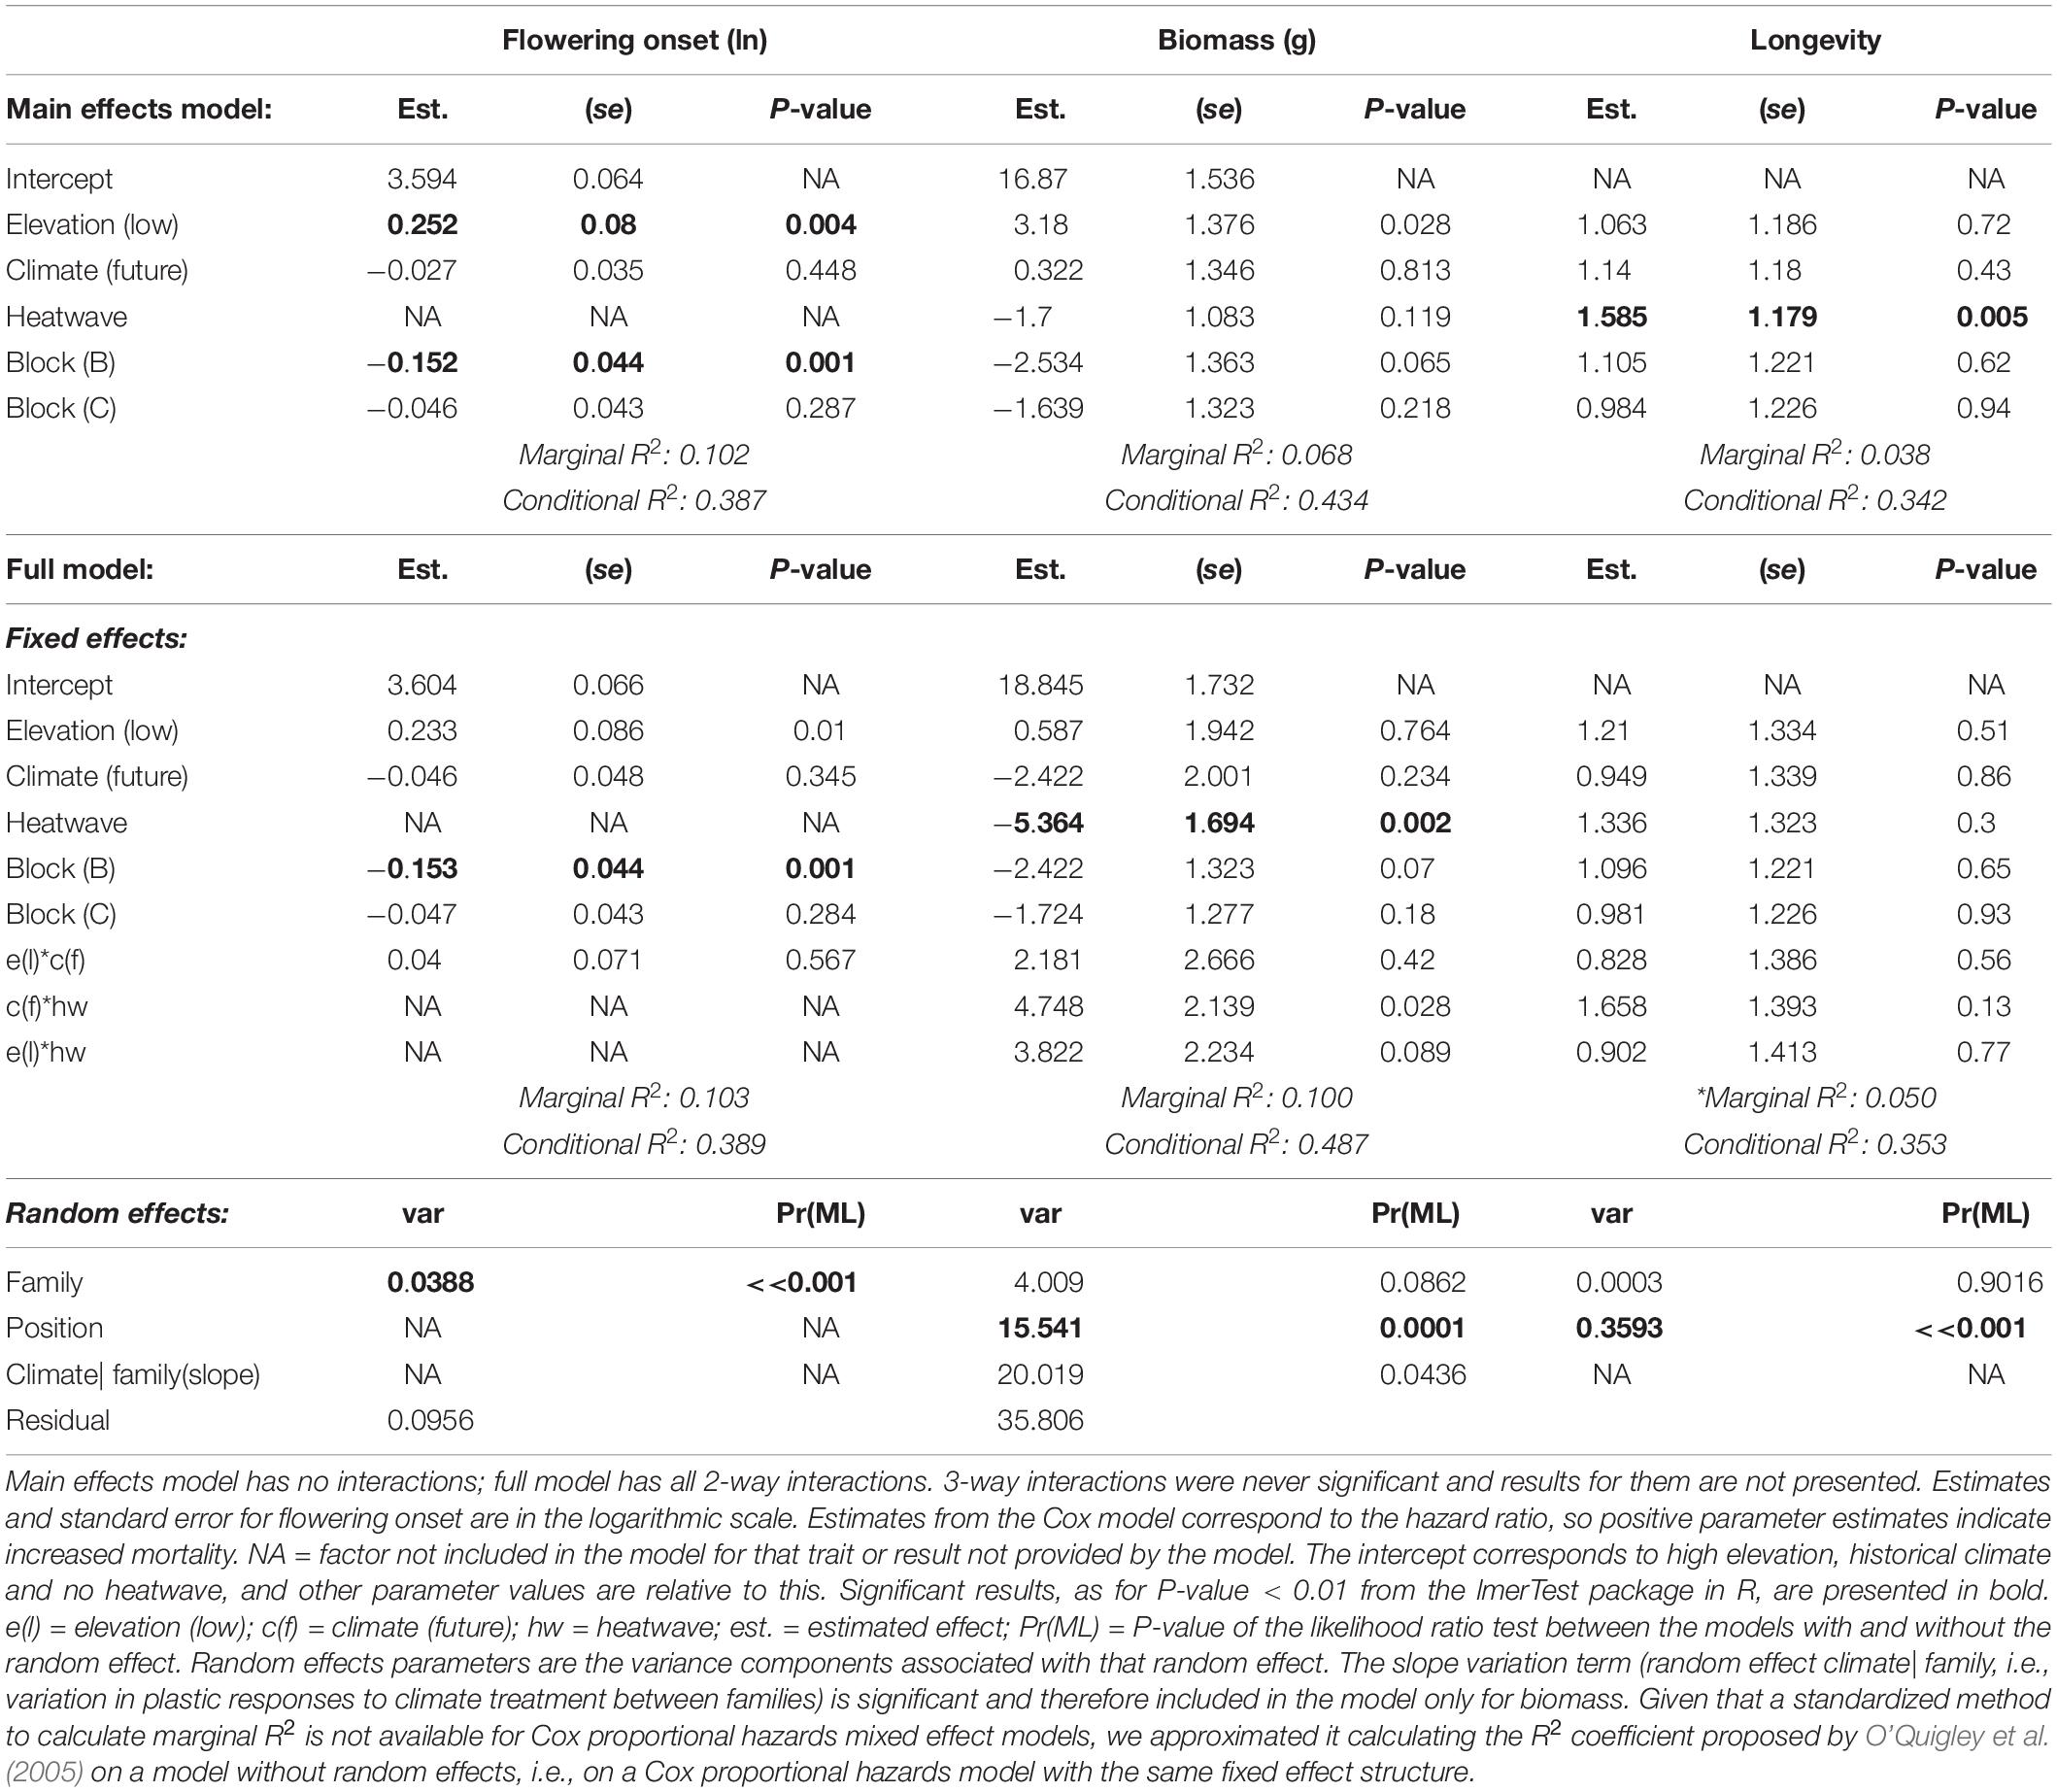
Table 2. Effects of temperature treatments on phenology, biomass and longevity: results from linear random intercept models (flowering onset), from linear random slope models (biomass) and from Cox proportional hazards model (longevity).
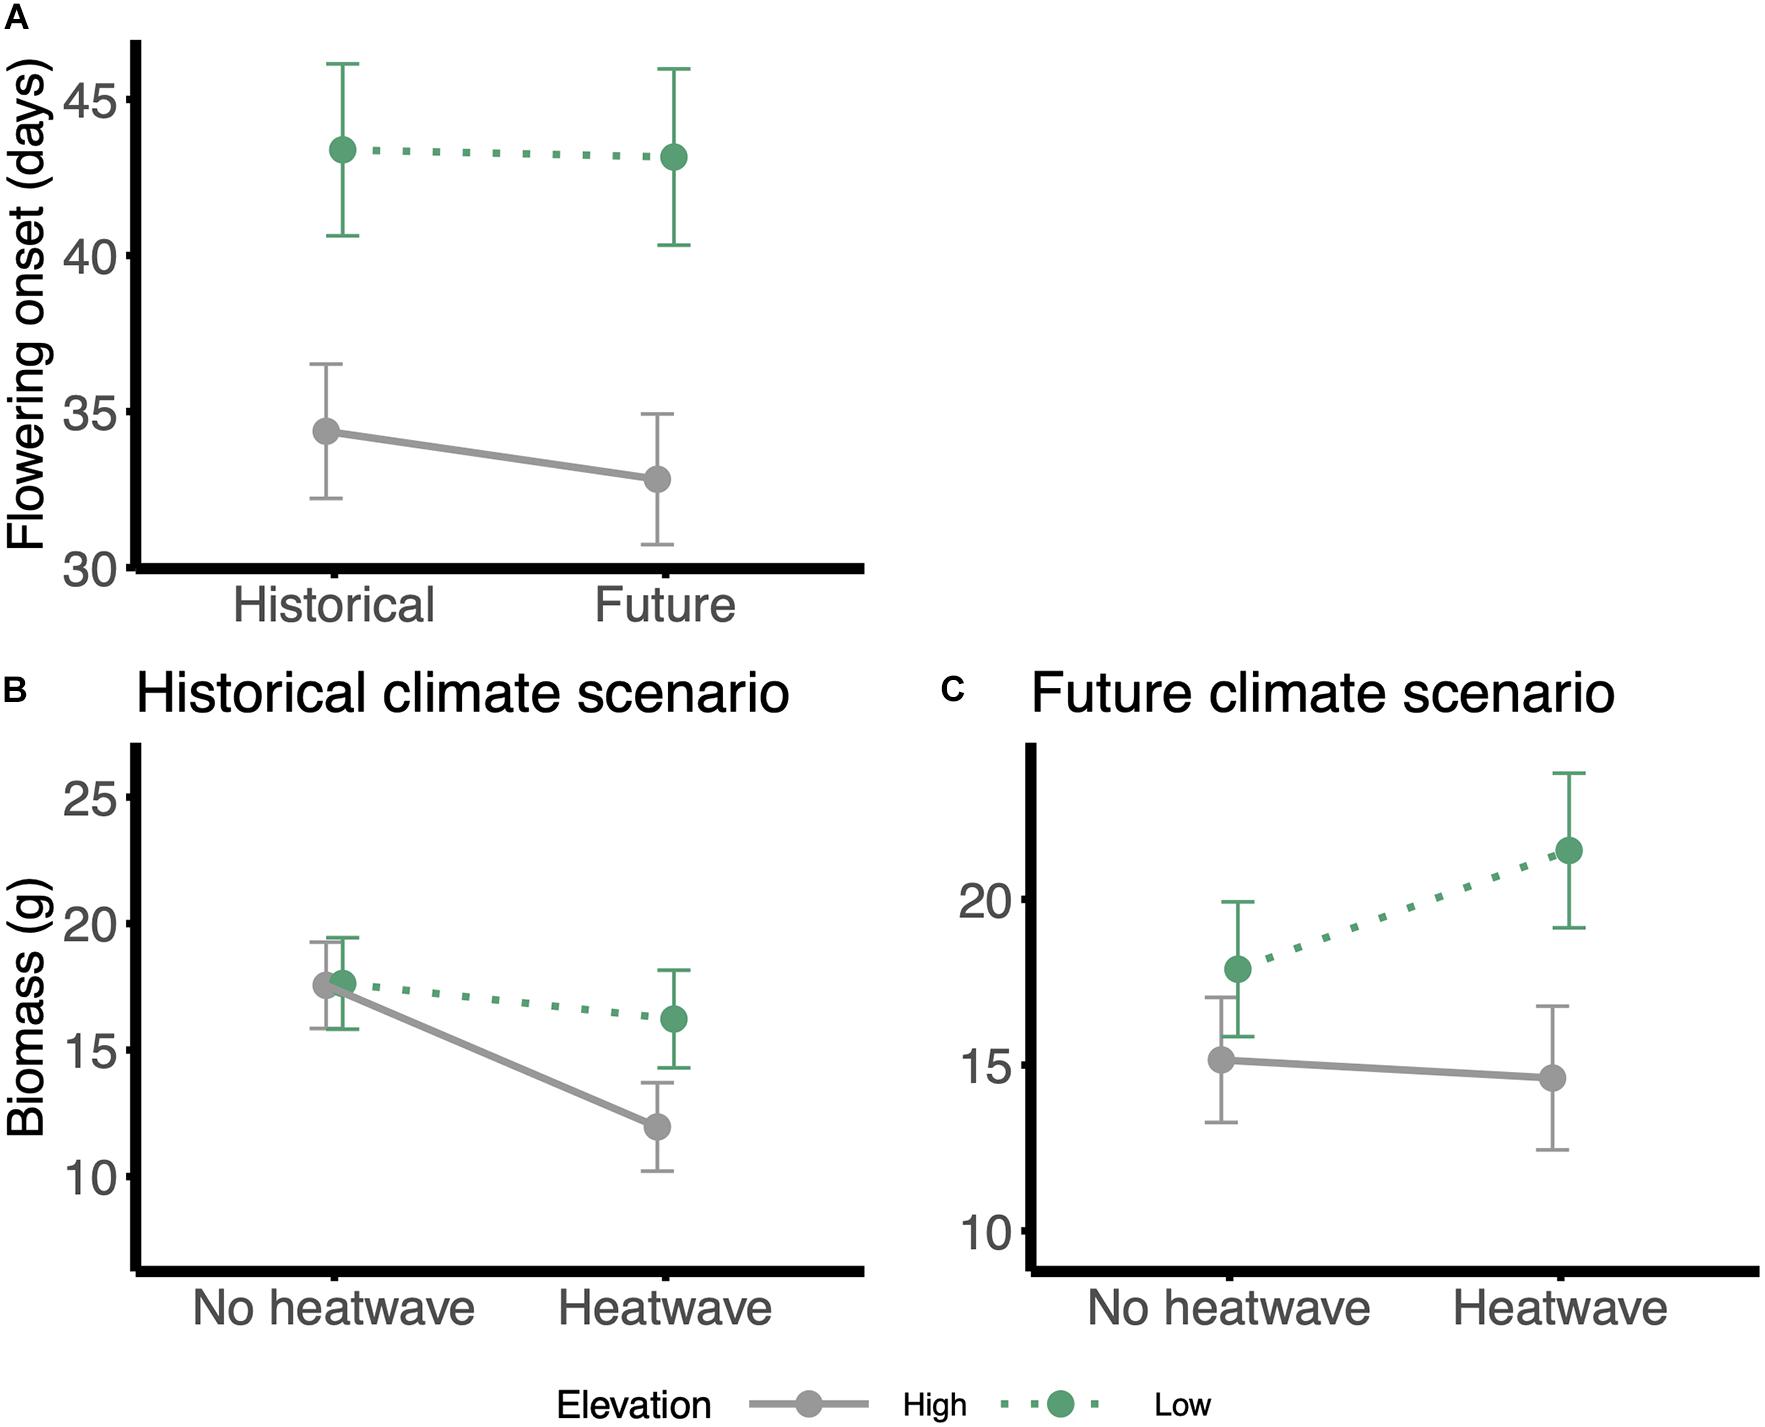
Figure 3. Reaction norms for phenology and biomass traits: (A) flowering onset in response to the climate scenario, (B,C) biomass in response to the heatwave treatment, panel on the left: historical scenario; panel on the right: future climate scenario. Gray and solid lines = high-elevation families; green and dotted lines = low-elevation families. Values were estimated from the models using the emmeans function in ‘emmeans’ package, in R; error bars are standard errors.
Under all treatment conditions, families from lower elevations produced more biomass than high-elevation families (Table 2 and Figures 3B,C). According to the main effects model, biomass of the individuals that survived until the end of the experiment was not affected by growth in a future, warmer scenario nor by exposure to heatwaves (Table 2 and Figures 3B,C). However, it seems that plants in historical conditions lost biomass, while those under future conditions accumulated biomass after a heatwave, although the effect of the interaction term between climate scenario and heatwave in our model is marginal (P-value = 0.028)(Table 2 and Figures 3B,C).
Before the heatwave exposure, mortality rates were low: 39 (out of the starting 360 plants, i.e., 10.3%) individuals (mostly from the future scenario treatment) died before heatwaves, presumably for reasons related to the conditions inside chambers, shading from neighboring larger plants, or poor initial health. We analyzed longevity from the end of the heatwaves to the end of the experiment. Toward the end of the experiment, as temperatures were lowered and day-length decreased, plants began to die. Longevity did not differ for high and low elevation plants (Table 2). The effect of climate scenario and of the interaction between climate scenario and heatwave on longevity were also negligible (Table 2). In absence of heatwaves, longevity remained high until the end of the experiment under both temperature conditions (Figure 4). However, when plants were exposed to heatwaves there was a substantial reduction in survival under both climate scenarios (Table 2 and Figure 4). Survival to the end of the experiment was 52.6 ± 4.1% SE for plants exposed to the heatwaves and 70.9 ± 3.6% SE for plants under non-heatwave growth conditions (Table 2 and Figure 4).
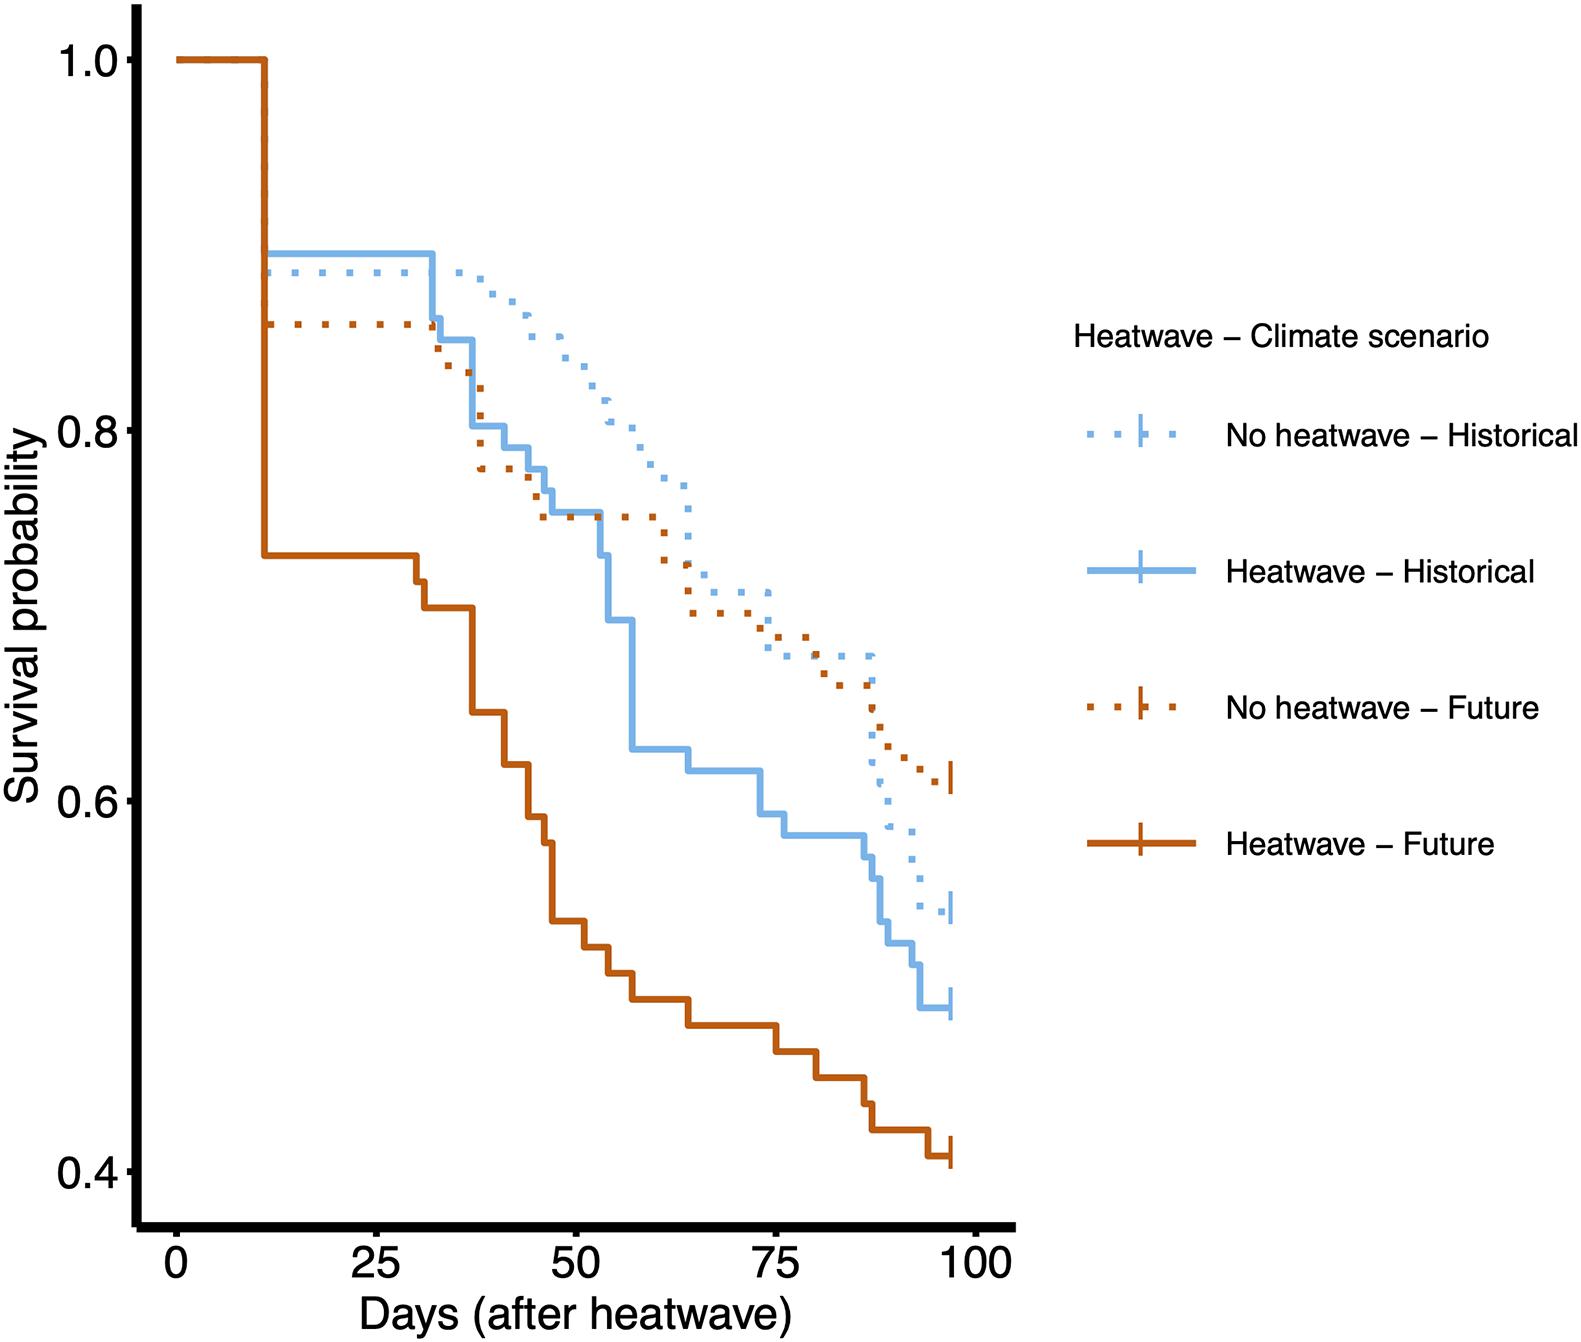
Figure 4. Kaplan–Meier survival graph by longevity, analyzed as days from the end of the heatwave treatment to the end of the experiment, for the 321 plants alive at this point. The graph shows results for the interaction between factors ‘Heatwave’ and ‘Climate scenario.’ Kaplan–Meier curves were obtained using the survfit function in ‘survival’ package (random effects in Cox mixed effect model explain little of the variance, therefore results can be assumed to be comparable to a model without them). Curves were plotted using the ggsurvplot function in ‘survminer’ package. Dotted lines = no heatwave; solid lines = heatwave. Blue lines = historical climate scenario; red lines = future climate scenario. The effect of elevation was not significant and is not presented in this graph.
Reproductive Traits
Wahlenbergia ceracea from high and low elevation origins and experiencing the two climate scenarios differed in their investment in reproduction and reproductive outcomes. Individuals belonging to families from high elevations overall produced more flowers (Table 3 and Figures 5A,B). Under a historical climate, they also produced nearly three times more seeds than low-elevation individuals (Table 3 and Figure 5C), however, that advantage was nullified under a future climate scenario (Figure 5D). Overall the individual seed weight was reduced under a future climate (Table 3 and Figures 5E,F). We found a weak interaction effect between elevation and climate scenario on individual seed weight: under historical conditions high-elevation plants produced heavier seeds than low-elevation ones, however, when grown under a future scenario, high-elevation individuals produced lighter seeds, while low elevation individuals were not affected (Table 3 and Figures 5E,F). High elevation individuals had higher probabilities of producing seeds under a historical climate than individuals from lower elevations, but they underwent a steep reduction in this probability when grown under a future climate (Table 3 and Figures 5G,H).
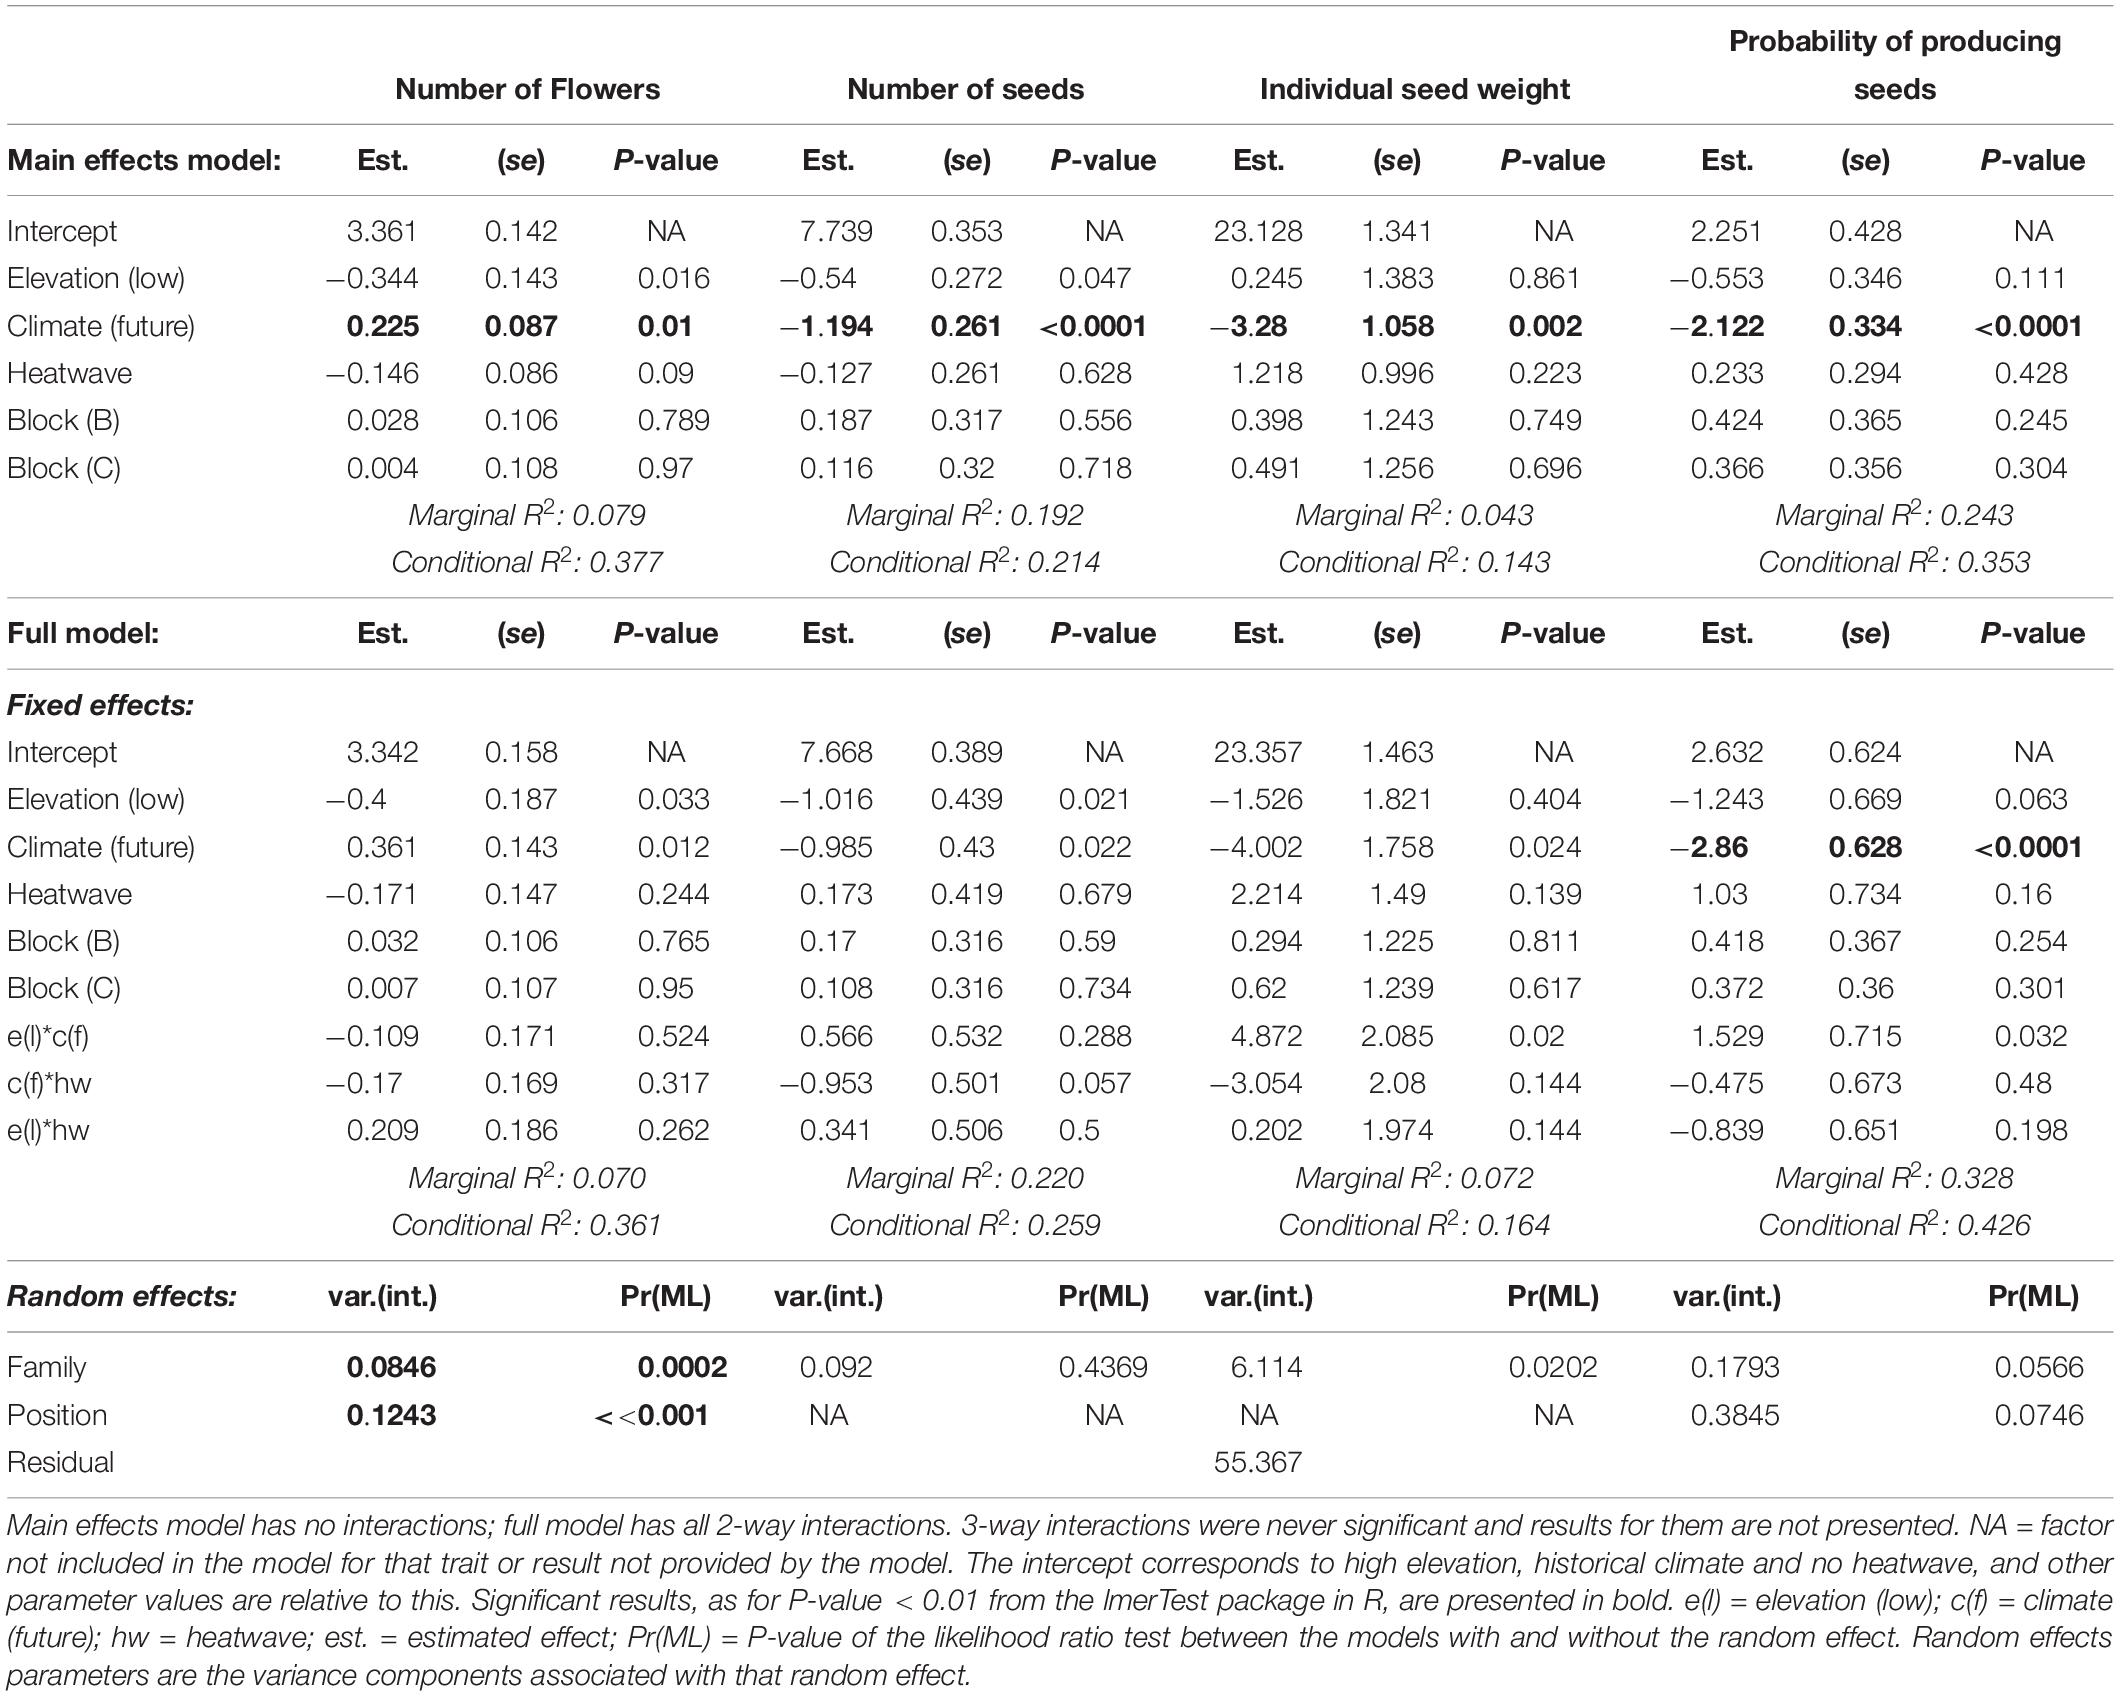
Table 3. Effects of temperature treatments on fitness traits: results from generalized random intercept models [number of flowers, probability of producing any seeds and seed production (n)] and from linear random intercept models (individual seed weight).
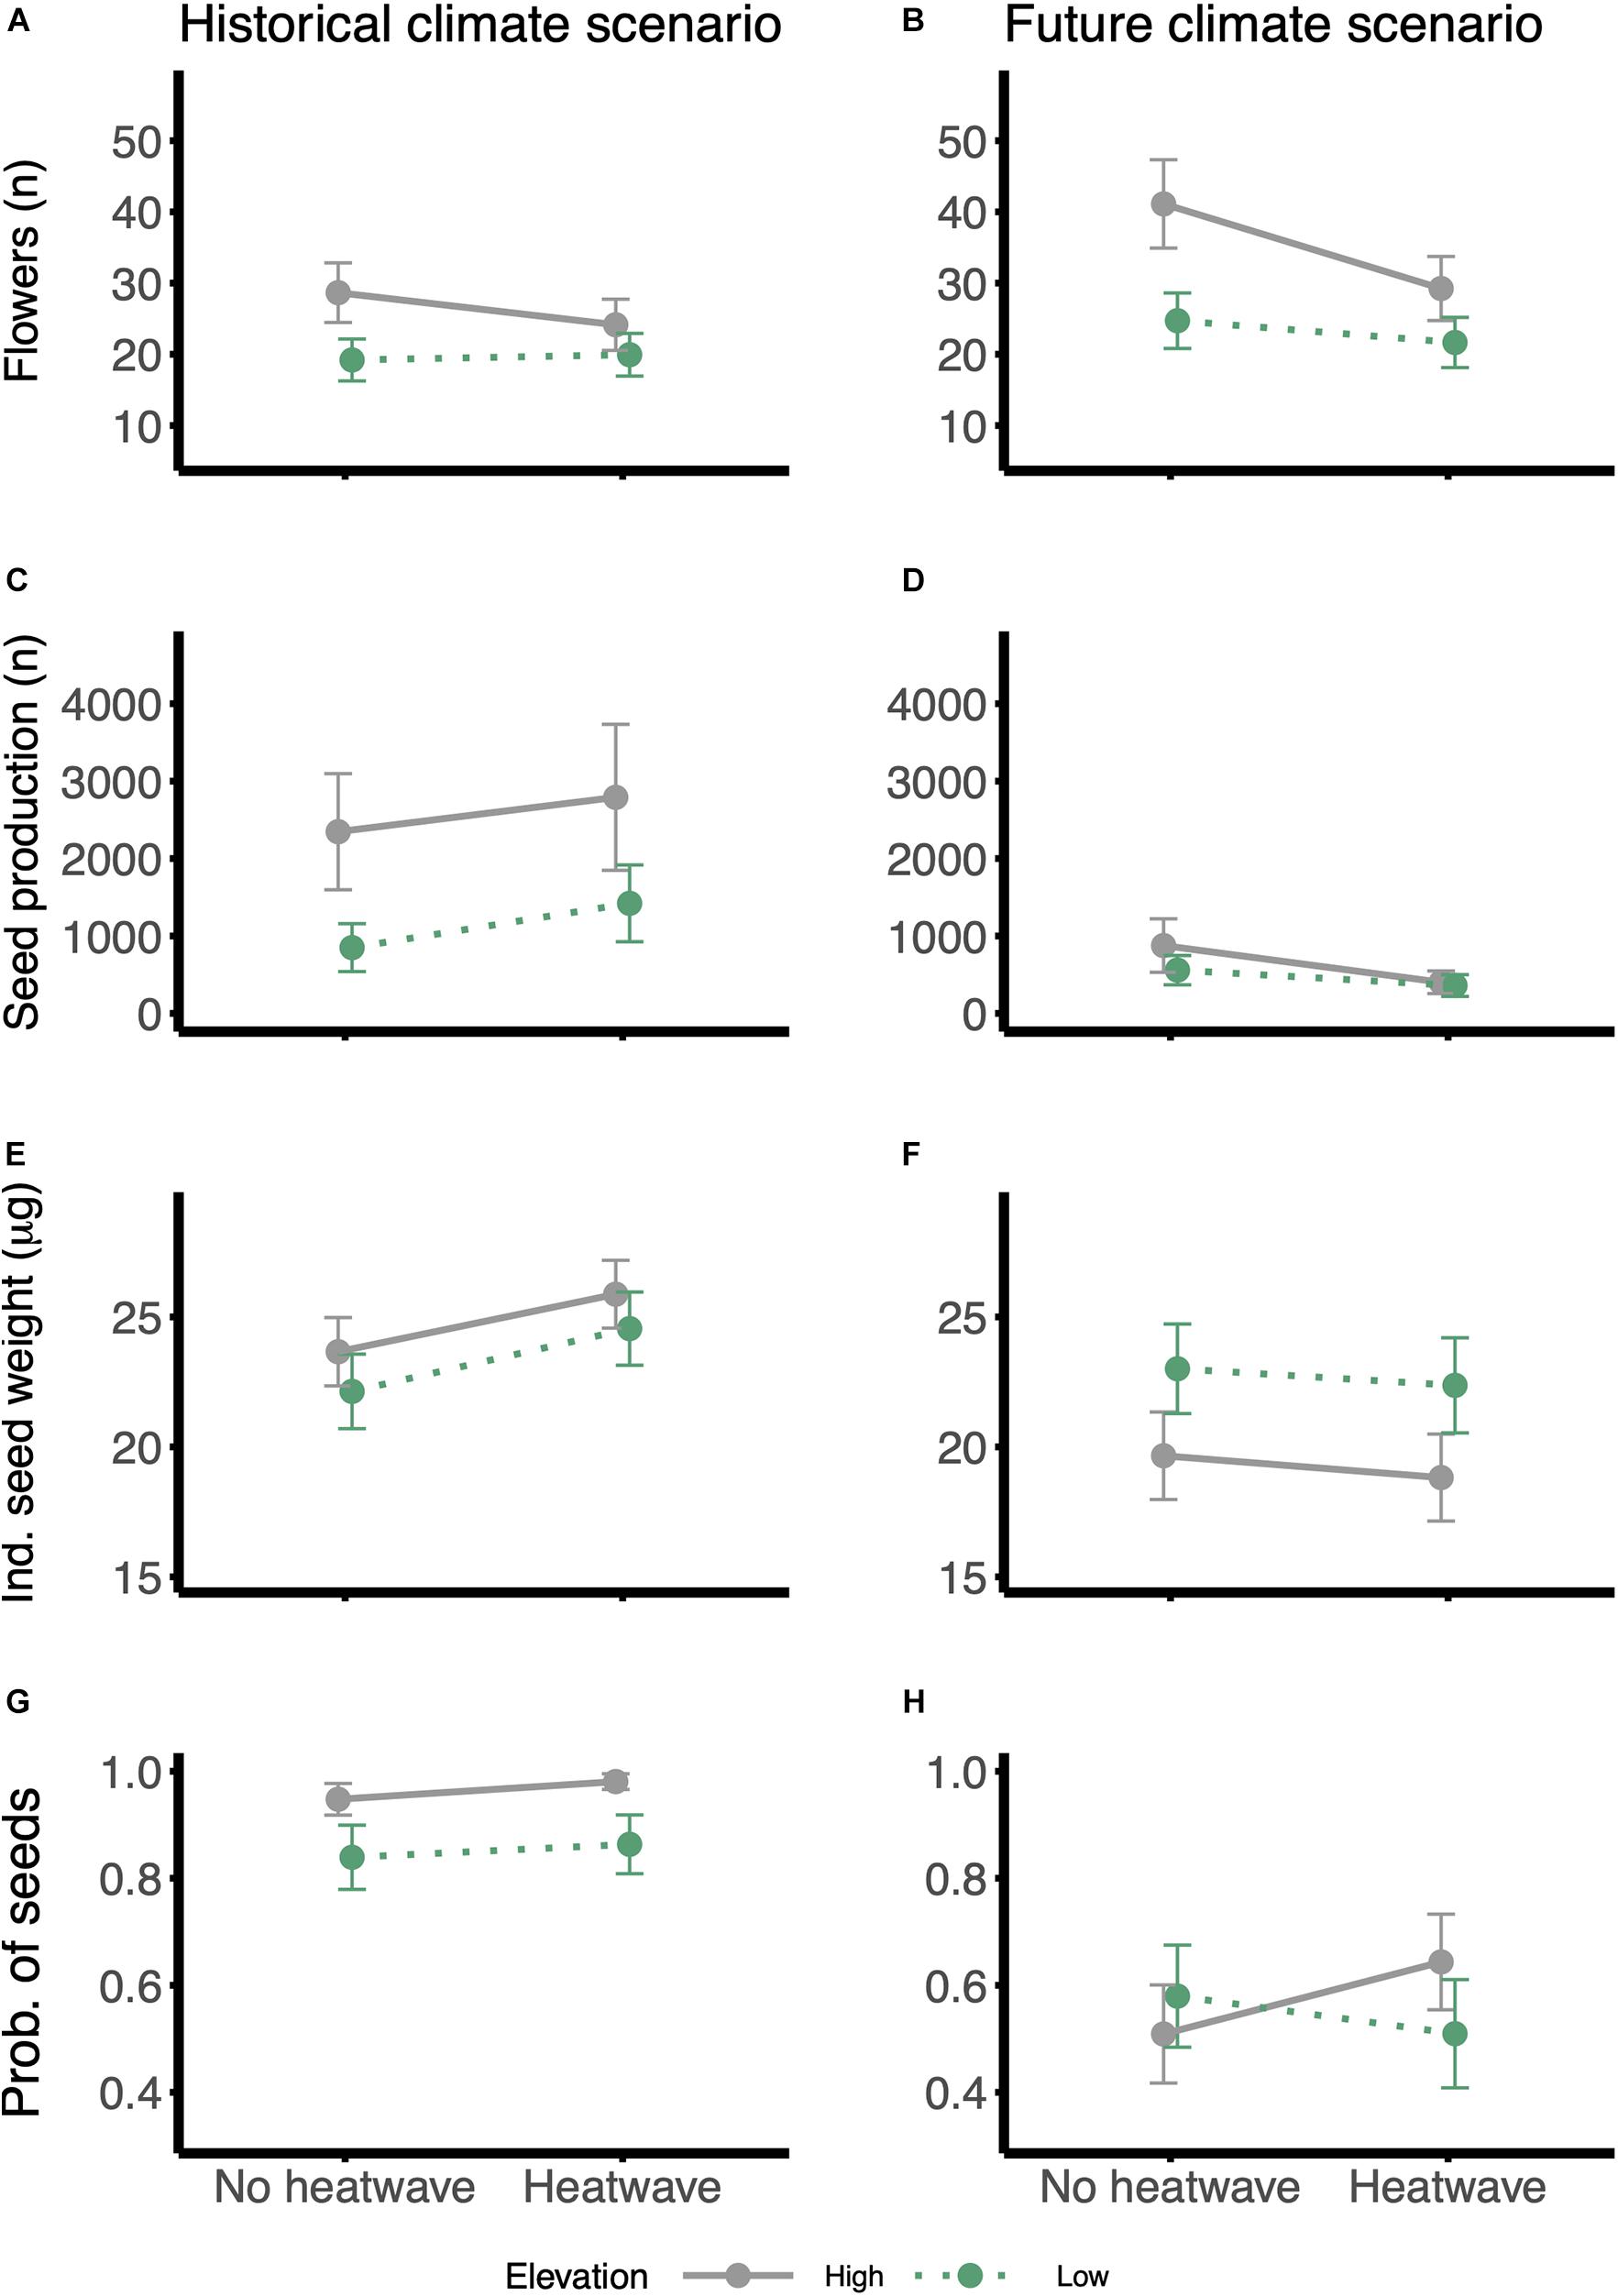
Figure 5. Reaction norms for fitness traits in response to the heatwave treatment: (A,B) number of flowers, (C,D) total seed production, (E,F) individual seed weight and (G,H) probability of producing any seeds. Panels on the left: historical climate scenario; panels on the right: future climate scenario. Gray and solid lines = high-elevation families; green and dotted lines = low-elevation families. Values were estimated from the models using the emmeans function in ‘emmeans’ package, in R; error bars are standard errors. Ind., individual; prob., probability.
Growth under the future climate scenario induced a higher flower production on average (Table 3 and Figures 5A,B), however, this did not translate into higher fitness, as the total seed production was lower and individuals had lower probabilities of producing any seeds (Table 3 and Figures 5C,D,G,H). Exposure to a heatwave in itself did not affect flower or seed production (Table 3).
Interestingly, despite the lack of a main heatwave effect on either flower production or the individual seed weight, individuals exposed to a heatwave in the future climate scenario halved the number of seeds produced (future scenario: no hw = 713 ± 196 SE vs. hw = 382 ± 111 SE; Supplementary Table 3, Table 3, and Figures 5C,D). Plants grown under historical conditions always produced more seeds, even when exposed to heatwaves (Figures 5C,D).
Variation Between Families in Intercepts and Slopes of Reaction Norms
Finally, there was evidence of variation among the 30 full-sibling families for flower production and flowering onset (Tables 2, 3) but not for thermal tolerance traits or longevity. Among the reproductive traits, total seed production did not vary among families, and we found only small variation between families in the individual seed weight. The proportion of the total variance accounted for by family ranged from 0.9% for T50 to 28.9% for flowering onset. The slopes of the family-level reaction norms (i.e., magnitude of the plastic response) varied for biomass production in response to growth conditions, but not in response to heatwaves (Table 2).
Thermal Safety Margins
Finally, as summary statistics, we calculated thermal safety margins for each individual as the difference between Tcrit and maximum temperatures during treatments. Because we were interested in the responses to a relative heatwave, i.e., 5°C rise in temperature relative to historical and future temperature conditions, heatwaves reached different maximum temperatures for historical (heatwave = 29/17°C day/night) and future climate scenarios (heatwave = 34/25°C day/night). In our experiment this also resulted in different thermal safety margins. We demonstrated that, despite acclimation of Tcrit to warmer temperatures, thermal safety margins were reduced by both future temperatures and heatwaves, but not their interaction (historical climate/no heatwave = 21.9 ± 0.2°C SE; future climate/no heatwave = 17.3 ± 0.2°C SE; historical/heatwave = 16.4 ± 0.1°C SE; future/heatwave = 12.4 ± 0.2°C SE).
Discussion
In this study, we grew progeny of families from high and low elevations of an Australian alpine plant, W. ceracea, under climate scenarios to test whether acclimation to a warmer climate would confer tolerance of heatwaves and to find evidence of intraspecific variation in plastic responses over an elevational gradient. Growth under warmer temperatures induced higher photosynthetic thermal tolerance in W. ceracea, but also affected growth and phenology in complex ways and caused a significant reduction in overall fitness, while heatwaves caused higher mortality rates. We found that the interactive effect of exposure to both warmer temperatures and a heatwave impaired seed production and plant fitness. There was no evidence in any trait that acclimation to, and hence tolerance of, higher temperatures in a future scenario conferred any resilience to heatwaves. Finally, the demonstration of elevation effects and differences in plasticity among families in some traits have implications for selective processes acting upon genotypes and plastic responses that can buffer the negative effects of climate change. Below, we discuss the responses that led to the strong reduction in fitness, and consider these in the context of the impacts of rapid climate change on alpine species.
Plastic Responses to Warming, Heatwaves and Their Interaction
Thermal Physiology
Photosynthetic thermal tolerance can indicate the potential of a species to tolerate and acclimate to warming (Yamori et al., 2014; Zhou et al., 2018). Despite being adapted to cold environments, alpine plants generally show broad thermal tolerance, with upper thermal limits well above maximum air temperatures, and capacity to acclimate very quickly to warming (Atkin et al., 2006; Larcher et al., 2010; Leon-Garcia and Lasso, 2019).
In our experiment, growth under a warmer scenario induced a small (∼1°C) but significant acclimation of photosynthetic thermal tolerance in W. ceracea, at the cost of a small reduction in photosynthetic efficiency. Many plant species, including those in alpine environments, have wide plasticity in Tcrit, which can increase by up to 9°C under warming (Downton et al., 1984; Weng and Lai, 2005; Buchner et al., 2017), but there are also examples of species that do not show measurable plasticity in Tcrit (Krause et al., 2010, 2013). That plasticity in thermal tolerance in W. ceracea is only ∼1°C suggests that W. ceracea leaves might be experiencing occasional heat stress events in their natural environment close to their thermal limit (46–46.5°C). Indeed, despite air temperatures being low in alpine environments, under clear skies leaf surfaces exposed to intense sun radiation can very rapidly overheat during moments of wind stillness, reaching up to 50–55°C (Körner, 2003; Vogel, 2009; Larcher et al., 2010). Alternatively, during the experiment plants may have cooled their leaves through evapotranspiration given that they were not water stressed and may have only needed a small acclimation of the photosynthetic machinery.
Photosynthetic efficiency, Fv/Fm, has been widely used as an indicator of plant health and stress levels. In our experiment, the future scenario caused a reduction in Fv/Fm, but not so much to indicate that plants were chronically stressed or photosynthetically compromised. Reduced photosynthetic efficiency concurrent with an increase in thermal tolerance was also found by Buchner et al. (2017) and may represent a protective mechanism to reduce the excitation state of the photosystem II under stress through thermal dissipation (Krause, 1988; Buchner et al., 2017), thereby facilitating higher thermal tolerance.
In contrast with other alpine species that show physiological acclimation (De Boeck et al., 2016), thermal tolerance in W. ceracea was strongly affected by heatwaves. The number of studies that have looked at the effect of heatwaves on thermal tolerance is still limited, but similar results to ours were found by Aspinwall et al. (2019) in four Eucalyptus species that showed lower Fv/Fm and tissue damage after a 5-day heatwave, but also increased thermal tolerance measured by gas exchange. Tcrit, T50, and Tmax relate to three different points of T-F0 curves: while Tcrit reflects the thermostability of the photosystem II, the temperature threshold where damage begins to occur, Tmax represents its complete disruption (Kouřil et al., 2001; Neuner and Pramsohler, 2006; Ducruet et al., 2007; Ilík et al., 2007). We found that heatwaves did not affect Tcrit in W. ceracea, however, the effect of heatwaves became stronger moving along the T-F0 curve (Supplementary Figure 1) from Tcrit to T50 and then to Tmax, i.e., heatwaves did affect the speed of the disruptive processes [ΔT (Tcrit − Tmax); Kouřil et al., 2001] and the photosystem II was completely disrupted 8.3 ± 0.2°C SE above Tcrit (compared to 9.9 ± 0.2°C SE in the absence of heatwaves), resulting in lower thermal tolerance. Our results clearly show that the small photosynthetic acclimation of Tcrit, T50, and Tmax (at the cost of Fv/Fm) to a future, warmer scenario did not confer tolerance of higher temperatures during heat stress in W. ceracea, despite the effect of heatwaves being stronger under a historical scenario.
The present study focused on investigating temperature in isolation, however, it should be noted that heatwaves are often accompanied by drought. Although photosynthetic rates in W. ceracea are not reduced by moderate water limitation (Geange et al., 2017), drought can have strong negative effects on plants’ photosynthetic physiology, which are amplified when drought is concurrent to heatwaves (De Boeck et al., 2016). Therefore, we would predict W. ceracea to be more negatively affected by the combination of warming and heatwaves when precipitation also declines in the future (annual precipitation is projected to decrease by 0–20% by the year 2,100 in the Australian Alps region and snow cover will be limited to only the highest peaks, Harris et al., 2016). Heatwaves are also predicted to increase in frequency in the future due to climate change, such that plants will face repeated heatwave events. Such exposure to repeated heatwaves may in effect prime plants, conferring acclimation and resilience to future events (French et al., 2019). Research on plant responses to heatwaves and to extreme events is still scarce and future studies are warranted to tackle the different properties of such events.
Phenology and Reproductive Allocation
Contrary to many other species, we did not find evidence that W. ceracea advanced flowering onset (reproductive maturity) under warmer conditions. Temperature cues are usually used by plants to tune their reproductive phenology with the start of the growing season, but other factors, such as photoperiod, can also influence phenology (Wang et al., 2020). In previous work on W. ceracea, Nicotra et al. (2015) found advances in phenology in response to warming. However, in that study plants were grown under natural light, and the difference between cool and warm temperatures was 10°C (cool = 20/11°C; warm = 30/19°C day/night, as compared to our 5°C difference between historical and future scenarios). When we consider only individuals that flowered within the first 56 days in our experiment, we do find an effect of warmer temperatures in advancing maturity, therefore the lengthening of the photoperiod from the 51st day (Supplementary Table 2 and Figure 1 to mimic lengthening days in summer) or less frequent sampling from the 56th day may have confounded our results.
Though the shift in phenology was not statistically significant, W. ceracea did show significantly increased investment in flower production under warmed conditions. There are mixed reports of the effect of high temperatures on flower production. In Frei et al. (2014a), the number of inflorescences increases under warmer conditions. However, in other cases, flower production is not affected by warm temperatures (Choi et al., 2019) or can even be downregulated, as in the alpine plant Campanula tyrsoides (Scheepens and Stöcklin, 2013). Given that low temperatures usually limit and slow down growth in plants, W. ceracea and other alpine plants may take advantage of warmer temperatures to produce more flowers. Enhanced production of flowers may also be a response to compensate for the higher flower abortion and reduced flower longevity that can happen under warmer temperatures (Young et al., 2004; Pacheco et al., 2016).
Lifetime Fitness
Wahlenbergia ceracea is described as a short-lived perennial, most likely exhibiting a biennial strategy and a single reproductive event. Thus, survival to the end of the growing season is a good indicator of potential to produce seed. In our experiment, survival and total seed production were positively correlated (conditional R2 = 0.37; Supplementary Table 5 and Supplementary Figure 3), where individuals that died early produced fewer seeds.
Growth under future temperatures induced a strong inhibition of reproduction in W. ceracea, with a three-fold drop in seed production, and a reduction in average seed weight (Table 3, Supplementary Table 3, and Figures 5C–F). Moderate warming can affect development and longevity of flowers (Young et al., 2004; Pacheco et al., 2016), and heat stress during seed development and maturation inside capsules can reduce seed weight, germination and vigor and increase the number of shriveled and abnormal seeds (Shinohara et al., 2006; Hampton et al., 2013; Nakagawa et al., 2020). In general, germination and seed weight are positively correlated (Veselá et al., 2020; Ge et al., 2020), suggesting lower fitness in W. ceracea under future temperatures, but negative correlations were also found in a different alpine plant (Bu et al., 2007). The change in seed weight may indicate a parental effect, where parental plants alter investment to the endosperm and/or seed coat (Lacey et al., 1997), influence dormancy levels (Fenner, 1991) and/or diversify the timing of germination of their offspring to multiple seasons (Lampei et al., 2017; Satyanti et al., 2019). The reduction of the average seed weight could result in reduced viability or alter germination strategies; this will be investigated in a forthcoming experiment.
Plants exposed to a heatwave in a future scenario produced 72% fewer seeds relative to the mean seed production of plants in the rest of the treatments (Figures 5C,D). A major driver of that substantial reduction in fitness in our experiment was the higher mortality rates observed following heatwaves (Figure 4). Individuals that survived exposure to heatwaves in a future climate had greater biomass (Figures 3B,C), and it is therefore likely that those plants diverted investment to growth and preservation of organs, while stalling reproduction and limiting thermal tolerance.
Differences in Responses Due to Elevation of Origin
Intraspecific variation in traits and plasticity along elevation gradients has been invoked as a source of genetic variation that could buffer effects of climate change on alpine species (Henn et al., 2018; Heilmeier, 2019). Standing genetic variation is the raw material on which selection can act upon, assuming that at least part of the variation is heritable. Moreover, gene flow and/or migration of genotypes (or ecotypes) adapted to lower warmer sites may facilitate the spread of advantageous alleles to higher elevations (Anderson and Gezon, 2015; Moran et al., 2016).
Differences in Trait Means Between High- and Low-Elevation Populations
In a previous study on the same species, Nicotra et al. (2015) found variation in morphological and other growth-related traits across elevation as well as small, but significant, genetic differentiation between individuals from the two elevations, indicating some degree of adaptation to local conditions. In the present study, W. ceracea showed variation among the same populations in phenology, growth and fitness, but not in photosynthetic or thermal physiology. A lack of genetic or plastic variation in thermal physiology may indicate that both populations have historically experienced similar levels of temperature stress.
High-elevation populations of W. ceracea flowered earlier and increased flower production and consequently both seed mass and production (Tables 2, 3, Supplementary Table 3, Figures 3A, 5A–D, and Supplementary Figures 2A,B). At high elevations, the snow cover lasts for longer because lower air temperatures delay snow melt in spring and advance snowfall in autumn (Körner, 2003; Slattery, 2015). It follows that at high elevations, plants have to hasten growth until maturity and produce more flowers in order to take advantage of a shorter growing and reproductive season (Stinson, 2004; Ensing and Eckert, 2019). Of the plants that survived until the end of the experiment, those from low-elevation populations accumulated more biomass on average, indicating greater investment in vegetative growth, while the higher investment in reproduction and faster growth to maturity was associated with lower vegetative growth in high-elevation populations. This result is in line with Halbritter et al. (2018), who also found a clear trend of reductions in biomass with increasing elevations: in both cases, reduced stature may be a local adaptation to cooler air temperatures and stronger wind at high elevations (Körner, 2003).
Interestingly, under historical conditions, high-elevation individuals produced more seeds. Similarly, high-elevation individuals in Nicotra et al. (2015) produced heavier capsules and a higher total capsule mass, despite producing fewer capsules in total. High- and low-elevation populations of W. ceracea may have different optima such that historical temperatures in our experimental settings were optimal for high-, but sub-optimal for low-elevation individuals that inhabit a warmer environment and may be experiencing warmer temperatures than the ones in our baseline (1960–1970). However, high-elevation individuals produced a higher total capsules mass even under 30°C in Nicotra et al. (2015). Therefore, we hypothesize that the higher investment in seed production may be a further response to a shorter growing season in high-elevation individuals of W. ceracea.
Variation in Plasticity Along an Elevation Gradient
Despite these significant elevation effects, we only found evidence of variation in plastic responses to warmer temperatures along an elevation gradient (i.e., an elevation × climate scenario interaction) in the individual seed weight and the probability of producing seeds (Table 3). High-elevation plants underwent a steeper reduction in the probability of producing seeds and produced much lighter seeds under future temperatures (Figures 5E–H), suggesting lower seed viability or active responses (parental effects) to influence germination timing of their offspring. In contrast, Nicotra et al. (2015) found greater evidence for variation in plasticity with elevation in the same study species (but using field collected seed): low-elevation individuals showed higher plasticity in growth and leaf-related traits. Therefore, our results indicate that there is no genetic variation across elevations in plastic responses when seed are generated under common conditions. This result is in accordance with Geange et al. (2017), which found limited variation in plastic responses of high- and low-elevation populations of W. ceracea to water limitation. Nevertheless, W. ceracea may still present variation in plasticity along elevation gradients for other traits and/or in response to other climatic and habitat factors.
In addition, we only used individuals from populations along the main range portion of Kosciuszko National Park (NSW, Australia) and we cannot exclude the possibility that other populations of the species may show variation in plasticity along elevation gradients. Although we selected families from the highest and lowest elevation collections of the species within the park, W. ceracea occupies a continuous elevation gradient in Kosciuszko National park. Individuals from mid-elevations (1,755–1,830 m a.s.l) showed similar responses to high-elevation individuals (Nicotra et al., 2015) and gene flow among populations is likely to occur. However, gene flow could reduce variation in both plasticity and trait means between elevation classes. A lack of variation in plasticity, but not in trait means, suggests that traits can be under selection, but the genetic architecture that underlies plastic responses is suitable for both environments.
Variation in Plasticity Among Families
Despite phenotypic plasticity being widely assumed to be an adaptive response to heterogeneous environments and climate change, the vast majority of studies that investigated responses to heat have ignored any associations with fitness-related traits, making it difficult to argue for the adaptive value of plasticity (Arnold et al., 2019). For selection to act upon plasticity, there has to be intraspecific variation in the extent of plasticity (i.e., in the slope of reaction norms). In this study, we did not find any evidence of variation in plasticity between families except for biomass, but we did find significant variation in trait means of fitness-related traits and flowering onset. Our results suggest that some families have higher fitness than others, but without variation in plasticity, it is not possible for to selection to act on plasticity.
Implications for Persistence of W. ceracea Under Climate Change
The use of climate model projections to implement realistic historical and future climatic conditions under controlled environments has been widely adopted in ecological research and is providing informative results on species responses and persistence under climate change (Harris et al., 2014). In our experiment, the implementation of realistic night temperatures was limited by technical reasons because growth chambers could not cope with the large temperature shift of the Australian alpine climate. However, previous studies have shown that night warming can promote acclimation to warm days, increasing photosynthetic capacity, and root and total biomass of plants (Turnbull et al., 2002; Su et al., 2020); therefore, we do not expect that this experimental limitation would have affected our overall pattern of results.
Although thermal safety margins in W. ceracea remained wide even under our treatments, they may be more easily exceeded in a future, warmer climate due to the leaf-air temperature decoupling. Under future climate scenarios and heatwaves, survival and fitness were severely hampered. We suggest that processes other than the photosystem II might well be disrupted under warmer conditions. If more individuals die and far fewer seeds are produced in future, W. ceracea will likely experience a reduction in population size, which could result in a contraction of its range. This may in turn lead to an upward movement of species from lower, warmer elevations and to a replacement of W. ceracea in its lower range limit. Seeds of W. ceracea are most likely dispersed by gravity and wind, limiting the dispersal capacity of the species (Morgan and Venn, 2017). Given that heatwaves affect survival in W. ceracea even under historical conditions, this successional process might already be occurring, as it is in the European Alps (Steinbauer et al., 2018).
Conclusion
Here we have demonstrated that the alpine herb W. ceracea can acclimate photosynthesis to moderate warming, resulting in higher Tcrit, T50, and Tmax, and that thermal tolerance exceeds projected future temperatures and heatwaves. However, thermal safety margins will potentially be exceeded more often in the future as the narrow and daytime rapid overheating due to solar radiation become more frequent and intense. Warmer growth temperatures stimulated flower production, but also hampered seed development. Exposure to heatwaves reduced thermal tolerance and strongly reduced longevity of plants. We sought to determine whether growth under future, warmer temperatures would ameliorate or worsen the effects of heatwaves. We found that reduced longevity after heatwaves caused a further reduction in seed production under a future climate scenario where many individuals did not produce seed. We did not find evidence that individuals acclimated to future temperatures had greater thermal tolerance after heatwave exposure compared to individuals grown under historical conditions.
We were able to add flower phenology and biomass to the list of morphological and growth traits that show genetic variation in W. ceracea along an elevational gradient. However, despite genetic variation, we did not find evidence that high- and low-elevation populations responded differently to climate change. We found little evidence of intraspecific variation in plasticity, suggesting that responses are consistent among families due to gene flow and/or climatic similarity along the elevation gradient.
We interpret our results as indicating increased chances for W. ceracea to be replaced on its lower range limits by lower elevation species and be constricted to the higher end of its range, but there is potential that the species might have the capacity to adapt to novel climatic conditions through selection on standing genetic variation. Nevertheless, future studies should consider adding replicates of the elevation gradient across a broader geographic range to test the generality of our results for W. ceracea and/or other Australian alpine plants. Finally, our study shows that not all alpine species are resilient to heatwaves. We suggest that future studies aimed at understanding the fate of plants under climate change should also consider how warmer growth temperatures will affect responses to heatwaves, drought, and their three-way interaction, and how growth temperatures affect plant responses to heatwaves of different intensities, frequencies and duration.
Data Availability Statement
The raw data supporting the conclusions of this article will be made available by the authors, without undue reservation.
Author Contributions
RN designed and conducted experiments, conducted statistical analyses, and wrote the manuscript. AN and LK developed ideas behind the experiments. All authors contributed to experimental design. LK and PA contributed to the statistical analyses. PA developed the chlorophyll fluorescence thermal tolerance methods and analyses. All authors contributed substantially to manuscript revisions.
Funding
This research was supported by the Australian Research Council (DP170101681), an International Ph.D. Scholarship to RN and an ARC Future Fellowship FT110100453 to LK. Research grants funded all research related costs (such as renting growth chambers or buying equipment), while the scholarship paid a stipend to RN.
Conflict of Interest
The authors declare that the research was conducted in the absence of any commercial or financial relationships that could be construed as a potential conflict of interest.
Acknowledgments
We thank the ANU Plant Services staff; Rebecca Harris, Tom Remenyi, and Peter Love for the climate projection models and explanation on their functioning; Shuo Wang, Alexandra Catling, Kelli Gowland, James Perkins, and Ashleigh Thomson for the help in collecting trait data; León A. Bravo for inspiring discussions and sharing of thoughts; Timothée Bonnet and Terry Neeman for statistical consulting.
Supplementary Material
The Supplementary Material for this article can be found online at: https://www.frontiersin.org/articles/10.3389/fevo.2021.615119/full#supplementary-material
References
Alsajri, F. A., Wijewardana, C., Irby, J. T., Bellaloui, N., Krutz, L. J., Golden, B., et al. (2020). Developing functional relationships between temperature and soybean yield and seed quality. Agron. J. 112, 194–204. doi: 10.1002/agj2.20034
Anderson, J. T., and Gezon, Z. J. (2015). Plasticity in functional traits in the context of climate change: a case study of the subalpine forb Boechera stricta (Brassicaceae). Global Change Biol. 21, 1689–1703. doi: 10.1111/gcb.12770
Arnold, P. A., Briceño, V. F., Gowland, K. M., Catling, A. A., Bravo, L. A., and Nicotra, A. B. (2020). A high-throughput method for measuring critical thermal limits of leaves by chlorophyll imaging fluorescence. bioRxiv [Preprint]. doi: 10.1101/2020.1109.1121.306886
Arnold, P. A., Nicotra, A. B., and Kruuk, L. E. B. (2019). Sparse evidence for selection on phenotypic plasticity in response to temperature. Philos. T. R. Soc. B 374:20180185. doi: 10.1098/rstb.2018.0185
Aspinwall, M. J., Pfautsch, S., Tjoelker, M. G., Vårhammar, A., Possell, M., Drake, J. E., et al. (2019). Range size and growth temperature influence Eucalyptus species responses to an experimental heatwave. Global Change Biol. 25, 1665–1684. doi: 10.1111/gcb.14590
Atkin, O. K., Scheurwater, I., and Pons, T. L. (2006). High thermal acclimation potential of both photosynthesis and respiration in two lowland Plantago species in contrast to an alpine congeneric. Global Change Biol. 12, 500–515. doi: 10.1111/j.1365-2486.2006.01114.x
Atlas of Living Australia (2020). Available online at: https://bie.ala.org.au/species/https://id.biodiversity.org.au/node/apni/2905360#overview (accessed July 26, 2020).
Bates, D., Maechler, M., Bolker, B., and Walker, S. (2015). Fitting linear mixed-effects models using lme4. J. Stat. Softw. 67, 1–48. doi: 10.18637/jss.v067.i01
Bradshaw, A. D. (1965). Evolutionary significance of phenotypic plasticity in plants. Adv. Genet. 13, 115–155. doi: 10.1016/s0065-2660(08)60048-6
Bu, H., Chen, X., Xu, X., Liu, K., Jia, P., and Du, G. (2007). Seed mass and germination in an alpine meadow on the eastern Tsinghai–Tibet plateau. Plant Ecol. 191, 127–149. doi: 10.1007/s11258-006-9221-5
Buchner, O., Roach, T., Gertzen, J., Schenk, S., Karadar, M., Stöggl, W., et al. (2017). Drought affects the heat-hardening capacity of alpine plants as indicated by changes in xanthophyll cycle pigments, singlet oxygen scavenging, α-tocopherol and plant hormones. Environ. Exp. Bot. 133, 159–175. doi: 10.1016/j.envexpbot.2016.10.010
Buchner, O., Stoll, M., Karadar, M., Kranner, I., and Neuner, G. (2015). Application of heat stress in situ demonstrates a protective role of irradiation on photosynthetic performance in alpine plants: heat stress on alpine plants. Plant Cell Environ. 38, 812–826. doi: 10.1111/pce.12455
Choi, B., Jeong, H., and Kim, E. (2019). Phenotypic plasticity of Capsella bursa-pastoris (Brassicaceae) and its effect on fitness in response to temperature and soil moisture. Plant Spec. Biol. 34, 5–10. doi: 10.1111/1442-1984.12227
Cochrane, A., Hoyle, G. L., Yates, C. J., Wood, J., and Nicotra, A. B. (2015). The phenotypic response of co-occurring Banksia species to warming and drying. Plant Ecol. 216, 27–39. doi: 10.1007/s11258-014-0414-z
Cowan, T., Purich, A., Perkins, S., Pezza, A., Boschat, G., and Sadler, K. (2014). More frequent, longer, and hotter heat waves for Australia in the twenty-first century. J. Climate 27, 5851–5871. doi: 10.1175/JCLI-D-14-00092.1
De Boeck, H. J., Bassin, S., Verlinden, M., Zeiter, M., and Hiltbrunner, E. (2016). Simulated heat waves affected alpine grassland only in combination with drought. New Phytol. 209, 531–541. doi: 10.1111/nph.13601
De Frenne, P., Brunet, J., Shevtsova, A., Kolb, A., Graae, B. J., Chabrerie, O., et al. (2011). Temperature effects on forest herbs assessed by warming and transplant experiments along a latitudinal gradient: forest herbs and climate warming. Global Change Biol. 17, 3240–3253. doi: 10.1111/j.1365-2486.2011.02449.x
Downton, W. J. S., Berry, J. A., and Seemann, J. R. (1984). Tolerance of photosynthesis to high temperature in desert plants. Plant Physiol. 74, 786–790. doi: 10.1104/pp.74.4.786
Drake, J. E., Tjoelker, M. G., Vårhammar, A., Medlyn, B. E., Reich, P. B., Leigh, A., et al. (2018). Trees tolerate an extreme heatwave via sustained transpirational cooling and increased leaf thermal tolerance. Global Change Biol. 24, 2390–2402. doi: 10.1111/gcb.14037
Ducruet, J.-M., Peeva, V., and Havaux, M. (2007). Chlorophyll thermofluorescence and thermoluminescence as complementary tools for the study of temperature stress in plants. Photosynth. Res. 93, 159–171. doi: 10.1007/s11120-007-9132-x
Ensing, D. J., and Eckert, C. G. (2019). Interannual variation in season length is linked to strong co-gradient plasticity of phenology in a montane annual plant. New Phytol. 224, 1184–1200. doi: 10.1111/nph.16009
Fenner, M. (1991). The effects of the parent environment on seed germinability. Seed Sci. Res. 1, 75–84. doi: 10.1017/S0960258500000696
Frei, E. R., Ghazoul, J., Matter, P., Heggli, M., and Pluess, A. R. (2014a). Plant population differentiation and climate change: responses of grassland species along an elevational gradient. Global Change Biol. 20, 441–455. doi: 10.1111/gcb.12403
Frei, E. R., Ghazoul, J., and Pluess, A. R. (2014b). Plastic responses to elevated temperature in low and high elevation populations of three grassland species. PLoS One 9:e98677. doi: 10.1371/journal.pone.0098677
French, K., Jansens, I. B., Ashcroft, M. B., Ecroyd, H., and Robinson, S. A. (2019). High tolerance of repeated heatwaves in Australian native plants. Austral Ecol. 44, 597–608. doi: 10.1111/aec.12700
French, K., Robinson, S. A., and Lia, J. (2017). Thermotolerance capacities of native and exotic coastal plants will lead to changes in species composition under increased heat waves. Conserv. Physiol. 5:cox029. doi: 10.1093/conphys/cox029
Ge, W., Bu, H., Wang, X., Martinez, S. A., and Du, G. (2020). Inter- and intra-specific difference in the effect of elevation and seed mass on germinability of eight Allium species. Glob. Ecol. Conserv. 22:e01016. doi: 10.1016/j.gecco.2020.e01016
Geange, S. R., Arnold, P. A., Catling, A. A., Coast, O., Cook, A. M., Gowland, K. M., et al. (2021). The thermal tolerance of photosynthetic tissues: a global systematic review and agenda for future research. New Phytol. 229, 2497–2513. doi: 10.1111/nph.17052
Geange, S. R., Briceño, V. F., Aitken, N. C., Ramirez-Valiente, J. A., Holloway-Phillips, M.-M., and Nicotra, A. B. (2017). Phenotypic plasticity and water availability: responses of alpine herb species along an elevation gradient. Clim. Change Responses 4:5. doi: 10.1186/s40665-017-0033-8
Gobiet, A., Kotlarski, S., Beniston, M., Heinrich, G., Rajczak, J., and Stoffel, M. (2014). 21st century climate change in the European Alps—a review. Sci. Total Environ. 493, 1138–1151. doi: 10.1016/j.scitotenv.2013.07.050
Grimm, N. B., Chapin, F. S., Bierwagen, B., Gonzalez, P., Groffman, P. M., Luo, Y., et al. (2013). The impacts of climate change on ecosystem structure and function. Front. Ecol. Environ. 11:474–482. doi: 10.1890/120282
Gugger, S., Kesselring, H., Stöcklin, J., and Hamann, E. (2015). Lower plasticity exhibited by high- versus mid-elevation species in their phenological responses to manipulated temperature and drought. Ann. Bot. London 116, 953–962. doi: 10.1093/aob/mcv155
Halbritter, A. H., Fior, S., Keller, I., Billeter, R., Edwards, P. J., Holderegger, R., et al. (2018). Trait differentiation and adaptation of plants along elevation gradients. J. Evol. Biol. 31, 784–800. doi: 10.1111/jeb.13262
Hampton, J. G., Boelt, B., Rolston, M. P., and Chastain, T. G. (2013). Effects of elevated CO2 and temperature on seed quality. J. Agr. Sci. Cambridge 151, 154–162. doi: 10.1017/S0021859612000263
Harris, R. M. B., Beaumont, L. J., Vance, T. R., Tozer, C. R., Remenyi, T. A., Perkins-Kirkpatrick, S. E., et al. (2018). Biological responses to the press and pulse of climate trends and extreme events. Nat. Clim. Change 8, 579–587. doi: 10.1038/s41558-018-0187-9
Harris, R. M. B., Grose, M. R., Lee, G., Bindoff, N. L., Porfirio, L. L., and Fox-Hughes, P. (2014). Climate projections for ecologists: climate projections for ecologists. Wires Clim. Change 5, 621–637. doi: 10.1002/wcc.291
Harris, R. M. B., Remenyi, T., and Bindoff, N. L. (2016). The Potential Impacts of Climate Change on Victorian Alpine Resorts. A Report For the Alpine Resorts Co-ordinating Council. Hobart: Antarctic Climate and Ecosystems Cooperative Research Centre [Government or Industry Research].
Havaux, M. (1993). Rapid photosynthetic adaptation to heat stress triggered in potato leaves by moderately elevated temperatures. Plant Cell Environ. 16, 461–467. doi: 10.1111/j.1365-3040.1993.tb00893.x
Heilmeier, H. (2019). Functional traits explaining plant responses to past and future climate changes. Flora 254, 1–11. doi: 10.1016/j.flora.2019.04.004
Henn, J. J., Buzzard, V., Enquist, B. J., Halbritter, A. H., Klanderud, K., Maitner, B. S., et al. (2018). Intraspecific trait variation and phenotypic plasticity mediate alpine plant species response to climate change. Front. Plant Sci. 9:1548. doi: 10.3389/fpls.2018.01548
Hernández-Fuentes, C., Bravo, L. A., and Cavieres, L. A. (2015). Photosynthetic responses and photoprotection strategies of Phacelia secunda plants exposed to experimental warming at different elevations in the central Chilean Andes. Alpine Bot. 125, 87–99. doi: 10.1007/s00035-015-0151-5
Hoover, D. L., Knapp, A. K., and Smith, M. D. (2014). Resistance and resilience of a grassland ecosystem to climate extremes. Ecology 95, 2646–2656. doi: 10.1890/13-2186.1
Ilík, P., Kouřil, R., Kruk, J., Myśliwa-Kurdziel, B., Popelková, H., Strzałka, K., et al. (2007). Origin of chlorophyll fluorescence in plants at 55-75°C. Photochem. Photobiol. 77, 68–76. doi: 10.1562/0031-865520030770068OOCFIP2.0.CO2
Kingsolver, J. G., and Buckley, L. B. (2017). Quantifying thermal extremes and biological variation to predict evolutionary responses to changing climate. Philos. T. R. Soc. B 372:20160147. doi: 10.1098/rstb.2016.0147
Körner, C. (2003). Alpine Plant Life: Functional Plant Ecology of High Mountain Ecosystems. Berlin: Springer.
Körner, C. (2007). The use of ‘altitude’ in ecological research. Trends Ecol. Evol. 22, 569–574. doi: 10.1016/j.tree.2007.09.006
Kortsch, S., Primicerio, R., Fossheim, M., Dolgov, A. V., and Aschan, M. (2015). Climate change alters the structure of arctic marine food webs due to poleward shifts of boreal generalists. P. Roy. Soc. B Biol. Sci. 282:20151546. doi: 10.1098/rspb.2015.1546
Kouřil, R., Ilík, P., Tomek, P., Nauš, J. A. N., and Poulíčková, A. (2001). Chlorophyll fluorescence temperature curve on Klebsormidium flaccidum cultivated at different temperature regimes. J. Plant Physiol. 158, 1131–1136. doi: 10.1078/0176-1617-00281
Krause, G. H. (1988). Photoinhibition of photosynthesis. An evaluation of damaging and protective mechanisms. Physiol. Plant. 74, 566–574. doi: 10.1111/j.1399-3054.1988.tb02020.x
Krause, G. H., Cheesman, A. W., Winter, K., Krause, B., and Virgo, A. (2013). Thermal tolerance, net CO2 exchange and growth of a tropical tree species, Ficus insipida, cultivated at elevated daytime and nighttime temperatures. J. Plant Physiol. 170, 822–827. doi: 10.1016/j.jplph.2013.01.005
Krause, G. H., Winter, K., Krause, B., Jahns, P., García, M., Aranda, J., et al. (2010). High-temperature tolerance of a tropical tree, Ficus insipida: methodological reassessment and climate change considerations. Funct. Plant Biol. 37, 890. doi: 10.1071/FP10034
Kuznetsova, A., Brockhoff, P. B., and Christensen, R. H. B. (2017). lmerTest package: tests in linear mixed effects models. J. Stat. Softw. 82, 1–26. doi: 10.18637/jss.v082.i13
Lacey, E. P., Smith, S., and Case, A. L. (1997). Parental effects on seed mass: seed coat but not embryo/endosperm effects. Am. J. Bot. 84, 1617–1620. doi: 10.2307/2446624
Lampei, C., Metz, J., and Tielbörger, K. (2017). Clinal population divergence in an adaptive parental environmental effect that adjusts seed banking. New Phytol. 214, 1230–1244. doi: 10.1111/nph.14436
Lara-Romero, C., Robledo-Arnuncio, J. J., García-Fernández, A., and Iriondo, J. M. (2014). Assessing intraspecific variation in effective dispersal along an altitudinal gradient: a test in two Mediterranean high-mountain plants. PLoS One 9:e87189. doi: 10.1371/journal.pone.0087189
Larcher, W., Kainmüller, C., and Wagner, J. (2010). Survival types of high mountain plants under extreme temperatures. Flora 205, 3–18. doi: 10.1016/j.flora.2008.12.005
Ledgard, N. J., and Cath, P. W. (1983). Seed of New Zealand Nothofagus species: studies of seed weight, viability, shape and the effect of varying stratification periods. NZ J. Forestry Sci. 13, 150–162.
Leon-Garcia, I. V., and Lasso, E. (2019). High heat tolerance in plants from the Andean highlands: implications for paramos in a warmer world. PLoS One 14:e0224218. doi: 10.1371/journal.pone.0224218
Maxwell, K., and Johnson, G. N. (2000). Chlorophyll fluorescence—a practical guide. J. Exp. Bot. 51, 659–668. doi: 10.1093/jxb/51.345.659
Moran, E. V., Hartig, F., and Bell, D. M. (2016). Intraspecific trait variation across scales: implications for understanding global change responses. Global Change Biol. 22, 137–150. doi: 10.1111/gcb.13000
Morgan, J. W., and Venn, S. E. (2017). Alpine plant species have limited capacity for long-distance seed dispersal. Plant Ecol. 218, 813–819. doi: 10.1007/s11258-017-0731-0
Muggeo, V. M. R. (2017). Interval estimation for the breakpoint in segmented regression: a smoothed score-based approach. Aust NZ J. Stat. 59, 311–322. doi: 10.1111/anzs.12200
Nakagawa, A. C. S., Ario, N., Tomita, Y., Tanaka, S., Murayama, N., Mizuta, C., et al. (2020). High temperature during soybean seed development differentially alters lipid and protein metabolism. Plant Prod. Sci. 23, 504–512. doi: 10.1080/1343943X.2020.1742581
Neuner, G., and Pramsohler, M. (2006). Freezing and high temperature thresholds of photosystem 2 compared to ice nucleation, frost and heat damage in evergreen subalpine plants. Physiol. Plant. 126, 196–204. doi: 10.1111/j.1399-3054.2006.00605.x
Nicotra, A. B., Cosgrove, M. J., Cowling, A., Schlichting, C. D., and Jones, C. S. (2008). Leaf shape linked to photosynthetic rates and temperature optima in South African Pelargonium species. Oecologia 154, 625–635. doi: 10.1007/s00442-007-0865-1
Nicotra, A. B., Segal, D. L., Hoyle, G. L., Schrey, A. W., Verhoeven, K. J. F., and Richards, C. L. (2015). Adaptive plasticity and epigenetic variation in response to warming in an Alpine plant. Ecol. Evol. 5, 634–647. doi: 10.1002/ece3.1329
O’Quigley, J., Xu, R., and Stare, J. (2005). Explained randomness in proportional hazards models. Stat. Med. 24, 479–489. doi: 10.1002/sim.1946
Pacheco, D. A., Dudley, L. S., Cabezas, J., Cavieres, L. A., and Arroyo, M. T. K. (2016). Plastic responses contribute to explaining altitudinal and temporal variation in potential flower longevity in high Andean Rhodolirion montanum. PLoS One 11:e0166350. doi: 10.1371/journal.pone.0166350
Pauli, H., Gottfried, M., Dullinger, S., Abdaladze, O., Akhalkatsi, M., Alonso, J. L. B., et al. (2012). Recent plant diversity changes on Europe’s mountain summits. Science 336, 353–355. doi: 10.1126/science.1219033
Poirier, M., Durand, J.-L., and Volaire, F. (2012). Persistence and production of perennial grasses under water deficits and extreme temperatures: importance of intraspecific vs. interspecific variability. Global Change Biol. 18, 3632–3646. doi: 10.1111/j.1365-2486.2012.02800.x
R Development Core Team (2019). R: A Language and Environment for Statistical Computing. Vienna: R Foundation for Statistical Computing.
Reyer, C. P. O., Leuzinger, S., Rammig, A., Wolf, A., Bartholomeus, R. P., Bonfante, A., et al. (2013). A plant’s perspective of extremes: terrestrial plant responses to changing climatic variability. Global Change Biol. 19, 75–89. doi: 10.1111/gcb.12023
Rodríguez, V. M., Soengas, P., Alonso-Villaverde, V., Sotelo, T., Cartea, M. E., and Velasco, P. (2015). Effect of temperature stress on the early vegetative development of Brassica oleracea L. BMC Plant Biol. 15:145. doi: 10.1186/s12870-015-0535-0
Salisbury, F. B., and Spomer, G. G. (1964). Leaf temperatures of alpine plants in the field. Planta 60, 497–505. doi: 10.1007/BF01894807
Satyanti, A., Guja, L. K., and Nicotra, A. B. (2019). Temperature variability drives within-species variation in germination strategy and establishment characteristics of an alpine herb. Oecologia 189, 407–419. doi: 10.1007/s00442-018-04328-2
Scheepens, J. F., and Stöcklin, J. (2013). Flowering phenology and reproductive fitness along a mountain slope: maladaptive responses to transplantation to a warmer climate in Campanula thyrsoides. Oecologia 171, 679–691. doi: 10.1007/s00442-012-2582-7
Schreiber, U., and Berry, J. A. (1977). Heat-induced changes of chlorophyll fluorescence in intact leaves correlated with damage of the photosynthetic apparatus. Planta 136, 233–238. doi: 10.1007/BF00385990
Shinohara, T., Hampton, J. G., and Hill, M. J. (2006). Location of deterioration within garden pea (Pisum sativum) cotyledons is associated with the timing of exposure to high temperature. N. Z. J. Crop Hort. Science 34, 299–309. doi: 10.1080/01140671.2006.9514420
Slattery, D. (2015). Australian Alps: Kosciuszko, Alpine and Namadgi National Parks. Clayton South: CSIRO Publishing.
Steinbauer, M. J., Grytnes, J.-A., Jurasinski, G., Kulonen, A., Lenoir, J., Pauli, H., et al. (2018). Accelerated increase in plant species richness on mountain summits is linked to warming. Nature 556, 231–234. doi: 10.1038/s41586-018-0005-6
Stinson, K. A. (2004). Natural selection favors rapid reproductive phenology in Potentilla pulcherrima (Rosaceae) at opposite ends of a subalpine snowmelt gradient. Am. J. Bot. 91, 531–539. doi: 10.3732/ajb.91.4.531
Su, J.-Q., Han, X., and Chen, B.-M. (2020). Do day and night warming exert different effects on growth and competitive interaction between invasive and native plants? Biol Invasions 23, 157–166. doi: 10.1007/s10530-020-02362-x
Therneau, T. M. (2020). coxme: Mixed Effects Cox Models. R Package Version 2.2-16. Available online at: https://CRAN.R-project.org/package=coxme (accessed January 14, 2020).
Turnbull, M. H., Murthy, R., and Griffin, K. L. (2002). The relative impacts of daytime and night-time warming on photosynthetic capacity in Populus deltoides: day and night temperature impacts on photosynthesis. Plant Cell Environ. 25, 1729–1737. doi: 10.1046/j.1365-3040.2002.00947.x
Veselá, A., Dostálek, T., Rokaya, M. B., and Münzbergová, Z. (2020). Seed mass and plant home site environment interact to determine alpine species germination patterns along an elevation gradient. Alp. Bot. 130, 101–113. doi: 10.1007/s00035-020-00242-7
Vitasse, Y., Lenz, A., Kollas, C., Randin, C. F., Hoch, G., and Körner, C. (2014). Genetic vs. non-genetic responses of leaf morphology and growth to elevation in temperate tree species. Funct. Ecol. 28, 243–252. doi: 10.1111/1365-2435.12161
Vogel, S. (2009). Leaves in the lowest and highest winds: temperature, force and shape. New Phytol. 183, 13–26. doi: 10.1111/j.1469-8137.2009.02854.x
Wang, H., Wang, H., Ge, Q., and Dai, J. (2020). The interactive effects of chilling, photoperiod, and forcing temperature on flowering phenology of temperate woody plants. Front. Plant Sci. 11:443. doi: 10.3389/fpls.2020.00443
Weng, J. H., and Lai, M. F. (2005). Estimating heat tolerance among plant species by two chlorophyll fluorescence parameters. Photosynthetica 43, 439–444. doi: 10.1007/s11099-005-0070-6
Wernberg, T., Smale, D. A., Tuya, F., Thomsen, M. S., Langlois, T. J., de Bettignies, T., et al. (2013). An extreme climatic event alters marine ecosystem structure in a global biodiversity hotspot. Nat. Clim. Change 3, 78–82. doi: 10.1038/nclimate1627
Williams, S. E., Shoo, L. P., Isaac, J. L., Hoffmann, A. A., and Langham, G. (2008). Towards an integrated framework for assessing the vulnerability of species to climate change. PLoS Biol. 6:e325. doi: 10.1371/journal.pbio.0060325
Yamori, W., Hikosaka, K., and Way, D. A. (2014). Temperature response of photosynthesis in C3, C4, and CAM plants: temperature acclimation and temperature adaptation. Photosynth. Res. 119, 101–117. doi: 10.1007/s11120-013-9874-6
Young, L. W., Wilen, R. W., and Bonham-Smith, P. C. (2004). High temperature stress of Brassica napus during flowering reduces micro- and megagametophyte fertility, induces fruit abortion, and disrupts seed production. J. Exp. Bot. 55, 485–495. doi: 10.1093/jxb/erh038
Keywords: phenotypic plasticity, climate change, heatwave, alpine, elevation, adaptation, thermal tolerance, fitness
Citation: Notarnicola RF, Nicotra AB, Kruuk LEB and Arnold PA (2021) Tolerance of Warmer Temperatures Does Not Confer Resilience to Heatwaves in an Alpine Herb. Front. Ecol. Evol. 9:615119. doi: 10.3389/fevo.2021.615119
Received: 08 October 2020; Accepted: 02 February 2021;
Published: 23 February 2021.
Edited by:
Angela Sierra-Almeida, University of Concepción, ChileReviewed by:
Othmar Buchner, University of Salzburg, AustriaElena Hamann, University of Georgia, United States
Carlos Lara-Romero, Rey Juan Carlos University, Spain
Copyright © 2021 Notarnicola, Nicotra, Kruuk and Arnold. This is an open-access article distributed under the terms of the Creative Commons Attribution License (CC BY). The use, distribution or reproduction in other forums is permitted, provided the original author(s) and the copyright owner(s) are credited and that the original publication in this journal is cited, in accordance with accepted academic practice. No use, distribution or reproduction is permitted which does not comply with these terms.
*Correspondence: Rocco F. Notarnicola, cm9jY28ubm90YXJuaWNvbGFAYW51LmVkdS5hdQ==