 Joseph P. Wayman1*
 Jonathan P. Sadler1
 Thomas A. M. Pugh1,2
 Thomas E. Martin3
 Joseph A. Tobias4
 Thomas J. Matthews1,5
- 1School of Geography, Earth and Environmental Sciences, and Birmingham Institute of Forest Research, University of Birmingham, Birmingham, United Kingdom
- 2Department of Physical Geography and Ecosystem Science, Lund University, Lund, Sweden
- 3Operation Wallacea, Spilsby, United Kingdom
- 4Department of Life Sciences, Imperial College London, Ascot, United Kingdom
- 5Centre for Ecology, Evolution and Environmental Changes-Azorean Biodiversity Group and Universidade dos Açores–Depto de Ciências Agráriase Engenharia do Ambiente, Angra do Heroísmo, Portugal
Spatial variation in community composition may be driven by a variety of processes, including environmental filtering and dispersal limitation. While work has been conducted on the relative importance of these processes on various taxa and at varying resolutions, tests using high-resolution empirical data across large spatial extents are sparse. Here, we use a dataset on the presence/absence of breeding bird species collected at the 10 km × 10 km scale across the whole of Britain. Pairwise spatial taxonomic and functional beta diversity, and the constituent components of each (turnover and nestedness/richness loss or gain), were calculated alongside two other measures of functional change (mean nearest taxon distance and mean pairwise distance). Predictor variables included climate and land use measures, as well as a measure of elevation, human influence, and habitat diversity. Generalized dissimilarity modeling was used to analyze the contribution of each predictor variable to variation in the different beta diversity metrics. Overall, we found that there was a moderate and unique proportion of the variance explained by geographical distance per se, which could highlight the role of dispersal limitation in community dissimilarity. Climate, land use, and human influence all also contributed to the observed patterns, but a large proportion of the explained variance in beta diversity was shared between these variables and geographical distance. However, both taxonomic nestedness and functional nestedness were uniquely predicted by a combination of land use, human influence, elevation, and climate variables, indicating a key role for environmental filtering. These findings may have important conservation implications in the face of a warming climate and future land use change.
Introduction
Biodiversity is currently facing a multitude of global-scale threats from human activity (Dirzo et al., 2014; McGill et al., 2015). As the human footprint on the natural world grows, it is becoming increasingly important to understand how these factors are impacting ecological communities in order to inform conservation efforts and make predictions about impacts under future scenarios (Newbold, 2018; Soininen et al., 2018). Analyzing spatial variation in species diversity is a powerful means of assessing the impact of different environmental factors on biodiversity as it provides us with information on what is currently limiting species ranges and occupation of sites. The analysis of spatial variation in biodiversity generally involves focusing on taxonomic changes between sites in the form of alpha (α) or, to a lesser extent, beta (β) diversity (Field et al., 2009; Calderón-Patrón et al., 2016; Soininen et al., 2018).
Comparing the alpha diversity of two communities separated in space provides a measure of the difference in the number of species between these sites but ignores species replacement/turnover (i.e., a species being extirpated from a site and another species colonizing) and can therefore mask biodiversity change (Gonzalez et al., 2016). In contrast, beta-diversity provides a measure of community dissimilarity between sites (Whittaker, 1960; Koleff et al., 2003). Various metrics have been proposed to measure beta-diversity, which can be grouped into variance-based approaches (the focus of the present study) and diversity-partitioning approaches (Legendre and de Cáceres, 2013; Matthews et al., 2019). Recently, several variance-based metrics (e.g., the Sørensen index) have been partitioned into constituent components, such as species replacement/turnover (that is independent of richness differences) and species richness differences or ‘nestedness’ (Baselga, 2010). It has been argued that the study of these partitions provides insight into the drivers of compositional difference between sites (Baselga and Leprieur, 2015). Nestedness in this context is not ‘true’ nestedness [e.g., as measured by the nestedness metric based on overlap and decreasing fill (NODF)], but rather nestedness resultant dissimilarity that allows for the separation of dissimilarity due to turnover from that of nestedness (Baselga, 2012). For ease, we henceforth use the term ‘nestedness’ to describe nestedness resultant dissimilarity.
Standard beta-diversity metrics (herein termed ‘taxonomic beta-diversity’) assume all species are the same in terms of the role they play within an ecosystem (Sekercioglu, 2006), thereby ignoring the vital role that functional diversity plays in assemblage dynamics (Devictor et al., 2010; Eskildsen et al., 2015). Recently, several beta-diversity metrics have been expanded to incorporate functional information (Cardoso et al., 2014; Baselga and Leprieur, 2015) and can be used to shed light on the biotic/abiotic factors that cause variation in functional diversity between sites (Villéger et al., 2013; Cardoso et al., 2014). This evidence can be used to inform conservation activities such as protected area design and biological corridor selection (Socolar et al., 2016), and help protect ecosystem services (Şekercioǧlu et al., 2004; Cardinale et al., 2012; Galetti et al., 2013). For example, bird communities play an important role in providing services such as pollination, pest control, and carrion removal (Whelan et al., 2008; Wenny et al., 2011), which are critical services for humans and other taxa. Using a beta-diversity measure that incorporates species traits, and hence functionality, is therefore essential to gain a better understanding of biodiversity change and its consequences (Devictor et al., 2010; Jarzyna and Jetz, 2018; Tobias and Pigot, 2019; Carvalho et al., 2020).
Biological communities are predicted to vary spatially in the absence of anthropogenic influences (i.e., the natural pattern of distance decay in species similarity; Nekola and White, 1999) due to both dispersal limitation and niche filtering, among other factors (Lomolino et al., 2010). Dispersal limitation is hypothesized to impact the spatial variation in community composition by restricting the range of species through distance alone (Dambros et al., 2017), independent of environmental differences between the communities (Hubbell, 2001). Niche-filtering occurs when environmental gradients constrain communities to those species adapted and able to persist in local conditions (Weiher and Keddy, 1999; Cornwell et al., 2006). In addition, human-induced change (e.g., land-use change and climate change) are likely important drivers of both spatial taxonomic and functional beta-diversity (Devictor et al., 2007; Davey et al., 2012; Barnagaud et al., 2017).
The effect of dispersal on spatial beta-diversity can be assessed through the analysis of the geographic distance between sites, while the effect of environment can be tested by evaluating measures of habitat and land use types (hereafter ‘land use’) and climate (Luck et al., 2013; Wieczynski et al., 2019; Fluck et al., 2020). However, due to the spatial structuring of environmental gradients (i.e., a distance decay in environmental conditions), it is difficult to partition the unique effects of each (Leibold and Chase, 2017). Relating current land use and climate to spatial variation in community composition will also enable inferences to be made on how increases in the relative intensity of these drivers may impact spatial variation in the future (Barbet-Massin and Jetz, 2015).
The effect of land use on community composition is mostly a result of niche filtering, where species which are adapted to a specific land use type are unable to survive in contrasting land use types (Weiher and Keddy, 1999; Cornwell et al., 2006). Rapidly growing human populations (Tratalos et al., 2007) have facilitated considerable land use changes via increasing urbanization in some areas of the world (Seto et al., 2012), and conversion of natural land to agriculture, as well as an overall intensification of agricultural practices (Zabel et al., 2019). There is strong evidence that these practices have disrupted communities, leading to pools of generalist species in heavily modified habitats via the exclusion, through filtering, of species with narrower environmental requirements (i.e., specialists) (McKinney, 2006; Vellend et al., 2007; Clavel et al., 2011; Flohre et al., 2011; Barnagaud et al., 2017; Hagen et al., 2017). Thus, in anthropogenic landscapes (such as those that occur across much of the United Kingdom), turnover is predicted to be low across large spatial scales, and communities are predicted to become more nested, with high redundancy in functional diversity (Liang et al., 2019; Weideman et al., 2020).
Climate is also an important environmental filter and can drive high spatial beta-diversity between regions due to differences in energy availability (energy richness hypothesis; Hutchinson, 1959; Currie, 1991; Hurlbert and Haskell, 2003), variation in species tolerance (physiological tolerance hypothesis; Root, 1988), and variation in speciation rates (the speciation rates hypothesis; Currie et al., 2004; Hua and Wiens, 2013). While there is mixed support for these hypotheses, substantial evidence exists showing that differences in species composition between sites are often correlated with climatic gradients (Currie et al., 2004). Additional filtering impacts may occur where land use change interacts with climate (Auffret and Thomas, 2019).
Better understanding the role of climate in driving spatial beta-diversity is essential in order to accurately predict the effects of future climate change on community composition. For example, species populations have been found to expand or contract their ranges in response to changing climatic conditions (Fox et al., 2014; Batt et al., 2017). As well as range shifts, shifting phenologies across the trophic web can lead to disruption of communities through cascade effects due to altered species interactions (Bell et al., 2019). Other impacts of a changing climate, such as more frequent severe weather events, are also increasingly recognized as significant drivers of spatial beta-diversity (Maxwell et al., 2019).
There are thus many potential drivers of spatial beta-diversity. However, few studies exist assessing the relative roles of these different drivers (e.g., land use, climate, human impacts) in terms of both taxonomic and functional beta-diversity, the aim of the present study. We use generalized dissimilarity models (GDMs) in combination with a dataset containing presence/absence data of British breeding birds collected at the 100 km2 scale over the entirety of the British Isles. We aim to (1) test the effect of geographic distance and a range of environmental variables (e.g., land use type, climate) on the spatial taxonomic and functional beta-diversity of British breeding bird communities and (2) evaluate the role of human influence on spatial beta-diversity patterns. While we do not set out to test the niche-filtering and dispersal-limitation hypotheses directly, we interpret increasing dissimilarity due to geographical distance as an indication that dispersal limitation may play a role in the structuring of communities. In contrast, increasing dissimilarity due to climate, land use, or human influence would point to a role for niche filtering.
Materials and Methods
Data Collection
Species Composition Data
Data showing the summer (breeding) distributions of the British avifauna (Gillings et al., 2019) were collected during April-July over the period 2008–2011 (BA2010) by volunteers on behalf of the British Trust of Ornithology (BTO) and the Scottish Ornithologists’ Club (SOC). Some fieldwork effort was permitted out of this field season, with specific instructions given on what evidence was permitted (see Gillings et al., 2019, for further information).
The dataset summarizes the presence/absence of British bird species within 10 km × 10 km (100 km2) quadrats covering the British Isles on a continuous grid (Figure 1). Only species designated as being “confirmed” or “probable” breeders (Gillings et al., 2019) were retained here. Vagrant and pelagic species were excluded, but we retained introduced breeding species for the analysis (McInerny et al., 2018). While some introduced species’ occupied ranges may reflect in part their initial introduction sites, many of these species are now established, so their presence exerts an influence on community structure, resource use, and competition (Lennon et al., 2000). Species under threat from human persecution (particularly hunting or egg-collecting) were also removed from the analyses as data for such species were provided at larger spatial grains (i.e., larger than 100 km2) or their locations were omitted entirely (Gillings et al., 2019). All quadrats with less than 50% land and all island regions that were considered disconnected from the mainland were removed. A total of 2257 100 km2 quadrats remained with a species pool containing 169 species (Supplementary Table 1).
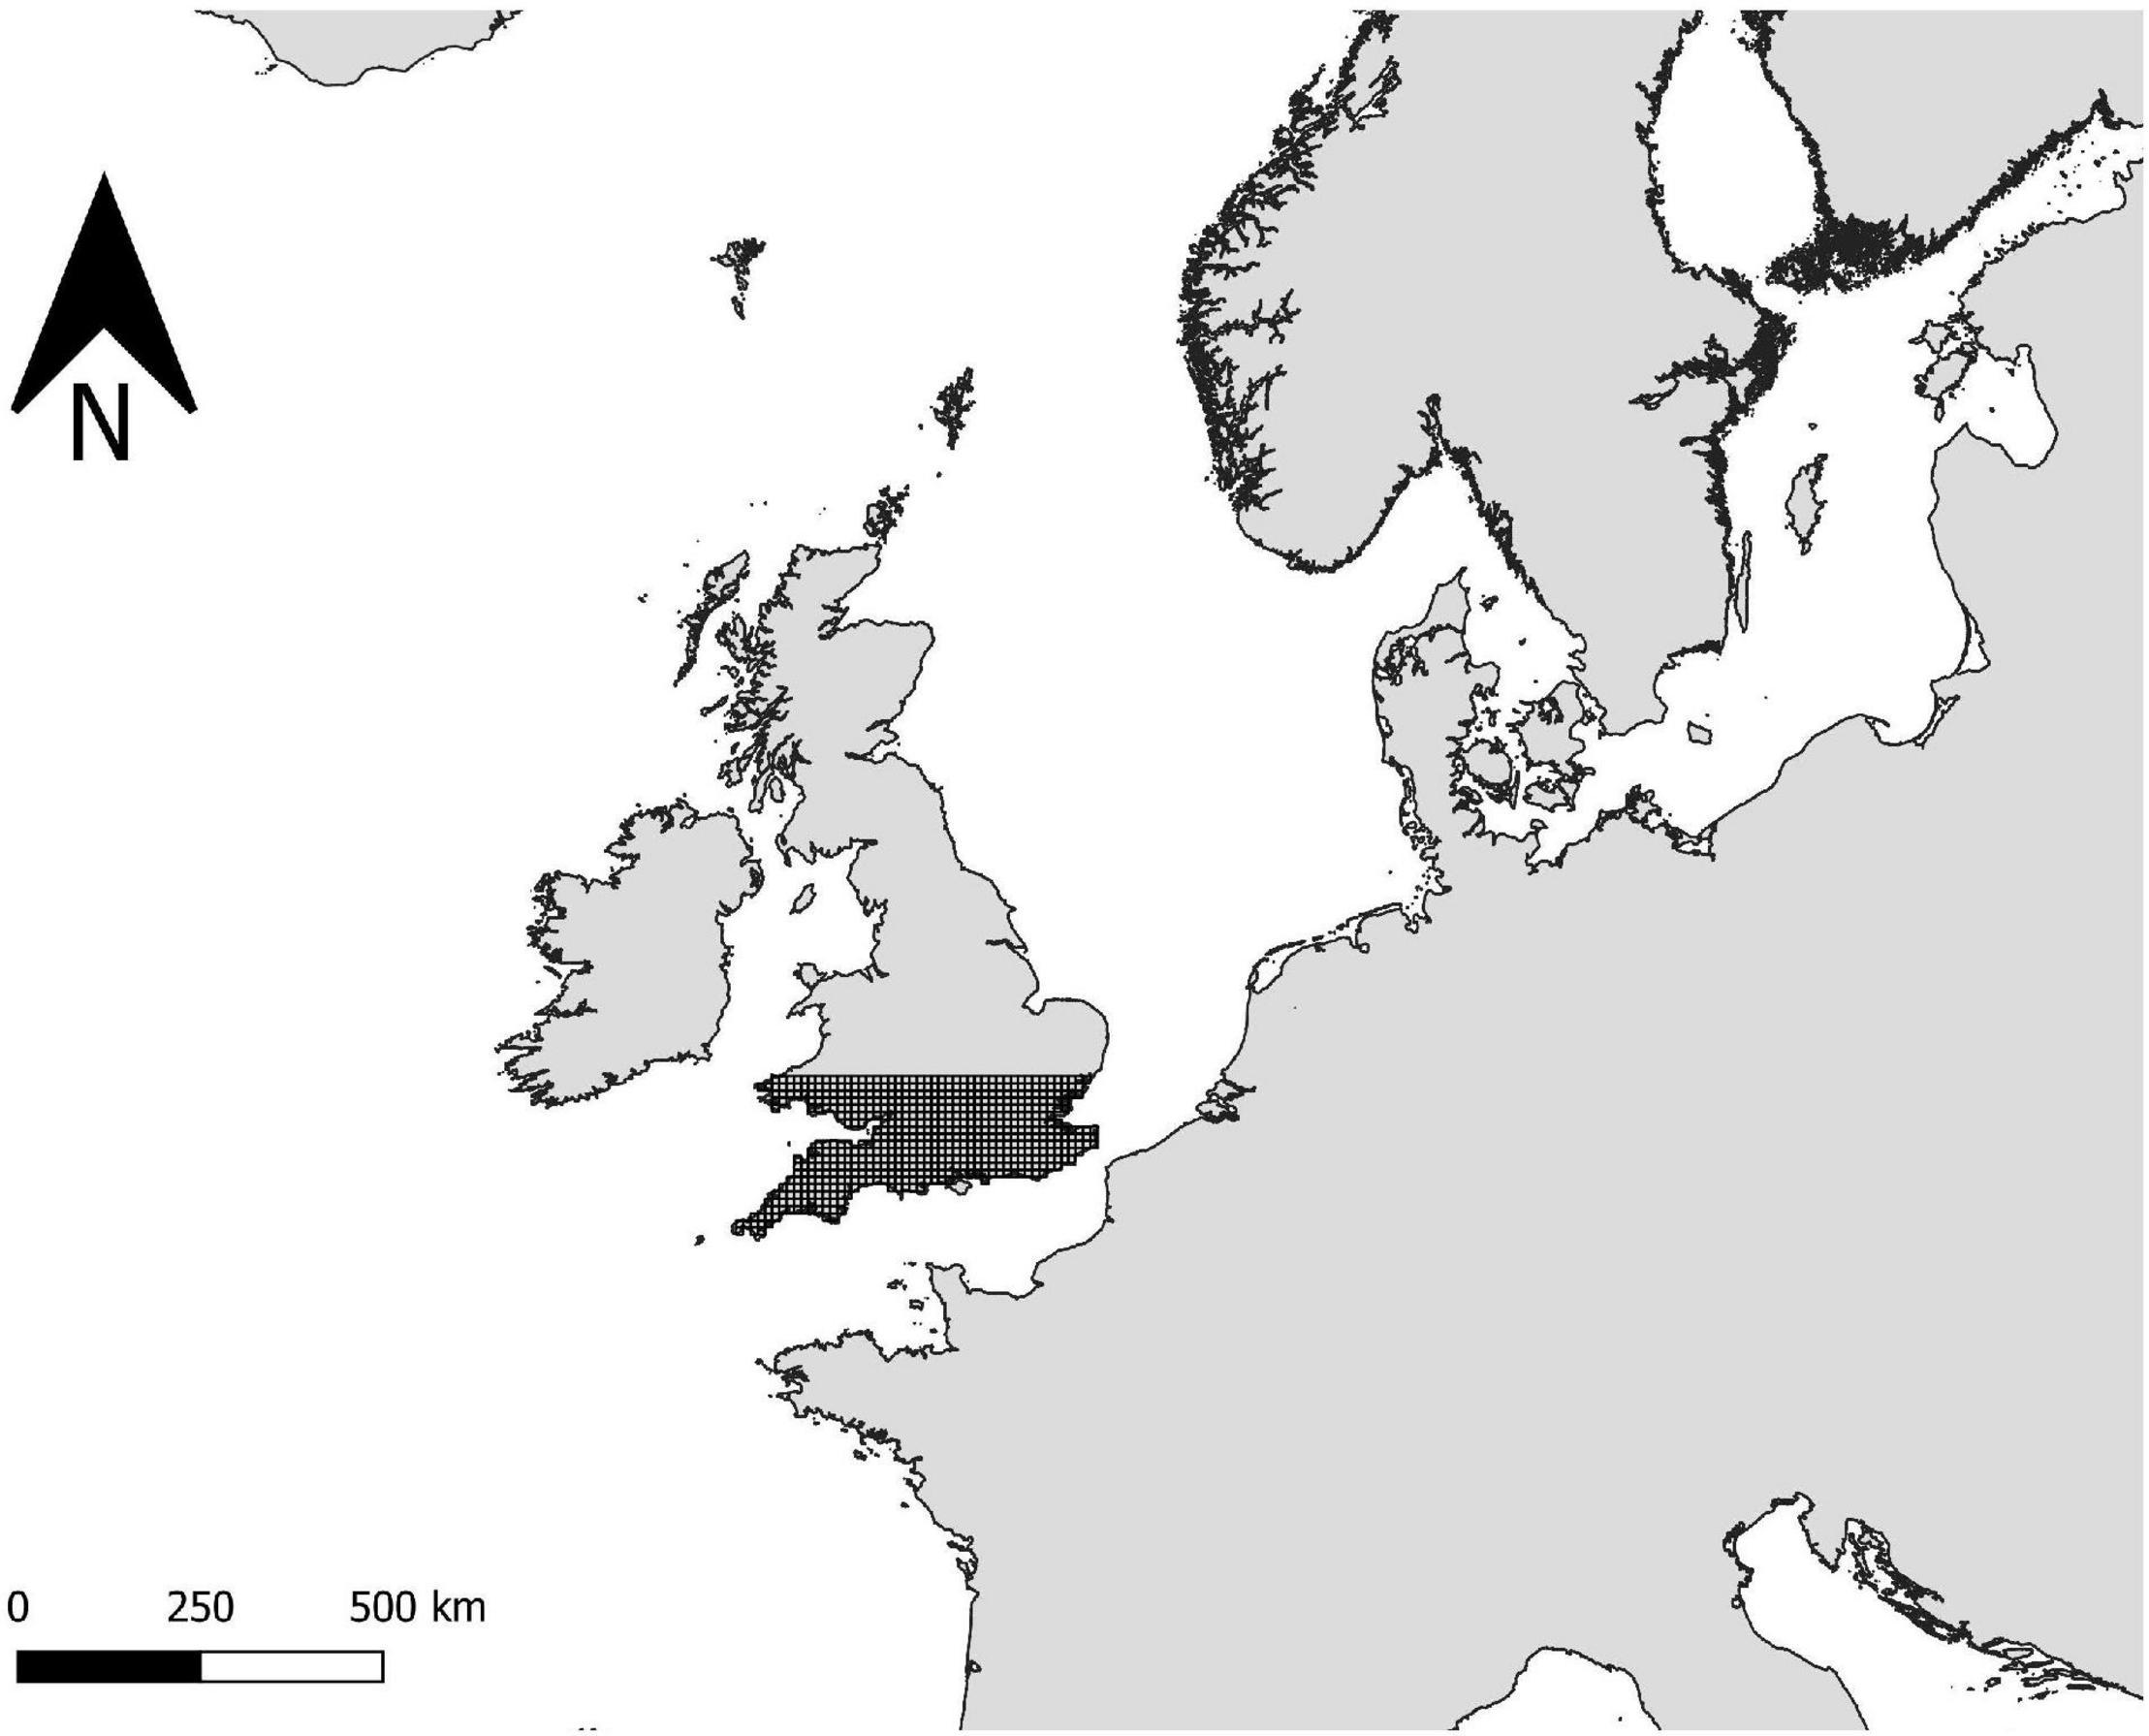
Figure 1. Map displaying the study location (Great Britain) and its location within Europe. The lower proportion of the island is gridded with the quadrats used to sample the avifauna (only a sample is shown here and the whole island was sampled).
Trait Data
Continuous morphometric variables were measured from museum specimens or extracted from literature and used to characterize the functional diversity of each community (defined as all the species present in each quadrat). We selected eight morphological traits to represent the functional role of birds: two estimates of beak length (culmen from tip-to-skull and tip-to-nares), beak width, beak depth, tarsus length, wing chord length, tail length, and body mass, with evidence showing all of these traits provide useful information about avian dietary niche, locomotion and ecological function (Trisos et al., 2014; Tobias and Pigot, 2019; Pigot et al., 2020). Further information on measurements, including sampling per species and methods, are published separately (Pigot et al., 2020).
A principal components analysis (PCA) was performed using all eight traits, with the full eight axes extracted. All the axes were then standardized to a mean of 0 and a standard deviation of 1, producing a trait matrix (species x traits) with eight trait axes for each species. To test for the effect of raw trait variability, we also standardized the traits prior to running the PCA. The results using both the raw traits and the standardized traits in the PCAs were comparable, so we report only the results using the raw traits within the PCA here. All eight axes were included as it has been shown that all the axes provide useful information, with even minor axes capturing significant variation in traits (Pigot et al., 2020).
Climate Data
Monthly temperature and precipitation data were downloaded from the United Kingdom Met Office, which provides climate data interpolated from local weather stations onto a 1 km × 1 km grid across the United Kingdom (Hollis et al., 2019). Data were downloaded from the period 2000–2011. For the breeding season (defined as the start of May to the end of July, as many arriving migrants in April will not yet be breeding), key climate variables were selected a priori, and averages calculated. Precipitation (mm) was summed for each 100 km2 quadrat over the breeding season for each year. The average temperature (°C) was calculated as the daily average temperature across the quadrat and the breeding season. The range in temperature was also calculated as the average mean maximum daily temperature over the breeding season minus the average mean minimum daily temperature. The mean of each of these climatic variables was then calculated over the 2000 - 2011 period to reduce the influence of yearly variation, leaving three measures of climate (Tavgmean, Precmean, and Rangemean). Climate averages were also constructed over a more extended period (1960–2011) to test if birds were responding to longer-term climate variation. The majority of the GDMs fitted using the shorter period had a better fit, and thus we only report the results using 2000–2011 climate here.
Land Use Data
Data on land use were obtained from the EDINA environment digimap service for 2007 (Land Cover Map, 2007). These data provide land cover (23 land use classes) for the British Isles at a 25 m scale. From these data, the percentage cover for each land use within each 10 × 10 km quadrat was calculated. The woodland classes (coniferous woodland and broadleaved woodland) were grouped into one variable named ‘forest,’ as were ‘grasslands’ (grouped from the improved grasslands and semi-natural grasslands categories), and ‘urban areas’ (grouped from the suburban and urban categories). Arable land was also included as a predictor variable. Shannon’s diversity index was calculated for each quadrat as a measure of land-use heterogeneity (hereafter called Shan).
Human Influence Index (HII)
The Human Influence Index (HII) was used to assess the contribution of human impact on the variation in community composition (Wildlife Conservation Society-WCS, and Center for International Earth Science Information Network-CIESIN-Columbia University, 2005). The HII is derived from multiple data sources on population density, infrastructure (railroads, urban development, night-time lighting), and landcover ranging in date collected 1994–2005 (although in this version about half of the measures were collected around 2000 instead of 1995, as was the case for the first version). The measures are each weighted differently in the methodology and then standardized giving a measure of human impact ranging from zero (no human impact) to 100 (maximum human impact possible using the methodology). HII values were extracted from each of the 1 km2 grid squares within each 100 km2 quadrat. The average was taken over these values to obtain the mean HII within each quadrat. It is important to note here that there is some temporal disparity in the period the HII was developed over (see above) and the period the atlas was conducted (2008–2011). However, even with this small disparity, HII should provide a robust indication of the impact human influences have on spatial variation in taxonomic and functional composition.
Elevation Data
Elevation data were obtained from the shuttle radar topography mission (SRTM; Jarvis et al., 2008). For each 100 km2 quadrat, data were extracted using 400 equally spaced points. The mean (Meanelev) and the standard deviation (SDelev) were then calculated from these data as measures of elevation and variability in the elevation across the area.
Testing for Multicollinearity
Pearson’s and Spearman’s correlations were used to test for multicollinearity between the predictor variables. SDelev was removed due to the variable being strongly correlated with multiple other variables (Elevation, Tavgmean, and Precmean). The climatic variables were found to be collinear with one another, and with other variables (Supplementary Figures 1a,b). Therefore, the climatic variables were combined using a PCA. The PCA yielded three axes that explained all the variation of the original three climatic variables [hereafter; Climate 1 (81.90%), Climate 2 (13.54%), and Climate 3 (4.56%)]. All the axes were retained in the models to capture all the variability that could be explained by climate. Scatter plots and correlations between the PCA axes and the raw climate variable showed that Climate 1 was positively correlated with average temperature and negatively correlated with average precipitation (Supplementary Figure 2). Climate 2 and Climate 3 had less clear and more complex correlations with the original variables (Supplementary Figure 2).
After substituting the climate variables with the PCA axes, all variables had correlations < 0.70, with two exceptions: Elevation and Climate 1, and urban land use and HII (Supplementary Figures 1c,d). As a result, urban land use was removed from the analysis and the human influence index, which is a composite measure including urban land use, was retained. Both elevation and Climate 1 were retained because (1) both variables are known to be significant predictors of spatial variation in breeding avian communities, (2) the correlation was still below 0.8, and 3) GDM is known to be robust to multicollinearity to a certain degree (Glassman et al., 2017). A variance inflation factor test (VIF) was also performed, with all remaining variables having VIF values < 5 (Neter et al., 1983; Gareth et al., 2013).
Measuring Spatial Dissimilarity in Community Composition
Spatial Taxonomic and Functional Beta-Diversity
To assess taxonomic dissimilarity between the assemblages, pairwise taxonomic beta diversity was calculated for each 100 km2 quadrat using the function beta.pair from the package ‘betapart’ (Baselga and Orme, 2012). This function computes the dissimilarity (here measured using Sørensen’s dissimilarity index, βsor; Baselga, 2010; Koleff et al., 2003) between an assemblage and every other assemblage present in the dataset to create a pairwise dissimilarity matrix.
Using Sørensen’s dissimilarity, total beta-diversity can then be partitioned into its two constituent components: dissimilarity due to turnover (BDTURN) and nestedness resultant dissimilarity (BDNEST), with BDTOTAL = BDTURN + BDNEST. Turnover is the proportion of dissimilarity due to species replacement between two assemblages, whereas nestedness is the proportion of the dissimilarity due to one assemblage being a nested subset of another assemblage through either species loss or gain (Baselga, 2010). It is important to note that, unlike BDTURN, BDTOTAL and BDNEST are not independent of species richness changes, as the measurements are dependent upon species richness gradients (Baselga and Leprieur, 2015).
A measure of functional beta-diversity was then calculated using Sørensen’s dissimilarity index and Baselga’s (2010) partitioning framework (Phylosor). For this approach, a global functional dendrogram was created containing all the United Kingdom breeding species, using a Euclidean trait distance matrix and the agglomerative hierarchical clustering method (UPGMA). This method produces a rooted tree with a constant weight assumption (i.e., where the distance between the root to all tips is equal), and this then describes the functional relationships between species (Petchey and Gaston, 2002). The phylo.sor function in the ‘betapart’ package (Baselga and Orme, 2012) was used to calculate functional dissimilarity based on the shared branch length of the functional dendrogram between each assemblage and every other assemblage (hereafter called FDTOTAL). Although this method is usually used on phylogenies, here it is used on a functional dendrogram to give a functional measure analogous to taxonomic beta-diversity, allowing for straightforward comparison. In addition, using a convex hull approach (the standard Baselga functional metric) was not possible here due to the size of the dataset and the computational demands of such an approach. FDTOTAL was also partitioned into its constituent components of nestedness resultant dissimilarity (FDNEST) and turnover (FDTURN).
A Pearson’s correlation was performed between the Euclidean distances (in the trait distance matrix) and the cophenetic distances (in the dendrogram) (Villéger et al., 2017). The resultant correlation was high (Pearson’s r = 0.97), indicating that the dendrogram provides an adequate measure of the functional distances between species.
MNTD (Mean Nearest Taxon Distance) and MPD (Mean Pairwise Distance)
As an alternative to Baselga’s functional beta-diversity framework, mean nearest taxon distance (MNTD) and mean pairwise distance (MPD) were calculated. While MNTD is also sensitive to species richness differences, MPD is a measure that is mostly independent of species differences between sites (Miller et al., 2017). MNTD represents the mean distance (smallest non-diagonal value) between species in a community and is most sensitive to changes at the ‘tips’ of a dendrogram (Webb et al., 2002). MPD is a similar measure but is calculated as the mean between all non-diagonal elements between species within a community (Webb, 2000; Webb et al., 2008), and so it is more sensitive to changes at the roots of the functional dendrogram. Here, the beta-diversity versions of MNTD and MPD, that calculate the same measures but between assemblages are used. For ease, we refer to these as MNTD and MPD (Miller et al., 2017). MPD and MNTD were calculated using the comdist and comdistnt functions, respectively, in the R package ‘picante’ (Webb et al., 2008). MNTD and MPD were standardized by dividing each pairwise measure by the largest pairwise measure to produce dissimilarity bounded between 0 and 1. Standardizing MPD and MNTD in this way allowed the measures to be modeled using GDMs.
Modelling Variation in Spatial Beta-Diversity
As a first step, multidimensional scaling (MDS) was applied to each of the pairwise measures. The first axes from the MDS were taken and plotted. These were then assessed visually for any pattern in the dissimilarity/similarity between assemblages.
Generalized dissimilarity modeling (GDM) was then used to model functional and taxonomic beta-diversity. GDM is a statistical technique (an extension of matrix regression) that can be used for assessing the relationship between environmental gradients and variation in community composition (Ferrier et al., 2007). The modeling accommodates non-linearity that is present in ecological datasets over large extents (Ferrier, 2002; Ferrier et al., 2007) and can also incorporate geographical distance. This is vital to include, as dispersal limitation modulated by distance is known to be an important driver of community composition (Keil et al., 2012). GDM can deal with higher multicollinearity among predictor variables than many commonly used regression models (Glassman et al., 2017), and uses monotonic I-splines that constrain the coefficients of the regressions to be positive for a non-decreasing fit and non-positive for a non-increasing fit. The I-splines allow the evaluation of predictor effects on the dissimilarity metrics through the height and slope. The maximum height represents the total deviance explained by the predictor while holding all the other predictors constant, while the slope displays the rate of compositional change across the predictor’s range (Fitzpatrick et al., 2013; Fitzpatrick and Keller, 2015). We applied a modeling framework using GDM, aimed at assessing the unique and shared roles of both geographic distance and environmental factors on our measures of beta diversity (Supplementary Figure 3).
A separate GDM was fitted with each of the taxonomic and functional beta-diversity metrics (i.e., BDTOTAL, BDTURN, BDNEST, FDTOTAL, FDTURN, FDNEST, MNTD, and MPD) as response variables using the ‘gdm’ package in R (Fitzpatrick et al., 2020). As a first step, matrix permutation was used to assess the model significance and variable importance using the gdm.varImp function. Due to the large amount of memory and time required to model the full site-pair combinations (N = 2,545,896) only a subset of the data could be used for the matrix permutation and variable importance process (as recommended for datasets with a large number of sites when calculating variable importance; Fitzpatrick et al., 2020). First, 60% of the sites were randomly removed, leaving 407,253 site-pairs. Another 60% of the site-pair combinations were then removed from the remaining site-pairs, leaving a total of 162,901 site-pairs for analysis. The removal of the site-pairs, after the initial site removal, removes site-pairs randomly but does not remove all site-pair combinations (Fitzpatrick et al., 2020). The predictor variables were not scaled, which allows assessment of the impacts each of the predictors has along actual environmental gradients (e.g., Fitzpatrick et al., 2013; Heino et al., 2019).
For the matrix permutation process, a GDM was first run using all of the predictor variables. The rows of the environmental data were then permuted, and a GDM model was fitted to those data. Significance was then evaluated by comparing the deviance of the model with unpermuted data to the model using permuted data. Variable importance was assessed by permuting each of the variables in turn while holding the other variables constant (unpermuted). Variable importance was then assessed as the difference in deviance explained using the permuted and unpermuted variable, with more important variables explaining a larger proportion of the deviance when unpermuted. The process was then repeated after dropping the least important variable (backward elimination) with variable importance and significance recalculated. All variable importance scores reported in the text were calculated at this point. The first model where all variables were significant (p < 0.05) was identified, and this model was then fit using all the sites (i.e., the full dataset) (final model). One hundred permutations were used for model significance testing and variable importance scores (Ferrier et al., 2007; Heino et al., 2019). Uncertainty in the I-splines was then evaluated using a bootstrapping approach (Shryock et al., 2015). A total of 50% of the sites were first removed randomly from the dataset. From these data, a GDM model was fit, and the I-spline coefficients extracted. For the bootstrapping, a further 80% of the sites were randomly removed, and a GDM model fit. The process was repeated 100 times. The I-splines were then plotted with error bands showing the standard deviation from the permutation process.
Variance shared between geographical distance and the environmental variables was calculated for each model in turn using the formula:
where Vs is the explained variance shared between the geographic predictor and the environmental variables, Vfull is the variance explained by the full model, Vg is the variance explained by the geographic distance only model, and Ve is the variance explained by the model containing only the environmental variables (Ray-Mukherjee et al., 2014).
Results
Taxonomic and Functional Beta-Diversity of the British Avifauna
BDTOTAL was higher on average (0.313 ± 0.142) than FDTOTAL (0.285 ± 0.126). In both cases, overall beta-diversity was determined mostly by the turnover component (0.225 ± 0.121 (71.88% of the total) and 0.195 ± 0.108 (68.42% of the total), for BDTURN and FDTURN, respectively). Nestedness was responsible for a smaller proportion on average for both measures (Figures 2A,B). Average MPD (0.799 ± 0.045) was higher than MNTD (0.255 ± 0.125) (Figure 2C), as is to be expected.
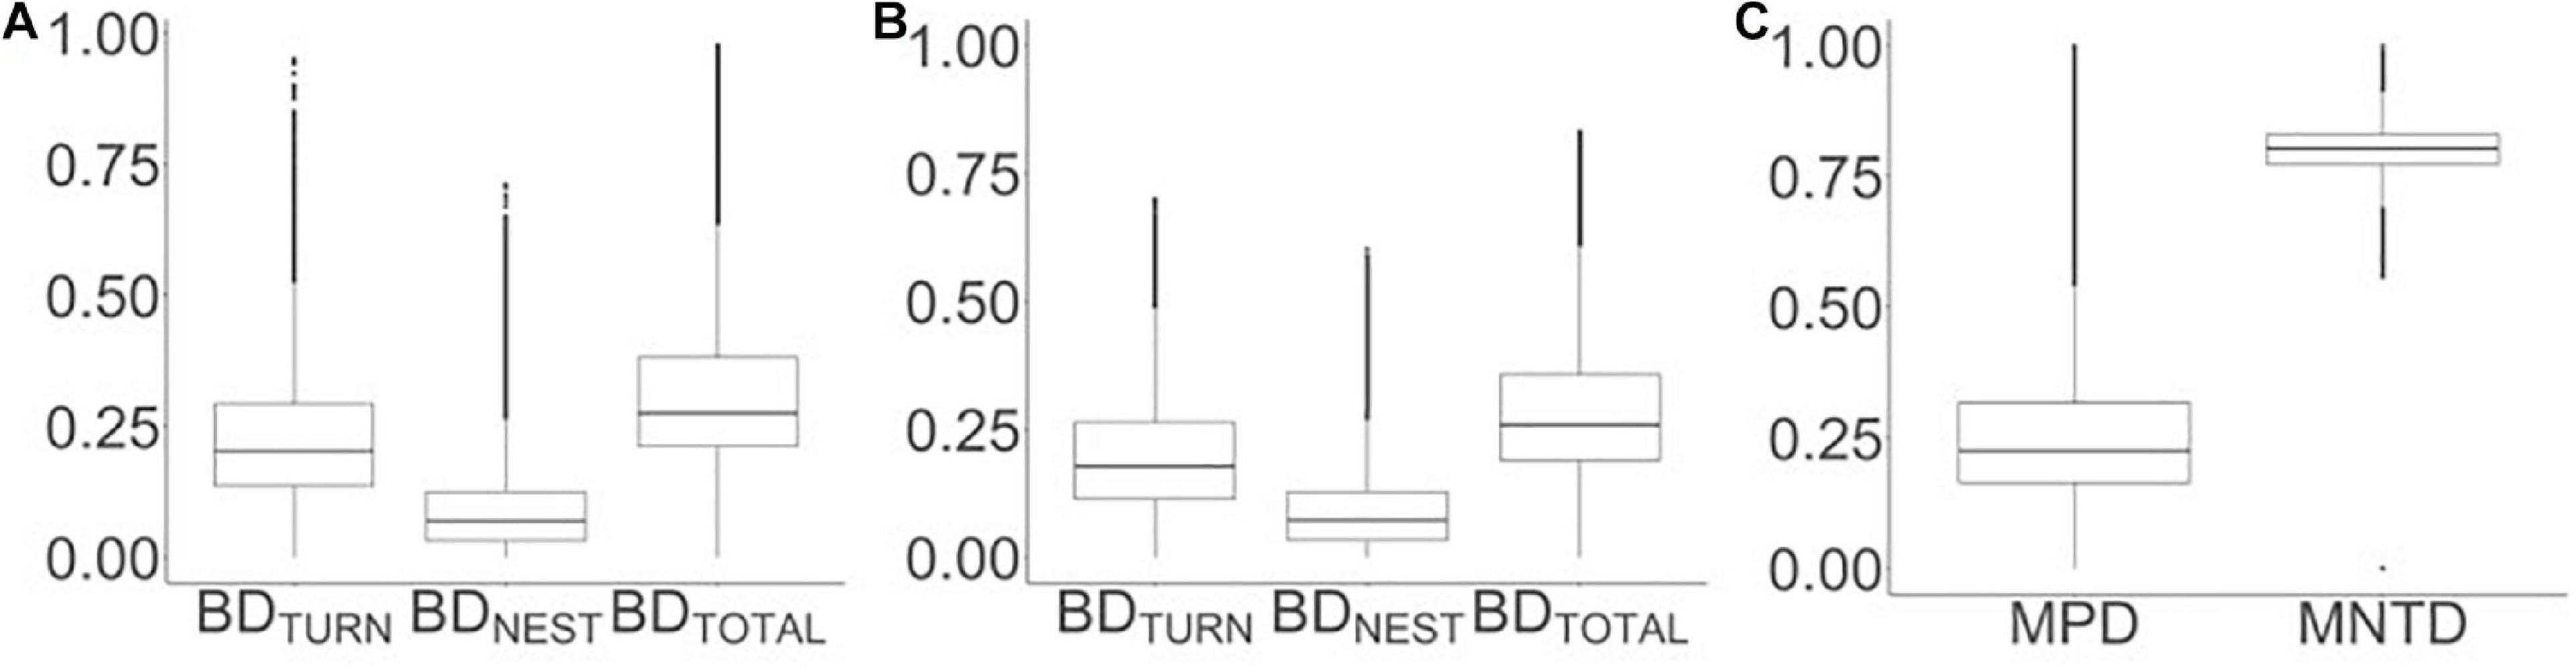
Figure 2. Boxplots of pair-wise dissimilarity measures of community composition for British breeding birds. These are all on the same row (A) displays taxonomic spatial dissimilarity (turnover, nestedness resultant dissimilarity, and total), (B) is functional pairwise dissimilarity (turnover, nestedness resultant dissimilarity, and total), and (C) shows standardised mean pairwise distance (MPD) and standardised mean nearest taxon distance (MNTD). The horizontal line within the box represents the median, the box indicates the inter-quartile range (IQR), and the whiskers show data 1.5 times the IQR. Points highlight outliers.
Spatial Variation in Taxonomic and Functional Beta Diversity
Heat maps of the community metrics showed clear spatial patterns in the different beta diversity metrics. A north-south divide was present for BDTOTAL (Figure 3A) and FDTOTAL (Figure 3E), and for the turnover component of each (Figures 3B,F, respectively). Alternatively, this could also be interpreted as a divide along the classic ‘Tees-exe line’ that roughly divides the uplands and lowlands of Britain (Prakash and Rumsey, 2018). The west of Wales was more similar to the north of England and parts of Scotland than the south of England for total beta diversity and turnover for both taxonomic and functional metrics, representing elevation changes between upland and lowland regions (Figures 3A,B,E,F). The eastern coastal regions in Scotland were more congruent with southern regions than with inland and west coast Scottish assemblages (Figures 3A,B,E,F). Nestedness patterns generally mirror the other metrics but the patterns were patchier (i.e., the divides between regions (north/south and Tees-exe line) was less delineated). The south-west of England and the west coast of Wales were a closer match with most of Scotland than they were with the majority of southern England (Figures 3C,G), again closely matching the ‘Tees-exe line’ (Prakash and Rumsey, 2018).
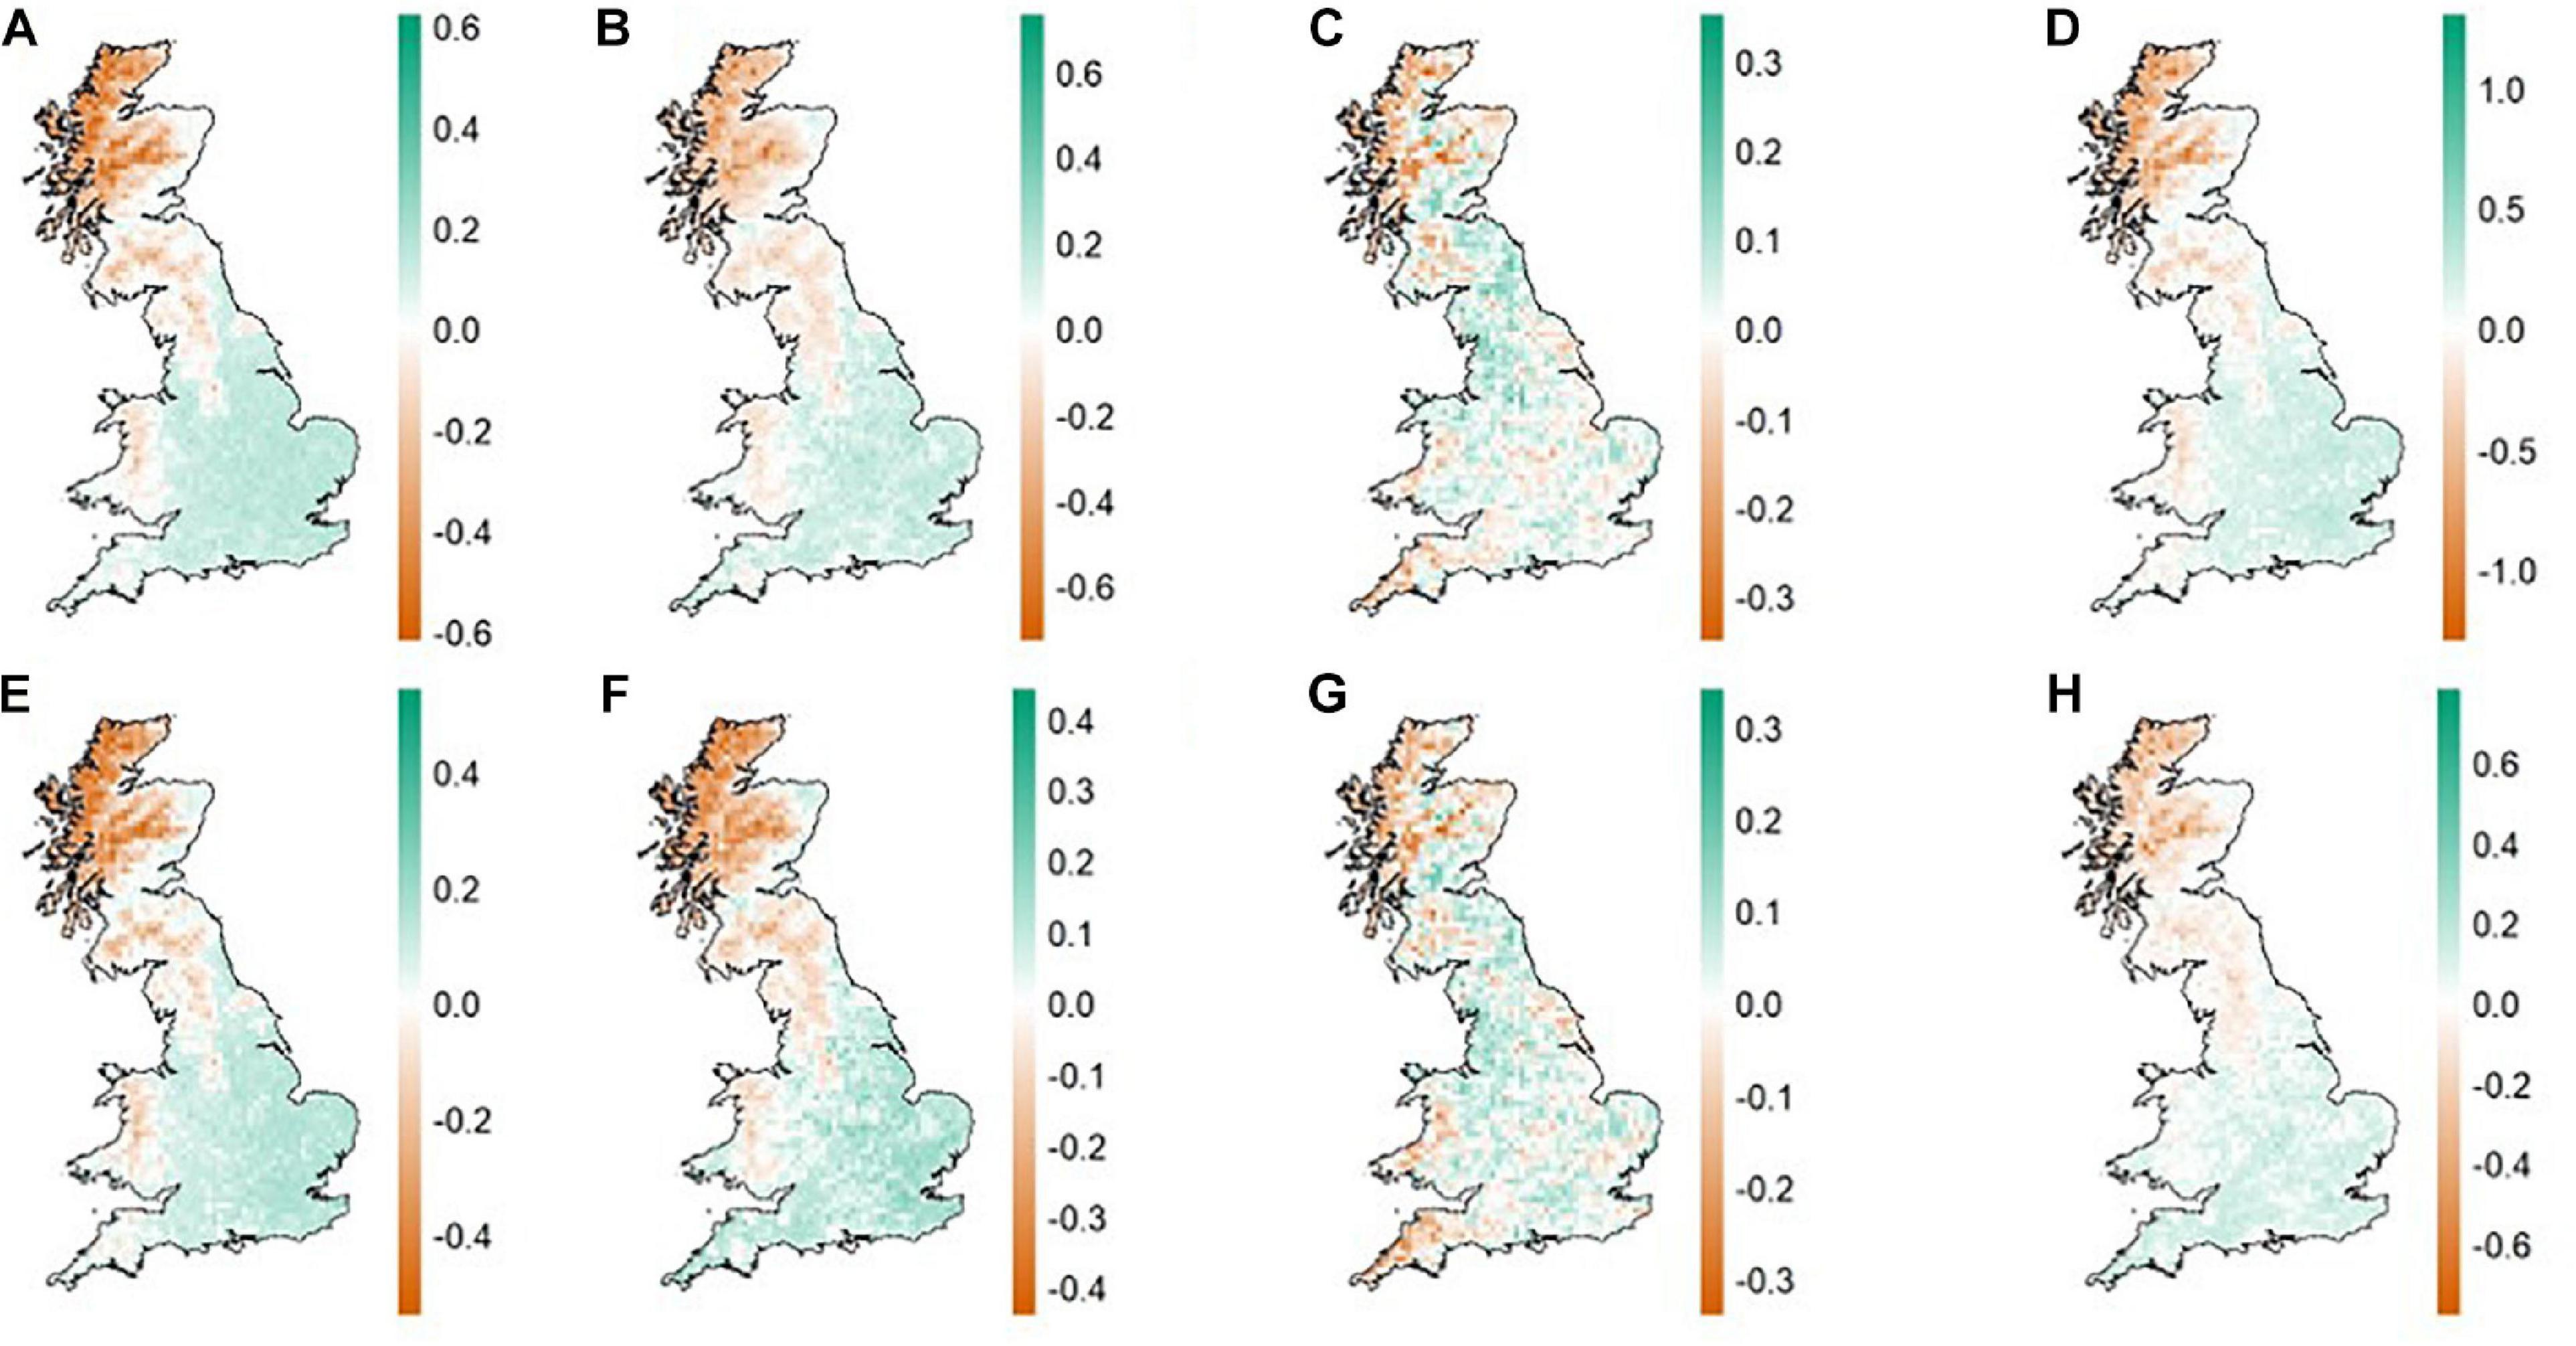
Figure 3. Heat maps of community dissimilarity in British breeding birds based on the first axis from a Principal co-ordinate analysis analysis (PCoA) for taxonomic and functional beta diversity, turnover, and nestedness resultant dissimilarity. Colors represent the ordering scores obtained from the PCoA, with areas displaying similar colors more similar and areas with differing colors less similar in terms of community composition. The first three maps on the first row (A–C) are for taxonomic beta-diversity (BDTOTAL, BDTURN, and BDNEST, respectively) and the first three maps on the second row (E–G) are for functional beta-diversity (FDTOTAL, FDTURN, and FDNEST, respectively). Mean nearest taxon distance (D) and mean pairwise distance (H) are the last maps on each row, respectively.
The pattern for MNTD was largely the same as that found for total taxonomic and functional beta-diversity and turnover (Figure 3D). MPD showed a pattern similar to that of nestedness for both taxonomic and functional beta diversity (Figure 3H).
Modelling the Drivers of Spatial Beta-Diversity
Overall, the variance explained by all the final models (bar those for MPD, FDNEST, and BDNEST) was high, with between 55.61% and 68.45% variance explained (Table 1). The variance explained by the final GDM models for MPD, FDNEST, and BDNEST was lower (between 9.60% and 12.09%) (Table 1). The deviance explained for the functional metrics was lower than for the taxonomic metrics (Table 1).
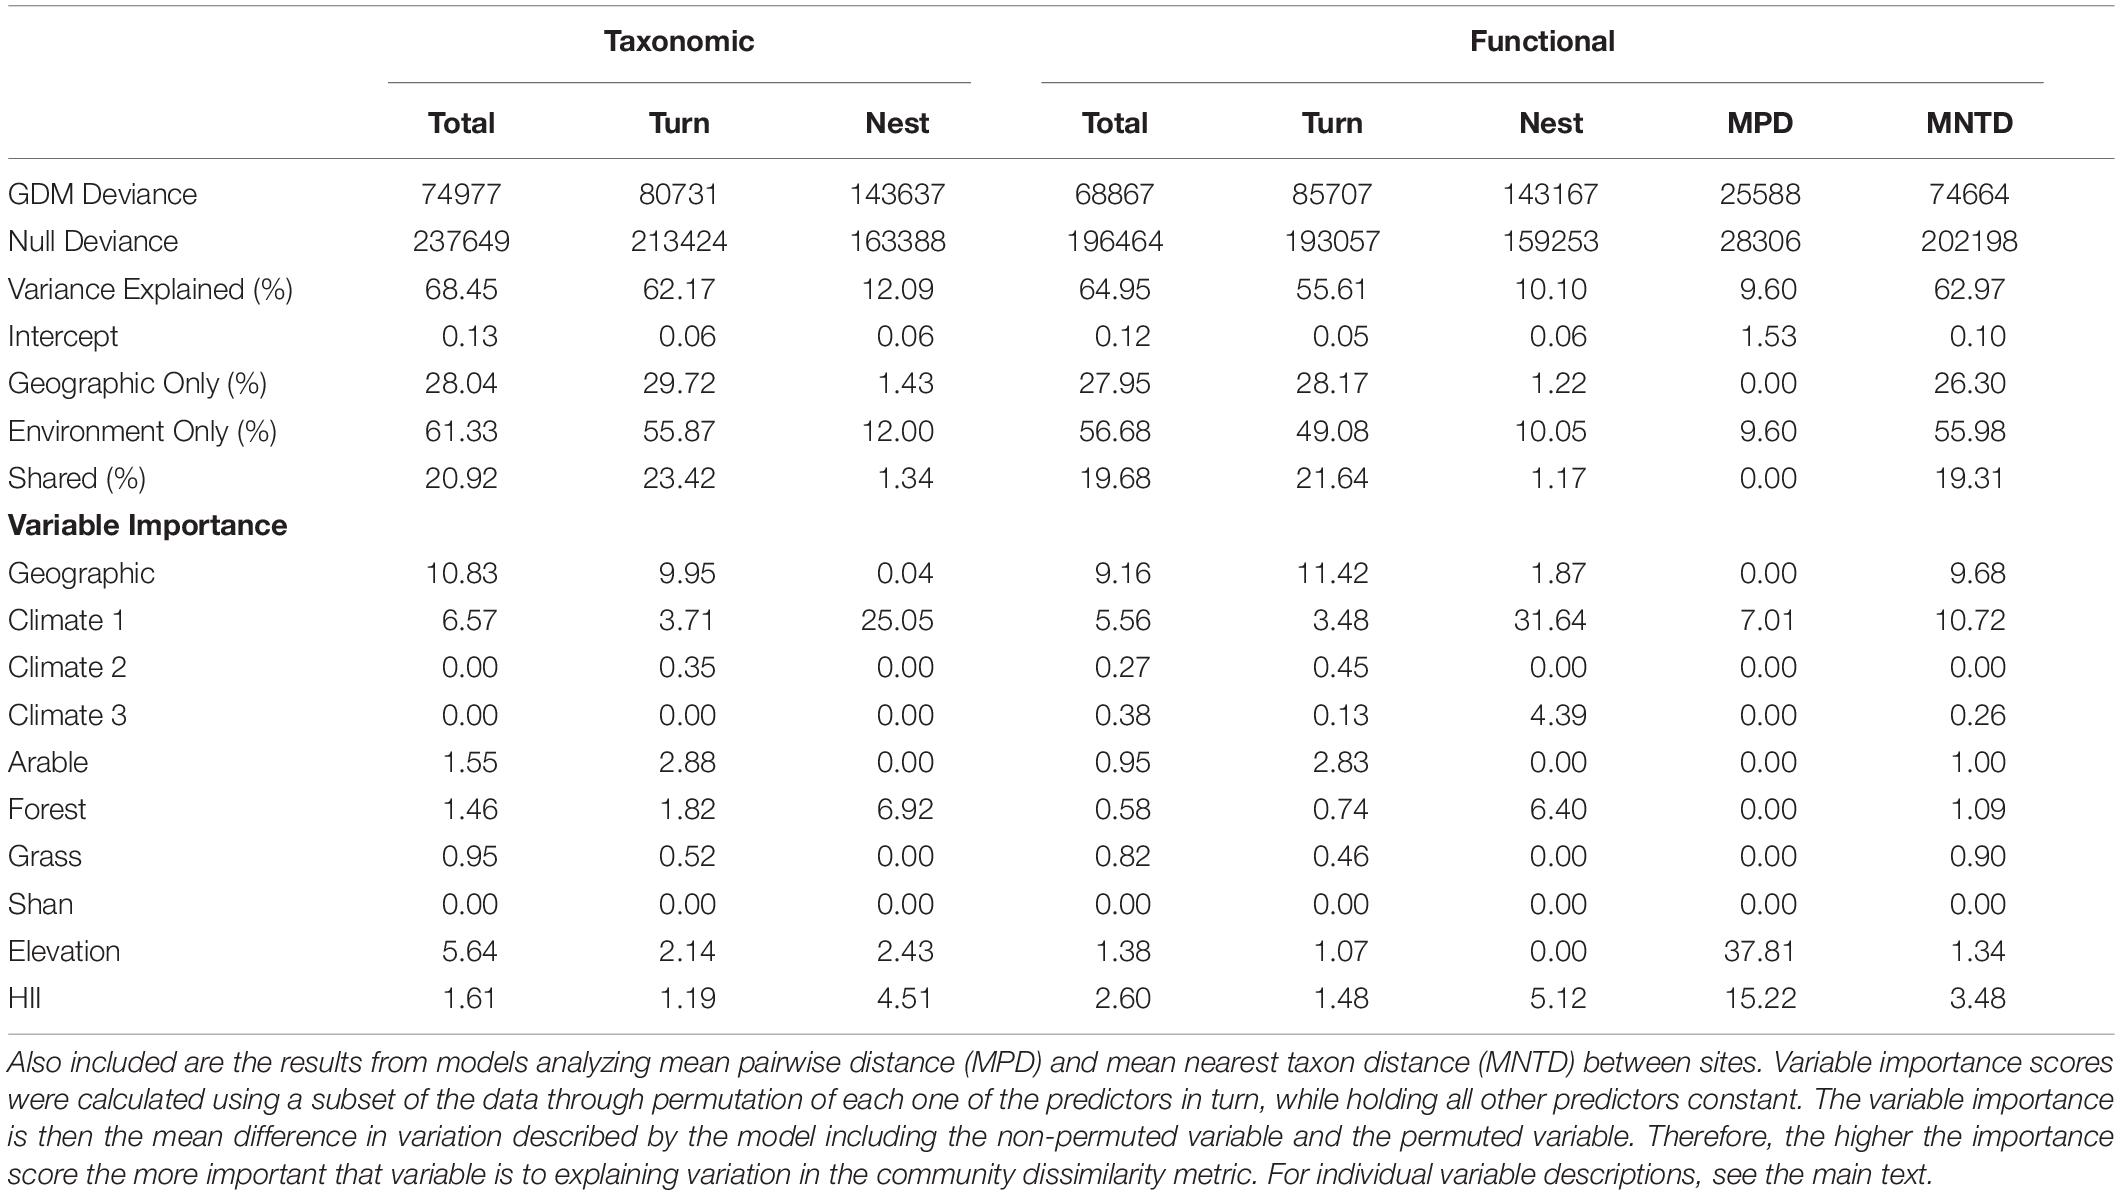
Table 1. Results of generalized dissimilarity models (GDMs) analyzing the spatial taxonomic and functional beta-diversity of British breeding birds as a function of environmental variables and geographical distance.
For all final models, the deviance explained by GDM models using only geographical distance as a predictor of dissimilarity was lower than the deviance explained by the models run using only the significant environmental variables (Table 1). However, there was overlap in the deviance explained by geographical distance and the environmental variables. Between 19.31% and 23.42% of the variance explained was shared within the MNTD, taxonomic, and functional beta-diversity models, excluding the FDNEST and BDNEST models (Table 1). For the nestedness components, the geographical distance between sites explained a low percentage of deviance (Table 1). Geographic distance was non-significant in the MPD model.
Drivers of Taxonomic Beta-Diversity
The following results (and those in the ‘Drivers of functional beta-diversity’ section) relate to the final models (i.e., the models that have been simplified using the permutation approach described in the methods).
BDTOTAL was most impacted by geographical distance, Climate 1, Elevation, and HII (in order of decreasing importance, Table 1). BDTOTAL rose gradually with geographical distance and Elevation, with a sharper rise observed for Climate 1 initially, followed by a leveling out (Figure 4A). HII had an initial effect on total beta-diversity, with a small but sharp increase observed over initial environmental dissimilarity, but then leveled off and remained relatively constant (Supplementary Figure 1). Arable, forest, and grass cover were also in the final BDTOTAL model (Supplementary Figure 4).
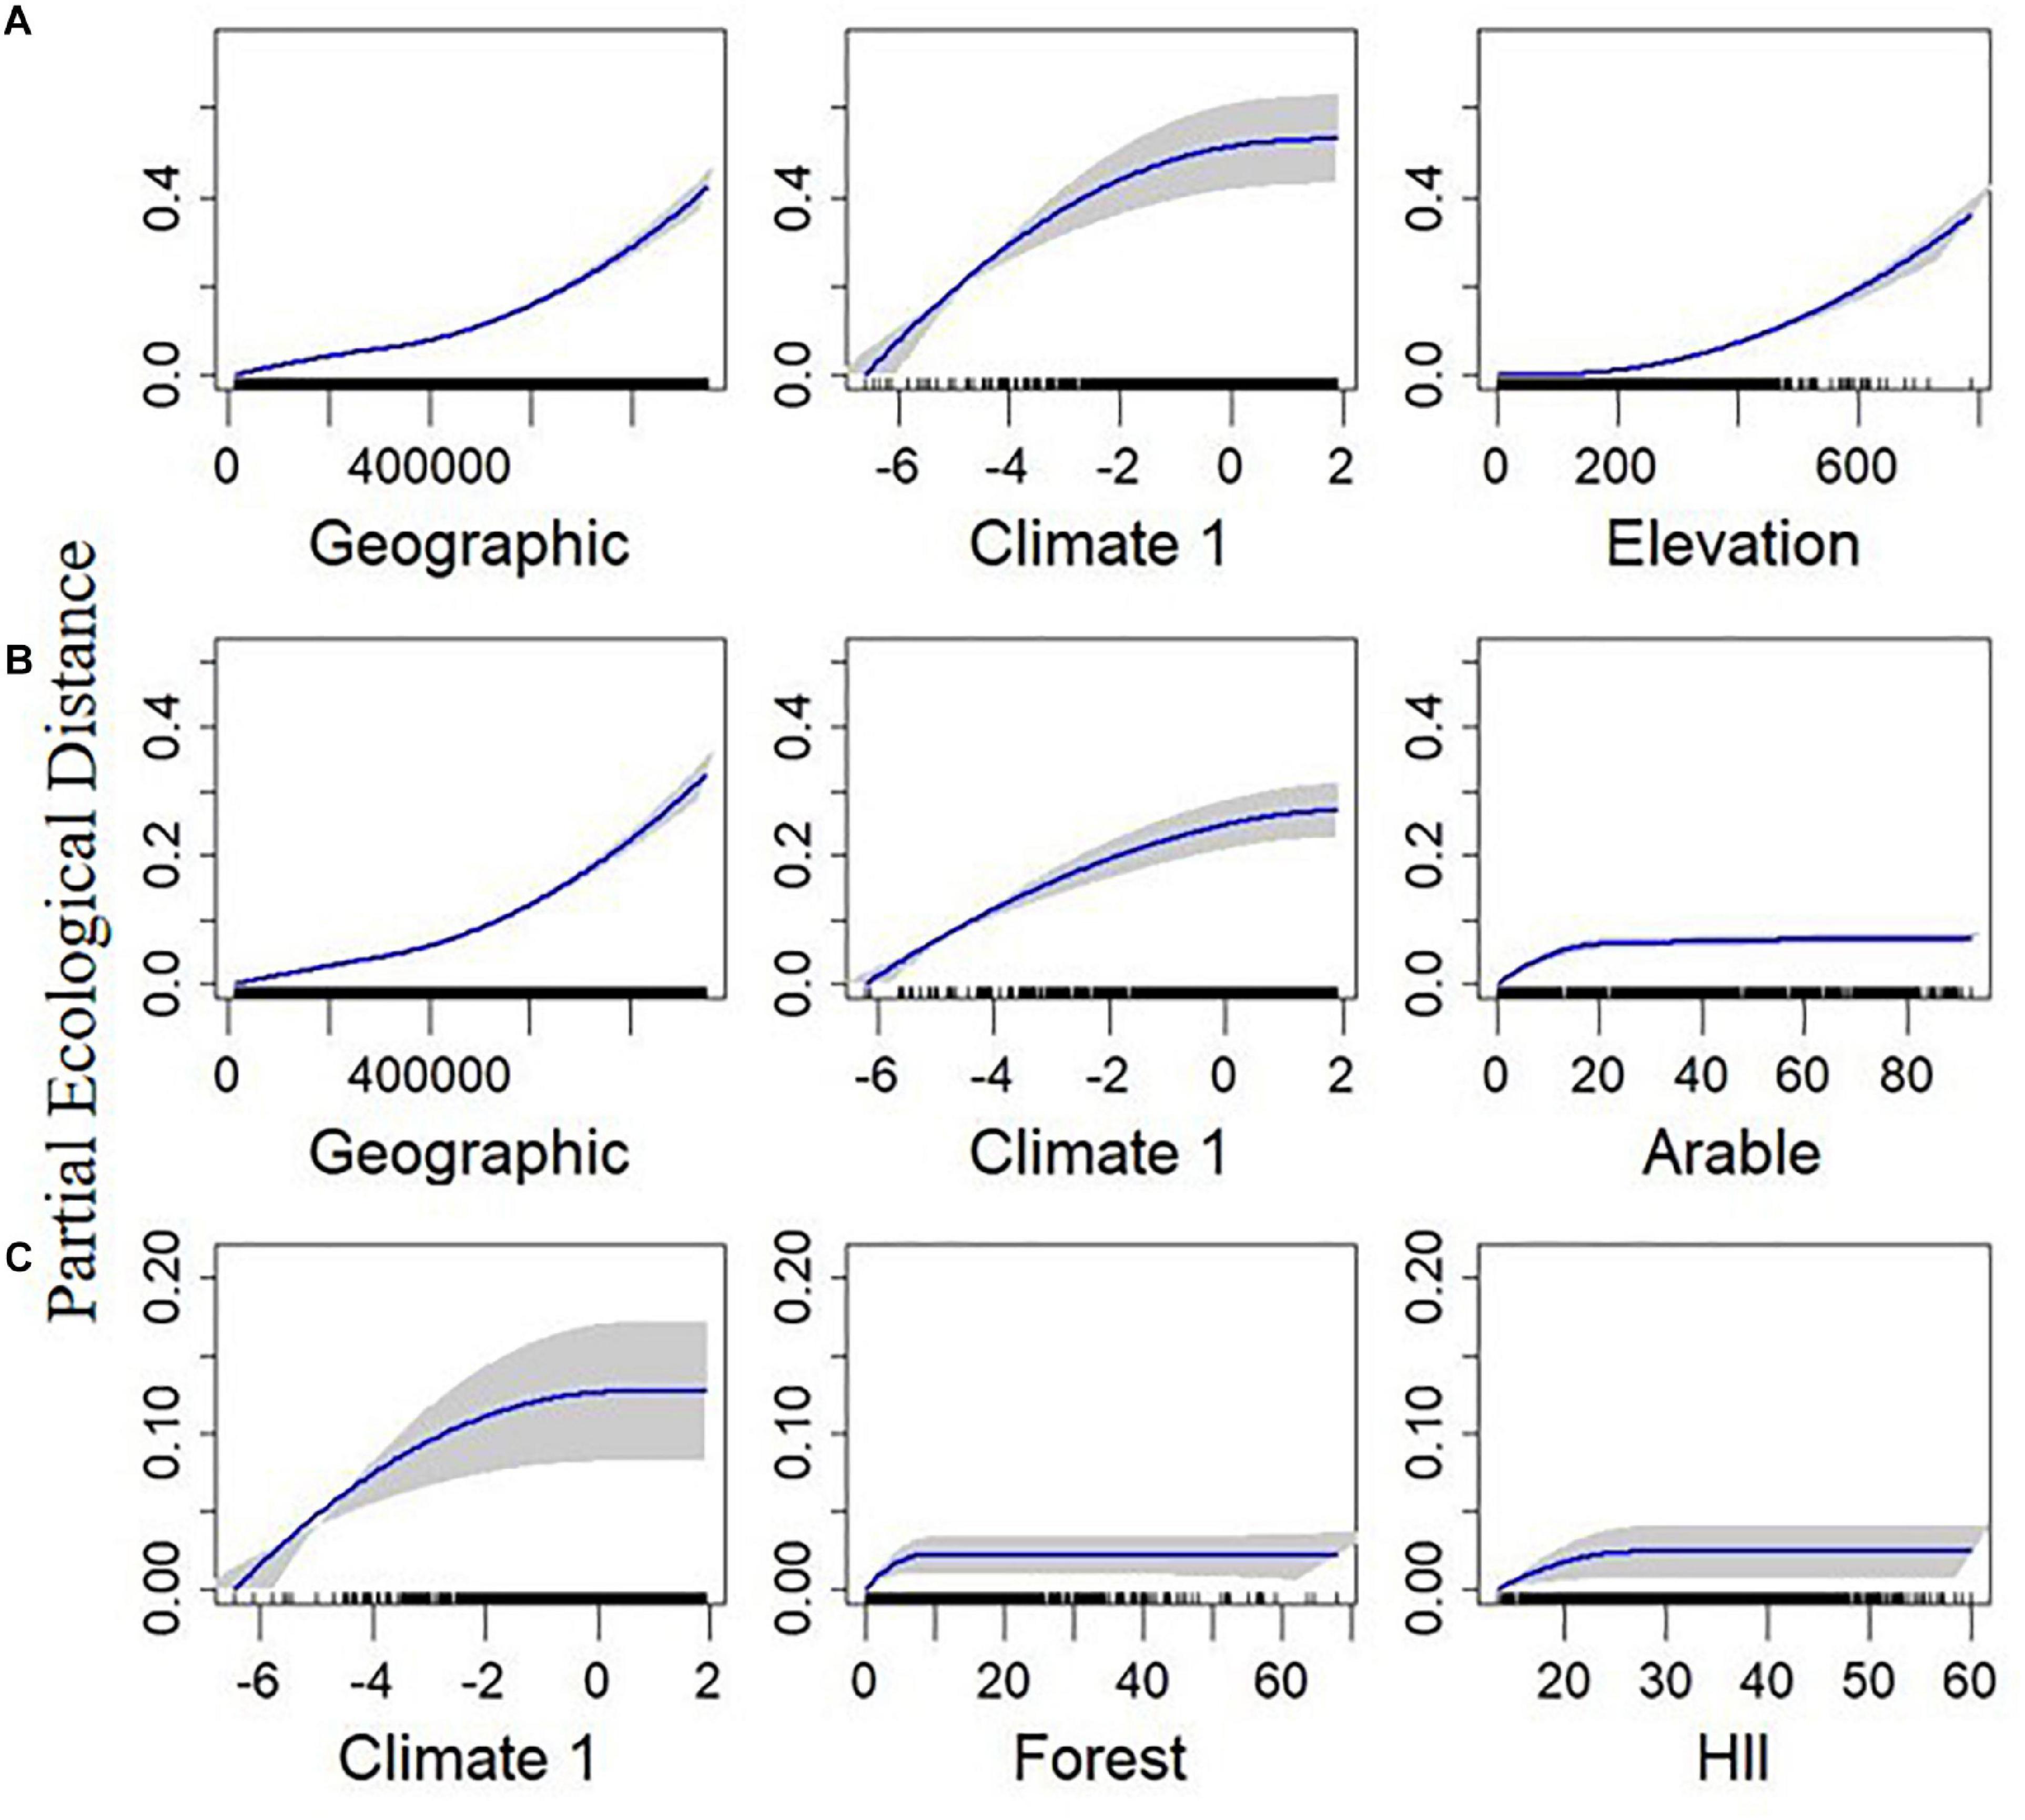
Figure 4. Plotted I-splines of the three most important variables (determined from the variable importance score) from generalized dissimilarity models analyzing the relationship between environmental and geographic gradients, and spatial community composition in British breeding birds. Plots on row (A) are for total Sorensen’s beta-diversity (BDTOTAL), (B) are for the turnover component (BDTURN), and (C) are for the nestedness resultant dissimilarity (BDNEST). Climate 1 is the first axis from a principal component analysis calculated from the average temperature, range of temperature, and precipitation over the months May to July, across the 2000–2011 period. Elevation is the average elevation across each 100 km2 quadrat. Forest and Arable are the percentage of each land use within each quadrat. The human influence index (HII) is the average human influence across each quadrat. Geographic is the geographic distance between sites. Curves show the relationship between the gradients and community dissimilarity obtained using I-splines. The most important variables are on the left with decreasing variable importance to the right. Blue lines show the I-Spline correlations, with standard deviation (gray shaded area) calculated through bootstrapping (100 permutations) on a portion of the dataset. A rug plot on the x axis shows the spread of the data. Note the varying y-axis for each measure.
Geographical distance, Climate 1, and arable land cover (in order of decreasing importance) had similar impacts on BDTURN as they did on BDTOTAL (Figure 4B). Elevation and forest cover were the two other most important variables in regard to this response variable, with turnover increasing sharply with forest cover initially before leveling off, and a near-linear increase with elevation (Supplementary Figure 5). HII, grass cover, and Climate 2 were also included in the final BDTURN model (Supplementary Figure 5).
Geographical distance was relatively unimportant for predicting BDNEST, although it was included in the final model. The best predictor (the predictors with the highest variable importance values; Table 1) for BDNEST was Climate 1, and its relationship was similar to that found for BDTOTAL (Figure 4C). Forest cover, HII, and elevation were also in the final model (Supplementary Figure 6).
Drivers of Functional Beta-Diversity
FDTOTAL had a similar relationship with geographic distance, Climate 1 and HII as was observed with BDTOTAL, and they were also the three most important predictors (Figure 5A). Elevation had an almost linear relationship with FDTOTAL (Supplementary Figure 7). Arable, grass, and forest cover, along with the other two climate axes (Climate 2 and Climate 3), were also included in the final FDTOTAL model (Supplementary Figure 7).
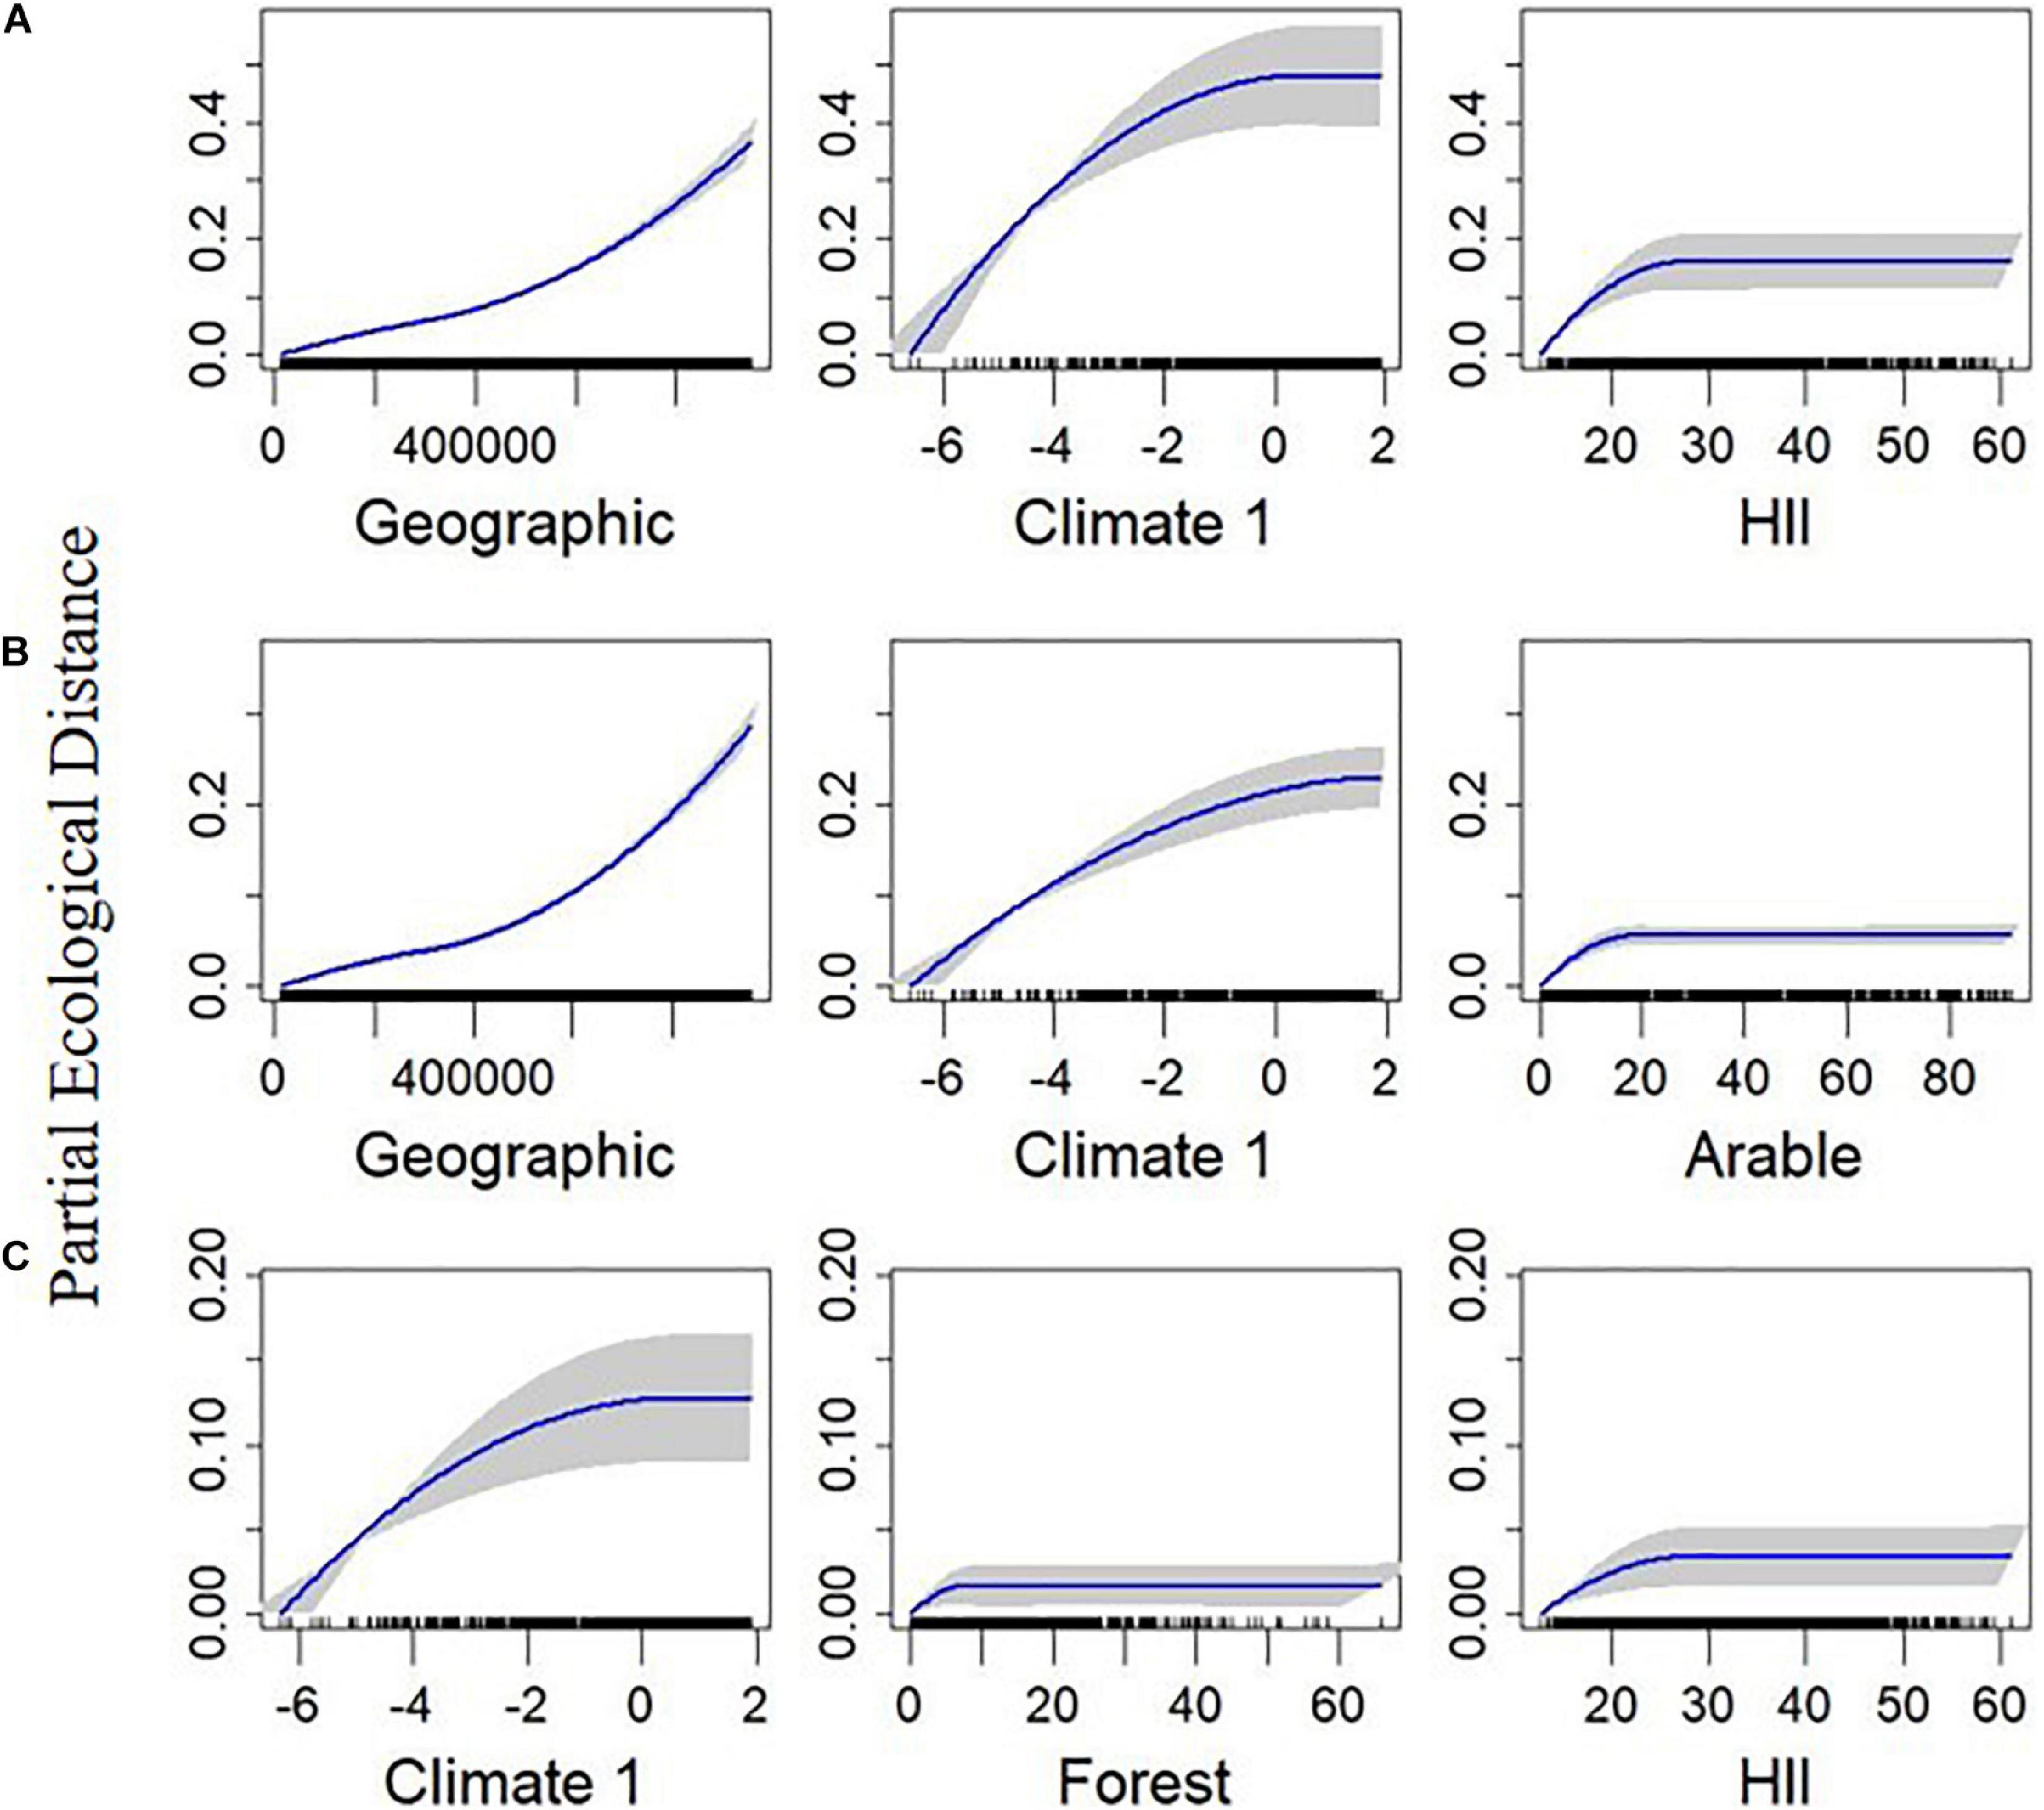
Figure 5. Plotted I-splines of the three most important variables (determined from the variable importance score) from generalized dissimilarity models analyzing the relationship between environmental and geographic gradients, and spatial community composition in British breeding birds. Plots on row (A) are for total functional beta-diversity (FDTOTAL), (B) are for the turnover component (FDTURN), and (C) are for the nestedness resultant dissimilarity (FDNEST). Climate 1 is the first axis from a principal component analysis calculated from the average temperature, range of temperature, and precipitation over the months May to July, across the 2000–2011 period. Forest and Arable are the percentage of each land use within each quadrat. The human influence index (HII) is the average human influence across each quadrat. Geographic is the geographical distance between sites. Curves show the relationship between the gradients and community dissimilarity obtained using I-splines. The most important variables are on the left with decreasing variable importance to the right. Blue lines show the I-Spline correlations, with standard deviation (gray shaded area) calculated through bootstrapping (100 permutations) on a portion of the dataset. A rug plot on the x axis shows the spread of the data. Note the varying y-axis for each measure.
The main difference between the FDTURN and BDTURN final models was the inclusion of Climate 3 for FDTURN, and a slight difference in the ordering of the variable importance (Table 1, Figure 5B and Supplementary Figure 8). FDNEST, as with BDNEST, was also unaffected by geographical distance (Table 1). FDNEST was impacted by Climate 1, forest cover, HII, climate 3, and geographical distance (Figure 5C and Supplementary Figure 9).
MNTD was mainly impacted by Climate 1, geographical distance, HII, Elevation, and forest cover (Figure 6A and Supplementary Figure 10). Overall, the final MNTD model contained the same significant predictors as in the final models for BDTOTAL and FDTOTAL, and similar relationships were found with all the predictors, although the order was slightly different (Supplementary Figure 10). MPD was the only measure not predicted by geographical distance (Table 1). MPD was found to sharply increase with Elevation before leveling off around 100 m (Figure 6B). HII was the next best predictor of MPD and its relationship was different to that found with the other measures, with a curvilinear increase observed midway through the gradient (Figure 6B). The relationship between Climate 1 and MPD was also different to that found between the predictor and the other response variables, with a threshold effect found near the tail end of the gradient (Figure 6B).
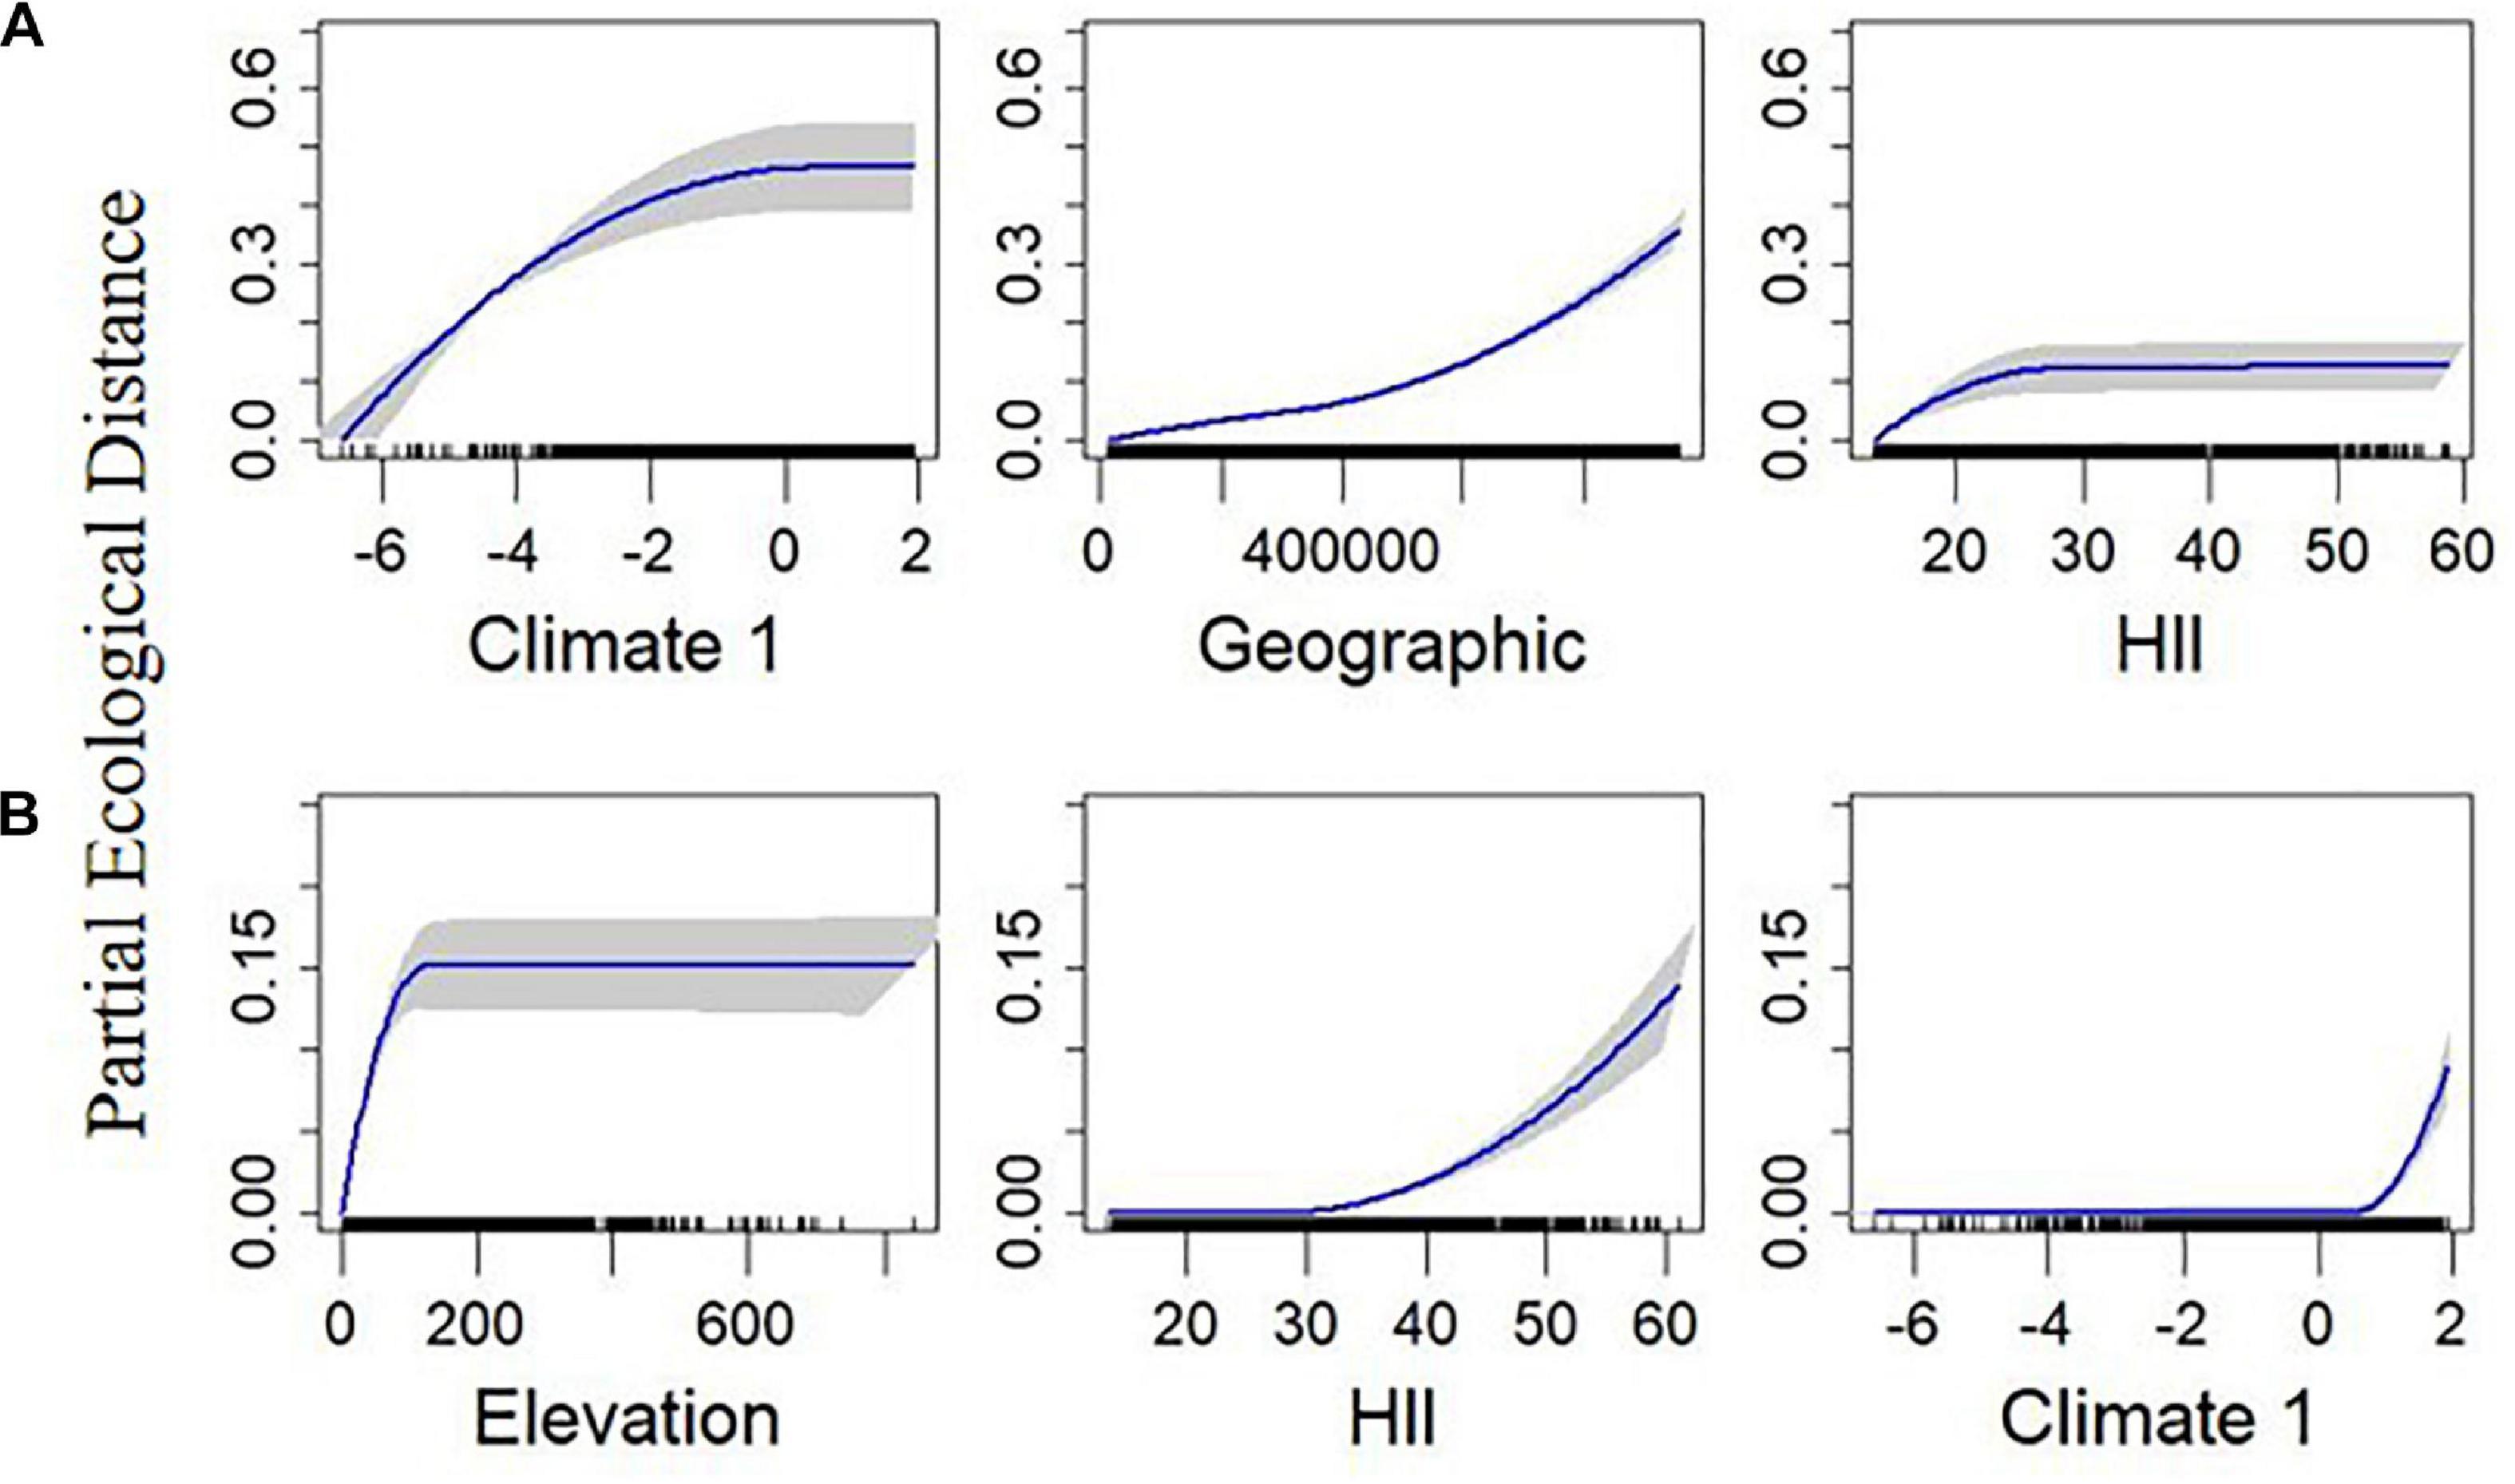
Figure 6. Plotted I-splines of the three most important variables (determined from the variable importance score) from generalized dissimilarity models analyzing the relationship between environmental and geographic gradients, and spatial community composition in British breeding birds. Plots on row (A) are for standardised mean nearest taxon distance (MNTD) and (B) are for standardised mean pairwise distance (MPD). Climate 1 is the first axis from a principal component analysis calculated from the average temperature, range of temperature, and precipitation over the months May to July, across the 2000 – 2011 period. Elevation is the average elevation across each 100 km2 quadrat. The human influence index (HII) is the average human influence across each quadrat. Geographic is the geographical distance between sites. Curves show the relationship between the gradients and community dissimilarity obtained using I-splines. The most important variables are on the left with decreasing variable importance to the right. Blue lines show the I-Spline correlations, with standard deviation (gray shaded area) calculated through bootstrapping (100 permutations) on a portion of the dataset. A rug plot on the x axis shows the spread of the data. Note the varying y-axis for each measure.
It should be noted that a large majority of the predictors were close in their variable importance scores across the models (Table 1). The geographical distance between sites was the exception across the models, as it was the most important predictor by a large proportion in all but the two nestedness, and MPD/MNTD models. It is also important to note that although multicollinearity was assessed, geographic structuring of certain predictors may mean that the permutation of the variables may not have resulted in large importance values if geographic distance was retained in the model.
Discussion
We found that variation in overall spatial functional and taxonomic beta-diversity (and their turnover components) of British breeding avian assemblages is driven by a combination of geographical distance per se and environmental gradients. The environment-only models explained more deviance than the geographic distance only models, but there was also a relatively large, shared variance explained component. Previous studies have suggested that this shared component be considered as indirect effects of climate (climate distance, Mazel et al., 2017; Qian et al., 2020). This may suggest that geographic distance plays a comparatively small role in predicting compositional differences between assemblages in contrast to environment. This aligns with previous studies that have shown that spatial variation in community composition, for a wide range of taxa, can be attributed to a combination of deterministic (including contemporary and historical), and stochastic factors (Steinitz et al., 2006; Melo et al., 2009; Dobrovolski et al., 2012; Vicente et al., 2014; Baselga et al., 2015; Glassman et al., 2017; Carvalho et al., 2020). However, we also found that the differences in species loss/gain between sites (as measured by nestedness resultant dissimilarity) were explained mostly by differences in climate, and to a lesser extent, land use. Overall variation explained by the nestedness models was, however, much lower than for the total beta-diversity and turnover models. The lower explanatory power of the nestedness models implies that other drivers not included here may be impacting dissimilarity between sites due to species loss and gains.
Geographical Distance
Both BDTOTAL and FDTOTAL were driven mostly by the turnover component, highlighting that compositional differences between communities in Britain are mainly a result of different species being replaced. This is consistent with other beta-diversity studies, across multiple taxa (see Soininen et al., 2018). A slow initial increase followed by a steeper rise in the slope of the I-splines of geographical distance in respect to turnover highlights a north-south divide, or a divide between the ‘Tees-exe’ line, in community dissimilarity (Figure 1B). The observed impact of distance could be due to dispersal limitation, geographical barriers, or historical factors (Nekola and White, 1999; Soininen et al., 2007; Dobrovolski et al., 2012; Barnagaud et al., 2017). Here, we expect it is a combination of all these factors, as well as an intertwining of distance with climate and land use.
FDTURN was lower than BDTURN, indicating that the species that are being turned over across communities share some functional traits. Petchey et al. (2007) found that many co-occurring species in British breeding birds were functionally similar, indicating low functional diversity across Britain as a whole and within individual communities. The low functional alpha diversity observed by Petchey et al. (2007) may partly explain the lower functional turnover compared to taxonomic turnover observed here.
Nestedness made up a lower proportion of the total beta-diversity for both the taxonomic and functional metrics. Functional nestedness was mostly on par with taxonomic nestedness (Figure 2), highlighting that species lost/gained between assemblages were not functionally redundant (Petchey et al., 2007). The functional distinction of species lost/gained spatially between communities’ highlights that there is a significant difference between northern/southern communities. The observed pattern is partially congruent with elevational peaks in Britain (the Tees-exe line; Prakash and Rumsey, 2018). The pattern is also supported by MPD, a measure independent of species richness (Figure 3H). It is interesting to note that of the variables that were significant in the MPD model, elevation was the most important and had a threshold effect with any communities over ∼100 m being dissimilar to those at lower elevations (Figure 6B). The results found here align with previous evidence that indicate the importance of elevational gradients as environmental filters (Sanders and Rahbek, 2012; Pigot et al., 2016).
Climate
Climate1 was included in the top three most important variables for all the final models (Table 1). The impact of climate was similar across all final models (except for the MPD model), with an almost linear relationship observed with dissimilarity before a leveling off. As the correlations with the original climate variables showed a positive correlation with average temperature and a negative correlation with precipitation, this relates to a divide between warmer, drier, and wetter, cooler regions. The near linear relationship between partial ecological distance and Climate 1 for many of the metrics therefore shows a divide in terms of assemblage composition between these two types of regions. Climate was also the best predictor of nestedness by a large margin. This may point to climatic filtering of certain species, with a divide between north and south Britain. However, the overall pattern for both measures was patchy (Figures 2C,G). With global warming predicted to change the seasonality and severity of rainfall within Britain in the coming decades (Watts et al., 2015), these results indicate that drier and hotter summers in the future could lead to shifts in community composition.
Land Use and the Human Influence Index
While the overall impact of the different land-use types differed, the form of the relationship between the various land-use predictors and all the measures of beta-diversity were similar. After an initial sharp increase in community dissimilarity over the first small portion of the range of the environmental gradient, the dissimilarity leveled out. This impact over the initial environmental dissimilarity highlights the difference in community composition between areas with none of that land cover, and those with just a small percentage.
HII impacted spatial variation in communities in much the same way as the land-use predictors. After an initial increase in dissimilarity between communities with increasing HII, there was a leveling off. There are several reasons why this could be the case. For example, Tratalos et al. (2007) found that richness of all species initially increased faster with household densities (one of the measures included in the HII) than urban adapted species, but these then declined significantly after peaking at a very low density. For urban areas, captured within HII, this could highlight the initial homogenization impact of urbanization, with urban areas similar after this initial disturbance driven by an increase in generalists and loss of specialists (Davey et al., 2012). However, as HII is a composite measure, this cannot be conclusively confirmed from these results alone. The human influence captured in this measure may also be masked at this scale as it is likely that a remnant of suitable habitat with lower human disturbance exists within a quadrat, or near to a quadrat (Fattorini et al., 2016). As this study is also only considering presence/absence, it also makes no inferences about abundance, which is likely more sensitive to human influence, and which could be very different between quadrats (Tratalos et al., 2007).
Future Climate and Land-use Change
The importance of both climate and land-use variables points toward potential future disruption of community composition if these drivers increase in intensity as is expected (Seto et al., 2012; Watts et al., 2015). The latitudinal divide between northern and southern (or highland and lowland) community composition also indicates that future warming could see species extirpations/extinctions from the colder, northern regions of the United Kingdom (Tayleur et al., 2016). This would also likely see an increased similarity of the northern communities with southern communities as southern species extend their ranges northward (Hickling et al., 2006). However, species extending their ranges into the UK from Europe could obscure this impact, so studies approaching this question should focus on species identities. Indeed, this has already been observed in the study of bird abundance within England, with resident and short-distance migrants increasing in abundance through time potentially at the expense of long-distance migrants, habitat specialists and cold-associated species (Pearce-Higgins et al., 2015). With many rare species also dispersal limited, future changes in land-use and climate could potentially extirpate some of the few rare bird species Britain has (Baur, 2014).
Limitations
While we consider a range of predictors, we have not included measures of biotic interactions. Competitive interactions and predator presence/abundance can all have an impact on spatial beta-diversity (Wittwer et al., 2015; Koròan and Svitok, 2018). Abundance differences between sites were also not directly considered due to a lack of appropriate data. Given that a species’ abundance can be an important determinant of that species’ influence on ecosystem functioning (Winfree et al., 2015; Gaston et al., 2018), future studies aiming to analyze spatial variation in community and functional composition should attempt to analyze measures of population size.
Conclusion
Spatial variation in both the taxonomic and functional composition of United Kingdom breeding birds is driven mainly by species turnover, which can be explained through a combination of geographical distance per se and environmental gradients. The unique variance explained by distance alone could reflect an important role for dispersal limitation in driving these patterns, but more work is needed, as this variance component could also be due to a process not considered here. In contrast, species loss/gain, observed through nestedness between sites, was driven mainly by environmental factors. Future climate warming and land-use change could lead to an increase in the loss of species, particularly cold-adapted or rare and dispersal-limited, from communities, particularly in the north and in the uplands. With turnover driving these patterns, broad-ranging conservation efforts would be preferable to conservation focused on target areas (Si et al., 2016).
Future work should look for potential synergies between climate and land-use in order to assess if future increases in both could potentially have larger than expected impacts on biodiversity based on the individual effects of each in isolation (Brook et al., 2008; de Chazal and Rounsevell, 2009; Mantyka-pringle et al., 2012; Frishkoff et al., 2016). Future comparison between the results presented here and results of similar tests from areas in different climate regions or in less disturbed regions than the United Kingdom would also be informative. For example, in tropical systems it would be expected that, as the United Kingdom is a post-perturbation system and rates of habitat loss will be higher in the tropics, land use will play a larger role in driving community composition dissimilarity between sites than found here (Hansen et al., 2013). Another potential future research direction could be to assess whether other taxonomic groups within the British Isles have similar patterns of functional or taxonomic beta-diversity, or whether the patterns observed here are bird-specific.
Data Availability Statement
Publicly available datasets were analyzed in this study. These data can be found here: http://www.bto.org/datasets.
Author Contributions
JW, JS, TP, and TJM conceived the original idea. JT collected the trait data. JW performed the analysis with input from JS, TP, and TJM. JW wrote the manuscript with significant contributions from TJM. All authors contributed to the writing and commented on the draft.
Funding
Central OA block grant processed through the University of Birmingham.
Conflict of Interest
The authors declare that the research was conducted in the absence of any commercial or financial relationships that could be construed as a potential conflict of interest.
Acknowledgments
We thank British Trust of Ornithology (BTO) volunteers for their hard work in collecting the data. We are also grateful to the Sir Stanley Stapley Trust for financial support (to JW). The computations described in this manuscript were performed using the University of Birmingham’s BlueBEAR HPC service.
Supplementary Material
The Supplementary Material for this article can be found online at: https://www.frontiersin.org/articles/10.3389/fevo.2021.620062/full#supplementary-material
References
Auffret, A. G., and Thomas, C. D. (2019). Synergistic and antagonistic effects of land use and non-native species on community responses to climate change. Glob. Change Biol. 25, 4303–4314. doi: 10.1111/gcb.14765
Barbet-Massin, M., and Jetz, W. (2015). The effect of range changes on the functional turnover, structure and diversity of bird assemblages under future climate scenarios. Glob. Change Biol. 21, 2917–2928. doi: 10.1111/gcb.12905
Barnagaud, J. Y., Kissling, W. D., Tsirogiannis, C., Fisikopoulos, V., Villéger, S., Sekercioglu, C. H., et al. (2017). Biogeographical, environmental and anthropogenic determinants of global patterns in bird taxonomic and trait turnover. Glob. Ecol. Biogeogr. 26, 1190–1200. doi: 10.1111/geb.12629
Baselga, A. (2010). Partitioning the turnover and nestedness components of beta diversity. Glob. Ecol. Biogeogr. 19, 134–143. doi: 10.1111/j.1466-8238.2009.00490.x
Baselga, A. (2012). The relationship between species replacement, dissimilarity derived from nestedness, and nestedness. Glob. Ecol. Biogeogr. 21, 1223–1232. doi: 10.1111/j.1466-8238.2011.00756.x
Baselga, A., Bonthoux, S., and Balent, G. (2015). Temporal beta diversity of bird assemblages in agricultural landscapes: land cover change vs. stochastic processes. PLoS One 10:e0127913. doi: 10.1371/journal.pone.0127913
Baselga, A., and Leprieur, F. (2015). Comparing methods to separate components of beta diversity. Methods Ecol. Evol. 6, 1069–1079. doi: 10.1111/2041-210X.12388
Baselga, A., and Orme, C. D. L. (2012). Betapart: an R package for the study of beta diversity. Methods Ecol. Evol. 3, 808–812. doi: 10.1111/j.2041-210X.2012.00224.x
Batt, R. D., Morley, J. W., Selden, R. L., Tingley, M. W., and Pinsky, M. L. (2017). Gradual changes in range size accompany long-term trends in species richness. Ecol. Lett. 20, 1148–1157. doi: 10.1111/ele.12812
Baur, B. (2014). Dispersal-limited species - A challenge for ecological restoration. Basic Appl. Ecol. 15, 559–564. doi: 10.1016/j.baae.2014.06.004
Bell, J. R., Botham, M. S., Henrys, P. A., Leech, D. I., Pearce-Higgins, J. W., Shortall, C. R., et al. (2019). Spatial and habitat variation in aphid, butterfly, moth and bird phenologies over the last half century. Glob. Change Biol. 25, 1982–1994. doi: 10.1111/gcb.14592
Brook, B. W., Sodhi, N. S., and Bradshaw, C. J. A. (2008). Synergies among extinction drivers under global change. Trends Ecol. Evol. 23, 453–460. doi: 10.1016/j.tree.2008.03.011
Calderón-Patrón, J. M., Goyenechea, I., Ortiz-Pulido, R., Castillo-Cerón, J., Manriquez, N., Ramírez-Bautista, A., et al. (2016). Beta diversity in a highly heterogeneous area: disentangling species and taxonomic dissimilarity for terrestrial vertebrates. PLoS One 11:e0160438. doi: 10.1371/journal.pone.0160438
Cardinale, B. J., Duffy, J. E., Gonzalez, A., Hooper, D. U., Perrings, C., Venail, P., et al. (2012). Biodiversity loss and its impact on humanity. Nature 486, 59–67. doi: 10.1038/nature11148
Cardoso, P., Rigal, F., Carvalho, J. C., Fortelius, M., Borges, P. A. V., Podani, J., et al. (2014). Partitioning taxon, phylogenetic and functional beta diversity into replacement and richness difference components. J. Biogeogr. 41, 749–761. doi: 10.1111/jbi.12239
Carvalho, J. C., Malumbres-Olarte, J., Arnedo, M. A., Crespo, L. C., Domenech, M., and Cardoso, P. (2020). Taxonomic divergence and functional convergence in Iberian spider forest communities: insights from beta diversity partitioning. J. Biogeogr. 47, 288–300. doi: 10.1111/jbi.13722
Clavel, J., Julliard, R., and Devictor, V. (2011). Worldwide decline of specialist species: toward a global functional homogenization? Front. Ecol. Environ. 9:222–228. doi: 10.1890/080216
Cornwell, W. K., Schwilk, D. W., and Ackerly, D. D. (2006). A trait-based test for habitat filtering: convex hull volume. Ecology 87, 1465–1471. doi: 10.1890/0012-9658(2006)87[1465:attfhf]2.0.co;2
Currie, D. J. (1991). Energy and large-scale patterns of animal and plant species richness. Am. Nat. 137, 27–49. doi: 10.1086/285144
Currie, D. J., Mittelbach, G. G., Cornell, H. V., Field, R., Guégan, J. F., Hawkins, B. A., et al. (2004). Predictions and tests of climate-based hypotheses of broad-scale variation in taxonomic richness. Ecol. Lett. 7, 1121–1134. doi: 10.1111/j.1461-0248.2004.00671.x
Dambros, C. S., Morais, J. W., Azevedo, R. A., and Gotelli, N. J. (2017). Isolation by distance, not rivers, control the distribution of termite species in the Amazonian rain forest. Ecography 40, 1242–1250. doi: 10.1111/ecog.02663
Davey, C. M., Chamberlain, D. E., Newson, S. E., Noble, D. G., and Johnston, A. (2012). Rise of the generalists: evidence for climate driven homogenization in avian communities. Glob. Ecol. Biogeogr. 21, 568–578. doi: 10.1111/j.1466-8238.2011.00693.x
de Chazal, J., and Rounsevell, M. D. A. (2009). Land-use and climate change within assessments of biodiversity change: a review. Glob. Environ. Change 19, 306–315. doi: 10.1016/j.gloenvcha.2008.09.007
Devictor, V., Julliard, R., Couvet, D., Lee, A., and Jiguet, F. (2007). Functional homogenization effect of urbanization on bird communities. Conserv. Biol. 21, 741–751. doi: 10.1111/j.1523-1739.2007.00671.x
Devictor, V., Mouillot, D., Meynard, C., Jiguet, F., Thuiller, W., and Mouquet, N. (2010). Spatial mismatch and congruence between taxonomic, phylogenetic and functional diversity: the need for integrative conservation strategies in a changing world. Ecol. Lett. 13, 1030–1040. doi: 10.1111/j.1461-0248.2010.01493.x
Dirzo, R., Young, H. S., Galetti, M., Ceballos, G., Isaac, N. J. B., and Collen, B. (2014). Defaunation in the Anthropocene. Science 345, 401–406. doi: 10.1126/science.1251817
Dobrovolski, R., Melo, A. S., Cassemiro, F. A. S., and Diniz-Filho, J. A. F. (2012). Climatic history and dispersal ability explain the relative importance of turnover and nestedness components of beta diversity. Glob. Ecol. Biogeogr. 21, 191–197. doi: 10.1111/j.1466-8238.2011.00671.x
Eskildsen, A., Carvalheiro, L. G., Kissling, W. D., Biesmeijer, J. C., Schweiger, O., and Høye, T. T. (2015). Ecological specialization matters: long-term trends in butterfly species richness and assemblage composition depend on multiple functional traits. Divers. Distrib. 21, 792–802. doi: 10.1111/ddi.12340
Fattorini, S., Galassi, D. M. P., and Strona, G. (2016). When human needs meet beetle preferences: tenebrionid beetle richness covaries with human population on the Mediterranean islands. Insect Conserv. Divers. 9, 369–373. doi: 10.1111/icad.12170
Ferrier, S. (2002). Mapping spatial pattern in biodiversity for regional conservation planning: where to from here? Syst. Biol. 51, 331–363. doi: 10.1080/10635150252899806
Ferrier, S., Manion, G., Elith, J., and Richardson, K. (2007). Using generalized dissimilarity modelling to analyse and predict patterns of beta diversity in regional biodiversity assessment. Divers. Distrib. 13, 252–264. doi: 10.1111/j.1472-4642.2007.00341.x
Field, R., Hawkins, B. A., Cornell, H. V., Currie, D. J., Diniz-Filho, J. A. F., Guégan, J. F., et al. (2009). Spatial species-richness gradients across scales: a meta-analysis. J. Biogeogr. 36, 132–147. doi: 10.1111/j.1365-2699.2008.01963.x
Fitzpatrick, M. C., and Keller, S. R. (2015). Ecological genomics meets community-level modelling of biodiversity: mapping the genomic landscape of current and future environmental adaptation. Ecol. Lett. 18, 1–16. doi: 10.1111/ele.12376
Fitzpatrick, M. C., Sanders, N. J., Normand, S., Svenning, J. C., Ferrier, S., Gove, A. D., et al. (2013). Environmental and historical imprints on beta diversity: insights from variation in rates of species turnover along gradients. Proc. R. Soc. B Biol. Sci. 280:20131201. doi: 10.1098/rspb.2013.1201
Fitzpatrick, M. C., Mokany, K., Manion, G., Lisk, M., Ferrier, S., and Nieto-Lugilde, D. (2020). gdm: Generalised Dissimilarity Modeling. R Package Version 1.4.2. Avaliable at: https://CRAN.R-project.org/package=gdm.
Flohre, A., Fischer, C., Aavik, T., Bengtsson, J., Berendse, F., Bommarco, R., et al. (2011). Agricultural intensification and biodiversity partitioning in European landscapes comparing plants, carabids, and birds. Ecol. Appl. 21, 1772–1781. doi: 10.1890/10-0645.1
Fluck, I. E., Cáceres, N., Hendges, C. D., Brum, M., do, N., and Dambros, C. S. (2020). Climate and geographic distance are more influential than rivers on the beta diversity of passerine birds in Amazonia. Ecography 43, 860–868. doi: 10.1111/ecog.04753
Fox, R., Oliver, T. H., Harrower, C., Parsons, M. S., Thomas, C. D., and Roy, D. B. (2014). Long-term changes to the frequency of occurrence of British moths are consistent with opposing and synergistic effects of climate and land-use changes. J. Appl. Ecol. 51, 949–957. doi: 10.1111/1365-2664.12256
Frishkoff, L. O., Karp, D. S., Flanders, J. R., Zook, J., Hadly, E. A., Daily, G. C., et al. (2016). Climate change and habitat conversion favour the same species. Ecol. Lett. 19, 1081–1090. doi: 10.1111/ele.12645
Galetti, M., Guevara, R., Cortes, M. C., Fadini, R., von Matter, S., Leite, A. B., et al. (2013). Functional extinction of birds drives rapid evolutionary changes in seed size. Science 340, 1086–1090. doi: 10.1126/science.342.6164.1316-c
Gareth, J., Daniela, W., Trevor, H., and Robert, T. (2013). An Introduction to Statistical Learning: With Applications in R. Berlin: Spinger.
Gaston, K. J., Cox, D. T. C., Canavelli, S. B., García, D., Hughes, B., Maas, B., et al. (2018). Population abundance and ecosystem service provision: the case of birds. BioScience 68, 264–272. doi: 10.1093/biosci/biy005
Gillings, S., Balmer, D. E., Caffrey, B. J., Downie, I. S., Gibbons, D. W., Lack, P. C., et al. (2019). Breeding and wintering bird distributions in Britain and Ireland from citizen science bird atlases. Glob. Ecol. Biogeogr. 28, 866–874. doi: 10.1111/geb.12906
Glassman, S. I., Wang, I. J., and Bruns, T. D. (2017). Environmental filtering by pH and soil nutrients drives community assembly in fungi at fine spatial scales. Mol. Ecol. 26, 6960–6973. doi: 10.1111/mec.14414
Gonzalez, A., Cardinale, B. J., Allington, G. R. H., Byrnes, J., Endsley, K. A., Brown, D. G., et al. (2016). Estimating local biodiversity change: a critique of papers claiming no net loss of local diversity. Ecology 97, 1949–1960. doi: 10.1890/15-1759.1
Hagen, E. O., Hagen, O., Ibáñez-álamo, J. D., Petchey, O. L., and Evans, K. L. (2017). Impacts of urban areas and their characteristics on avian functional diversity. Front. Ecol. Evol. 5:84. doi: 10.3389/fevo.2017.00084
Hansen, M. C., Potapov, P. V., Moore, R., Hancher, M., Turubanova, S. A., Tyukavina, A., et al. (2013). High-resolution global maps of 21st-century forest cover change. Science 342, 850–853. doi: 10.1126/science.1244693
Heino, J., Alahuhta, J., Fattorini, S., and Schmera, D. (2019). Predicting beta diversity of terrestrial and aquatic beetles using ecogeographical variables: insights from the replacement and richness difference components. J. Biogeogr. 46, 304–315. doi: 10.1111/jbi.13485
Hickling, R., Roy, D. B., Hill, J. K., Fox, R., and Thomas, C. D. (2006). The distributions of a wide range of taxonomic groups are expanding polewards. Glob. Change Biol. 12, 450–455. doi: 10.1111/j.1365-2486.2006.01116.x
Hollis, D., McCarthy, M., Kendon, M., Legg, T., and Simpson, I. (2019). HadUK-Grid—A new UK dataset of gridded climate observations. Geosci. Data J. 6, 151–159. doi: 10.1002/gdj3.78
Hua, X., and Wiens, J. J. (2013). How does climate influence speciation? Am. Nat. 182, 1–12. doi: 10.1086/670690
Hubbell, S. P. (2001). The Unified Neutral Theory of Biodiversity and Biogeography. Princeton: Princeton University Press.
Hurlbert, A. H., and Haskell, J. P. (2003). The effect of energy and seasonality on avian species richness and community composition. Am. Nat. 161, 83–97. doi: 10.1086/345459
Hutchinson, G. E. (1959). Homage to Santa Rosalia or why are there so many kinds of animals? Am. Nat. 93, 145–159. doi: 10.1086/282070
Jarvis, A., Reuter, H. I., Nelson, A., and Guevara, E. (2008). Hole-Filled SRTM for the Globe VERSION 4, Vol. 15. 25–54. Avaliable at:http://srtm.csi.cgiar.org (accessed February 3, 2020).
Jarzyna, M. A., and Jetz, W. (2018). Taxonomic and functional diversity change is scale dependent. Nat. Commun. 9:2565. doi: 10.1038/s41467-018-04889-z
Keil, P., Schweiger, O., Kühn, I., Kunin, W. E., Kuussaari, M., Settele, J., et al. (2012). Patterns of beta diversity in Europe: the role of climate, land cover and distance across scales. J. Biogeogr. 39, 1473–1486. doi: 10.1111/j.1365-2699.2012.02701.x
Koleff, P., Gaston, K. J., and Lennon, J. J. (2003). Measuring beta diversity for presence-absence data. J. Anim. Ecol. 72, 367–382. doi: 10.1046/j.1365-2656.2003.00710.x
Koròan, M., and Svitok, M. (2018). Pairwise null model analyses of temporal patterns of bird assemblages contradict the assumptions of competition theory. Basic Appl. Ecol. 31, 72–81. doi: 10.1016/j.baae.2018.07.001
Land Cover Map (2007). [TIFF Geospatial data], Scale 1:10000000, Tiles: GB, Updated: 18 July 2008, CEH, Using: EDINA Environment Digimap Service. Avaliable at: https://digimap.edina.ac.uk (accessed May 26, 2019).
Legendre, P., and de Cáceres, M. (2013). Beta diversity as the variance of community data: dissimilarity coefficients and partitioning. Ecol. Lett. 16, 951–963. doi: 10.1111/ele.12141
Leibold, M. A., and Chase, J. M. (2017). Metacommunity Ecology, Vol. 59. Princeton, NJ: Princeton University Press.
Lennon, J. J., Greenwood, J. J. D., and Turner, J. R. G. (2000). Bird diversity and enviromnental gradients in Britain: a test of the species-energy hypothesis. J. Anim. Ecol. 69, 581–598. doi: 10.1046/j.1365-2656.2000.00418.x
Liang, C., Yang, G., Wang, N., Feng, G., Yang, F., Svenning, J. C., et al. (2019). Taxonomic, phylogenetic and functional homogenization of bird communities due to land use change. Biol. Conserv. 236, 37–43. doi: 10.1016/j.biocon.2019.05.036
Lomolino, M. V., Riddle, B. R., and Brown, J. H. (2010). Biogeography. Sunderland, MA: Sinauer Associates Inc.
Luck, G. W., Carter, A., and Smallbone, L. (2013). Changes in bird functional diversity across multiple land uses: interpretations of functional redundancy depend on functional group identity. PLoS One 8:e0063671. doi: 10.1371/journal.pone.0063671
Mantyka-pringle, C. S., Martin, T. G., and Rhodes, J. R. (2012). Interactions between climate and habitat loss effects on biodiversity: a systematic review and meta-analysis. Glob. Change Biol. 18, 1239–1252. doi: 10.1111/j.1365-2486.2011.02593.x
Matthews, T. J., Aspin, T. W. H., Ulrich, W., Baselga, A., Kubota, Y., Proios, K., et al. (2019). Can additive beta diversity be reliably partitioned into nestedness and turnover components? Glob. Eco. Biogeogr. 28, 1146–1154. doi: 10.1111/geb.12921
Maxwell, S. L., Butt, N., Maron, M., McAlpine, C. A., Chapman, S., Ullmann, A., et al. (2019). Conservation implications of ecological responses to extreme weather and climate events. Divers. Distrib. 25, 613–625. doi: 10.1111/ddi.12878
Mazel, F., Wüest, R. O., Lessard, J.-P., Renaud, J., Ficetola, G. F., Lavergne, S., et al. (2017). Global patterns of ß-diversity along the phylogenetic time-scale: the role of climate and plate tectonics. Glob. Ecol. Biogeogr. 26, 1211–1221. doi: 10.1111/geb.12632
McGill, B. J., Dornelas, M., Gotelli, N. J., and Magurran, A. E. (2015). Fifteen forms of biodiversity trend in the anthropocene. Trends Ecol. Evol. 30, 104–113. doi: 10.1016/j.tree.2014.11.006
McInerny, C. J., Musgrove, A. J., Stoddart, A., Harrop, A. H. J., Dudley, S. P., Balmer, D., et al. (2018). The British list: a checklist of birds of Britain (9th edition). Ibis 160, 190–240. doi: 10.1111/ibi.12536
McKinney, M. L. (2006). Urbanization as a major cause of biotic homogenization. Biol. Conserv. 127, 247–260. doi: 10.1016/j.biocon.2005.09.005
Melo, A. S., Rangel, T. F. L. V. B., and Diniz-Filho, J. A. F. (2009). Environmental drivers of beta-diversity patterns in New-World birds and mammals. Ecography 32, 226–236. doi: 10.1111/j.1600-0587.2008.05502.x
Miller, E. T., Farine, D. R., and Trisos, C. H. (2017). Phylogenetic community structure metrics and null models: a review with new methods and software. Ecography 40, 461–477. doi: 10.1111/ecog.02070
Nekola, J. C., and White, P. S. (1999). The distance decay of similarity in biogeography and ecology. J. Biogeogr. 26, 867–878. doi: 10.1046/j.1365-2699.1999.00305.x
Neter, J., Kutner, M. H., Nachtsheim, C. J., and Wasserman, W. (1983). Applied Linear Regression Models. Burr Ridge, IL: Irwin.
Newbold, T. (2018). Future effects of climate and land-use change on terrestrial vertebrate community diversity under different scenarios. Proc. R. Soc. B Biol. Sci. 285:20180792. doi: 10.1098/rspb.2018.0792
Pearce-Higgins, J. W., Eglington, S. M., Martay, B., and Chamberlain, D. E. (2015). Drivers of climate change impacts on bird communities. J. Anim. Ecol. 84, 943–954. doi: 10.1111/1365-2656.12364
Petchey, O. L., Evans, K. L., Fishburn, I. S., and Gaston, K. J. (2007). Low functional diversity and no redundancy in British avian assemblages. J. Anim. Ecol. 76, 977–985. doi: 10.1111/j.1365-2656.2007.01271.x
Petchey, O. L., and Gaston, K. J. (2002). Functional diversity (FD), species richness and community composition. Ecol. Lett. 5, 402–411. doi: 10.1046/j.1461-0248.2002.00339.x
Pigot, A. L., Sheard, C., Miller, E. T., Bregman, T. P., Freeman, B. G., Roll, U., et al. (2020). Macroevolutionary convergence connects morphological form to ecological function in birds. Nat. Ecol. Evol. 4, 230–239. doi: 10.1038/s41559-019-1070-4
Pigot, A. L., Trisos, C. H., and Tobias, J. A. (2016). Functional traits reveal the expansion and packing of ecological niche space underlying an elevational diversity gradient in passerine birds. Proc. R. Soc. B Biol. Sci. 283, 1–9. doi: 10.1098/rspb.2015.2013
Prakash, R. O., and Rumsey, F. (2018). “Biodiversity in the united kingdom,” in Global Biodiversity: Selected Countries in Europe, Vol. 2 (Apple Academic Press), 379.
Qian, H., Jin, Y., Leprieur, F., Wang, X., and Deng, T. (2020). Patterns of phylogenetic beta diversity measured at deep evolutionary histories across geographical and ecological spaces for angiosperms in China. J. Biogeogr. 1–12. doi: 10.1111/jbi.14036
Ray-Mukherjee, J., Nimon, K., Mukherjee, S., Morris, D. W., Slotow, R., and Hamer, M. (2014). Using commonality analysis in multiple regressions: a tool to decompose regression effects in the face of multicollinearity. Methods Ecol. Evol. 5, 320–328. doi: 10.1111/2041-210x.12166
Root, T. (1988). Energy constraints on avian distributions and abundances. Ecol. Soc. Am. 69, 330–339. doi: 10.2307/1940431
Sanders, N. J., and Rahbek, C. (2012). The patterns and causes of elevational diversity gradients. Ecography 35, 1–3. doi: 10.1111/j.1600-0587.2011.07338.x
Sekercioglu, C. H. (2006). Increasing awareness of avian ecological function. Trends Ecol. Evol. 21, 464–471. doi: 10.1016/j.tree.2006.05.007
Şekercioǧlu, ÇH., Daily, G. C., and Ehrlich, P. R. (2004). Ecosystem consequences of bird declines. Proc. Natl. Acad. Sci. U.S.A. 101, 18042–18047. doi: 10.1073/pnas.0408049101
Seto, K. C., Güneralp, B., and Hutyra, L. R. (2012). Global forecasts of urban expansion to 2030 and direct impacts on biodiversity and carbon pools. Proc. Natl. Acad. Sci. U.S.A. 109, 16083–16088. doi: 10.1073/pnas.1211658109
Shryock, D. F., Havrilla, C. A., DeFalco, L. A., Esque, T. C., Custer, N. A., and Wood, T. E. (2015). Landscape genomics of Sphaeralcea ambigua in the Mojave Desert: a multivariate, spatially-explicit approach to guide ecological restoration. Conserv. Genet. 16, 1303–1317. doi: 10.1007/s10592-015-0741-1
Si, X., Baselga, A., Leprieur, F., Song, X., and Ding, P. (2016). Selective extinction drives taxonomic and functional alpha and beta diversities in island bird assemblages. J. Anim. Ecol. 85, 409–418. doi: 10.1111/1365-2656.12478
Socolar, J. B., Gilroy, J. J., Kunin, W. E., and Edwards, D. P. (2016). How should beta-diversity inform biodiversity conservation? Trends Ecol. Evol. 31, 67–80. doi: 10.1016/j.tree.2015.11.005
Soininen, J., Heino, J., and Wang, J. (2018). A meta-analysis of nestedness and turnover components of beta diversity across organisms and ecosystems. Global Ecol. Biogeogr. 27, 96–109. doi: 10.1111/geb.12660
Soininen, J., McDonald, R., and Hillebrand, H. (2007). The distance decay of similarity in ecological communities. Ecography 30, 3–12. doi: 10.1111/j.2006.0906-7590.04817.x
Steinitz, O., Heller, J., Tsoar, A., Rotem, D., and Kadmon, R. (2006). Environment, dispersal and patterns of species similarity. J. Biogeogr. 33, 1044–1054. doi: 10.1111/j.1365-2699.2006.01473.x
Tayleur, C. M., Devictor, V., Gaüzère, P., Jonzén, N., Smith, H. G., and Lindström, Å (2016). Regional variation in climate change winners and losers highlights the rapid loss of cold-dwelling species. Divers. Distrib. 22, 468–480. doi: 10.1111/ddi.12412
Tobias, J. A., and Pigot, A. L. (2019). Integrating behaviour and ecology into global biodiversity conservation strategies. Philos. Trans. R. Soc. B Biol. Sci. 374:20190012. doi: 10.1098/rstb.2019.0012
Tratalos, J., Fuller, R. A., Evans, K. L., Davies, R. G., Newson, S. E., Greenwood, J. J. D., et al. (2007). Bird densities are associated with household densities. Glob. Change Biol. 13, 1685–1695. doi: 10.1111/j.1365-2486.2007.01390.x
Trisos, C. H., Petchey, O. L., and Tobias, J. A. (2014). Unraveling the interplay of community assembly processes acting on multiple niche axes across spatial scales. Am. Nat. 184, 593–608. doi: 10.1086/678233
Vellend, M., Verheyen, K., Flinn, K. M., Jacquemyn, H., Kolb, A., van Calster, H., et al. (2007). Homogenization of forest plant communities and weakening of species-environment relationships via agricultural land use. J. Ecol. 95, 565–573. doi: 10.1111/j.1365-2745.2007.01233.x
Vicente, J. R., Pereira, H. M., Randin, C. F., Goncalves, J., Lomba, A., Alves, P., et al. (2014). Environment and dispersal paths override life strategies and residence time in determining regional patterns of invasion by alien plants. Perspect. Plant Ecol. Evol. Syst. 16, 1–10. doi: 10.1016/j.ppees.2013.10.003
Villéger, S., Grenouillet, G., and Brosse, S. (2013). Decomposing functional β-diversity reveals that low functional β-diversity is driven by low functional turnover in European fish assemblages. Glob. Ecol. Biogeogr. 22, 671–681. doi: 10.1111/geb.12021
Villéger, S., Maire, E., and Leprieur, F. (2017). On the risks of using dendrograms to measure functional diversity and multidimensional spaces to measure phylogenetic diversity: a comment on Sobral et al. (2016). Ecol. Lett. 20, 554–557. doi: 10.1111/ele.12750
Watts, G., Battarbee, R. W., Bloomfield, J. P., Crossman, J., Daccache, A., Durance, I., et al. (2015). Climate change and water in the UK – past changes and future prospects. Prog. Phys. Geogr. 39, 6–28. doi: 10.1177/0309133314542957
Webb, C. O. (2000). Exploring the phylogenetic structure of ecological communities: An example for rain forest trees. Am. Nat. 156, 145–155. doi: 10.1086/303378
Webb, C. O., Ackerly, D. D., and Kembel, S. W. (2008). Phylocom: software for the analysis of phylogenetic community structure and trait evolution. Bioinformatics 24, 2098–2100. doi: 10.1093/bioinformatics/btn358
Webb, C. O., Ackerly, D. D., McPeek, M. A., and Donoghue, M. J. (2002). Phylogenies and community ecology. Annu. Rev. Ecol. Syst. 33, 475–505. doi: 10.1146/annurev.ecolsys.33.010802.150448
Weideman, E. A., Slingsby, J. A., Thomson, R. L., and Coetzee, B. T. W. (2020). Land cover change homogenizes functional and phylogenetic diversity within and among African savanna bird assemblages. Landsc. Ecol. 35, 145–157. doi: 10.1007/s10980-019-00939-z
Weiher, E., and Keddy, P. A. (1999). Relative abundance and evenness patterns along diversity and biomass gradients. Oikos 87, 335–361.
Wenny, D. G., DeVault, T. L., Johnson, M. D., Kelly, D., Sekercioglu, C. H., Tomback, D. F., et al. (2011). Perspectives in ornithology the need to quantify ecosystem services provided by birds. Auk 128, 1–14. doi: 10.1525/auk.2011.10248
Whelan, C. J., Wenny, D. G., and Marquis, R. J. (2008). Ecosystem services provided by birds. Ann. N. Y. Acad. Sci. 1134, 25–60. doi: 10.1196/annals.1439.003
Whittaker, R. H. (1960). Vegetation of the Siskiyou Mountains. Oregon and California. Ecol. Monogr. 30, 279–338. doi: 10.2307/1943563
Wieczynski, D. J., Boyle, B., Buzzard, V., Duran, S. M., Henderson, A. N., Hulshof, C. M., et al. (2019). Climate shapes and shifts functional biodiversity in forests worldwide. Proc. Natl. Acad. Sci. U.S.A. 116, 587–592. doi: 10.1073/pnas.1813723116
Wildlife Conservation Society-WCS, and Center for International Earth Science Information Network-CIESIN-Columbia University (2005). Last of the Wild Project, version 2, 2005 (LWP-2): Global Human Influence index (HII) Dataset (geographic). New York, NY: Wildlife Conservation Society.
Winfree, R., Fox, J. W., Williams, N. M., Reilly, J. R., and Cariveau, D. P. (2015). Abundance of common species, not species richness, drives delivery of a real-world ecosystem service. Ecol. Lett. 18, 626–635. doi: 10.1111/ele.12424
Wittwer, T., O’Hara, R. B., Caplat, P., Hickler, T., and Smith, H. G. (2015). Long-term population dynamics of a migrant bird suggests interaction of climate change and competition with resident species. Oikos 124, 1151–1159. doi: 10.1111/oik.01559
Keywords: avifauna, beta-diversity, community composition, GDM, spatial, climate
Citation: Wayman JP, Sadler JP, Pugh TAM, Martin TE, Tobias JA and Matthews TJ (2021) Identifying the Drivers of Spatial Taxonomic and Functional Beta-Diversity of British Breeding Birds. Front. Ecol. Evol. 9:620062. doi: 10.3389/fevo.2021.620062
Received: 21 October 2020; Accepted: 25 February 2021;
Published: 19 March 2021.
Edited by:
John Maxwell Halley, University of Ioannina, GreeceReviewed by:
William Kunin, University of Leeds, United KingdomJoana Raquel Vicente, Centro de Investigacao em Biodiversidade e Recursos Geneticos (CIBIO-InBIO), Portugal
Copyright © 2021 Wayman, Sadler, Pugh, Martin, Tobias and Matthews. This is an open-access article distributed under the terms of the Creative Commons Attribution License (CC BY). The use, distribution or reproduction in other forums is permitted, provided the original author(s) and the copyright owner(s) are credited and that the original publication in this journal is cited, in accordance with accepted academic practice. No use, distribution or reproduction is permitted which does not comply with these terms.
*Correspondence: Joseph P. Wayman, anB3ODMwQHN0dWRlbnQuYmhhbS5hYy51aw==