 James J. T. Connolly
 Isabelle Anguelovski
- 1School of Community and Regional Planning, University of British Columbia, Vancouver, BC, Canada
- 2Barcelona Lab for Urban Environmental Justice and Sustainability, Institute of Environmental Sciences and Technology (ICTA), Universitat Autònoma de Barcelona, Barcelona, Spain
- 3Catalan Institution for Research and Advanced Studies, Barcelona, Spain
How has urban greening related to the degree of whiteness in neighborhoods? The answer to this question provides an essential “historical diagnostic” that can be used to develop an approach to urban ecology which integrates racial and ethnic change into the planning for proposed interventions. In this paper we employ state sequence analysis to analyze the historical trend of greening (including the implementation of new parks, greenways, community gardens, green recreation areas, and nature preserves) between 1975 and 2014 in a sample of nine cities in the United States relative to concentrations of white and non-white residents. We divide the nine cities into three common growth trajectories and separately examine the trends for each growth trajectory. We further illustrate these trends by mobilizing qualitative data from field work in selected neighborhoods to help explain the processes that generate certain key findings in the quantitative data. We find that the relationship between greening and race/ethnicity differs according to city-level growth trajectory. Cities with continuous high and rapid levels of growth in the postwar period have the strongest link between increased greening and whiter populations. Meanwhile, in cities that contracted or had a punctuated growth pattern, non-white areas had a uniformly low level of greening that occurred mostly in recent years. In all, we show how urban growth, greening, and whiteness are inextricably associated qualities of American cities. We argue that understanding this association is essential for development of a race-conscious model for enhancing urban ecosystems.
Introduction
Efforts to enhance urban ecosystems, including greening, nature-based solutions, and environmental sustainability initiatives, have been shown to have substantial shortcomings with regard to lack of recognition of the racist and white supremacist histories upon which they are built (Pulido, 2000, 2017; Safransky, 2014). These critiques reflect a deeper concern for the extent to which social injustices persist in the context of an increasingly green urban planning orthodoxy (Connolly, 2019; Anguelovski et al., 2020). According to this critique, a great deal of the modern environmental movement (Curnow and Helferty, 2018), urban sustainability and resilience planning (Goodling et al., 2015; Walsh, 2018), and green space initiatives (Anguelovski et al., 2018) proceed as if the racial and social context in which they operate is immaterial to the urban ecological initiatives enacted. Some even find greening efforts to be part of a conscious plan for gentrifying areas, causing displacement, and social exclusion along racial/ethnic lines (Gould and Lewis, 2016).
In recognition of this critique, cities have already begun to rethink the approach to greening. Philadelphia’s Green Works Equity Index (City of Philadelphia, 2016) and resource allocation strategies around Los Angeles’s Measure A (Hingorani, 2019) have recently proposed equity-centered measures or indicators for green planning. Though these examples remain exceptions in the American landscape, they point toward a situation where cities are seeing more and more reasons to avoid uncritical approaches to greening, and these reasons are not confined to a vague concern for social justice. Rather, as some scholars have already argued, to the extent that urban greening initiatives help retrace racist and white supremacist tendencies onto present urban development (Safransky, 2018), social justice goals are undermined, but so too are goals related to generating robust urban ecosystems (Ernstson, 2013; Langemeyer and Connolly, 2020; Schell et al., 2020).
Safransky (2018) points toward the need to understand the historical trend of greening and racialized change in cities as a key step toward addressing the drawbacks of de-politicized green planning. She describes the “historical diagnostic” tools needed for the field of urban ecology to have the capacity to account for racist and ethnocentric effects. These tools, she argues, lead toward modes of enhancing urban ecosystems that are “attuned to the moral claims that historical dispossessions make on the present (Bird Rose, 2004, as cited in Safransky, 2018). In its pursuit of justice, an historical diagnostic is concerned with the task of illuminating hidden histories that point toward alternatives, decolonization, and the challenge of recuperation.” Thus, Safransky pushes beyond a theoretical framing of the problem and toward a call for development of empirical tools and information that reshape the goals of urban ecological planning agendas toward a more consciously just model. These tools, we agree, are essential for cities to connect greening and social justice goals.
A racially or ethnically focused historical diagnostic useful for developing a more just set of interventions in urban ecology would provide a thorough understanding of the general patterns of association between urban greening and racial change in cities (for some examples of work in this direction see Boone et al., 2009; Grove et al., 2018; Schell et al., 2020; see also work on legacy effects of urban greening, e.g., Roman et al., 2018). More specifically, it would identify the extent, periodicity, and pattern over time of planned changes in urban ecosystems and changes in the racial makeup across a wide variety of urban settings. With regard to urban greening, the development of such an historical diagnostic remains hindered by a lack of overall understanding of how commonly greening is associated with racial and ethnic change; the type of greening and racial/ethnic change that generates an association; and the conditions under which greening is not associated with racial/ethnic change. That is, we lack generalized knowledge of the overall race and ethnicity trends that coincide with urban ecological interventions.
In this paper, we address this lack of generalized knowledge by further developing the historical diagnostic needed for a more race-conscious urban ecological practice to take hold. We employ state sequence analysis to understand the historical pattern of increases in new green spaces and racial change between 1975 and 2014 in nine American cities. The nine cities were chosen to be representative of three predominant growth trajectories (described below). We specifically ask: What are the common sequences across all nine cities with regard for changes in green space and changes in the racial makeup of surrounding areas? Does this pattern vary according to the historical growth trajectory of the city? Can a generalized relationship be determined with regard to the relationship between greening and racial change in these cities? In the sections that follow, we describe the data and methods used to understand the relationship between green spaces and racial change in the nine cities that we study. Next, we present our results of the state sequence analysis and illustrate three key trends in our data through case examples drawn from qualitative field work. Finally, we discuss the implications of the findings for the development of a race-conscious model for enhancing justice-centered urban ecologies and summarize the key conclusions relative to our research questions.
Materials and Methods
This paper is a sub-study of a large international European Research Council funded project (GREENLULUS, 2016–2021) focused on the conditions under which urban re-naturing projects in distressed neighborhoods redistribute (or not) access to green/blue spaces for historically marginalized groups in mid-sized cities in the United States, Canada, and Western Europe. The data and methods for the overall project from which this paper draws were chosen with an eye toward developing a more generalized notion of greening and social change over time than is currently available in the literature. For the quantitative analysis of this paper, we selected cities based on a balance between data availability and representativeness with regard for growth trajectories. For our qualitative case examples, we chose a further sub-set of three neighborhoods that represent theoretically and practically important trends shown in the quantitative data and that were included in our qualitative data collection based on in-person fieldwork in 2018, 2019, and 2020.
City Selection
We hypothesize that the relationship between urban greening and racial change differs according to the overall dynamics of urbanization and growth within the city of interest. In order to test this hypothesis, we selected nine cities representative of three common trajectories of growth in the United States during the post-war period (covering the transition to post-industrial American urbanization that began in the 1950s, but was clearly evident by the 1970s). We use data from the United States Census on changes in population, race, and city-level Gross Domestic Product (GDP) in order to differentiate cities according to general trajectories of growth (Manyika et al., 2012). We acknowledge that these are simplified indicators of deeper cultural, social, and political dynamics that have played out in the context of a complex shift from “Fordist” production models rooted in the political economy of nation states to “post-Fordist” models rooted in globalized systems (Marcuse, 1997; Walks, 2001) and embodied in the skilled creative, high technology, biotechnology, education, or finance sectors (Glaeser and Saiz, 2003; Peck, 2005).
Primarily, we relied on population changes as the key indicator of a city’s trajectory (see also Park and LaFrombois, 2019), with race and GDP data as secondary indicators. The GDP data trends largely follow changes in population, with some deviations described in the text below, but for simplicity’s sake we visualize only the population data. The nine cities selected are shown in Figure 1 with their population trends between 1950 and 2018 (the most recent available data). The trend lines are color coded to denote cities with similar growth trends. Note that New York City is shown with the data adjusted down to 25% of the population in order to be on a similar scale as the other cities.
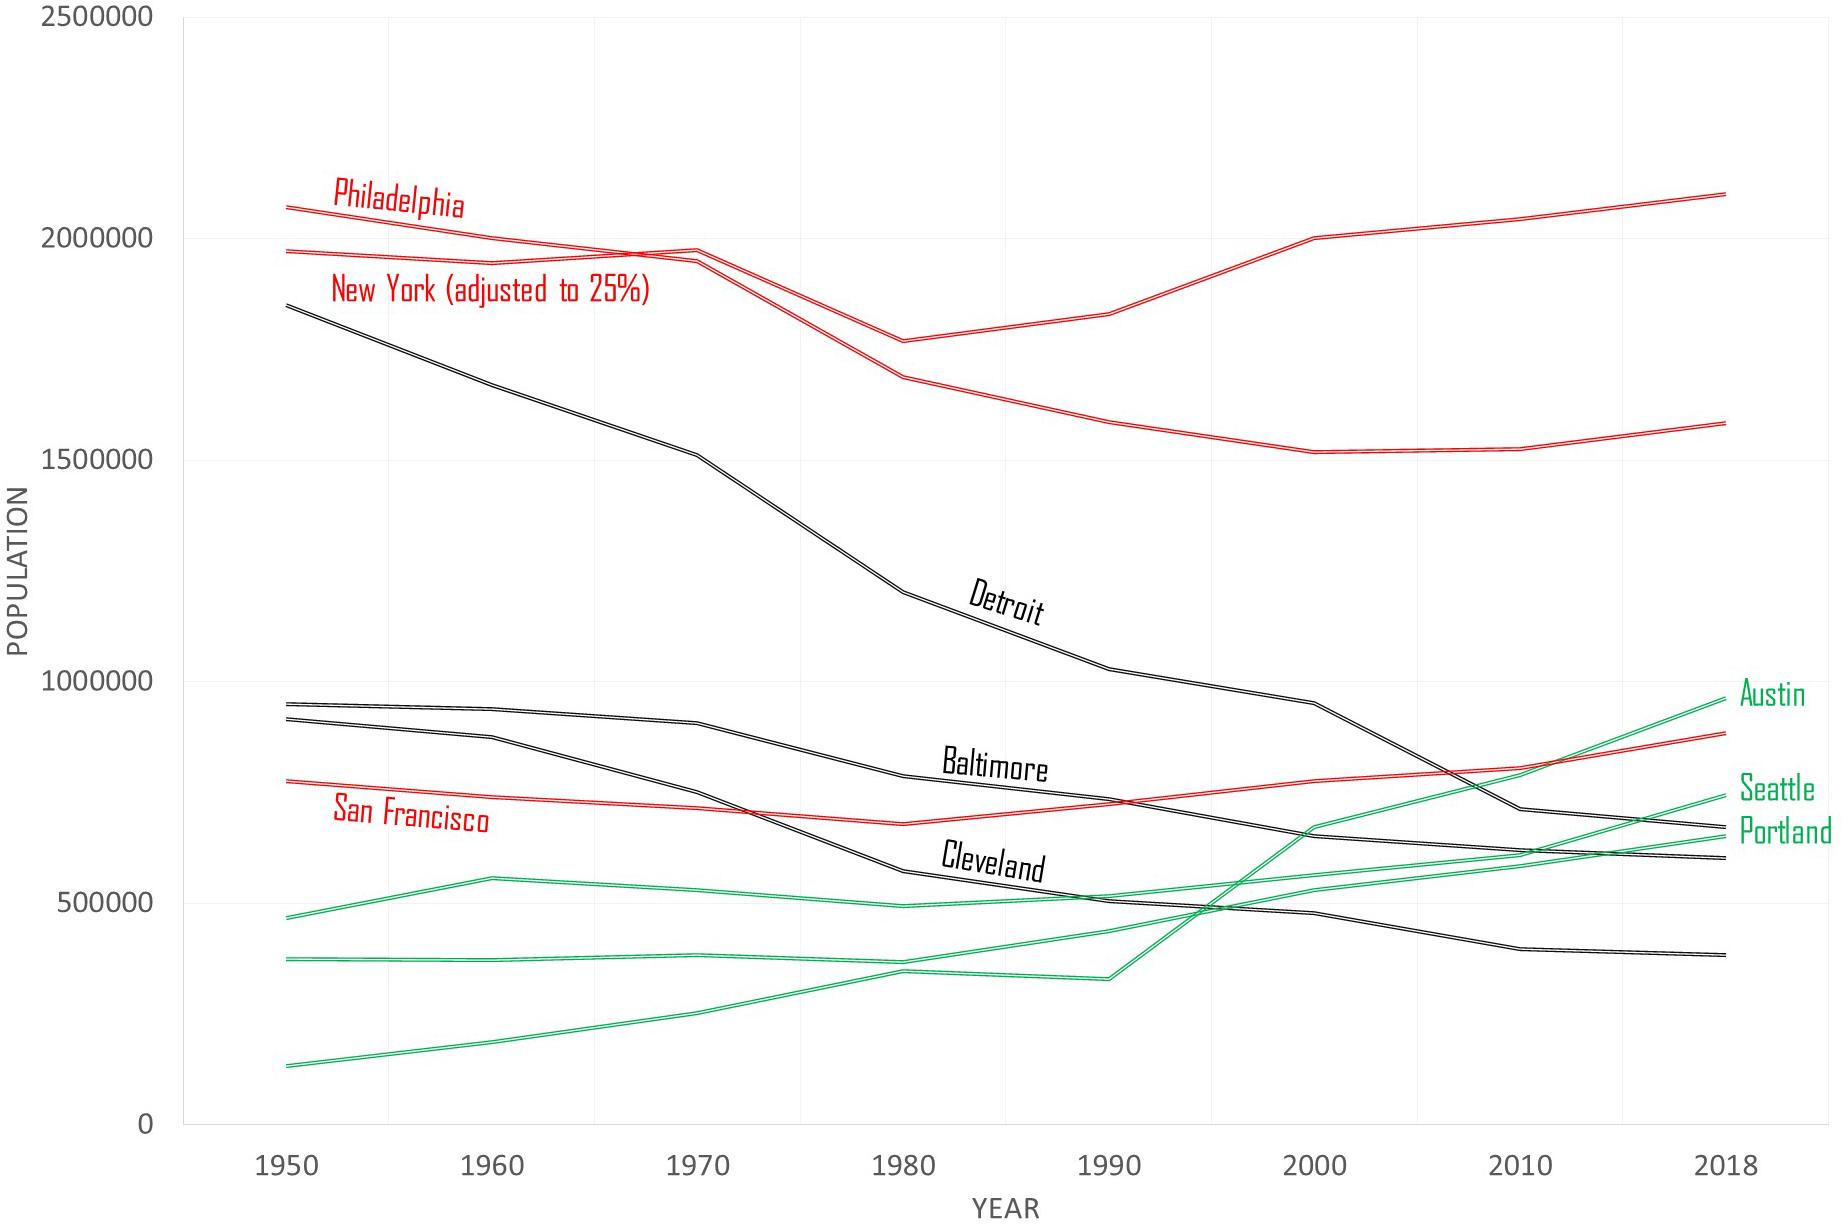
Figure 1. Selected city population trends, 1950–2018. Data source: US Census. For population between 1950 and 1990, see Gibson and Jung (2002); for population between 2000 and 2010, see censusviewer.com; for population 2018, see censusreporter.org.
Since the second world war, these nine cities took one of three growth trajectories. They either experienced a more or less steady process of expansion; a more or less continuous process of contraction, or a punctuated process wherein population and GDP declined heavily but then saw a resurgence to new highs. As a shorthand, we call these three trajectories “steady growth” cities (Austin, Portland, Seattle); “continuous contraction” cities (Cleveland, Detroit, Baltimore); and “punctuated growth” cities (New York, San Francisco, Philadelphia). With distinct population growth, economic growth, and racial change trajectories, we expect that the different levels of resources and cultural conditions in these three categories of cities led to different relationships with regard to race/ethnicity and greening. The generalized trend line of population growth for these categories of cities is shown in Figure 2 and the three trajectories are explained in greater detail below.
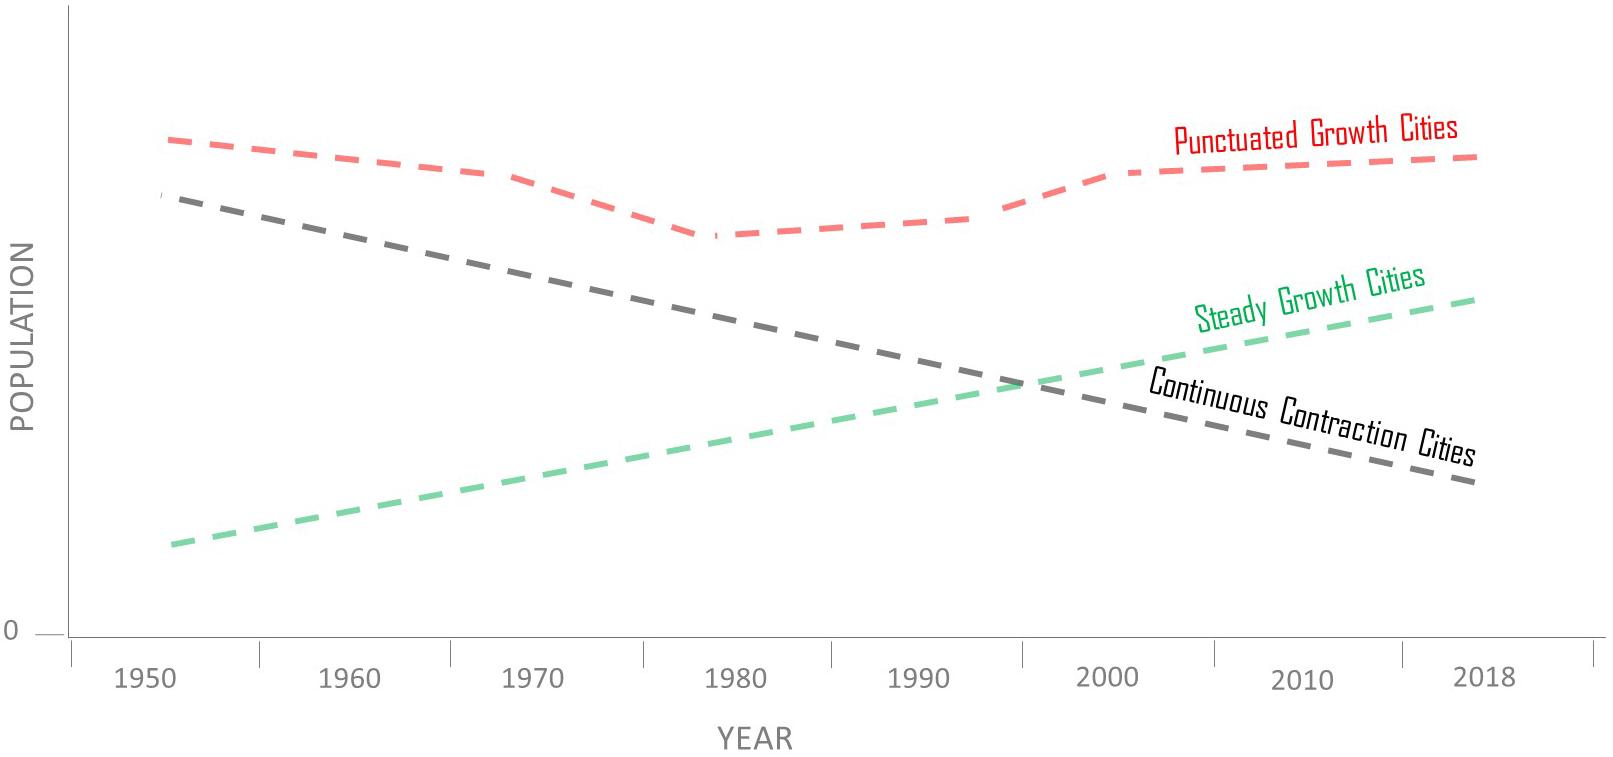
Figure 2. Generalized trend line of population growth in three types of American cities.
Steady growth cities generally were not the most prominent urban centers during the Industrial Era in the United States, but became prototypical attractor cities during the latter part of the twentieth century. Often, these cities were home to emergent technology and retail firms (e.g., Microsoft and Starbucks in Seattle; Dell and Whole Foods in Austin; Intel and Nike in Portland) and gained numerous associated economic spin-off benefits that generated rapid and relatively high levels of growth in population and GDP by the early 2000s. Overall, these cities have been mostly white throughout their histories, with a long history of housing discrimination and urban renewal programs. They have seen increases in non-white population since 1950, but remain majority white and are among the whitest of the large American cities. GDP since 1950, and especially since 1990, has risen at a relatively fast rate in steady growth cities compared to other American cities. The cities representative of this category that were analyzed here include Seattle (Washington), Portland (Oregon), and Austin (Texas).
Continuous contraction cities were prominent Industrial Era cities that saw a steady decline in population and GDP since 1950, without any period of substantial resurgence. Generally, these cities are characterized, like most “rustbelt” cities, by disinvestment from industrial urban centers and white flight to the suburbs, except in a few neighborhoods. In Detroit, for example, the 2008 bankruptcy of General Motors collapsed the regional economy and contributed to the subsequent further estimated loss of 40,000 residents between 2009 and 2019 (US Census Bureau, 2019). These cities have seen the lowest rates of increase in GDP since 1950 relative to other large American cities. These cities are also characterized by the highest rates of increase in non-white population since 1950. The cities in this study representing those that experienced continuous contraction include Detroit (Michigan), Baltimore (Maryland), and Cleveland (Ohio).
Punctuated growth cities gained prominence during the early Industrial Era in the United States, and then had declining rates of population and economic growth in the decades following 1950, but saw a resurgence between 1980 and 2010. Generally, by the 1980s, large sections of these cities were substantially disinvested after a process commonly known as white flight to the suburbs. However, between the 1980s and early 2000s, rapid and high reinvestment and economic conversion, with a new prominence gained by the high technology, financial, and/or pharmaceutical industries, resulted in GDP increase and population comeback, including increased white population after decades of decreases in this area. For example, companies such as Merck or Johnson and Johnson contributed to Philadelphia’s resurgence while San Francisco’s new economy was driven by Silicon Valley tech giants Google and Apple as well as newer firms, like Airbnb and Uber. Meanwhile, punctuated growth cities saw continuous increases in non-white population and currently have a moderate non-white percentage relative to other US cities. GDP also increased at a moderate rate relative to other American cities between 2000 and 2018. The cities considered to be representative of the punctuated growth category that were analyzed in this study include San Francisco (California), New York (New York), and Philadelphia (Pennsylvania). While San Francisco and New York had a clear resurgence by the 1990s, Philadelphia was slower in terms of population and GDP growth, but its trajectory by the mid-2000s put it in this category.
Tract-Level Population and Green Space Data
The population data used to develop the census tract-level analysis in this study is derived from the Longitudinal Tract Database (Logan et al., 2014). This database provides a standardized estimate of numerous demographic variables from the United States Census between 1970 and 2010. It was developed to be the best possible data for analyzing change across time in American urban neighborhoods. We utilize the race and population estimates standardized to 2010 census tract boundaries, which cover the full period of time used in this study.
The green space data for the nine cities analyzed is derived from a specialized dataset we assembled and created that contains the boundaries of all public green spaces in each city as of 2016, along with the type of space (classified in a standardized way by park, greenway, preserve, garden, recreation), the size of the space, and the year the space was acquired for public use as a greenspace (if this year was not available, then the year the space was opened to the public was used instead). Greenspaces in the dataset include all formal and informal public spaces for each of the five types analyzed here (i.e., parks, greenways, preserves, gardens, and recreation) and are derived from city files augmented by aerial imagery analysis (see methodological note). For each of the nine cities analyzed in this study, the year the space was acquired/opened is known for at least 90% of all of the qualifying green spaces citywide. Thus, we are reasonably sure that the data we analyze between 1975 and 2014 represents the full set (or very near to the full set) of public green spaces added to these cities in that time. Please see the methodological note in the Supplementary Material for a more specific description of the source and procedure used to acquire and develop the green space data.
This analysis does not include private residential yards or landscaped areas, street trees, or most greenspaces built as part of road infrastructure. Thus, the focus here is not on a generalized measure of “greenness,” but rather on a specific measure of publicly supported urban green spaces designed for active use or habitat preservation. It is worth acknowledging that a small number of especially informal spaces likely came and went (e.g., a space that started in 1991 but was defunct by 1998) and thus could not be identified when the dataset was developed.
Assigning States of Greening and Racial/Ethnic Change in Tracts
In order to calculate the amount of green space in a tract at a given time, it was first assumed that every green space has a catchment area wherein nearby residents are easily drawn to it. While it is likely that this catchment area is not uniform across green spaces, the widely used measure of 400 m as an easily walkable distance (approximately 10 min) provides a reasonable average baseline estimate of a standard catchment for a greenspace. For this reason, we calculate the number and area of green spaces in a tract by first creating a 400-m buffer around each tract. We then use the formal tract boundary plus the 400-m buffer for all green space calculations by tract. This procedure is important for controlling boundary effects, wherein a tract is directly next to a green space (making it accessible to residents of the tract). Without the inclusion of the buffer area, that green space would not be included in the tract total. Further, in the cases where green spaces comprise most of a tract area but do not reach beyond, this step is required in order to retain that green space in the analysis.
Once the catchment areas were defined, new green spaces were identified for each tract according to 10-year time periods in order to allow for increases in green space provision to be calculated by tract. Only tracts that had at least some greenspace added during the study period (1975–2014) were included in the analysis below. Green spaces were assigned to analysis years according to spaces added in the 5 years before and 4 years after each decennial census year. For example, green spaces added between 1975 and 1984 were assigned to census data from 1980. This approach is meant to capture the “announcement effect” of green spaces (Immergluck and Balan, 2018), so that all new spaces that were either built or likely announced during the 10 years closest to the one being measured in the census data are associated with that year. Time periods to which green spaces were assigned are:
Period 1. Pre-1975: all green spaces built before 1975
Period 2. 1980 census data: 1975–1984 green space data
Period 3. 1990 census data: 1985–1994 green space data
Period 4. 2000 census data: 1995–2004 green space data
Period 5. 2010 census data: 2005–2014 green space data
A categorical grouping based on distance from the median was developed to reflect the “state” of greening for each time period. These categories compare the percent of the tract (plus its 400-m buffer within city limits) occupied by new green space at a given time with the median percent across all populated tracts that added green space in the city at that time. The formula is:
The area change (ac) value is the degree of change in green space area in a tract for a given time period relative to the median change in all populated tracts that added green space throughout the city (i.e., a different median value is used for each city and each time period). There is also a zero category for tracts that added no green space during the time period (note that zero tracts are not included in the median calculations). The “area median” value refers to the median percent of area that became green for those tracts that added greenspace (i.e., all non-zero tracts) in the city containing the tract. The “area tract” value refers to the percent of land area within city limits that became green in the tract (plus buffer) for which the ac value is being calculated. For example, if the median new green space area coverage of all populated tracts that added green space in a given city between 1975 and 1984 was 8% and a given tract had 4% new green space coverage during that time, then “ac” for that period is equal to -0.5, indicating the tract was 50% below the median. If the given tract has 12% new green space, then ac is +0.5, indicating the tract was 50% above the median. These ratings were then divided into four “states of greening” described in Table 1 below.
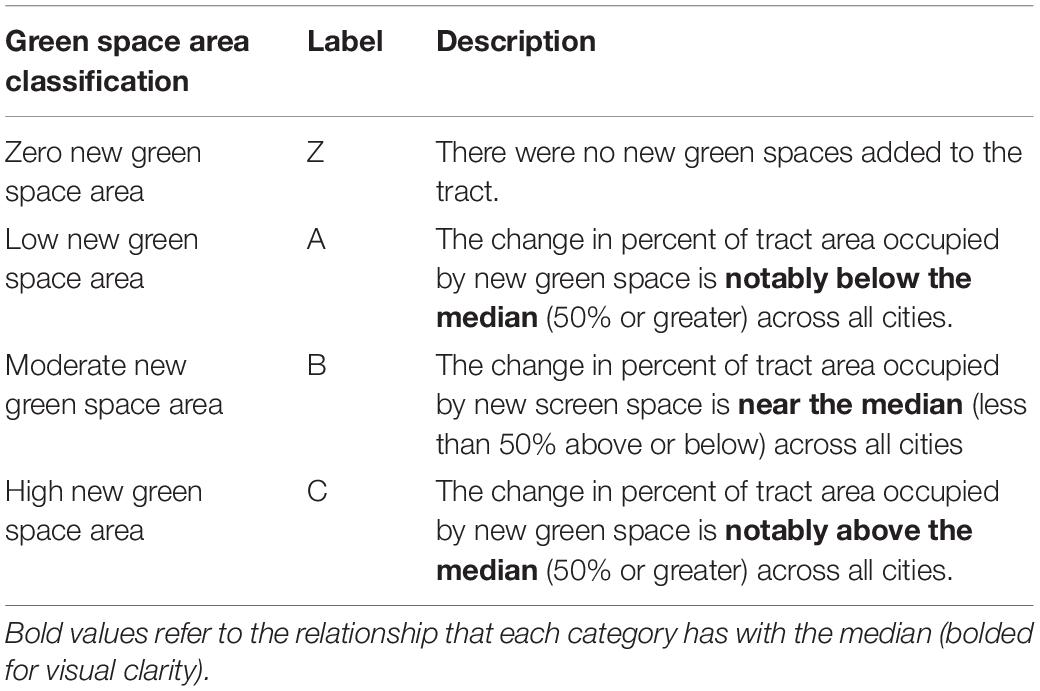
Table 1. Greening states: classifications of new green space area in a tract.
In order to measure the state of racial and ethnic mix in a tract, we use data developed by Zhang and Logan (2016), which is freely available in the Longitudinal Tract Database (LTDB). For their project looking at racial and ethnic segregation in US cities, Zhang and Logan developed a classification for each tract that designates the presence by tract of whites (w), blacks (b), Hispanics (h), and Asians (a). In order to designate groups as present or absent from a tract, the authors identify a threshold wherein any group with a share in the tract that is less than one-quarter of their average share in all large and multi-ethnic US metros is considered so underrepresented as to be “absent” (for more detail, see Logan and Zhang, 2010; Zhang and Logan, 2016). The minimum levels used as cutoff points vary from decade to decade, reflecting the changing overall composition of the country (minimum cutoffs for whites to be considered “present” are: 1980:20.7%; 1990:20.2%; 2000:18.9%; 2010:17.8%). Crucially, this approach allows researchers to distinguish differences that are inherent to regions’ demographic composition from those that simply reveal overall demographic shifts.
Using the same threshold as Zhang and Logan (2016), this study employs a simple two-state designation, wherein tracts are assigned “w” if a white population is present above the Zhang-Logan threshold of one-quarter of the average share of whites in all large and multi-ethnic US metros for the given year and “n” if the white population is not present above the threshold. While there is good reason to examine all racial/ethnic categories, this study is primarily focused on the shifting states of whiteness relative to greening. Thus, for the sake of not generating an overly complex number of possible states (which would muddle the state sequence analysis process), the racial/ethnic classifications are simplified to those that, basically, designate which tracts have a sufficient enough presence of whites as to make the white population “present.” In other words, we are looking at tracts where the presence of whites is large and visible enough (roughly 20% or higher) as to make them an easily perceived part of the neighborhood makeup.
State Sequence Analysis
Neighborhoods are far from static. Rather, current conditions in a given area of a city are derived from a complex history of demographic and physical change (Grove et al., 2018). We focus on two of these changes—greening of the local environment and racial/ethnic makeup of the local population. Given the above data, we examine the typical sequences followed by the combined state of greening and racial change between 1975 and 2014. We use the eight possible states (four states of greening multiplied by two racial/ethnic states) as the basis upon which to undertake this examination. For example, a tract state for a given time period might be “Aw,” meaning it had a relatively low amount of new greening and white population was present above the Zhang-Logan threshold for that year. We examine, as well, if these typical sequences varied by type of city using the three-city growth trajectory classifications described above. Finally, following Borgna and Struffolino (2018) we connected the typical sequences with qualitative data (described below) from a neighborhood representing one cluster in each type of city as a way of enriching our understanding of the general trends found.
In order to determine the sequence pattern of change in greening and racial makeup of tracts, we employ state sequence (STS) analysis. Overall, sequence analysis allows sets of coded categorical data ordered by time to be understood according to general trends, including identification of typical and deviant sequences, and parsing out of difference between groups (such as cities with different growth trajectories) (Ritschard and Studer, 2018). There are three general steps to sequence analysis, each of which requires making methodological choices (Rossignon et al., 2018). The first step is to code data according to categorical sequence states and time periods (this step is described above). The second step is to measure the pairwise dissimilarity between sequences. In this case, that means measuring tract-level differences in the sequence of greening and racial change. The final step is to summarize the dissimilarity between sequences with the aid of a clustering algorithm. This final step allows for typical sequences to be identified.
We developed the state sequence dataset and analysis using the latest version (2.2.0.1) of the “TraMineR” package in R software (version 4.03). For the first step, we built a table in the state sequence (STS) format that included the full demographic data; the city classification; the categorical state of greening (zero, low, moderate, high); and the binary (“white present” or “non-white”) state of race/ethnicity for each tract in the nine cities. For the second step, identifying pairwise dissimilarity, we utilized the Dynamic Hammond Distance (DHD) method for calculating how close one race/ethnicity-greening sequence was to another. We selected the DHD method over the commonly used Optimal Matching (OM) approach because DHD is ideal for data where all sequences have the same length and difference across each time period is important from theoretical and analytical perspectives (Lesnard, 2009). For the third step, we employ the Ward’s clustering technique with a three-cluster solution in order to identify typical race/ethnicity-greening sequences for the tracts included in our study. The Ward’s cluster method is designed to minimize the total within cluster variance, thus generating homogeneous groupings of data. In line with the explorative dimension of this method, we selected the three-cluster solution after analysis of several solutions between two and eight, and subjectively determining that the three-cluster approach produced results that best met the goal of differentiating the key differences among race-greening pathways.
Illustrating Quantitative Trends With Qualitative Data
We selected neighborhoods in Austin (steady growth), San Francisco (punctuated growth), and Cleveland (continuous contraction) as three qualitative case examples to illustrate selected on-the-ground processes that generate one of the three typical sequences of greening and racial change in each city type. Within the scope of this study, we could not undertake qualitative analysis of all of the typical sequences, so we selected neighborhoods that reflect theoretically and practically important trends within the quantitative data. All three qualitative cases shared a municipal commitment to developing new greening interventions since the 1990s.
In each city, we conducted between 25 and 30 semi-structured interviews after pretesting, modifying and selecting a final set of questions for our interview protocol. We spent 1 month in 2018 and 2019 conducting fieldwork in each neighborhood/city, enrolling a variety of participants to maximize the heterogeneity of experiences and expertise on the topics of urban greening; urban development and racialization; and inequalities; covering a range of themes related to re-naturalizing interventions; equity/justice; segregation; and gentrification. We contacted initial respondents through previous research, expert contacts, internet searches, and review of local media articles about each case. We then contacted further respondents through snowball sampling, until reaching theoretical and stakeholder diversity saturation. Respondents included elected officials; urban planning and environmental staff; community-based organizations; neighborhood resident leaders; and other local stakeholders (such as developers, designers, or local experts in the area of urban greening). Although we did not purposely seek older respondents, a variety of respondents (long-term neighborhood activists, environmental non-profits, and/or urban environmental planners) in each city were able to provide historical insights and perspectives about greening changes.
Upon the full transcription of 90% of our interviews, we created a detailed coding scheme based on the main questions addressed by the parent research study. Two primary researchers developed the overarching coding scheme, which was then slightly altered and clarified after extensive team discussions. Coding was completed by one researcher per city, with regular check-ins and verification between all team members to ensure intercoder reliability. Last, we used gray literature to document the greening and urban development trajectory and history of each city, including archival and newspaper articles, non-profit organizations’ reports, and media articles.
Results
This study analyzes the relationship between greening and changes in race/ethnicity in tracts that had some greenspace added between 1975 and 2014 across nine American cities classified according to three growth trajectories. For each of the three growth trajectories (and for all cities together), we report below a summary of the overall relationship between changes in race/ethnicity and greening and then visualize the typical trajectories (state sequence clusters) for tracts that greened. We then mobilize the qualitative data to report relevant on-the-ground characteristics of neighborhoods containing tracts that represent a state sequence cluster.
Summary of Quantitative Findings Across All Cities
Overall, by area, tracts that shifted toward a whiter population were overrepresented with new green initiatives beginning mostly in the 1990s–2000s (not prior), but there are differences in this trend by city type. Table 2 shows the percent of all tract area with population that shifted whiter in two ways. In the top half of the table, we use the Zhang-Logan threshold (which requires that white population is present at or above 25% of the average across all large and multi-ethnic American metropolitan areas at the time—this means the tract had at least 17–21% white population depending on the year), to identify tracts that shifted whiter. Since the threshold (17–21%) needed to meet the Zhang-Logan standard for “present” is somewhat high, the bottom half of the table also reports the tracts that saw any increase in white population in order to provide a more complete picture. The Zhang-Logan approach is focused on identifying neighborhoods where white population has a strong and visible foothold and the simple increase approach is focused on identifying areas where whiteness is increasing to any degree. Both approaches matter for different substantive reasons.
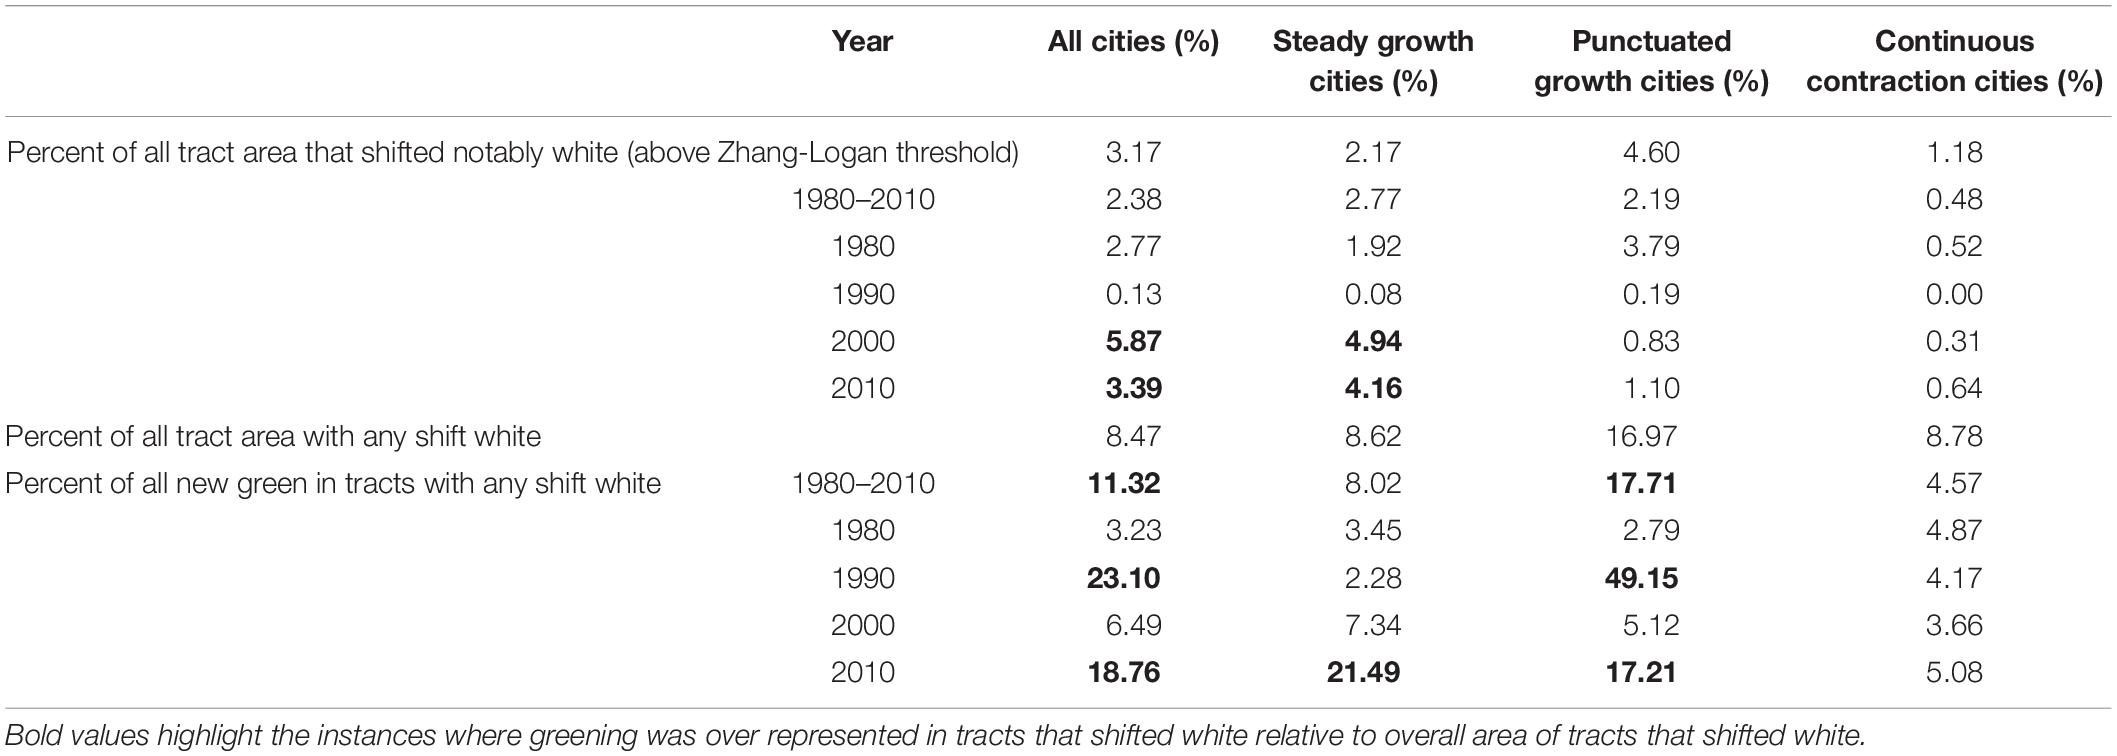
Table 2. Representativeness of new greening in tracts that shifted toward a whiter population (notable shift above the Zhang and Logan threshold and any shift) between 1980 and 2010.
Across all nine cities, 3.17 and 8.47% of the populated tract area (i.e., percent of area covered by tracts—not percent of the number of tracts—was used to control for variation in tract size) shifted whiter according to the Zhang-Logan and simple thresholds, respectively. With all cities considered together, over the entire time period, these tracts were overrepresented with greening according to the simple (lower) but not the Zhang-Logan (higher) threshold. The Zhang-Logan threshold tracts were only overrepresented with greening in the 2000 and 2010 periods. Generally, the overrepresentation of greening in tracts that became whiter between 1980 and 2010 appears to be a phenomenon that was largely driven by initiatives that may have been planned in the 1990s but were rolled out in the 2000s and 2010s. However, importantly, this is not a uniform trend across all three city types.
By type of city, there are unique patterns with regard to the overall relationship between greening and racial/ethnic change. First, regardless of the threshold used, steady growth cities show an overrepresentation of greening in tracts that became whiter for the later periods of the study. Within steady growth cities, when looking at the stricter Zhang-Logan threshold, the tracts that got whiter received new green space area that was roughly twice the percent of area covered by the tracts between 1995 and 2014 (which corresponds to the 2000 and 2010 census time periods in the table). This trend for steady growth cities increases for tracts with any increase in whiteness to an area-based overrepresentation of roughly 2.5.
Next, continuous contraction cities show no overrepresentation of greening in tracts that became whiter for the period studied. This trend holds regardless of the threshold used for designating tracts that became whiter. Two underlying dynamics are important to consider for these cities. First, there were very few tracts that became whiter. These cities generally experienced a decline in white population overall for the time period studied. Second, the area of formal green spaces in the cities was largely stagnant or declining during this time period due to budget restraints but new informal gardens and local greening initiatives grew in non-white tracts. Put differently, there was an emphasis in continuous contraction cities on smaller, informal greening that tended to occur in mostly non-white tracts.
Finally, for punctuated growth cities, greening-racial/ethnic change has a longer and more episodic history. In these cities, the Zhang-Logan threshold shows no overrepresentation of greening in tracts that became whiter, but the simple increase threshold offers a different picture. According to the simple threshold (bottom half of Table 2), punctuated growth cities had overrepresentation of greening in tracts that became whiter in the period between 1985 and 1994 (marked as the 1990 census year in the table) and the period between 2005 and 2014 (marked as the 2010 census year in the table). These periods coincide with the efforts of early “frontier” gentrifiers of the 1980s in these cities (Smith, 1996) and the early push toward local sustainability initiatives of the 1990s, many of which involved urban greening efforts in large cities. New greening efforts also took place toward the end of the 2000s, especially so in formerly industrial districts such as Hunters Point-Bayview in San Francisco or north of Center City in Philadelphia. In all, during clearly identifiable periods where punctuated growth cities pushed new greening initiatives, tracts that became whiter were overrepresented by area with greening.
Steady Growth Cities
When considering the data for steady growth cities that had a more or less linear upward growth trend over the period studied, the three most representative clusters of state sequences in Figure 3 demonstrate a strong link between greening and white populations. For each cluster type, Figures 3–5 show the two most frequent sequences in black and gray lines (reflecting the modal trend) for that cluster. For a more detailed depiction of the sequences in each cluster see the Supplementary Material. The first cluster of tracts (Type 1, n = 63), labeled “high green/white,” mostly stayed white over the entire period and had intense periods of greening. The most common trends for “high green/white” tracts were for large areas of greening to occur in these tracts during the period between 1985 and 2005, with lower levels outside of that time period. The second cluster of tracts (Type 2, n = 205), labeled “low green/white” also mostly stayed white over the entire period, but had lower levels of greening scattered throughout. The third cluster of tracts (Type 3, n = 13), labeled “high green/shift white,” mostly shifted from non-white to white immediately after or immediately before intensive periods of greening, and thus demonstrate the historical pathway of co-occurring greening and increased whiteness in areas that displace people of color. Interestingly, the “high green/shift white” cluster of tracts shows that intense greening may come before or after the shift toward whiteness in steady growth cities.
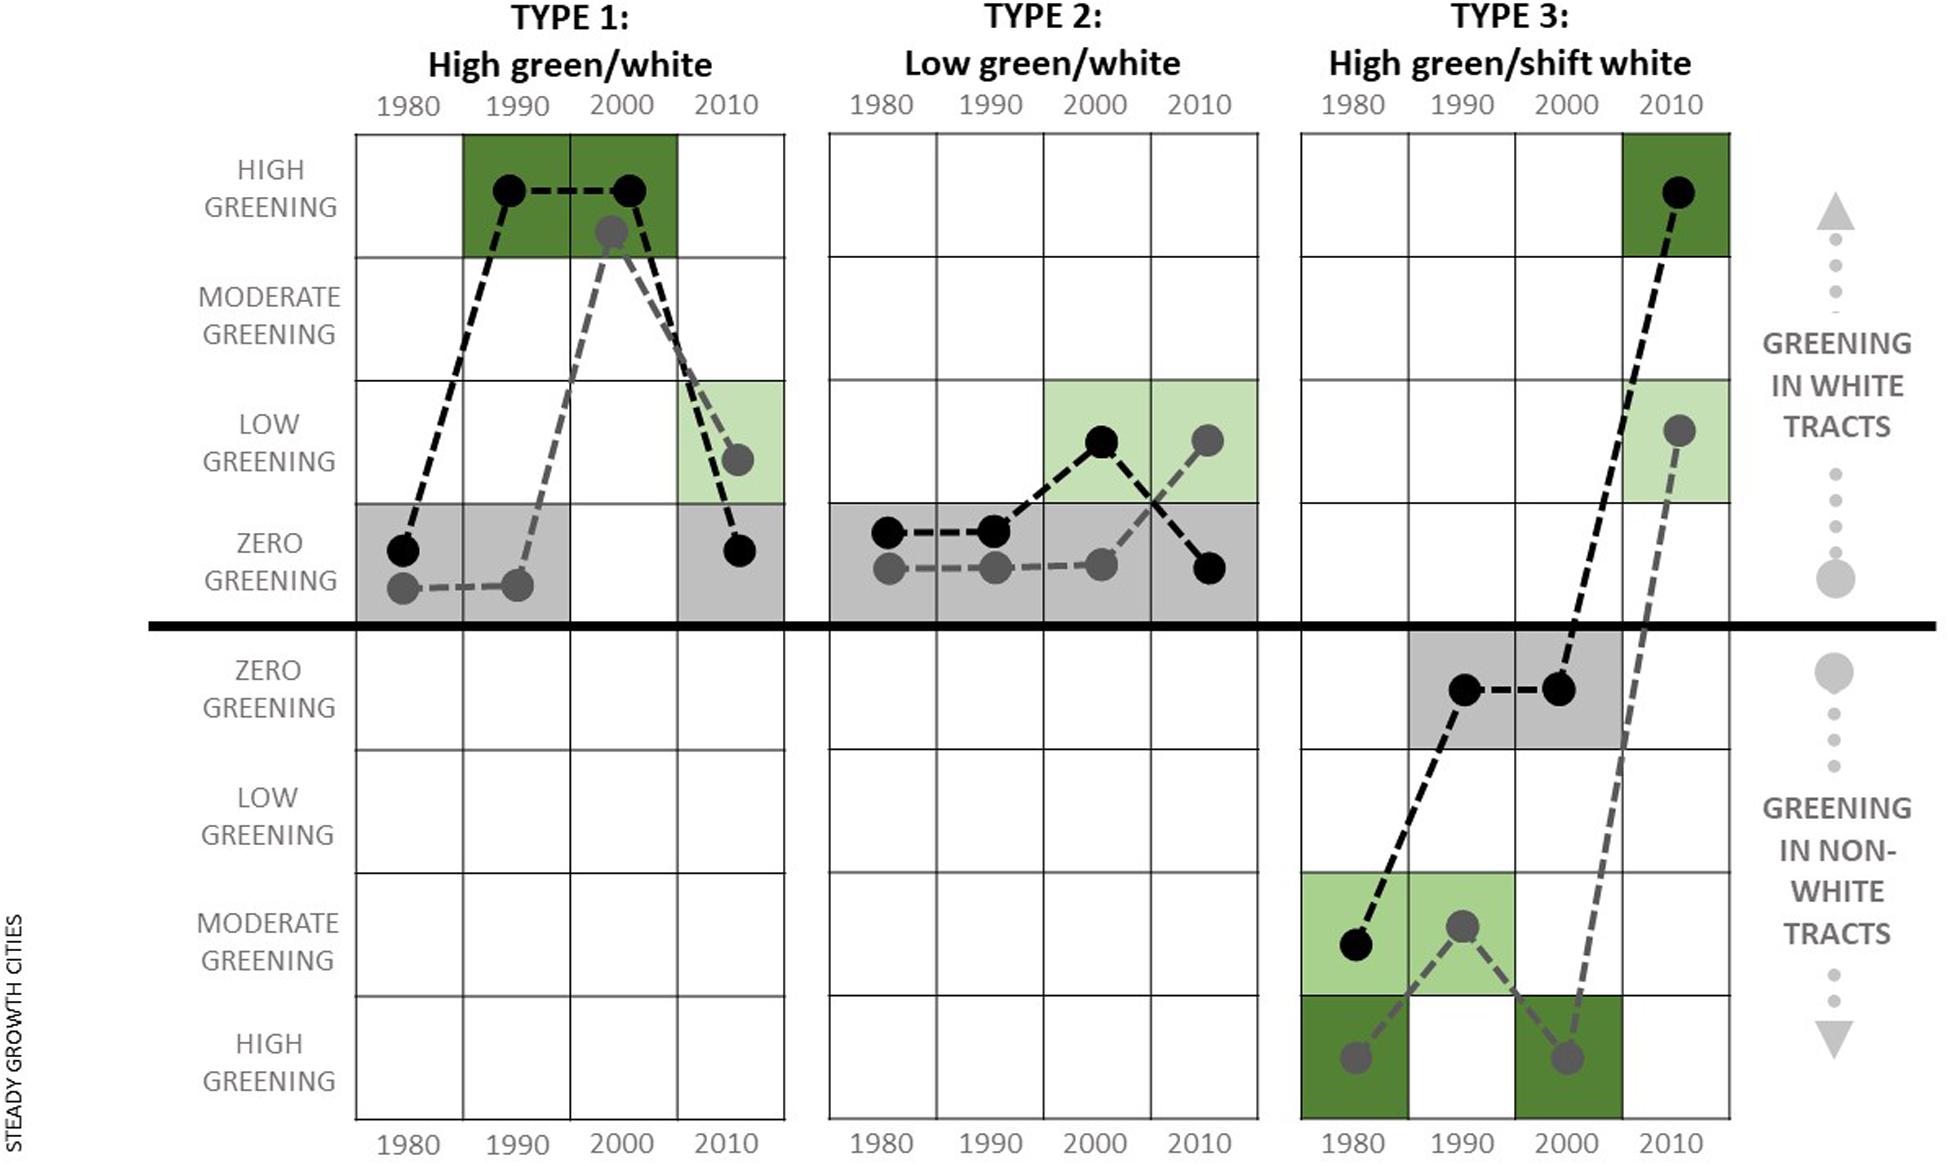
Figure 3. Steady growth cities typical trajectories: three-cluster solution for race/ethnicity-greening trajectories of all tracts that had any greening between 1975 and 2014. The black line represents the most common sequence and the gray line represents the second-most common sequence. Together, these lines reflect the modal sequence, or most common trend, within a cluster. Detailed cluster results can be found in the Supplementary Material.
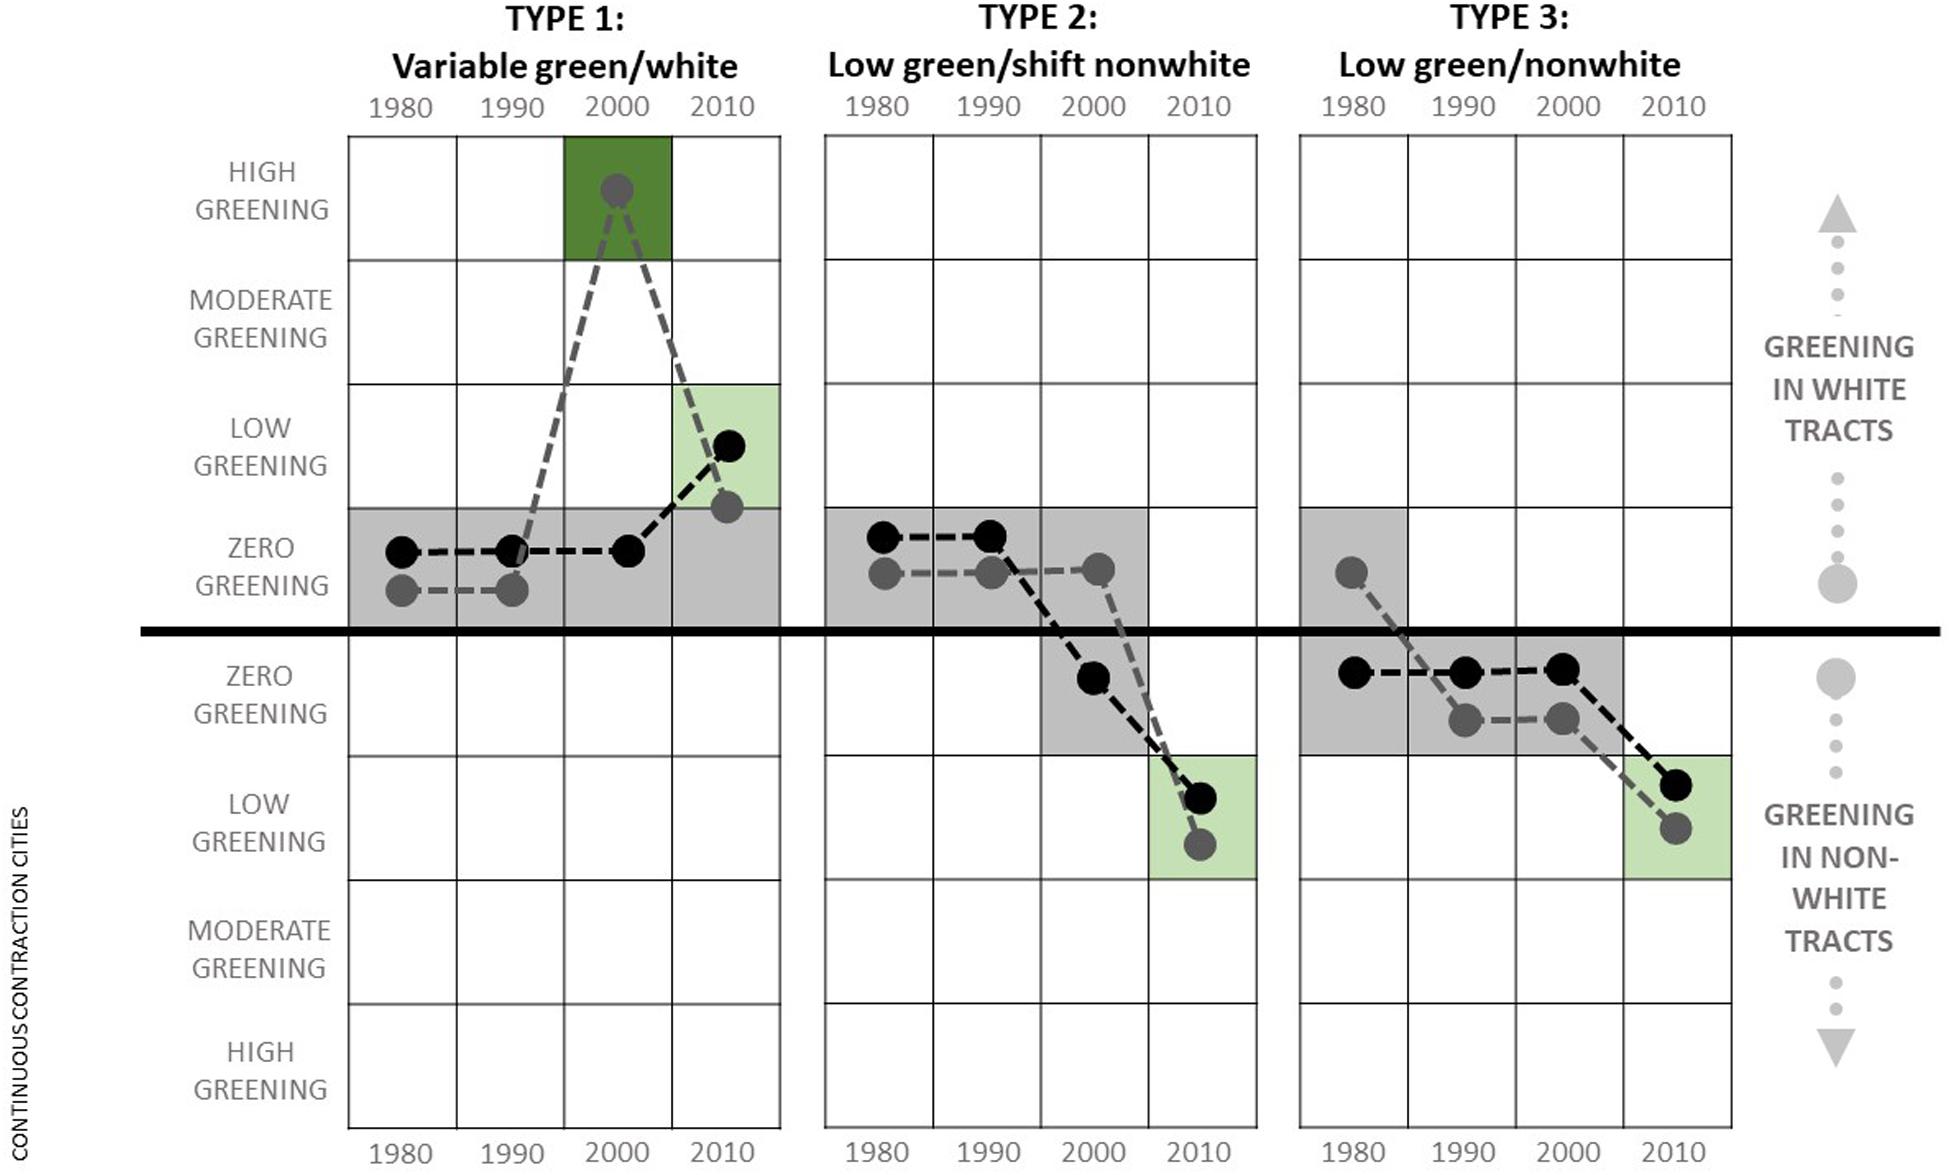
Figure 4. Continuous contraction cities typical trajectories: three-cluster solution for race/ethnicity-greening trajectories of all tracts that had any greening between 1975 and 2014. The black line represents the most common sequence and the gray line represents the second-most common sequence. Together, these lines reflect the modal sequence, or most common trend, within a cluster. Detailed cluster results can be found in the Supplementary Material.
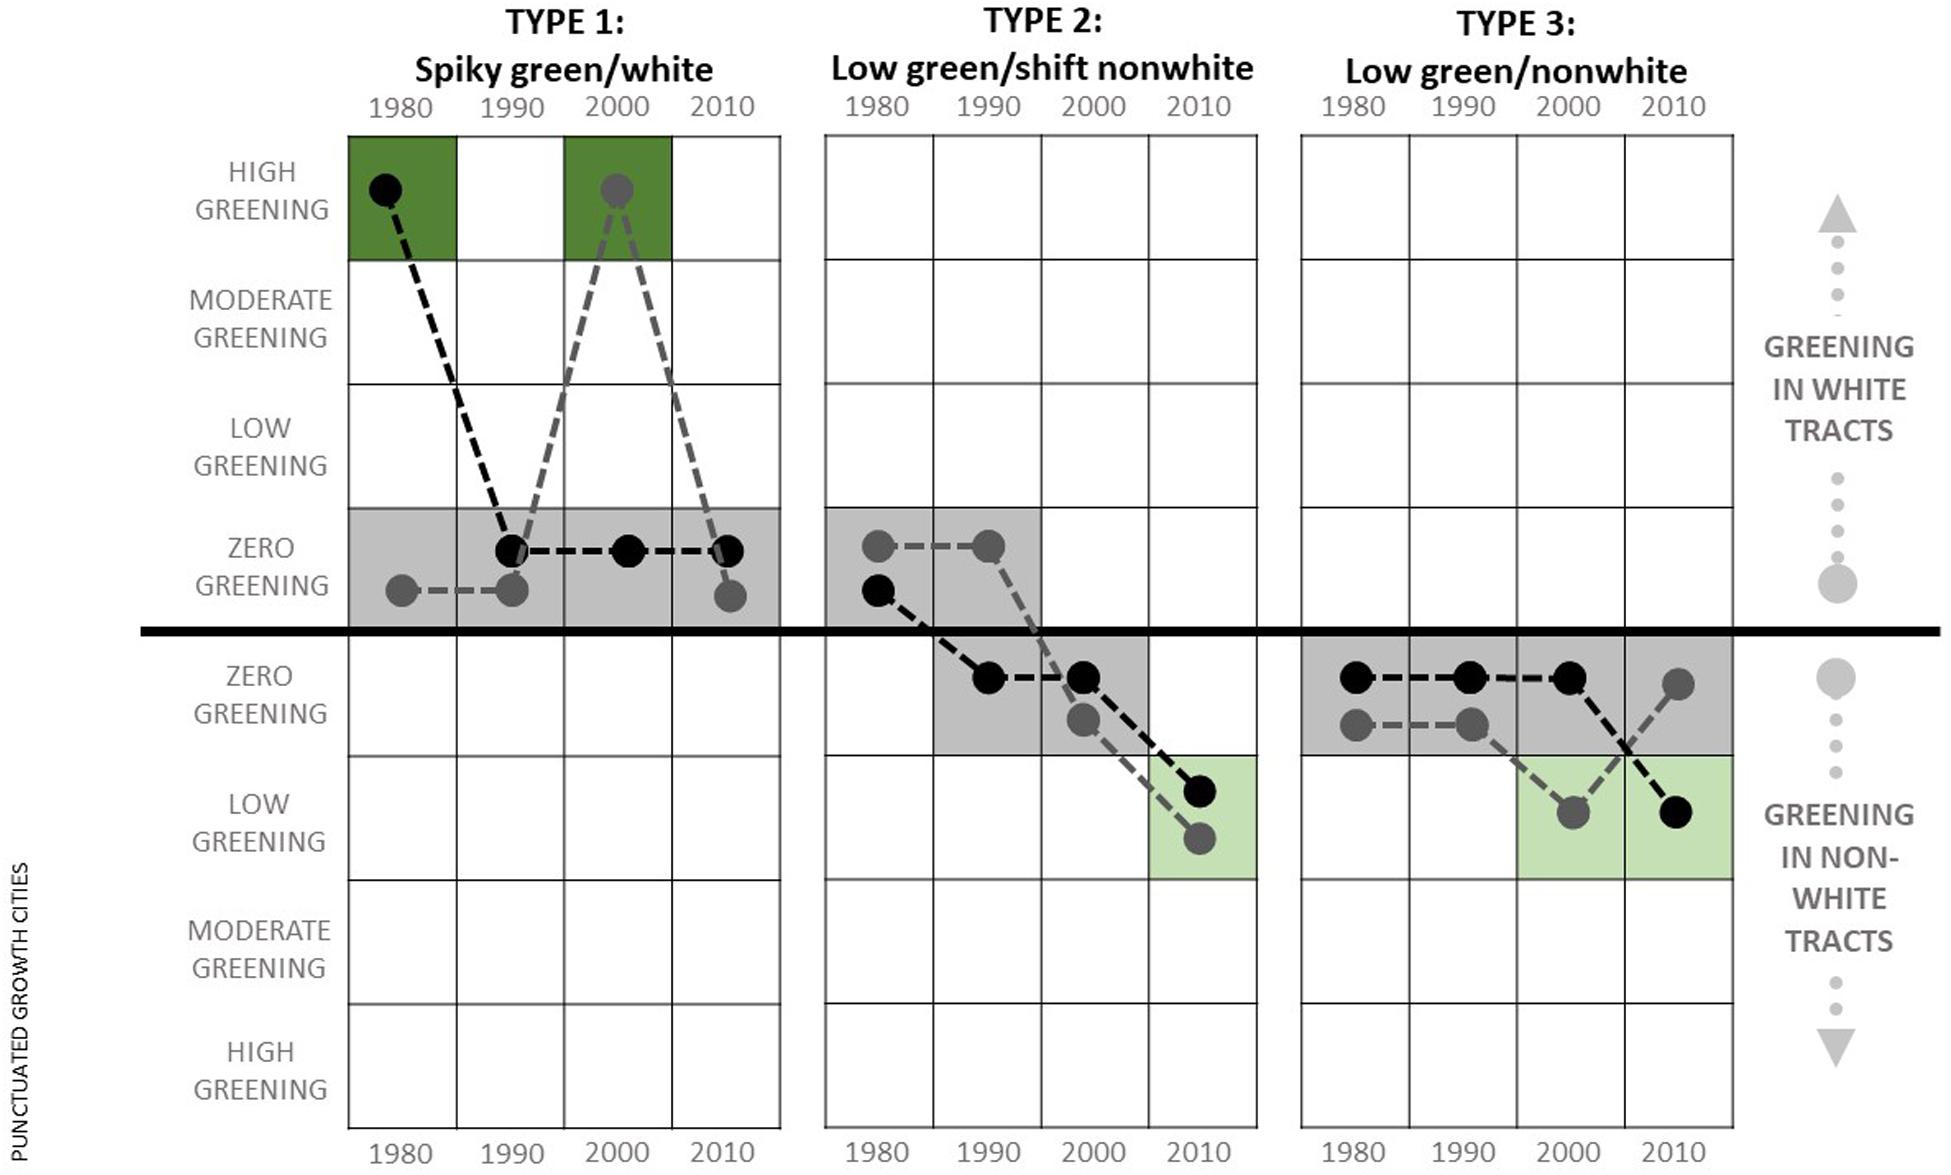
Figure 5. Punctuated growth cities typical trajectories: three-cluster solution for race/ethnicity-greening trajectories of all tracts that had any greening between 1975 and 2014. The black line represents the most common sequence and the gray line represents the second-most common sequence. Together, these lines reflect the modal sequence, or most common trend, within a cluster. Detailed cluster results can be found in the Supplementary Material.
In order to demonstrate how these historical patterns in the relationship between greening and whiteness translate into on-the-ground experiences in steady growth cities, we draw on qualitative data gathered in the central East Austin neighborhood of Austin, Texas, which contains core tracts that fall within the “high green/shift white” (Type 3) cluster. In the 1990s, a lot changed for Austin. It transformed from a relatively sleepy college and government town into the fastest growing large US city (Kolko, 2016), labeled the second-most overvalued real estate market in the country and the “most difficult” real estate market in Texas (Gross, 2018). Its growth was propelled by the high technology industry, with firms such as Dell, AMD, and others with secondary offices including Adobe, Amazon, and Apple driving much of the sector, which thrust the city into the heart of the global economy. The growth in technology design and production industries was sparked by strategic investments and a local culture that was increasingly attractive to a highly paid young workforce (Smilor et al., 1989), but the fact that the city had extensively preserved its natural ecosystem and park system, with enviable spaces such as Barton Springs Greenbelt, Walnut Creek Metropolitan Park, Red Bud Isle, or Mayfield Park, was essential to the city’s attractiveness. High income technology workers could afford to choose between locations based on such intangibles as the local environment, so cities like Austin with a rich store of green amenities and attractive local culture had an advantage (Florida, 2004).
Austin wasn’t designed to accommodate the rapid growth it experienced at the turn of the twentieth century, and so had to plan quickly for where the new development would go. Due to a racist historic land use policy passed in the 1930s that required (through legal mandate) non-white residents to move to the east side of town, which was also where most heavy industry was concentrated, the most underdeveloped area was also where many people of color lived. In the 1980s, community groups in the East Austin neighborhood began organizing to clean up and remove many of the industrial sites near their homes. One organizer said of the time, “…we made history by rezoning over 600 properties…you had to address what was going on but then you had to address what was allowing all these polluting and industrial facilities in our communities, and it was through land use and zoning that was doing that.” As a result of these changes to land use and the greening initiatives that were underway by the mid-1990s, East Austin was seen by many as “ready” to receive the new development, a crucial condition for its formal designation by the city as a “desired development zone,” which shifted new growth in that direction.
By the early 2000s, a new development push had taken root in East Austin, which by then was becoming one of the most rapidly gentrifying neighborhoods in the country associated with widespread displacement of low-income people of color (Maciag, 2015). Meanwhile, a new round of greening and associated green rhetoric (Garcia-Lamarca et al., 2019) was used as a way to further draw development to East Austin. One city official commented, “the emphasis [became]…getting some parkland established out ahead of development actually to help lure development out toward that way [the east side]…We were trying to buy land out there ahead of development and hopefully draw development out there with parkland. And it was hugely successful. Now all of the development has followed those tracts of land.”
In the end, greening was used to “prepare” East Austin for development in two ways at two different time periods, both of which show up in the Type 3 steady growth cluster. Intensive greening in the early 1990s was focused on cleaning up formerly industrial land in such a way as to make the area ripe for designation as a “desired development zone.” Then, intensive greening in the early- to mid-2000s took the form of new parks and greenways as a “lure” for development to the area, with acquisitions for parks such as Roy Guerrero Metro Park and East Boggy creek Greenbelt, and contributing to green gentrification trends (Long, 2016; Garcia-Lamarca et al., 2019). That “high green/shift white” clusters are one of the typical historical trajectories in steady growth cities shows that the intensive greening associated with a shift from non-white to white population seen in East Austin was a defining characteristic across these cities.
Continuous Contraction Cities
When considering the data for continuous contraction cities, the three most representative clusters of state sequences shown in Figure 4 demonstrate that, while small-area greening has widely occurred in non-white tracts, the most intense levels of greening have mostly occurred in white tracts. The first cluster of tracts (Type 1, n = 136), labeled “variable green/white,” retained a notable level of white population (above the Zhang-Logan threshold of at least 25% of the nationwide average for whites across all metros) throughout the study period with various levels of greening including high- and low-area greening concentrated in the 1980s and the 2000s. Most importantly, “variable green/white” tracts are the only areas of continuous contraction cities that saw any high-area greening and are the only cluster type that stayed white throughout the study period. The second cluster of tracts (Type 2, n = 26), labeled “low green/shift non-white,” changed from white to non-white (white population dipped below the threshold to be considered “present”) in the 2000s with low-area greening carried out in the non-white period, but not prior. The third cluster of tracts (Type 3, n = 134), labeled “low green/non-white,” stayed non-white throughout the study period (or, in some cases became non-white very early in the study period) with low-area greening concentrated in the latter years. There are thus two major, polarized trends in continuous contraction cities: limited but intense new greening in white areas only and widespread but small-area greening in non-white areas.
In order to demonstrate one of these clusters, we focus on qualitative data gathered in the Detroit Shoreway neighborhood of Cleveland, Ohio, an area containing several tracts in the “variable green/white” (Type 1) cluster of continuous contraction cities. Since the 1960s, drastic economic and population decline have defined Cleveland’s trajectory, with blue-collar employment plummeting to only 29% in 1986, a population loss of 380,000 inhabitants by 2019 (US Census Bureau, 2019), and thousands of uninhabited homes and vacant lots. From an environmental justice standpoint, the Cuyahoga River and its adjacent black areas have historically been the symbol of environmental degradation and industrial and other types of waste contamination. Since the beginning of the 2010s, however, Cleveland has experienced some cultural, art, and food-based revival, with new real estate development and investment, mostly in racially mixed areas of the city that would fall into the Type 1 cluster (whites are present above the Zhang-Logan threshold of at least 25% of the average across all metros) for continuous contraction urban areas. In contrast, one respondent stated what they saw as an impression held widely by local residents that some other areas, like East Cleveland, are “too poor and too black” to be seen as targets for reinvestment or gentrification by private developers and homeowners.
Since the late 2000s, the restoration of the Cuyahoga River and Lake Erie, as part of the transformation to rebrand Cleveland as “a green city on a blue lake” and depict both spaces as assets (Samanta and Kellogg, 2019), has been triggering other nearby environmental efforts. Neighborhoods like Tremont, Ohio City, and Detroit Shoreway are being revived through new housing developments and greening investments. As of 2018, the Northern section of Detroit Shoreway has seen new luxury housing built next to the restored Edgewater park. Although the park is now an attractive amenity with lakeside beaches, boat docks and fishing areas, and picnic sites, local black families report being unable to find affordable housing in its vicinity, and thus to enjoy greater proximity to the new green spaces. As one resident shared, “In the 5 years since my son bought his house [in the Detroit Shoreway neighborhood], there’s no house in this [Detroit Shoreway] neighborhood that they [my daughter and her partner] could find, that’s move-in ready that they could afford. And they’re not, they’re not super low income.”
Developers reported during interviews that the new green revival of part of the neighborhood was a major asset, and particularly highlighted their ability to sell high-end homes by marketing Edgewater Park and another recent park called Battery Park as a core asset in Detroit Shoreway. The Detroit Shoreway neighborhood is close to downtown, close to motorized high-speed roads, full of sit-down restaurants and shops, and also hosts a sizable white population (49%), all making up the “attractiveness” of Detroit Shoreway to outsiders. One of them highlights the green value of Battery Park for residents looking for a more dense, proximate-to-downtown “sustainable lifestyle”: “From Battery Park you can walk to the Gordon Square area, you can walk to restaurants, you can walk to Capitol Theater, there are theaters, bars, restaurants, retail and people are really attracted to the walkability and accessibility. To walk to Edgewater is a beautiful thing as well because there are the walking paths over here, so you can actually get to Edgewater Beach.” Detroit Shoreway shows that “variable green/white” (Type 1) tracts in Continuous Contraction cities, which have sustained white populations above the Zhang-Logan threshold and experienced concentrated periods of high-area greening, are key areas for revitalizing declining economies and population growth, but also for strengthening the link between higher income whiter neighborhoods and greening in cities—a process which undermines racial green justice.
Punctuated Growth Cities
When considering the data for punctuated growth cities that recovered from prior declines, the trends associated with high and low growth in other cities can both be seen. In other words, there are similarities with steady growth and continuous contraction cities. The three most representative clusters of state sequences shown in Figure 5 demonstrate an historic association between tracts with a high level of greening that sustained white populations and tracts with a low level of greening that sustained or shifted toward non-white populations.
The first cluster of tracts (Type 1, n = 281), labeled “spiky green/white,” represents the bulk of the areas that greened. These areas retained white population above the Zhang-Logan threshold of at least 25% of the average across all metros throughout the period studied and had spikes of concentrated greening in two periods—the late 1980s and the early 2000s. Most of the early (1980s) intensive greening in these cities occurred in Type 1 tracts, implying that these actions were associated with sustained whiteness in the following decades. The second cluster of tracts (Type 2, n = 32), labeled “low green/shift non-white,” had the lowest occurrence and showed a shift from white to non-white in the 1980s or early 1990s with greening scattered throughout. These tracts represent the tail-end of a long prior period of “white flight” away from these large cities. Philadelphia was especially still experiencing this trend in the 1980s and, thus, has a concentration of Type 2 tracts. Greening in these tracts was mostly relatively low early-on and then non-existent in more recent years. The third cluster of tracts (Type 3, n = 170), labeled “low green/non-white,” mostly stayed non-white (with a few exceptions) and had greening concentrated around the early 2000s. Type 3 tracts commonly had low or moderate levels of greening by area, implying that later and lower levels of greening were not associated with substantial racial or ethnic shifts in these cities (however, see qualitative case below for an example of the precarious nature of this trend).
In order to demonstrate how these trends translated into on-the-ground experiences, we draw on qualitative data gathered in the Bayview-Hunters Point neighborhood of San Francisco, which contains core tracts that fall within the Type 3 cluster for Punctuated Growth cities. San Francisco has been a node in the globalized, tech-driven economy since the 1980s, with its green identity being a front-and-center attractor of new high-income and majority white residents. Until recently, some heavily industrial communities such as Bayview-Hunters Point were considered hostile to new developments and to migration by upper income or white residents. Historically the site of intensive municipal, regional, and military industrial facilities, including the former PG&E power plant; the Southeast Sewage Treatment plant; the naval shipyard; waste sites; diesel freight transportation; and two freeway lines, Bayview-Hunters Point residents have continuously been exposed to toxic smells, waste, and acute negative health outcomes (Dillon, 2014; Liu and Shatford, 2019). Local residents and organizers almost universally describe a pattern of municipal neglect of the area as a key factor in exacerbating these conditions.
However, since becoming a federal Superfund site in 1989 and benefiting from remediation, 500 acres of the neighborhood and its waterfront have been or are being redeveloped into 13,000 new homes and more accessible and integrated green and blue spaces (e.g., Hunters Point Shoreline, Candlestick Point, and India Basin). Today, the neighborhood includes one of the few natural areas within the city adjacent to the Bay (India Basin Neighborhood Association, 2019) and it has unique natural and recreational features such as a recreational trail on a segment of the Bay Trail, shoreline access for recreation, one of only a few tidal salt marsh wetlands in San Francisco, and restored habitats for shore birds.
Yet, everyone we interviewed (regardless of background) was acutely aware that the area is seen as one of the last development frontiers in San Francisco. The southeastern waterfront including Bayview-Hunters Point now sits adjacent to and is planned for new luxury development and retail gentrification through new restaurants, shops, and services. For example, the India Basin mixed-use project is envisioned as “a pedestrian-first, human-scaled, bicycle-friendly, residential village where neighborhood amenities are within a short walk,” including 15.5 acres of open space. While historically populated by working-class African American families and other ethnic minorities (Chitewere et al., 2017), an increasing number of white and Asian residents with higher incomes have recently purchased homes in the area. As an example of the housing boom characterizing the area, recently homes have gone for sale for more than $800,000 for a 2-bedroom—well above the financial capacity of existing residents. This shift has created a new sense of acute insecurity, wherein the benefits of the new environmental cleanups are almost lost on existing residents of color. In the words of one resident, “everyone is trying to stabilize housing. If you don’t have a place to stay, you don’t care that the sea level is going to rise, you don’t care that your air is bad, you don’t care about the quality of the environment.”
The sense that demographic shifts generate a more acute threat than environmental conditions is sensible given recent census data. While in 1980, 72% of residents self-identified as African American, today only 27% identify as black (of any sort). This decline is summarized by the San Francisco Bayview Newspaper as “the smallest black population and the fastest exodus of any big city in America” (Epps, 2020). In contrast, according to the 2009–2013 American Community Survey, 19.5% of all neighborhood residents are now white. This has led to a deep suspicion among Bayview-Hunters Point residents of the motivations behind greening efforts, and they have started to resist greening. As one citywide greening group said, “We have encountered some real resistance to [greening] in this part of town…If we look at a map of where we have been active over the last four years, you know, this is the one area where we have been unsuccessful…and this is primarily about social justice concerns.” Bayview-Hunters Point demonstrates that, while many Type 3 tracts have not yet seen a substantial shift toward whiter populations, the people living in these tracts are quite aware of the trends seen in Type 1 (spiky green/white) areas of their city. People of color living in recently greened areas expressed feeling highly vulnerable to displacement in punctuated growth cities, even if those are still contaminated and industrial areas. Our quantitative data analysis supports their suspicion that, as these areas become extensively greened, those who will benefit from new restored and cleaned-up grounds are more likely to be white residents—high profile green projects like those in Bayview-Hunters Point and their associated branding seem to accompany shifts toward a whiter population.
Trends Across All Cities
While each city growth trajectory has a unique register of association between greening and the presence of white population over time, the recurrence of similar cluster characteristics across different trajectories shows that there are some overall commonalities. Steady growth cities have the strongest and most uniform tendency toward a trend expressed across all cities: clusters of tracts that greened and sustained or shifted toward white populations were the only ones that were defined by high-area, concentrated greening. We do also see a cluster of low levels of greening in white tracts in steady growth cities, but this cluster is mostly a consequence of the fact that these cities have a high percentage of white population so nearly all greening occurred in tracts where white population was present. Thus, Figure 6 shows high and low greening occurred in tracts that sustained or shifted toward a white population for steady growth cities, but not for any other type of city. The key trend for high area greening, though, is that it occurred mostly in white tracts across all three types of cities.
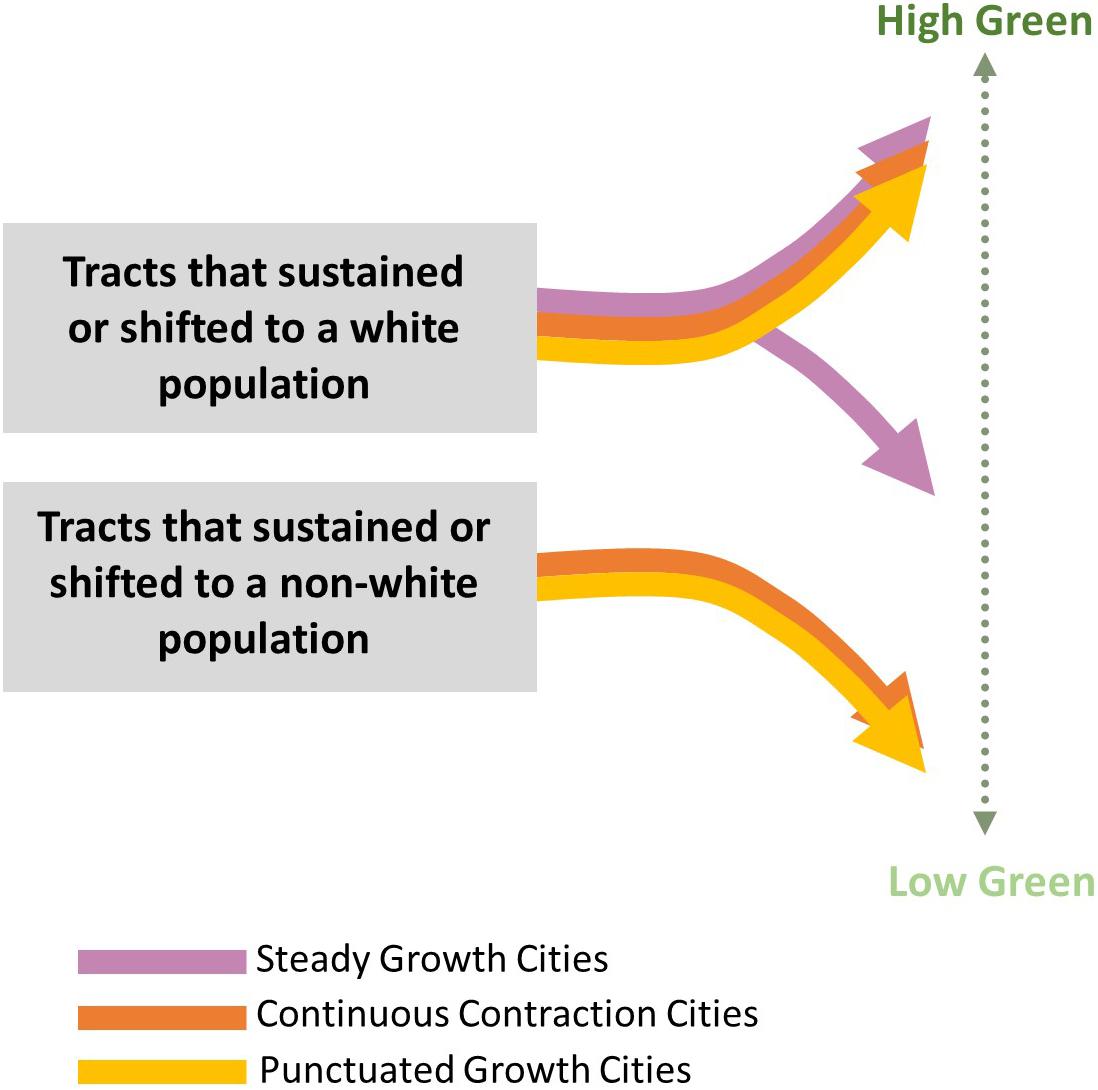
Figure 6. Greening trends in white and non-white tracts.
Meanwhile, continuous contraction cities have the strongest and most uniform tendency toward another common trend: all clusters of tracts that sustained or shifted toward non-white populations were defined by low-area greening. Overall, combined trends show clusters with an association between high-area greening occurring in tracts with notable white populations and low-area greening concentrated in non-white areas (with the exception of steady growth cities where there was little to no greening in tracts that did not, at some point, have white representation). Figure 6 visualizes this overall commonality across all growth trajectories.
Discussion
In order to serve as an effective historical diagnostic for urban greening, our findings need to be filtered through an understanding of the underlying processes of urban land use planning that caused them (Heynen et al., 2006; Safransky, 2014; Anguelovski, 2016; Schell et al., 2020). In general, the associations we find make sense when considering the intertwined legacies of housing segregation, gentrification, and urban greening (Grove et al., 2018; Roman et al., 2018). Our findings reflect an underlying process wherein racial difference has been used to generate monetary value through home ownership (Gotham, 2000; Fluri et al., 2020) and been demarcated by policy (Fields, 2018). Urban greening is wrapped up in this underlying process.
In the US, housing finance has facilitated benefits to flow to white homes more readily than non-white (Aaronson et al., 2017; Rothstein, 2017), with an extreme example being what is referred to as “redlining.” From the 1930s through several decades past World War II, the federal agency responsible for guaranteeing home loans formally reinforced—by drawing red lines on maps—the widely held racist notion that non-white neighborhoods were “high risk,” thus effectively excluding non-white areas from access to low-cost mortgage lending guaranteed by the government (Squires and Woodruff, 2019). Predictably, redlined neighborhoods in cities such as many of those in our sample—Cleveland or Baltimore in particular—became severely disinvested and lost population during a roughly 50-year period of white flight to suburban areas. This mass exodus left many underinvested urban neighborhoods in those cities with under-maintained green spaces.
By the mid-1980s, though, two processes were taking shape that would alter the fate of many redlined neighborhoods and that shapes the findings we report. First, banks developed lucrative and predatory high-interest loan products targeted toward high-risk areas and began making predatory loans widely accessible. Second, a renewed interest on the part of middle-class white Americans and an emerging awareness of “rent gaps” made these neighborhoods a target for gentrification that caused widespread residential displacement of non-white residents. As a result, many neighborhoods that were redlined in the 1930s started to be gentrified by the 1980s (Wyly and Hammel, 1999), and our results for Austin, San Francisco, New York, Philadelphia, Seattle, and Portland especially demonstrate this trend. For example, 87% of San Francisco’s gentrified neighborhoods in 2018 were also redlined in prior periods (Urban Displacement and Project, 2020). This effect was common in cities throughout the country, especially those that experienced a post-industrial economic boom around the turn of the twentieth century (Wyly and Hammel, 2004).
Meanwhile, by the 1990s, our analysis illustrates the outcomes of a process by which the selection of which formerly redlined neighborhoods would be targeted by gentrification investments was increasingly driven by actions undertaken within urban sustainability and greening circles. By the early 2000s, this link between gentrification of formerly disinvested neighborhoods and the global push toward greener cities came to be seen by some as a consolidated process of urban eco, green, or environmental gentrification (Dooling, 2009; Checker, 2011; Anguelovski et al., 2019), an argument that has been especially applied to cities such as New York, Seattle or Portland in our sample. As parks, gardens, and greenways started to be seen as investment strategies that would prepare areas for increased property value due to greater attractiveness (Immergluck and Balan, 2018), greening in those cities became linked with the racialized history of gentrification. Urban greening proponents could no longer claim to be innocent bystanders as cities became more unequal and elite (Connolly, 2018; McClintock, 2018; Garcia-Lamarca et al., 2019) and thus centers of green privilege for upper-class white residents.
In booming housing markets such as New York and San Francisco, our results show that especially the push toward presumably more visible concentrated greening was associated with sustained whiteness or a shift from non-white to white—a consequence in these cities of gentrification processes. As one organizer we interviewed in Austin put it, the interests shifted toward a “different shade of green”—referring at once to the green of American money and the continued push toward a whiter cultural norm that came with increased monetary value. Safransky (2014) described this as a process of greening becoming a tool for the settler colonial approach to urban space. Going back to Marcuse (1997), racialized residents in the new green “citadels” of fast growing post-Fordist cities have been increasingly excluded and often have had to move to “outcast [gray] ghettos.”
From Historical Diagnostic to Social-Ecological Justice
What are alternatives to the racialized green histories we see in these nine American cities? One response to the racial blinders worn by earlier urban greening agendas was articulated by Heynen (2016) as “abolition ecology.” In this alternative, outcomes of recent decades of efforts to re-nature cities point toward a need to rethink the study of urban ecology by examining urban natures first and foremost through the lens of antiracist, postcolonial and indigenous theory. This approach points toward what some scholars have started to call “green reparations” (Draus et al., 2019). The green reparations approach explicitly links urban greening initiatives with efforts to atone for historical violence committed against racial or ethnic groups in a given city. For example, in a recent study comparing the use of greening in Berlin (Germany) and Detroit (United States), the authors found examples of green spaces that served as curative bridges with explicit recognition of historical racial violence embedded in them. Another case is the planned 11th street bridge park in Washington DC, which, despite staying shy of returning land to displaced black residents, aims at allowing local control over development in the neighborhood through a linked land trust (Avni and Fischler, 2019).
Abolition ecology and green reparations represent ways of thinking and acting from an urban ecology perspective that allows the historical diagnostic developed here to be mobilized for what Steil (2018; see also Steil and Delgado, 2019) refers to as “anti-subordination planning.” Anti-subordination planning calls for the evaluation of all interventions in urban space from the perspective of effect, rather than intent. If the effect of an action is to perpetuate the subordinate position of a disadvantaged group, then it violates the tenets of anti-subordination planning, regardless of intent. It would be hard to argue against the assertion that urban ecology and urban environmental planning are at times focused only on process and intent, while abolition ecology, green reparations, and anti-subordination planning seek to force an accounting for effect, which is also the primary purpose of the historical diagnostic presented in this paper.
While it is not easy to conceive of exactly what just greening looks like when it embodies abolition ecology principles by enacting green reparations through an anti-subordination planning mode that respects the lived experience of marginalized populations (Anguelovski et al., 2020), history provides a place to start. When we know the pattern of relations between greening and whiteness and the social-ecological outcomes of a city, we can ask how and where that pattern needs to be changed. We can use the patterns alongside nuanced qualitative understanding of the context to develop strategies for creating a new history that does not passively accept the social effect of greening as an unmovable historical artifact. Rather, an historical diagnostic brings into relief the contours of effect that prior actions had by outlining the detailed historic patterns. We can start recognizing how the history of greening—a seemingly apolitical “urban project” sold as a win-win, universal benefit with ample health, economic, and environmental qualities—has deep links to the exclusionary and racist roots of urbanization that manifest at different points in time and space across and within cities.
Conclusion
Our goal in this paper was to analyze the co-evolution of greening and whiteness in nine American cities with different growth trajectories. We propose here a novel quantitative, spatial, and qualitative mixed methods analysis of trends and advance existing research at the intersection of urban ecology, green justice, and racialization of urban space. Specifically, we sought to answer three questions. First, we asked: What are the common sequences across all nine cities with regard for changes in green space and changes in the racial makeup of surrounding areas? We find that the combined trend within the state sequence analysis shown in Table 2 and Figure 6 demonstrates a basic underlying relationship wherein higher area greening is more associated with tracts that either sustained or shifted toward whiter populations in American cities. There are, though important variations across time and type of city.
Second, we asked: Does this pattern vary according to the historical growth trajectory of the city? While there is an underlying narrative of greening and whiteness, our hypothesis that there are three sub-histories to this narrative was affirmed. The tight interlock between race/ethnicity and socio-economic opportunities in American society appears to be visible within urban greening outcomes and growth seems to shape that relationship to a substantial degree. Each of the three growth trajectory histories point toward different relationships between greening and whiteness. For the most rapidly growing cities—the steady growth cities—greening was either closely associated with white areas (Type 1 and Type 2 clusters) or linked to a process of shifting areas from non-white to white (Type 3 cluster). For the cities that lost population continuously and saw a declining GDP—the continuous contraction cities—there was a trend for high-area greening to be associated with whiter areas (Type 1 cluster) and low-area greening to be associated with non-white areas (Type 2 and 3 clusters). For the largest cities that saw a resurgence during the study period—the punctuated growth cities—intensive greening in the 1980s and early 1990s was associated with a sustained white population (Type 1 cluster), while low or moderate levels of greening in the 2000s was more associated with sustained non-white populations (Type 2 and 3 clusters).
Finally, we asked: Can a generalized relationship be determined with regard to the relationship between greening and racial change in these cities? To answer this question, we look at the subset of clusters where racial change occurred (steady growth Type 3; continuous contraction Type 2; punctuated growth Type 2). The trend of co-occurring greening and a shift from non-white to white was limited for tracts that greened to steady growth cities (Type 3), and this trend was characterized by high levels of greening. This finding does not mean that such a process cannot be found in other cities, but rather that it was only a common trend in cities with intense growth. Meanwhile, the trend of co-occurring greening and a shift from white to non-white only occurred in continuous contraction (Type 2) and punctuated growth (Type 2) cities. In both cases, this trend involved zero early greening and low levels of recent greening, demonstrating the recent push toward small-scale green projects, often led by residents or community activists, in these areas. Overall, the answer to this final question—and the general takeaway of this research—is that greening, growth, and race are tightly interlocked qualities of unequal urban space in American cities. Only in considering this interlock through an integrated historical diagnostic can urban ecological interventions hope to work toward racial justice.
Data Availability Statement
The raw data supporting the conclusions of this article will be made available by the authors, without undue reservation.
Ethics Statement
The studies involving human participants were reviewed and approved by the Universitat Autonoma de Barcelona. The patients/participants provided their written informed consent to participate in this study.
Author Contributions
JC primarily conceived the manuscript, completed all quantitative and spatial analysis, co-developed the qualitative analysis, and primarily drafted the text. IA co-developed the qualitative analysis, contributed to writing sections of the text, and edited the full text. Both authors contributed to the article and approved the submitted version. The authors would also like to acknowledge that some of the greenspace and qualitative data used in this paper are based on datasets developed by several members of the Barcelona Lab for Urban Environmental Justice and Sustainability. In particular, we would like to acknowledge that the qualitative analysis of Cleveland was based on the draft of a book chapter co-authored by Margarita Triguero-Mas and Wendy A. Kellogg, which will be published in full form soon after this article in the forthcoming book published by Routledge and edited by Isabelle Anguelovski and James J. T. Connolly, The Green City and Social Injustice: 21 tales from North America and Europe.
Funding
This research was supported by the EU H2020 ERC project GreenLULUs (GA678034) and faculty support from the University of British Columbia and the “María de Maeztu” Programme for Units of Excellence of the Spanish Ministry of Science and Innovation, CEX2019-000940-M.
Conflict of Interest
The authors declare that the research was conducted in the absence of any commercial or financial relationships that could be construed as a potential conflict of interest.
Supplementary Material
The Supplementary Material for this article can be found online at: https://www.frontiersin.org/articles/10.3389/fevo.2021.621783/full#supplementary-material
References
Aaronson, D., Hartley, D., and Mazumder, B. (2017). “The effects of the 1930s HOLC “redlining” maps (No. 2017-12),” in Working Paper Series WP-2017-12, (Chicago, IL: Federal Reserve Bank of Chicago).
Anguelovski, I. (2016). From toxic sites to parks as (green) LULUs? New challenges of inequity, privilege, gentrification, and exclusion for urban environmental justice. J. Plann. Literat. 31, 23–36. doi: 10.1177/0885412215610491
Anguelovski, I., Brand, A. L., Connolly, J. J., Corbera, E., Kotsila, P., Steil, J., et al. (2020). Emancipatory, antisubordination, intersectional, and relational approach. Ann. Am. Assoc. Geograph. 110, 1743–1769. doi: 10.1080/24694452.2020.1740579
Anguelovski, I., Connolly, J., and Brand, A. L. (2018). From landscapes of utopia to the margins of the green urban life: for whom is the new green city? City 22, 417–436. doi: 10.1080/13604813.2018.1473126
Anguelovski, I., Connolly, J. J., Garcia-Lamarca, M., Cole, H., and Pearsall, H. (2019). New scholarly pathways on green gentrification: what does the urban ‘green turn’mean and where is it going? Prog. Human Geography 43, 1064–1086. doi: 10.1177/0309132518803799
Avni, N., and Fischler, R. (2019). Social and Environmental Justice in Waterfront Redevelopment. The Anacostia River, Washington, DC: Urban Affairs Review.
Bird Rose, D. (2004). Reports from a Wild Country: Ethics for Decolonisation. Sydney NSW: UNSW Press.
Boone, C. G., Buckley, G. L., Grove, J. M., and Sister, C. (2009). Parks and people: an environmental justice inquiry in Baltimore, Maryland. Ann. Assoc. Am. Geograph. 99, 767–787. doi: 10.1080/00045600903102949
Borgna, C., and Struffolino, E. (2018). “Unpacking configurational dynamics: sequence analysis and qualitative comparative analysis as a mixed-method design,” in Sequence Analysis and Related Approaches: Innovative Methods and Applications, eds G. Ritschard and M. Studer (Basingstoke: Springer Nature), 298. doi: 10.1007/978-3-319-95420-2_10
Checker, M. (2011). Wiped out by the “greenwave”: environmental gentrification and the paradoxical politics of urban sustainability. City Soc. 23, 210–229. doi: 10.1111/j.1548-744x.2011.01063.x
Chitewere, T., Shim, J. K., et al. (2017). How neighborhoods influence health: lessons to be learned from the application of political ecology. Health Place 45, 117–123. doi: 10.1016/j.healthplace.2017.03.009
City of Philadelphia (2016). Greenworks: A vision for Sustainable Philadelphia. City of Philadelphia Office of Sustainability. Available online at: https://www.phila.gov/media/20161101174249/2016-Greenworks-Vision_Office-of-Sustainability.pdf (accessed October 2, 2020).
Connolly, J. J. (2018). From systems thinking to systemic action: social vulnerability and the institutional challenge of urban resilience. City Community 17, 8–11. doi: 10.1111/cico.12282
Connolly, J. J. (2019). From jacobs to the just city: a foundation for challenging the green planning orthodoxy. Cities 91, 64–70. doi: 10.1016/j.cities.2018.05.011
Curnow, J., and Helferty, A. (2018). Contradictions of solidarity: whiteness, settler coloniality, and the mainstream environmental movement. Environ. Soc. 9, 145–163. doi: 10.3167/ares.2018.090110
Dillon, L. (2014). Race, waste, and space: brownfield redevelopment and environmental justice at the hunters point shipyard: waste, race and space. Antipode 46, 1205–1221. doi: 10.1111/anti.12009
Dooling, S. (2009). Ecological gentrification: a research agenda exploring justice in the city. Int. J. Urban Reg. Res. 33, 621–639. doi: 10.1111/j.1468-2427.2009.00860.x
Draus, P., Haase, D., Napieralski, J., Roddy, J., and Qureshi, S. (2019). Wounds, ghosts and gardens: historical trauma and green reparations in Berlin and Detroit. Cities 93, 153–163. doi: 10.1016/j.cities.2019.05.002
Epps, K. (2020). San Francisco Don’t Like Black People. SF Bayview. February 11. Available online at: https://sfbayview.com/2020/02/san-francisco-dont-like-black-people/. (accessed October 12, 2020).
Ernstson, H. (2013). The social production of ecosystem services: a framework for studying environmental justice and ecological complexity in urbanized landscapes. Landscape Urban Plann. 109, 7–17. doi: 10.1016/j.landurbplan.2012.10.005
Fields, D. (2018). Constructing a new asset class: property-led financial accumulation after the crisis. Econ. Geography 94, 118–140. doi: 10.1080/00130095.2017.1397492
Florida, R. (2004). The Rise of the Creative Class and how it’s Transforming Work, Leisure, Community and Everyday Life (Paperback Ed.). New York, NY: Basic Books.
Fluri, J. L., Hickcox, A., Frydenlund, S., and Zackary, R. (2020). Accessing Racial Privilege Through Property: Geographies of Racial Capitalism. Amsterdam: Elsevier. doi: 10.1016/j.geoforum.2020.06.013
Garcia-Lamarca, M., Anguelovski, I., Cole, H., Connolly, J. J., Argüelles, L., Baró, F., et al. (2019). Urban green boosterism and city affordability: for whom is the ‘branded’green city? Urban Stud. 58:0042098019885330.
Gibson, C., and Jung, K. (2002). Historical Census Statistics on Population Totals by Race, 1790 to 1990, and by Hispanic Origin, 1790 to 1990, for the United States, Regions, Divisions, and States. Washington, DC: US Census Bureau.
Glaeser, E. L., and Saiz, A. (2003). The Rise of the Skilled City (No. w10191). Cambridge, MA: National Bureau of Economic Research.
Goodling, E., Green, J., and McClintock, N. (2015). Uneven development of the sustainable city: shifting capital in Portland. Oregon. Urban Geography 36, 504–527. doi: 10.1080/02723638.2015.1010791
Gotham, K. F. (2000). Racialization and the state: the housing act of 1934 and the creation of the federal housing administration. Soc. Perspect. 43, 291–317. doi: 10.2307/1389798
Gould, K. A., and Lewis, T. L. (2016). Green Gentrification: Urban Sustainability and the Struggle for Environmental Justice. Milton Park: Routledge.
Gross, J. (2018). Austin Might be the ‘Most Difficult’ Real Estate Market in Texas.: https://www.austin360.com/business/real-estate/austin-might-the-most-difficult-real-estate-market-texas/to6G2Ku5d7PKHfHbBYuMwI/ (accessed August 1, 2019).
Grove, M., Ogden, L., Pickett, S., Boone, C., Buckley, G., Locke, D. H., et al. (2018). The legacy effect: understanding how segregation and environmental injustice unfold over time in Baltimore. Ann. Am. Assoc. Geograph. 108, 524–537. doi: 10.1080/24694452.2017.1365585
Heynen, N. (2016). Urban political ecology II: The abolitionist century. Prog. Hum. Geogr. 40, 839–845. doi: 10.1177/0309132515617394
Heynen, N., Perkins, H. A., and Roy, P. (2006). The political ecology of uneven urban green space: the impact of political economy on race and ethnicity in producing environmental inequality in Milwaukee. Urban Affairs Rev. 42, 3–25. doi: 10.1177/1078087406290729
Hingorani, A. (2019). LA County Park Equity Groups Fight to Turn Park-Poor Communities ‘Red to Green’. Advancement Project Website. Available online at: https://www.advancementprojectca.org/blog/la-county-park-equity-groups-fight-to-turn-park-poor-communities-red-to-green (accessed October 18, 2020).
Immergluck, D., and Balan, T. (2018). Sustainable for whom? Green urban development, environmental gentrification, and the Atlanta Beltline. Urban Geography 39, 546–562. doi: 10.1080/02723638.2017.1360041
India Neighborhood Association (2019). India Basin History. San Francisco, CA: India Basin Neighborhood Assoc.
Langemeyer, J., and Connolly, J. J. (2020). Weaving notions of justice into urban ecosystem services research and practice. Environ. Sci. Policy 109, 1–14. doi: 10.1016/j.envsci.2020.03.021
Lesnard, L. (2009). Cost Setting in Optimal Matching to Uncover Contemporaneous Socio-Temporal Patterns. Paris, OSC: Sciences Po/CNRS. doi: 10.1177/0049124110362526
Liu, X., and Shatford, S. (2019). “Affordable housing and residential segregation in san francisco: a spatial analysis between 2000 and 2015,”in Working Paper 2019-2 San Francisco, CA: Applied Housing research initiative.
Logan, J. R., Xu, Z. W., and Stults, B. J. (2014). Interpolating US decennial census tract data from as early as 1970 to 2010: a longitudinal tract database. Prof. Geographer 66, 412–420. doi: 10.1080/00330124.2014.905156
Logan, J. R., and Zhang, C. (2010). Global neighborhoods: new pathways to diversity and separation. Am. J. Soc. 115, 1069–1109. doi: 10.1086/649498
Long, J. (2016). Constructing the narrative of the sustainability fix: Sustainability, social justice and representation in Austin, TX. Urban Studies 53, 149–172. doi: 10.1177/0042098014560501
Maciag, M. (2015). Gentrification in America Report. Governing. Available online at: http://www.governing.com/gov-data/gentrification-in-cities-governing-report.html (accessed January 9, 2018).
Manyika, J., Remes, J., Dobbs, R., Orellana, J., and Schaer, F. (2012). Urban America: US Cities in the Global Economy. Washington, DC: McKinsey Global Institute.
Marcuse, P. (1997). The enclave, the citadel, and the ghetto: what has changed in the post-Fordist US city. Urban Affairs Rev. 33, 228–264. doi: 10.1177/107808749703300206
McClintock, N. (2018). Cultivating (a) sustainability capital: urban agriculture, ecogentrification, and the uneven valorization of social reproduction. Ann. Am. Assoc. Geograph. 108, 579–590. doi: 10.1080/24694452.2017.1365582
Park, Y., and LaFrombois, M. E. H. (2019). Planning for growth in depopulating cities: an analysis of population projections and population change in depopulating and populating US cities. Cities 90, 237–248. doi: 10.1016/j.cities.2019.02.016
Peck, J. (2005). Struggling with the creative class. Int. J. Urban Reg. Res. 29, 740–770. doi: 10.1111/j.1468-2427.2005.00620.x
Pulido, L. (2000). Rethinking environmental racism: white privilege and urban development in Southern California. Ann. Assoc. Am. Geograph. 90, 12–40. doi: 10.1111/0004-5608.00182
Pulido, L. (2017). Geographies of race and ethnicity II: environmental racism, racial capitalism and state-sanctioned violence. Prog. Hum. Geography 41, 524–533. doi: 10.1177/0309132516646495
Ritschard, G., and Studer, M. (2018). “Sequence analysis: where are we, where are we going?,” in Sequence Analysis and Related Approaches: Innovative Methods and Applications, eds G. Ritschard and M. Studer (Basingstoke: Springer Nature). doi: 10.1007/978-3-319-95420-2
Roman, L. A., Pearsall, H., Eisenman, T. S., Conway, T. M., Fahey, R., Landry, S., et al. (2018). Human and biophysical legacies shape contemporary urban forests: a literature synthesis. Urban Forestry Urban Green. 31, 157–168. doi: 10.1016/j.ufug.2018.03.004
Rossignon, F., Studer, M., Gauthier, J., and Le-Goff, J. (2018). “Sequence History Analysis (SHA): estimating the effect of past trajectories on an upcoming event,” in Sequence Analysis and Related Approaches: Innovative Methods and Applications, eds G. Ritschard and M. Studer (Basingstoke: Springer Nature). doi: 10.1007/978-3-319-95420-2_6
Rothstein, R. (2017). The Color of Law: a Forgotten History of how Our Government Segregated America. New York, NY: Liveright Publishing.
Safransky, S. (2014). Greening the urban frontier: race, property, and resettlement in Detroit. Geoforum 56, 237–248. doi: 10.1016/j.geoforum.2014.06.003
Safransky, S. (2018). Land justice as a historical diagnostic: thinking with detroit. Ann. Am. Assoc. Geograph. 108, 499–512. doi: 10.1080/24694452.2017.1385380
Samanta, A., and Kellogg, W. (2019). “Back to the beginning: the resurgence of the cuyahoga river and cleveland,” in Legacy Cities: Continuity and Change amid Decline and Revival, eds S. Webster and R. Tighe (Pittsburgh, PA: University of Pittsburgh Press).
Schell, C. J., Dyson, K., Fuentes, T. L., Des Roches, S., Harris, N. C., Miller, D. S., et al. (2020). The ecological and evolutionary consequences of systemic racism in urban environments. Science 369:eaay4497. doi: 10.1126/science.aay4497
Smilor, R. W., Gibson, D. V., and Kozmetsky, G. (1989). Creating the Technopolis: High-technology Development in Austin, Texas. Austin, TX: IC2 Institute Articles. doi: 10.1016/0883-9026(89)90033-5
Smith, N. (1996). The New Urban Frontier: Gentrification and the Revanchist City. Palmeira Mansion: Psychology Press.
Squires, G. D., and Woodruff, F. (2019). Redlining. Hoboken, NJ: Wiley Online Library, 1–8. doi: 10.1002/9781118568446.eurs0260
Steil, J. P., and Delgado, L. H. (2019). Limits of diversity: jane jacobs, the just city, and anti-subordination. Cities 91, 39–48. doi: 10.1016/j.cities.2018.06.017
Steil, J. (2018). Antisubordination planning. J. Plann. Educ. Res. doi: 10.1177/0739456X18815739 [Epub ahead of print].
Urban Displacement and Project (2020). Online Resource. Available online at: https://www.urbandisplacement.org/redlining (accessed April 15, 2020).
US Census Bureau (2019). Detroit, Michigan Quickfacts. Available online at: https://www.census.gov/quickfacts/fact/table/detroitcitymichigan, MI/PST045219 (accessed October 13, 2020).
Walks, R. A. (2001). The social ecology of the post-Fordist/global city? economic restructuring and socio-spatial polarisation in the Toronto urban region. Urban Stud. 38, 407–447. doi: 10.1080/00420980120027438
Walsh, E. A. (2018). White fragility as an obstacle to anti-racist resilience planning: opportunities for equity-conscious partnerships. J. Urban Manag. 7, 181–189.
Wyly, E. K., and Hammel, D. J. (1999). Islands of decay in seas of renewal: housing policy and the resurgence of gentrification. Hous. Policy Debate 10, 711–771. doi: 10.1080/10511482.1999.9521348
Wyly, E. K., and Hammel, D. J. (2004). Gentrification, segregation, and discrimination in the American urban system. Environ. Plann. 36, 1215–1241. doi: 10.1068/a3610
Keywords: race and greening, green justice, urban greening, green gentrification, social-ecological conflict, urban ecology and sustainability
Citation: Connolly JJT and Anguelovski I (2021) Three Histories of Greening and Whiteness in American Cities. Front. Ecol. Evol. 9:621783. doi: 10.3389/fevo.2021.621783
Received: 27 October 2020; Accepted: 08 February 2021;
Published: 12 March 2021.
Edited by:
Kitty Connolly, Theodore Payne Foundation, United StatesReviewed by:
Lindsay Kathleen Campbell, United States Forest Service (USDA), United StatesIryna Dronova, University of California, Berkeley, United States
Copyright © 2021 Connolly and Anguelovski. This is an open-access article distributed under the terms of the Creative Commons Attribution License (CC BY). The use, distribution or reproduction in other forums is permitted, provided the original author(s) and the copyright owner(s) are credited and that the original publication in this journal is cited, in accordance with accepted academic practice. No use, distribution or reproduction is permitted which does not comply with these terms.
*Correspondence: James J. T. Connolly, amFtZXMuY29ubm9sbHlAdWJjLmNh