 Juha Saarinen
 Omar Cirilli
 Flavia Strani
 Keiko Meshida5
 Raymond L. Bernor
- 1Division of Geosciences and Geography, University of Helsinki, Helsinki, Finland
- 2Dottorato di Ricerca in Scienze della Terra, Università di Pisa, Pisa, Italy
- 3Paleo[Fab]Lab, Dipartimento di Scienze della Terra, Università degli Studi di Firenze, Firenze, Italy
- 4Dipartimento di Scienze della Terra, PaleoFactory, “Sapienza – Università di Roma”, Roma, Italy
- 5Laboratory of Evolutionary Biology, Department of Anatomy, College of Medicine, Washington, DC, United States
- 6Human Origins Program, Department of Anthropology, Smithsonian Institution, Washington, DC, United States
The monodactyl horses of the genus Equus originated in North America during the Pliocene, and from the beginning of the Pleistocene, they have been an essential part of the large ungulate communities of Europe, North America and Africa. Understanding how body size of Equus species evolved and varied in relation to changes in environments and diet thus forms an important part of understanding the dynamics of ungulate body size variation in relation to Pleistocene paleoenvironmental changes. Here we test previously published body mass estimation equations for the family Equidae by investigating how accurately different skeletal and dental measurements estimate the mean body mass (and body mass range) reported for extant Grevy's zebra (Equus grevyi) and Burchell's zebra (Equus quagga). Based on these tests and information on how frequently skeletal elements occur in the fossil record, we construct a hierarchy of best practices for the selection of body mass estimation equations in Equus. As a case study, we explore body size variation in Pleistocene European Equus paleopopulations in relation to diet and vegetation structure in their paleoenvironments. We show a relationship between diet and body size in Equus: very large-sized species tend to have more browse-dominated diets than small and medium-sized species, and paleovegetation proxies indicate on average more open and grass-rich paleoenvironments for small-sized, grazing species of Equus. When more than one species of Equus co-occur sympatrically, the larger species tend to be less abundant and have more browse-dominated diets than the smaller species. We suggest that body size variation in Pleistocene Equus was driven by a combined effect of resource quality and availability, partitioning of habitats and resources between species, and the effect of environmental openness and group size on the body size of individuals.
Introduction
The evolution of equids leading to the extant genus Equus is of particular interest due to their rich fossil record in all continents except Australia and Antarctica. The well-documented evolutionary history of this group of ungulates was memorialized by Simpson (1951) in his volume Horses and most recently the evolution and palaeobiology of Equus have been deeply examined by Bernor et al. (2019) in 14 chapters authored by 41 investigators in a special issue of Frontiers in Ecology and Evolution.
The genus Equus is particularly suitable to investigate key aspects of ungulate palaeoecology such as the dynamics of body size variation in relation to habitat alteration and changes in dietary behaviors for several reasons. First, the genus Equus was among the most widespread and abundant genera of large mammals in North America and in the Old World throughout the Pleistocene. For example, the Eurasian wild horse, Equus ferus, ranks as the second most common species of ungulates in the Middle to Late Pleistocene localities of UK, after the red deer (Cervus elaphus) (e.g., Saarinen et al., 2016). Second, the genus Equus is a relatively monotypic large mammal genus, with modest eco-morphological variation between species, and thus it provides an excellent case for exploring body size variation between palaeopopulations. The benefit of this approach is that it provides generalized information of body size variation, which is not obscured by evolutionary lineages with high morphological disparity, in response to diet, habitats and the presence of competing, closely related species. Moreover, Equus represents a particular type of open-adapted, grazing-adapted genus of ungulates, which has been suggested to have an opposite body size response to habitat openness than ungulate species that are more browse-dominated feeders and have comparatively small group sizes but large body size in open environments, such as Cervus elaphus, although this hypothesis needs to be further tested with a wider range of Equus species and populations (see Saarinen et al., 2016). Body size is an essential trait of all mammals that is allometrically related to most aspects of their physiology and ecology (Damuth and MacFadden, 1990; Brown et al., 2004). Moreover, body mass is a universal and easily comparable measure of body size, that enables comparison of the size of animals with different body plans. Thus, several methods for estimating the body mass of living and extinct species and populations of mammals have been developed, with those based on regressions between body mass and bone/tooth measurements in living taxa being the most practical for application to fossil species.
Here we test previously published body mass estimation equations of Equus on modern zebras, and use the best measurements for body mass estimation on a large dataset of Pleistocene European Equus to test the hypothesis that body size in Equus varied in response to diet and vegetation type. Furthermore, we provide new information on niche partitioning in this regard between sympatric species of Equus.
The rationale for testing existing body mass estimation equations of equids for their accuracy with modern equids is that accuracy in the estimates is particularly important when exploring fine variations in mean body size at the level of paleopopulations rather than species and larger taxonomic groupings. As comparative species we have chosen the extant Equus grevyi and E. quagga, due the availability of measurement data and for them being truly wild species of equids without potential effect of past domestication events.
Here, we develop a database of 1,628 measurement records of Equus species ranging in age between 3.3 Ma to present. In particular, we utilize large measurement datasets of two extant species of African Equus, E. quagga (Burchell's zebra), and E. grevyi (Grevy's zebra) and test which of the dental and post-cranial—based equations best predict the reported mean body mass (and body mass range) of these species. We then use the best body mass estimation equations (as tested with modern zebras) to estimate body masses of several Pleistocene Equus species/populations from Europe. Furthermore, we compare these estimated body masses with dietary signals provided by mesowear analysis (Fortelius and Solounias, 2000) and paleoenvironmental proxies of vegetation type and environmental openness (pollen, isotopic, and microvertebrate records). By this practice, we undertake an investigation of how Pleistocene Equus species' diet and vegetation structure may have been affected by their body size.
Present Background of the Genus Equus in the Old World During the Pleistocene
In the Old World, the arrival of the genus Equus in the Early Pleistocene faunal assemblages represents an important biochronological event, known as the Equus Datum (Lindsay et al., 1980; Azzaroli, 1983; Bernor et al., 2019; Rook et al., 2019; Cirilli et al., 2020b). The Equus Datum is usually recognized by the immigration of the North American monodactyl horse Equus simplicidens into Eurasia. This event is correlated with the initiation of a major glaciation pulse in the northern hemisphere and the first Equus occurrence in the Old World has been observed at 2.58 Ma in Europe and 2.55 in China (Rook et al., 2019; Cirilli et al., 2020a). Historically, most scholars agree that North American E. simplicidens can be identified as the oldest species of genus Equus (Skinner and Hibbard, 1972; Azzaroli, 1992, 2000, 2002; Azzaroli and Voorhies, 1993; Alberdi et al., 1998; Palombo and Alberdi, 2017; Bernor et al., 2018, 2019; Rook et al., 2019; Cirilli et al., 2020a,b); this hypothesis has also been supported by some recent paleogenomic analyses (Orlando et al., 2013; Vilstrup et al., 2013). Nevertheless, this hypothesis is not shared by some scholars, which prefer to identify the North American species into the genus Plesippus (Matthew, 1924; Gazin, 1936), and the Eurasian and African species into Allohippus (Kretzoi, 1938; Gromova, 1949); in their opinion, the genus Equus should be recognized as younger than 1 Ma (Eisenmann and Baylac, 2000; Eisenmann and Deng, 2005; Barrón-Ortiz et al., 2019). In this work, we consider the North American and Eurasian fossil species as being members of the genus Equus, following Skinner and Hibbard (1972), Azzaroli (1992, 2000, 2002), Azzaroli and Voorhies (1993), Alberdi et al. (1998), Vilstrup et al. (2013), Orlando et al. (2013), Palombo and Alberdi (2017), Cantalapiedra et al. (2017), Bernor et al. (2018, 2019), Rook et al. (2019), and Cirilli et al. (2020a,b).
In Europe, the Equus Datum is marked by the first occurrence of Equus livenzovensis in Eastern, Central and Western Europe at 2.58 Ma (Bajgusheava, 1978; Alberdi et al., 1997, 1998; Azzaroli, 2000; Bernor et al., 2018, 2019; Cirilli et al., 2020a) correlated with Mammal Neogene Zone 16b (MNQ16b) of the European Land Mammal Age biochronologic scheme (Guérin, 1990; Mein, 1999). Nevertheless, the most common and widespread species in the European Early Pleistocene is Equus stenonis. Equus stenonis is reported from most MNQ17 and 18 European Early Pleistocene localities (ca. 2.5–1.4 Ma), even if any occurrences from MNQ19 (1.4–1 Ma) localities cannot be excluded (Alberdi et al., 1998; Eisenmann, 2004a; Palombo and Alberdi, 2017; Bernor et al., 2019; Cirilli et al., 2020b). Furthermore, other species of Equus occurred in Europe during the Early Pleistocene. Equus major was the largest species but it is poorly represented in the fossil record, even if present at Senèze, 2.2–2.0 Ma (Alberdi et al., 1998; Palombo and Alberdi, 2017). During MNQ18, a medium-sized, slender-limbed Equus, namely Equus senezensis, appeared in French and Italian localities (ca. 2.2–2.0 Ma; Alberdi et al., 1998; Palombo and Alberdi, 2017). Equus stehlini is another one of these smaller, slender limbed Equus species recognized mostly from Italian localities (ca. 1.8 Ma, Azzaroli, 1964; Bernor et al., 2019; Cirilli et al., 2020b).
During the late Early Pleistocene (MNQ19, 1.4–1 Ma), a revolution occurred in the stenonine European Equus fossil record. A new slender-limbed species, Equus altidens, and the larger, heavy-limbed species Equus suessenbornensis made their first occurrences in the Italian localities of Farneta and Pirro Nord, central, and southern Italy, respectively (Alberdi and Palombo, 2013). It would appear that E. altidens replaced the medium-small-size E. senezensis and E. stehlini and became the most widespread species with a long-lasting occurrence in Europe up to the Middle Pleistocene. Equus suessenbornensis is less well-represented than E. altidens, even if it is also reported up to the Middle Pleistocene (Alberdi and Palombo, 2013; Palombo and Alberdi, 2017; Boulbes and van Asperen, 2019). Nevertheless, some isolated populations of E. stenonis still remained during the MNQ19, as reported from the French locality of Ceyssaguet, suggesting that E. suessenbornensis did not replace E. stenonis simultaneously everywhere (Aouadi, 1999; Aouadi and Bonifay, 2008). More studies are required to clarify the taxonomic position of the other two species in the Early Pleistocene of Europe, Equus apolloniensis, from the late Early Pleistocene of Apollonia 1 (Koufos et al., 1997; Boulbes and van Asperen, 2019; Eisenmann and Boulbes, 2020) and Equus wuesti from the Epivillafranchian of Untermassfield, Germany (Musil, 2001; Palombo and Alberdi, 2017; Boulbes and van Asperen, 2019; Eisenmann and Boulbes, 2020).
A complete revolution in the European Equus fossil record is marked by the arrival of the caballine horse Equus ferus (also referred to Equus ferus mosbachensis or Equus mosbachensis in Europe) in the Middle Pleistocene, ca. 0.7 Ma (Boulbes and van Asperen, 2019), which replaced the stenonine horses of the Early and early Middle Pleistocene of Europe (not Africa—for a complete summary of this chapter see Boulbes and van Asperen, 2019).
Materials and Methods
Testing Regression Equations for Equid Body Mass Estimation on Extant Zebras
We used a dataset of skeletal and dental measurements (Bernor's database; www.FuTRES.org) of the extant equid species Equus quagga, E. zebra, and E. grevyi, to test how the body mass estimation equations based on dental measurements (Janis, 1990; MacFadden and Hubert, 1990; Alberdi et al., 1995) and skeletal measurements (Scott, 1990; Alberdi et al., 1995) predict the mean body masses of these species reported in the literature (Grubb, 1981; Nowak, 1999; Kingdon and Hoffmann, 2013). For E. quagga, we also compared body mass estimates of the subspecies E. q. boehmi and E. q. chapmani with their mean body masses reported by Grubb (1981). All the measurements and body mass estimates of Equus quagga, E. grevyi, and E. zebra used in this study are provided in Supplementary Table 1. The measurement codes used in this study are explained in the captions for Tables 1, 2, and in Supplementary Table 1.
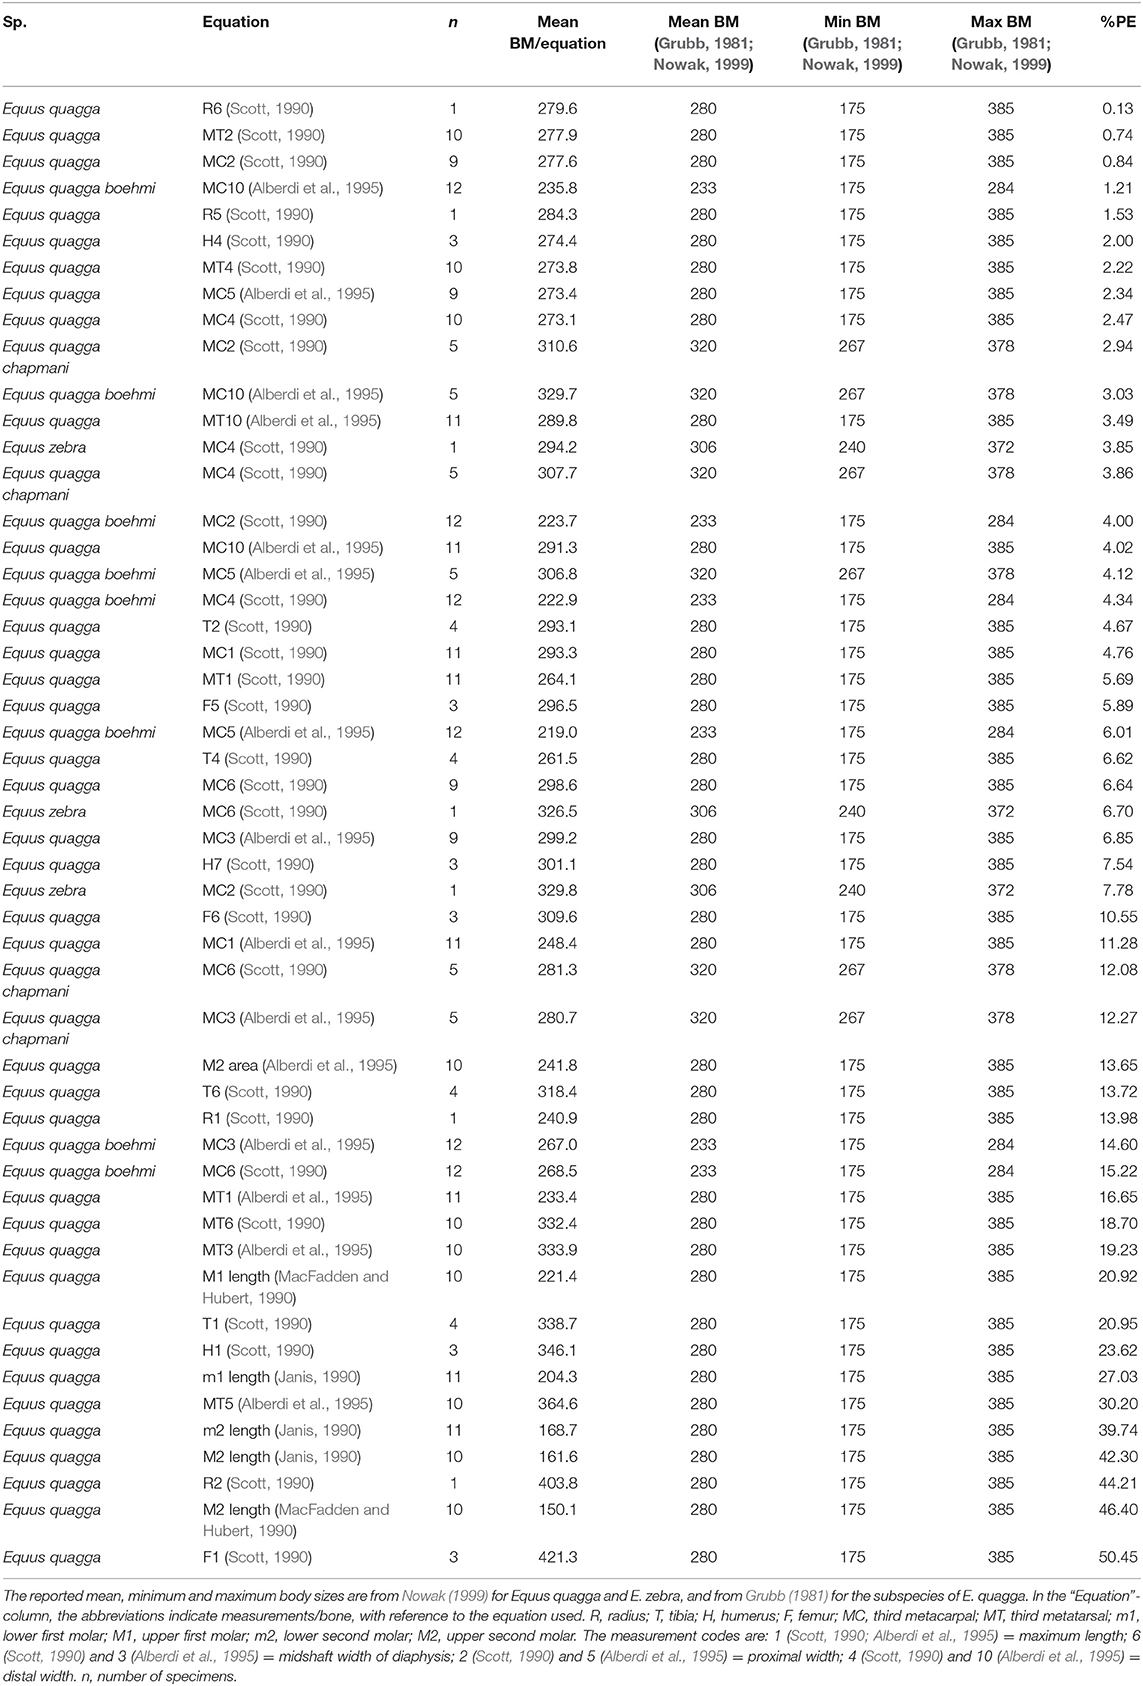
Table 1. Body mass estimation equations ranked from “best” to “worst” based on percent prediction error (%PE) for skeletal and dental measurements of Equus quagga, the subspecies E. quagga boehmi and E. quagga chapmani and E. zebra.
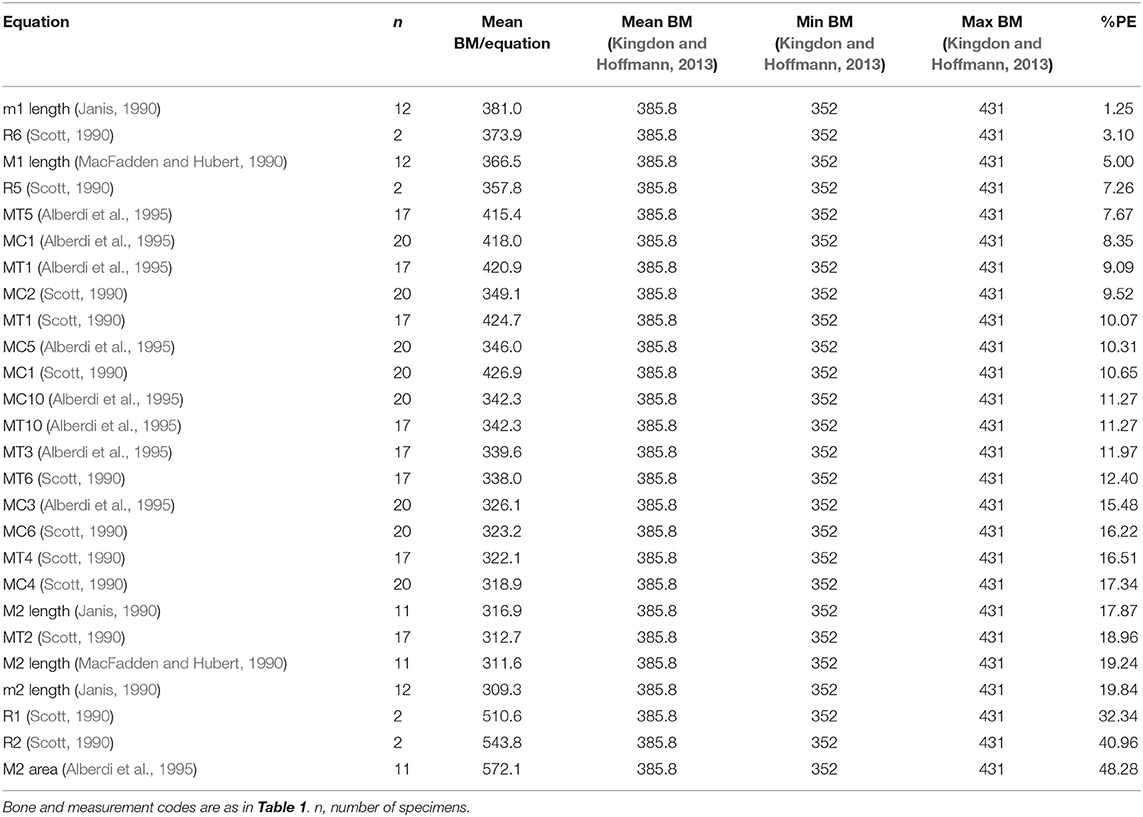
Table 2. Body mass estimation equations ranked from “best” to “worst” based on percent prediction error (%PE) for skeletal and dental measurements of Equus grevyi.
The limb-bone-based body mass estimation equations of Scott (1990) were based on regressions between bone measurements and body mass in 31 individuals of modern equids (species not listed, but indicated to include wild species, zoo animals and domestic breeds). The Equus przewalski specimens used by Scott (1990) were reported to be zoo animals, whereas the rest of the data for wild species were indicated to be wild specimens (although these were not listed in the article). The limb-bone-based estimates of Alberdi et al. (1995) were based on regressions between several limb bone measurements and reported mean body masses of all modern wild equid species (E. asinus, E. hemionus, E. kiang, E. przewalski, E. quagga and burchelli, E. grevyi, and E. zebra), and two morphotypes of domestic horses [E. caballus (ponies) and E. caballus (heavy horses)].
The dental measurement-based estimates of Janis (1990) were established on regressions between dental measurements and reported body mass in 19 extant species of modern perissodactyls [Equus asinus, E. quagga (buchelli), E. grevyi, E. hemionus, E. kiang, E. przewalski, E. zebra, Ceratotherium simum, Dicerorhinus sumatrensis, Diceros bicornis, Rhinoceros sondaicus, R. unicornis, Tapirus bairdii, T. indicus, T. pinchaque, and T. terrestris] and hyracoids (Dendrohyrax dorsalis, Heterohyrax brucei, and Procavia capensis), whereas the equations of MacFadden and Hubert (1990) were based on 73 selenodont ungulate species (not listed), and those of Alberdi et al. (1995) on equids (the same species as mentioned above for limb measurements).
We compared the estimated and reported body masses by plotting them together to visually observe their differences using the software SAS JMP 14, and by calculating percent prediction errors (PE = ([predicted mass − reported mass] / reported mass) *100) between the means of the estimated body masses based on dental and limb bone measurements and the reported mean body mass of the species. For the plots of body mass estimate comparisons with reported mean body mass and body mass range, box plots and mean lines were used for estimated body mass, and dashed lines were used to mark reported mean, minimum, and maximum body mass (Figures 2–4).
There are several reasons why we chose to test body mass estimates based on bone measurements by comparing them with reported mean body mass of species/subspecies rather than measured body mass and skeletal measurements from individual animals. First, there is the practical limitation that wild mammal individuals are rarely weighed even when killed, and large datasets of those are thus not available. This could be overcome by using captive animals as reference, however they could be heavier than average representatives of their species for a given skeletal measurement because of better-than-average nutrition.
The second point is that there is a considerable seasonal and lifetime variation within individuals in mammals living in the wild. Among the more extreme examples of this are brown bears, which can gain 30–35% larger masses in late autumn compared to their normal body mass when preparing for hibernation (Hissa et al., 1998). Thus, comparing skeletal measurements and body masses of individuals includes an unrealistic assumption of a stable linear relationship between individual bone measurements and individual body mass. Another contributing factor is that wild-shot animals generally never include a full range of juvenile, or late juvenile—adult individuals, both male and female, in museum collections. So, population mean estimates of males and females derived from field guides are the best available comparative data for testing body mass estimates such as we undertake here.
In order to show any different development in the E. grevyi and E. quagga metapodials, we have calculated a Log10 Ratio analysis on the third metacarpal and third metatarsal, including the North American fossil species E. simplicidens. The measurements provided in the Log10 Ratio diagrams follow the International Equids measurements standards by Eisenmann et al. (1988) and Bernor et al. (1997). The measurements included are: M1 (maximum length); M3 (midshaft width); M4 (depth of the diaphysis at level of M3); M5 (proximal articular breadth); M6 (proximal articular depth); M7 (maximum diameter of the articular facet for the third carpal/tarsal); M8 (diameter for the anterolateral facet for the fourth carpal/tarsal); M10 (distal maximum supra articular width); M11 (distal maximum articular width); M12 (distal maximum keel depth); M13 (distal maximum depth of the lateral condyle); M14 (distal maximum depth of the medial condyle). The Höwenegg Hippotherium primigenium means (Bernor et al., 1997) is used as standards in the Log10 Ratio analysis.
Body Mass Evolution and Diet of Pleistocene European Horses
As a case study, we compiled a dataset of Equus body mass estimates from the Pleistocene of Europe based on the measurements that best estimates body mass in modern zebras. These data include all taxa of stenonine and caballine Equus from Europe, spanning the entire Pleistocene. Our data also includes the ancestral Pliocene Equus simplicidens from Hagerman Horse Quarry, Idaho (USA). The Early, Middle and Late Pleistocene European localities included in this study are shown on map in Figure 1. The measurements for the body mass estimates were taken by Saarinen et al. (2016 and new data), OC and RB. Altogether ca. 1,500 metapodial measurements were used for the body mass estimates. For paleodietary analyses of Plio-Pleistocene Equus, we used dental mesowear analysis (Fortelius and Solounias, 2000). The mesowear data were collected by Saarinen et al. (2016 and new data) and Strani (2020). All the measurement data, body mass estimates and mesowear data of Pleistocene European Equus used in this study are provided in Supplementary Table 2.
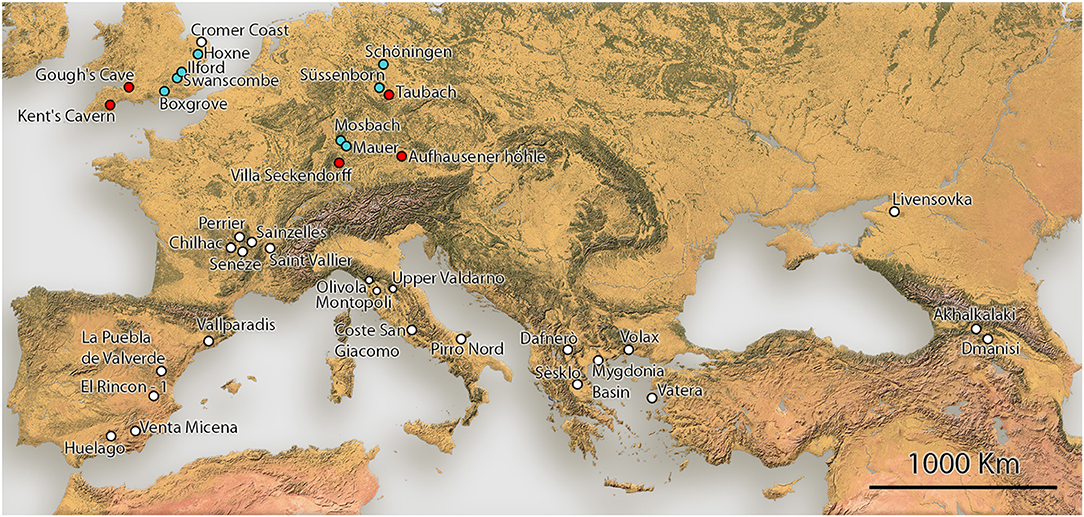
Figure 1. Map of Early to Late Pleistocene Equus localities included in this study.
We have compared the body mass estimates and mesowear of the Plio-Pleistocene Equus at the species/populations level (species at localities). For this purpose, the Equus species/populations were assigned to arbitrary body mass classes based on the body mass estimates, and the distribution of mesowear scores calculated from the mesowear data using the method described by Saarinen et al. (2016). For the mesowear score, a numeric value from 1 to 3 was assigned for each molar specimen for cusp shape (1 = sharp, 2 = rounded, 3 = blunt) and for the relief (1 = high, 3 = low), in the order of increasingly abrasion-dominated mesowear signal. A mesowear score was then calculated for each specimen as the mean of the shape value and relief value, and these are averaged for the populations. The mesowear scores were compared between the body size classes. These classes were defined as follows: small (<380 kg), medium (380–450 kg), large (450–550 kg), and very large (>550 kg). We present a temporal trend of Equus species during the Pleistocene (including the ancestral Equus simplicidens from North America), and compare dietary variation between the body size classes. The figures were drawn with the software SAS JMP 14.
A model II linear regression analysis between mean body mass estimates and mean mesowear scores of the Equus species/populations was performed in R version 3.5.2 using the R package lModel2 version 1.7-3 (Legendre, 1998; Legendre and Legendre, 2012). We chose the model II regression approach as it allows both of the variables (mesowear and body mass in this case) to have error limits that cannot be controlled (Legendre and Legendre, 2012). Before using a model II regression test, approximate bivariate normality of the variables should be tested for (Legendre, 1998). To test this, we utilized the R package mvnTest version 1.1-0. The results show that mesowear and body mass data of Pleistocene Equus are bivariate normally distributed according to Anderson-Darling test (p = 0.147) and Chi-squared type tests for multivariate normality (McCulloch test: p = 0.36, Nikulin-Rao-Robson test: p = 0.24, Dzhaparidze-Nikulin test: p = 0.20). Because body mass and diet are measured in different units, and there are no outliers beyond a dispersion ellipse of 95% probability fitted on the scatterplot between these two variables (Supplementary Figure 1), the appropriate model II regression method in this case is the ranged major axis method (RMA) (see Legendre, 1998). Permutation test with 99 permutations was used to test the significance of the RMA slope (p-perm).
A phylogeny that includes fossil species within Equus has been notoriously difficult to resolve, and it still remains unresolved as far as we can tell. This reflects the fact that morphological variation within Equus is relatively subtle and that this variation often occurs as an incoherent mixture of traits without clear-cut distinction between lineages (Eisenmann, 2004b). With such a genus where there is variation in body size and diet even within species (Saarinen et al., 2016), but morphological variation otherwise does not seem to follow clear-cut phylogenetic constraints, we considered it prudent to analyse the genus as one phenotypically plastic unit.
Finally, to evaluate the effect of vegetation structure and landscape openness on Equus body size, we have compiled information on the paleoenvironmental interpretations from pollen and small vertebrate records from the localities. The interpretations of vegetation structure and the percentage of non-arboreal pollen (NAP %) in the pollen records are based on original publications describing the paleobotanical interpretations based on pollen and small vertebrate proxies, and this information is provided in Table 3 with references.
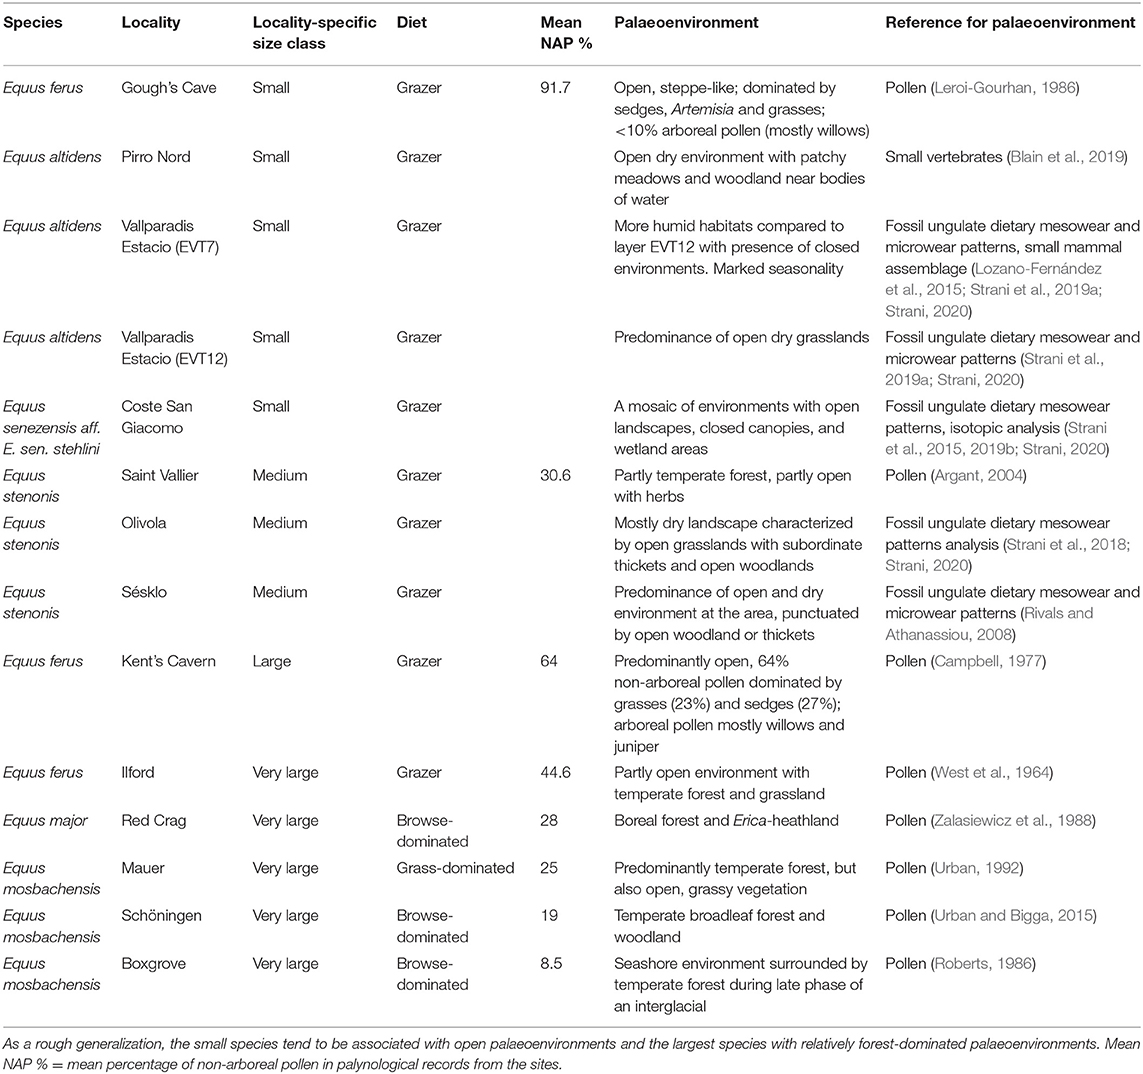
Table 3. Palaeoenvironmental interpretations of some Equus species/populations with different body size in the Pleistocene of Europe, from older to more recent.
Results
Testing Body Mass Equations on Modern Zebras
For E. quagga, most of the limb bone measurements give predicted body masses that are within the reported body mass range of the species (Figure 2), the only exceptions being femur length (F1, Scott, 1990), proximal width of radius (R2, Scott, 1990) and for a few individual specimens metatarsal 3 least diaphysis width (MT3, Alberdi et al., 1995; after Eisenmann et al., 1988; see Bernor et al., 1997), third metatarsal distal width (MT4, Scott, 1990) and third metatarsal proximal width (MT5, Alberdi et al., 1995). Most of the post-cranial and dental measurements give very accurate mean estimates of the mean body mass of E. quagga with %PE values smaller than 25% (Table 1). Of these, all third metacarpal measurements except maximal length (MC1, Alberdi et al., 1995), give estimates that differ from the mean body mass by <10%, with the most accurate ones being the third metacarpal proximal width (MC2, Scott, 1990 and MC5, Eisenmann et al., 1988; Alberdi et al., 1995; Bernor et al., 1997). Also, distal trochlea widths of humerus and femur (H4 and F5, Scott, 1990, respectively) give very accurate estimates, as do proximal and mid-shaft widths of radius (R5 and R6, Scott, 1990) and proximal width of tibia (T2, Scott, 1990). Dental estimates predict the mean body mass of E. quagga less accurately than the best post-cranial estimates, the most accurate ones being M2 (upper second molar) area (Alberdi et al., 1995)—with %PE of 13.7, M1 length (MacFadden and Hubert, 1990) with %PE of 20.9 and m1 (lower first molar) length (Janis, 1990) with %PE of 27 (Table 1). However, all the dental estimates (except M2 area) give estimates that are very close to the reported minimum body mass of E. quagga (Figure 2).
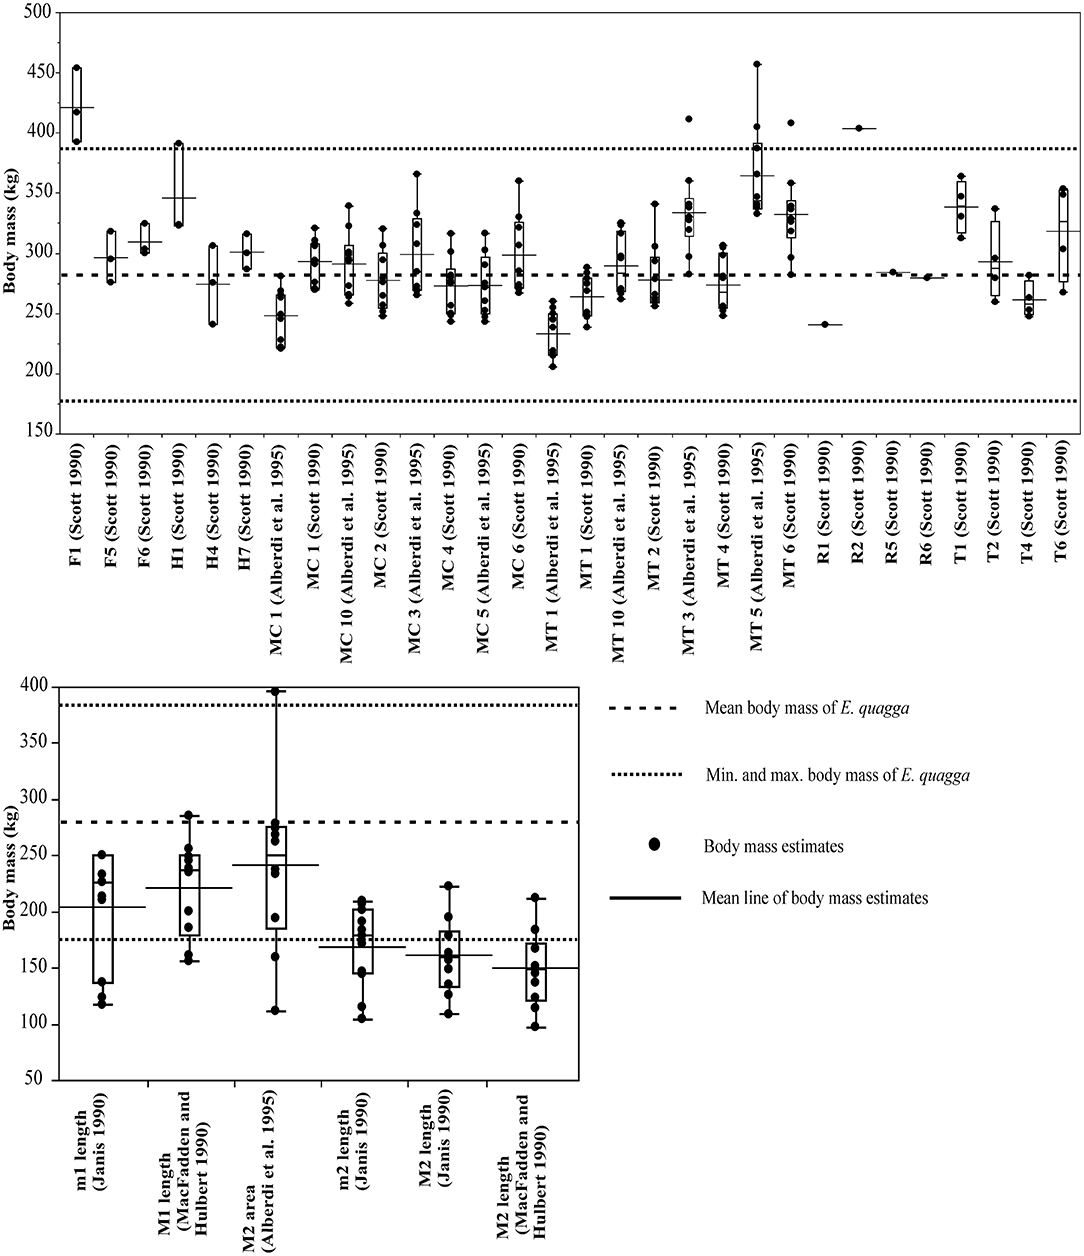
Figure 2. Visual comparisons of body mass estimates from various skeletal and dental measurements with reported mean, minimum and maximum body mass of the plains zebra (Equus quagga). Box plots and mean lines are provided for the body mass estimates from each skeletal and dental measurement, and the reported minimum, maximum and mean body mass are from Nowak (1999). The central line in the box plot indicates the median, the box covers the interquartile range (IQR) and the upper and lower whiskers are 1.5*IQR. In addition, a mean line is shown as a horizontal line extending outside the vertical limits of the box. Bone and measurement codes are as in Table 1.
For Equus grevyi, the dental and post-cranial measurements in general predict the reported mean body mass less precisely, giving mostly estimates closer to the reported minimum mass (Figure 3).
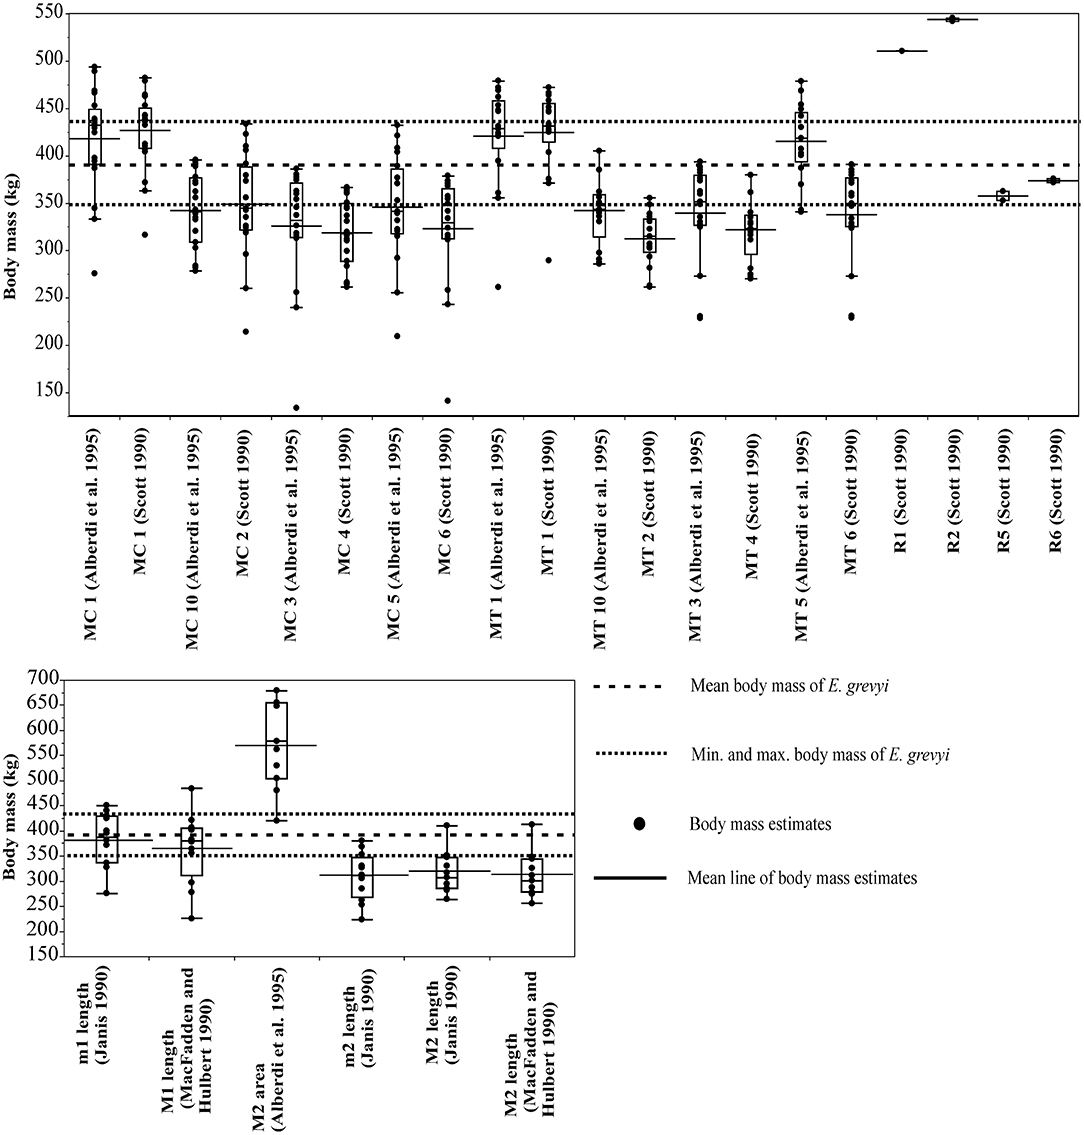
Figure 3. Visual comparisons of body mass estimates from various skeletal and dental measurements with reported mean, minimum and maximum body mass of Grevy's zebra (Equus greyi). Box plots and mean lines are provided for the body mass estimates from each skeletal and dental measurement, and the reported minimum, maximum and mean body mass are from Kingdon and Hoffmann (2013). The central line in the box plot indicates the median, the box covers the interquartile range (IQR) and the upper and lower whiskers are 1.5*IQR. In addition, a mean line is shown as a horizontal line extending outside the vertical limits of the box. Bone and measurement codes are as in Table 1.
Here, the equations that give estimates closest to the reported mean body mass of E. grevyi are: proximal width of the third metatarsal (MT5, Eisenmann et al., 1988; Alberdi et al., 1995; Bernor et al., 1997), and (unlike in the case of E. quagga) lengths of third metapodials (MC1 and MT1, Scott, 1990; Alberdi et al., 1995) and lower first molar length (Janis, 1990; Table 2). Again, all third metacarpal and metatarsal measurements give estimates that differ from the reported mass only by <20% (Table 2). The M2 area (Eisenmann et al., 1988; Alberdi et al., 1995; Bernor et al., 1997) now gives somewhat overestimated mass for E. grevyi, arguing against using tooth areas in body mass estimation.
The correspondence of body mass estimates based on metacarpal 3 measurements (Scott, 1990) to reported mean body mass and body mass range of modern zebras is visually shown in Figure 4. In most of the species/subspecies of extant zebras, except E. grevyi, the estimated body masses fall almost entirely within the range of reported body masses, and the mean estimated body mass differs from the reported mean body mass only by ca. 1–6% (Figure 4). In E. grevyi, the mean estimated body mass is close to the reported minimum body mass, being ca. 13% lower than the reported mean body mass, and the range of body mass estimates is much wider than the reported body mass range (Figure 4).
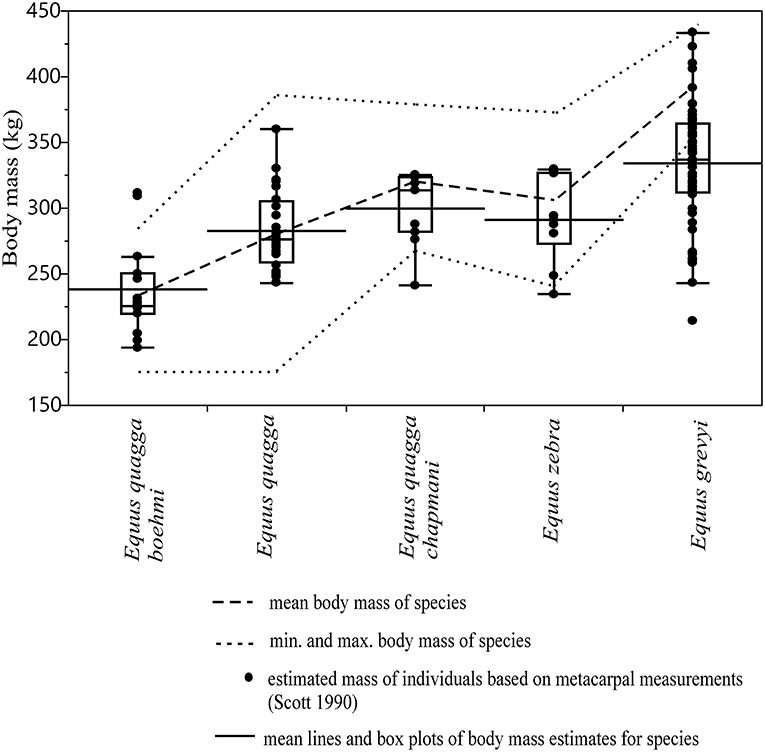
Figure 4. Box plots and mean lines of body mass estimates of extant zebras based on metacarpal III measurements (MC2, MC4, and MC6 of Scott, 1990) compared with reported mean, minimum and maximum body mass marked as dashed lines. Percent differences of the mean estimated body mass to mean reported body mass are: 0.89% for E. quagga, 2.29% for E. quagga boehmi, 4.8% for E. zebra, 6.3% for E. quagga chapmani and 13.4% for E. grevyi. The central line in the box plot indicates the median, the box covers the interquartile range (IQR) and the upper and lower whiskers are 1.5*IQR. In addition, a mean line is shown as a horizontal line extending outside the vertical limits of the box.
Case Study: Body Mass and Diet of Equus in the Pleistocene of Europe
During the Early and early Middle Pleistocene, there were typically two different-sized, often sympatric, species of stenonine Equus in Europe. During the earliest Pleistocene these were: E. livenzovensis/E. major (large species) in Eastern Europe (Kapry area, Forsten, 1998), and E. stenonis (medium-sized species)/E. senezensis or E. stehlini (small species) in most of the central European and Italian localities (see Alberdi et al., 1997; Palombo and Alberdi, 2017; Cirilli et al., 2020b), while during the latter part of the Early Pleistocene and early Middle Pleistocene these were typically E. suessenbornensis (large species) and E. altidens (small species), as reported by Alberdi et al. (1997), Alberdi and Palombo (2013), Palombo and Alberdi (2017), and Cirilli et al. (2020b; Figure 5). Since the arrival of the caballine horse Equus (E. mosbachensis/E. ferus) in Europe ca. 0.7 Ma (Middle Pleistocene, see Boulbes and van Asperen, 2019), the caballines replaced the stenonines as the large and medium-sized taxa, sometimes (but more rarely) coexisting with small hemionine taxa. The body mass of the caballines, especially Equus ferus, vary significantly through time, being on average large during the warm, wooded phases (most data from 0.4 to 0.1 Ma are from interglacial stages), and small during the cool, open phases, such as MIS (Marine Isotope Stage) 2 in Gough's Cave, UK (Figure 5 and Supplementary Table 2).
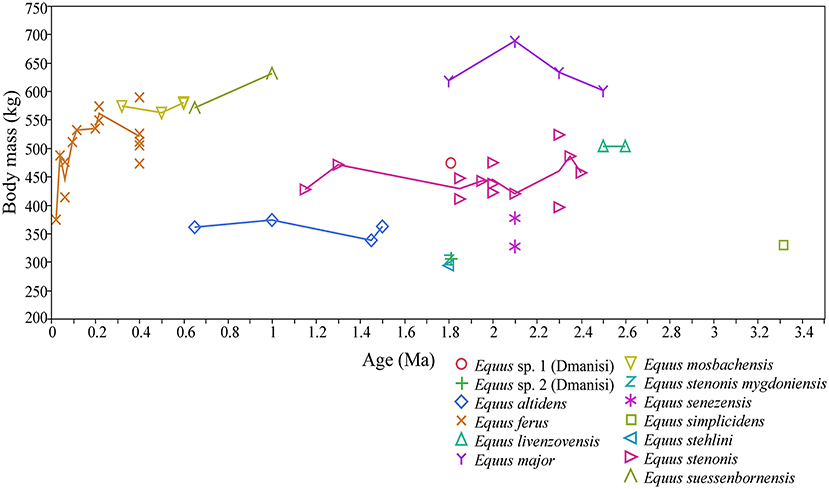
Figure 5. Body mass of Equus sp. in Europe during the Pleistocene, and the earliest Equus from the Hagerman Horse Quarry, (Idaho, USA). The body mass estimates are based on mid-shaft widths, proximal widths and distal widths of metacarpals and metatarsals III, using the equations of Scott (1990). These are the preferred estimators of Equus body mass due to their high accuracy in the mass estimation of modern zebras, and their commonness and abundance in the fossil record.
There is a significant negative correlation (r = −0.6, p = 0.0007) between mean body mass and mean mesowear score in the Plio-Pleistocene Equus species/populations, and a causal relationship between diet and body mass is indicated by the ranged major axis (RMA) regression results [R2 = 0.4, p-perm = 0.01, intercept = 936.896, slope angle = −209.0403, slope (degree) = −89.72591] (Figure 6). However, this is primarily driven by the largest body size class (body mass estimate of more than 550 kg), which includes populations that were mixed-feeders (E. suessenbornensis from Süssenborn and E. mosbachensis from Mosbach), or even browse-dominated feeders (E. major from Crag deposits of the Norfolk Coast of UK and E. mosbachensis from Schöningen, Germany, and Boxgrove, UK) (Figure 7). The earliest member of the genus Equus, the medium-sized Equus simplicidens from the Pliocene of North America, has a grazing mesowear signal (Figure 6 and Supplementary Table 2), exemplifying the original adaptation to grazing within this genus.
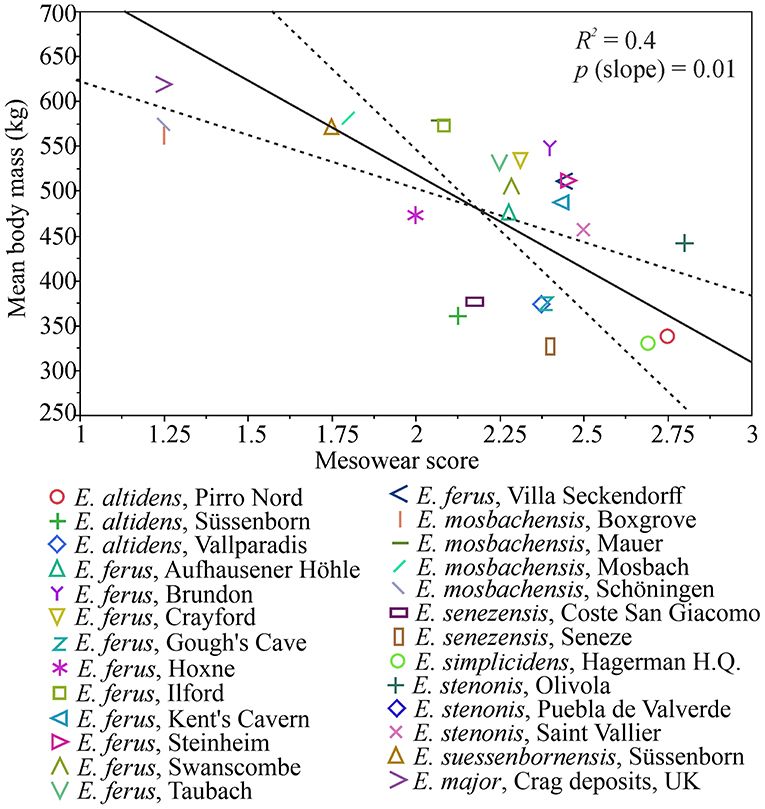
Figure 6. Ranged major axis (RMA) regression of mesowear and body mass in Pleistocene European Equus (and E. simplicidens). The regression line is drawn as a solid line and the dashed lines mark 95% confidence limits. There is a significant inverse relationship of body mass to increasingly grass-dominated mesowear, which is, however, driven by the very large, browsing species (see Figure 7). Increasing mesowear score indicates increase in the proportion of grass in diet (Saarinen et al., 2016).
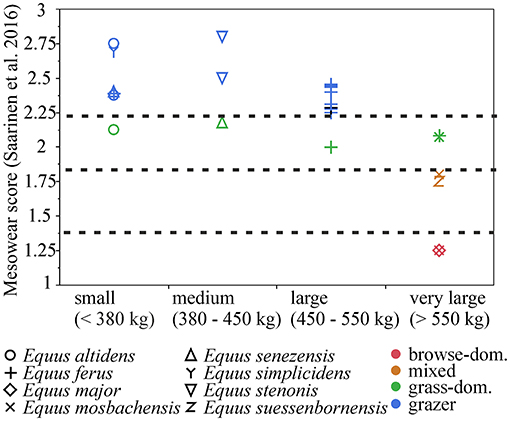
Figure 7. Mesowear scores (Saarinen et al., 2016) in body size classes of Pleistocene European Equus (and E. simplicidens). Browse-dominated and mixed-feeding diets are present only in the very large-sized species.
Small and large-sized Equus often occurred in quite heterogenous environments during the Pleistocene, even if large-sized species are mostly reported from localities where proxies indicate a relatively forested environment (Table 3). Our data indicates that when two species of Equus were sympatric, the smaller species had a more grass-dominated mesowear signal (Supplementary Table 2). In our present study, an example of this is Süssenborn, where the smaller species E. altidens had a grazing mesowear signal whereas the large species E. suessenbornensis had a mixed-feeding one, even including some high and sharp cusps indicating a significant component of browse in diet (Figure 6 and Supplementary Table 2).
Discussion
Body Mass Estimation in Extant Zebras—Hierarchy of the Best and Most Useful Post-cranial and Dental Correlates
Most of the dental measurement-based and post-cranial-based estimates provided body mass estimates that differed from the reported mean body mass by <25%. In general, several limb bone measurements yielded more accurate estimates than tooth measurements. However, this could be, at least in part, because the limb bone-based equations were developed for equids specifically, whereas the tooth-based equations (except for the M2 area of Alberdi et al., 1995) were composed for larger taxonomic groupings than just equids (perissodactyls and hyracoids, Janis, 1990), and for all selenodonts (Damuth and MacFadden, 1990). Among perissodactyls, rhinoceroses have relatively large teeth for their body size, whereas equids do not (and this also depends on where exactly the tooth crown length is measured). This could explain why the perissodactyls and hyracoids-equation seems to somewhat underestimate Equus body masses. However, the dental estimates given by the Janis (1990) equations for molar lengths are still reasonable, while the M2 surface area from Alberdi et al. (1995) does not provide consistent results (being fine for E. quagga, but overestimating the mass of E. grevyi). Our data also suggests a possible explanation for the generally smaller-than-reported mass estimates for E. grevyi. It is possible that the reported mean body mass of E. grevyi (385.8 kg in Kingdon and Hoffmann, 2013) is actually not the true average mass for this species, while the true average mass could in fact be closer to the 350 kg minimum reported mass, but this is difficult to evaluate due the lack of available details on the data on which the reported mean mass of 385.8 kg is based. However, the lengths of metapodials do provide mass estimates close to the reported 385.8 kg, whereas diameters of the long bones consistently give estimates around 350 kg. Thus, it seems possible that the 385.8 kg mean body mass reported by Kingdon and Hoffmann (2013) is based on shoulder height, but our data indicates that E. grevyi metapodials are longer and more slender than those of E. quagga (as reported by Bernor et al., 2019; Cirilli et al., 2020b), resulting in a tall but slender body build. This lends more support for our suggestion to use long bone diameters rather than lengths for body mass estimation.
We provide here a Log10 ratio analysis of mean MC3 measurements and MT3 measurements (Figure 8) for E. quagga and E. grevyi. These graphics further demonstrate the bias in using Equus MC3 and MT3 lengths—they are not directly related to the other measurements or body mass in species of Equus.
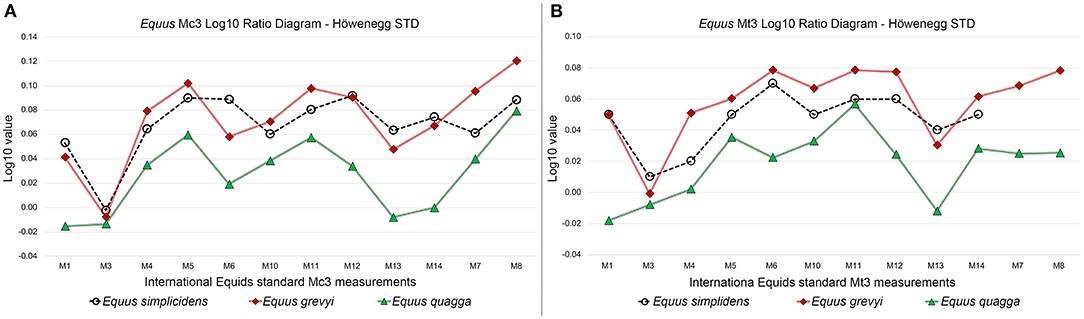
Figure 8. Third metacarpal (A) and third metatarsal (B) Log10 Ratio diagrams of selected measurements in Equus simplicidens, E. grevyi, and E. quagga. The Late Miocene Hippotherium primigenium form Höwenegg (Germany) is used as standard.
Based on these results, and the relative abundance of metapodials and molars in the fossil record, we suggest the following hierarchy of measurements to be used primarily in equid body mass estimation:
1. Minimum mid-shaft width, maximum proximal width and maximum distal width of 3rd metacarpals
2. Minimum mid-shaft width, maximum proximal width and maximum distal width of 3rd metatarsals
3. Upper and lower 1st molar lengths
4. Upper and lower 2nd molar lengths.
Body Size and Diet of Equus in the Pleistocene of Europe
While most of the Pleistocene European Equus species/populations had grazing dietary signals, there is a notable difference in the species/populations of very large body size, which occasionally have mixed-feeding and even browse-dominated dietary signals. This seems to be in contrast with many other ungulate groups, most notably ruminants, in which larger sizes tend to be on average associated with grazing diets and open environments (see e.g., Jarman, 1974; Saarinen, 2014; Saarinen et al., 2016).
The tendency of the largest-sized Equus having more browse-dominated diets than smaller species and populations of Equus is clear, but what explains this remains more elusive and calls for further investigation. Several abiotic and biotic factors can affect body size and diet in ungulates. It has been suggested that fertile soils produced by glacial erosion and strong seasonality of the Pleistocene climate reduced plant defense mechanisms and led to seasonally high-productive and high-quality plant communities that facilitated the growth of large body size in Pleistocene ungulates (Geist, 1998; Guthrie, 2001). On the other hand, large size is beneficial in environments that have a seasonal shortage of dietary resources (see Lindstedt and Boyce, 1985). Such seasonal variation between abundant, high-quality resources and scarcity of resources would have facilitated the evolution of large size in Pleistocene Equus, but it does not explain the small size in the grazing species/populations. One possibility is that the smaller body size of grazing Equus is due to poorer nutritional quality of their diet compared to a more diverse mixed-feeding diet of the larger morphotypes of Equus, but this does not seem likely as grasses have relatively high nutritional value especially in high-latitudes (Barbehenn et al., 2004; Codron et al., 2007). Other factors affecting food availability and body size of individuals that are related to dietary variation between populations, thus have to be considered. Van Asperen (2010) suggested that small size in some cool-stage Equus species/populations is associated with harsh periglacial environments where resource quality was poor, especially in the populations from MIS 6 glacial stage in UK. However, as Van Asperen (2010), Saarinen et al. (2016), and Boulbes and van Asperen (2019) acknowledge, poor nutritional quality is not a general feature of glacial-stage cool steppe environments. In fact, it has been suggested that the cool “mammoth-steppe” environments were seasonally productive environments (Zimov et al., 1995; Geist, 1998). Furthermore, as Saarinen et al. (2016) and Boulbes and van Asperen (2019) noted, small-sized Equus ferus are not only associated with cool stages, but sometimes also relatively warm but open environments. Extending the data to cover the Early and Middle Pleistocene stenonine horses further suggests that species of Equus were present in a wide range of environments from relatively forested to open grasslands, but while the large browse-dominated species tend to be on average associated with more forested paleoenvironments (Table 3). Moreover, both small-sized and large-sized species co-occur (e.g., E. altidens and E. suessenbornensis), and when they do, the large-sized species tend to have significantly more browse-dominated diets.
Saarinen et al. (2016) suggested that the body size patterns in Equus reflect differences in population density and its impact on individual resource use through intraspecific (or in some cases perhaps interspecific) competition. As a general pattern among terrestrial mammals, population densities decrease and habitat areas increase with increasing body size (Peters, 1983), but habitat heterogeneity, sociality of the species and resource quality and availability are all factors that affect body size within genera and species (Jarman, 1974; McNab, 2010; Saarinen, 2014; Saarinen et al., 2016). There are examples of density-dependent body size patterns among extant ungulate populations, which are related to gregarious species having relatively small group sizes in heterogenous, relatively closed environments. As examples, forest reindeer and forest bison have smaller groups sizes, smaller population densities and larger individual body sizes than tundra reindeer and prairie bison (Nieminen and Helle, 1980; Meagher, 1986; Rankama and Ukkonen, 2001). Density-dependent limitation of resource availability per individual has been documented for extant populations of feral donkeys (Choquenot, 1991), roe deer (Töigo et al., 2006), reindeer (Skogland, 1983; Kojola et al., 2004), and white-tailed deer (Wolverton et al., 2009). Saarinen et al. (2016) found opposite effects of habitat openness on the body size of gregarious ungulates that form large herds in open environments, such as Equus (smaller size in more open environments), and ungulates that retain relatively low population densities in open environments such as Cervus elaphus and rhinoceroses (larger size in more open environments) in the Pleistocene of Europe. This difference could be explained by the limiting factor of large group sizes on individual resource availability in open-adapted, gregarious species such as Equus.
Smaller group sizes and population densities could at least partly explain the large body size of Equus in heterogenous wooded environments as opposed to open grasslands where larger group sizes and densities of the grazing-adapted Equus are more likely to be a limiting factor for body size. For this hypothesis to hold, the browsing, large-bodied species of Equus should have had smaller populations than the grazing, small-bodied species in localities where these coexisted. There is some tentative evidence in the fossil record that this is indeed the case: both in Senéze and in Süssenborn, fossils of the large-sized species (E. major and E. suessenbornensis, respectively) are less abundant than the fossils of the small-sized species (E. senezensis and E. altidens, respectively). An analogous population pattern is also represented from the Early Pleistocene localities of Dmanisi (Georgia) and Pirro Nord (Italy). The ongoing studies on the Dmanisi horse sample, under study by Bernor and Cirilli, have revealed that the fossil specimens of the medium-slender species Equus aff. E. altidens are more abundant than the larger E. stenonis. This evidence has been also noted by Vekua (1995). Furthermore, in Pirro Nord, E. altidens is more common than the larger E. suessenbornensis (Alberdi and Palombo, 2013).
Furthermore, the relationship of body size and social behavior can be seen extant zebras, Equus grevyi and Equus quagga, which sometimes overlap geographically while showing different social adaptations. The larger E. grevyi is typically not social, with females forming temporary grazing groups (Klingel, 1974; Moehlman et al., 2008; Rubenstein, 2010; Kebede, 2013). In contrast, the medium size E. quagga is a highly social species, with a hierarchical harem structure of the groups, which can reach several hundred individuals in number (Rubenstein, 2010; Klingel, 2013). As reported above, when two species occur sympatrically in the fossil record, the smallest species seems to be more abundant. The eventual presence of a species in the fossil record is affected by multiple taphonomic phenomena. Nonetheless, the available evidence of relative abundances indicates that similar social behaviors shown by extant zebras are present also in the fossil record, with a highly social population structure of medium-size Equus species than in large-sized species. However, further evidence on the relative abundances and possible taphonomic biases in the fossil record of Equus are needed to further confirm this.
The decrease of body size in Equus ferus during the Late Pleistocene into the Holocene has been noted and discussed by several authors before. In our data, this phenomenon is seen as a dramatic drop in Equus ferus body mass during the last 100 kyrs, especially toward the end of the last glacial ca. 20 ka (see Figure 1). Both Forstén (1991) and Guthrie (2003) related this decreasing size trend to the increased harshness of the environmental conditions and frequent shifts in resource availability. Boulbes and van Asperen (2019) related the size variation within Equus during the Middle and Late Pleistocene principally to shifts in productivity of the vegetation and resource availability, but also acknowledged that low population densities could have enabled large body sizes in some of the interglacial populations. Saarinen (2014) and Saarinen et al. (2016) reached similar conclusions, noting that resource quality and availability was the main driver of body size variation in Equus and other Pleistocene ungulates in Europe. Vegetation structure, population densities and resource competition were the most important factors affecting resource availability per individual.
Here, we have shown that dietary composition is systematically related to body size in Equus. We suggest that large-sized, mixed-feeding ecomorphs of Equus favored relatively closed habitats and occurred in smaller population densities than small and medium -sized, grazing ecomorphs (also in environments where small- and large-sized species of Equus coexisted).
Conclusions
Best Practices for Body Mass Estimation of Equids Based on Statistical Tests Using Modern Zebras
Most metapodial measurements provide body mass estimates that fit in the body mass range of wild equids, differing from the reported mean masses by <25%. Moreover, metacarpal measurements provide somewhat more consistent mass estimates than metatarsal measurements for Equus quagga. The estimates based on metapodial lengths and metapodial diameters differ in E. grevyi, with the diameters giving estimates between 300 and 350 kg, while the lengths give mass estimates closer to 400 kg, while in E. quagga, the difference between length-based and diameter-based mass estimates is negligible. We have documented that E. grevyi bones are relatively long and slender, and diameter rather than lengths of long bones should be used for mass estimation for consistency. While other post-cranial elements offer as accurate body mass estimates as metapodials, the relative greater abundance of metapodials in the fossil record further support their priority in the body mass estimation.
Of the dental predictors of body mass, lower and upper first molar lengths provided estimates that were closer to the reported mean masses of E. quagga and E. grevyi.
Body Mass and Diet of Pleistocene Equus in Europe
We discovered that large body size in Equus was associated with mixed-feeding and browse-dominated diets in the Pleistocene of Europe, and particularly large-sized Equus were mostly associated with relatively wooded palaeoenvironments, whereas small-sized Equus were mostly associated with open environments. This pattern is based on metapodial estimates for body mass and mesowear, which are among the most robust signals of body mass and proportion of grass in diet, respectively, despite their respective error limits. In localities where small and large species of Equus co-occurred, the larger species were less abundant and had more browse-dominated diets than the small species. Resource quality and availability per individual are the main factors that affected body size of Equus and other large ungulates during the Pleistocene. We suggest that the body size patterns we observed for Equus are best explained by a combined effect of available vegetation and population density on resource availability per individual, with the large species having lower population densities, occurring in more heterogenous wooded habitats and having more browse-dominated diets than the smaller species, for which high population densities in open habitats would have been a factor limiting individual body size.
Data Availability Statement
The original contributions presented in the study are included in the article/Supplementary Material, further inquiries can be directed to the corresponding author/s.
Author Contributions
JS: main role in formulating the research idea, significant contribution to data collection, main role in preparing data analyses and figures, and writing the manuscript. OC: significant contribution to data collection, writing the manuscript, discussing the evolutionary history of Equus, and preparing Figure 8 and associated analysis. FS: significant contribution to data collection and writing the manuscript. KM: significant contributions to data collection and management, and discussing the conclusions. RB: significant contributions for database organization, maintenance and acquisition of data, contributions to the research idea, writing the manuscript, and discussing the evolutionary history of Equus. All authors contributed to the article and approved the submitted version.
Funding
RB wishes to acknowledge research funding by NSF EAR grants 8806645, 0125009, 1113175, and 1558586; DBI grant 1759882 for the FuTRES database and support from the Smithsonian Human Origins Program and University of Florence for a Visiting Professorship in 2017 and 2018. This was FuTRES publication number 21. JS was working in the University of Helsinki in an Academy of Finland and University of Helsinki—funded post-doctoral research project Behavioral and morphological adaptation to environmental change: the example of African Neogene to Quaternary Proboscidea (Academy of Finland no: 315691) during this work. OC thanks the financial support of the University of Pisa Ph.D. program, and University of Florence (Fondi di Ateneo).
Conflict of Interest
The authors declare that the research was conducted in the absence of any commercial or financial relationships that could be construed as a potential conflict of interest.
Acknowledgments
For access to fossil and extant equid collections, JS thanks P. Brewer (NHM London), R. Ziegler (Staatliches Museum für Naturkunde, Stuttgart), B. Chandler and C. Jones (Torquay Museum), D. Schreiber (Staatliches Museum für Naturkunde Karlsruhe), M. Blume and O. Sandrock (Hessisches Landesmuseum Darmstadt), A. Ainsworth (Ipswich Museum), L. Neep and P. Shepherd (British Geological Survey, Nottingham) and R.-D. Kahlke (Quaternary Palaeontology Institute, Weimar); and OC thanks E. Cioppi and L. Bellucci (Museo di Storia Naturale dell'Università degli Studi di Firenze, sezione di Geologia e Paleontologia), E. Robert (Université Claude Bernard – 1) and D. Berthet (Museé des Confluences) from Lyon, M. Bukhsianidze (S. Janashia Museum of Georgia, Georgian National Museum, Tbilisi, Georgia) and the Smithsonian Institution. We sincerely thank the reviewers T. Faith and M.F.G. Weinkauf and the editor M. Laurin for their constructive comments which helped us improve this manuscript.
Supplementary Material
The Supplementary Material for this article can be found online at: https://www.frontiersin.org/articles/10.3389/fevo.2021.622412/full#supplementary-material
Supplementary Figure 1. Ninety-five percent probability ellipse for bivariate normal distribution of the Pleistocene Equus body mass and mesowear score (Saarinen et al., 2016) data.
Supplementary Table 1. Skeletal and dental measurements of extant zebras used in this study, and corresponding body mass estimates. Measurement codes of Janis (1990), Scott (1990), and Alberdi et al. (1995) are provided, with description of each measurement. Body mass estimates are provided for each measurement based on the equation indicated in the “Measurement codes” -column.
Supplementary Table 2. Body mass estimates and mesowear of Pleistocene European Equus paleopopulations. The table “Species-Age” provides mean body mass estimates and mesowear of the Equus paleopopulations with the information of localities and their stratigraphic ages. The table “Specimen” lists body mass estimates for each Equus specimen based on metapodial measurements (Scott, 1990).
References
Alberdi, M. T., Cerdeño, E., López-Martínez, N., Morales, J., and Soria, M. D. (1997). La fauna villafranquiense de El Rincon-1 (Albacete, Castilla – La Mancha). Estudios Geologicos 53, 69–93. doi: 10.3989/egeol.97531-2248
Alberdi, M. T., Ortiz Jaureguizar, E., and Prado, J. L. (1998). A quantitative review of European stenonoid horses: J. Paleontol. 72, 371–387. doi: 10.1017/S0022336000036350
Alberdi, M. T., and Palombo, M. R. (2013). The late Early to early Middle Pleistocene stenonoid horses from Italy. Q. Int. 288, 25–44. doi: 10.1016/j.quaint.2011.12.005
Alberdi, M. T., Prado, J. L., and Ortiz-Jaureguizar, E. (1995). Patterns of body size changes in fossil and living Equini (Perissodactyla). Biol. J. Linnean Soc. 54, 349–370. doi: 10.1111/j.1095-8312.1995.tb01042.x
Aouadi, N. (1999). Etude préliminaire des restes craniens de chevaux villafranchies (Ceyssaguet, Haute-Loire). Bull. Mus. Anthropol. Préhist. Monaco 40, 23–42.
Aouadi, N., and Bonifay, M. F. (2008). Les métapodes des chevaux de Ceyssaguet: études morphologique et biométrique. Bull. Musée d'Anthropol. Préhistorique Monaco 48, 17–29.
Argant, J. (2004). Le gisement pliocène final de Saint-Vallier (Drôme, France): palynologie. The late pliocene site of Saint-Vallier (Drôme, France): pollen analysis. Geobios 37, 81–90. doi: 10.1016/S0016-6995(04)80008-1
Azzaroli, A. (1964). The two Villafranchian horses of the Upper Valdarno. Palaeontogr. Ital. 59, 1–12.
Azzaroli, A. (1983). Quaternary mammals and the “end-Villafranchian” dispersal event. A turning point in the history of Eurasia. Palaeogeogr. Palaeoclimatol. Palaeoecol. 44, 117–139. doi: 10.1016/0031-0182(83)90008-1
Azzaroli, A. (1992). Ascent and decline of monodactyl equids: a case for prehistoric overkill. Ann. Zool. Fenn. 28, 151–163.
Azzaroli, A. (2000). On Equus livenzovensis Bajgusheva 1978 and the “stenonid” lineage of equids. Palaeontogr. Ital. 87, 1–17.
Azzaroli, A., and Voorhies, M. R. (1993). The genus Equus in North America. The Blancan species. Palaeontogr. Ital. 80, 175–198.
Bajgusheava, V. S. (1978). Krupnaja Loshad Khaprovskogo Kompleksa is alluvija SeveroVostochnoto Priazovija. Invesija Servo-Kavkazkogo Nauchnogo Zentra Vychei Shkoly 1, 98–92. (in Russian).
Barbehenn, R. V., Chen, Z., Karowe, D. N., and Spickard, A. (2004). C3 grasses have higher nutritional quality than C4 grasses under ambient and elevated atmospheric CO2. Global Change Biol. 10, 1565–1575. doi: 10.1111/j.1365-2486.2004.00833.x
Barrón-Ortiz, C. I., Avilla, L. S., Jass, C. N., Bravo-Cuevas, V. M., Machado, H., and Mothé, D. (2019). What is Equus? Reconciling taxonomy and phylogenetic analyses. Front. Ecol. Evol. 7:343. doi: 10.3389/fevo.2019.00343
Bernor, R. L., Cirilli, O., Jukar, A. M., Potts, R., Buskianidze, M., and Rook, L. (2019). Evolution of Early Equus in Italy, Georgia, the Indian Subcontinent, East Africa, and the origins of African Zebras. Front. Ecol. Evol. 7:166. doi: 10.3389/fevo.2019.00166
Bernor, R. L., Cirilli, O., Wang, S. Q., and Rook, L. (2018). Equus cf. livenzovenzis from Montopoli, Italy (early Pleistocene; MN16b; ca. 2.6 Ma). Boll. Soc. Paleontol. Ital. 57, 203–216. doi: 10.4435/BSPI.2018.13
Bernor, R. L., Tobien, H., Hayek, L. A. C., and Mittmann, H. W. (1997). Hippotherium primigenium (Equidae, Mammalia) from the late Miocene of Höwenegg (Hegau, Germany). Andrias 10, 1–230.
Blain, H.-A., Fagoaga, A., Ruiz-Sánchez, F. J., Bispal-Chinesta, J. F., and Delfino, M. (2019). Latest Villafranchian climate and landscape reconstructions at Pirro Nord (southern Italy). Geology 47, 829–832. doi: 10.1130/G46392.1
Boulbes, N., and van Asperen, E. N. (2019). Biostratigraphy and Palaeoecology of European Equus. Front. Ecol.Evol. 7:301. doi: 10.3389/fevo.2019.00301
Brown, J. H., Gillooly, J. F., Allen, A. P., Savage, V. M., and West, G. B. (2004). Toward a metabolic theory of ecology. Ecology 85, 1771–1789. doi: 10.1890/03-9000
Campbell, J. B. (1977). The Upper Palaeolithic of Britain: A Study of Man and Nature in the Late Ice Age. Oxford: Clarendon Press.
Cantalapiedra, J. L., Prado, J. L., Fernandez, M. H., and Alberdi, M.T. (2017). Decoupled ecomorphological evolution and diversification in Neogene-Quaternary horses. Science 355, 627–630. doi: 10.1126/science.aag1772
Choquenot, D. (1991). Density-dependent growth, body condition, and demography in feral donkeys: testing the food hypothesis. Ecology 72, 805–813. doi: 10.2307/1940583
Cirilli, O., Bernor, R. L., and Rook, L. (2020a). New insights on the Early Pleistocene equids from Roca-Neyra (France, central Europe); implications for the Hipparion LAD and the Equus FAD in Europe. J. Paleontol. 1–20. doi: 10.1017/jpa.2020.99
Cirilli, O., Pandolfi, L., and Bernor, R. L. (2020b). The Villafranchian perissodactyls of Italy: knowledge of the fossil record and future research perspectives: Geobios 63, 1–21. doi: 10.1016/j.geobios.2020.09.001
Codron, D., Lee-Thorp, J. A., Sponheimer, M., and Codron, J. (2007). Nutritional content of savanna plant foods: implications for browser/grazer models of ungulate diversification. Eur. J. Wildl. Res.53, 100–111. doi: 10.1007/s10344-006-0071-1
Damuth, J. D., and MacFadden, B. J. (1990). Body Size in Mammalian Paleobiology: Estimation and Biological Implications. New York, NY: Cambridge University Press.
Eisenmann, V. (2004a). Les équidés (Mammalia, Perissodactyla) de Saint-Vallier (Drôme, France) et les équidés plio-pléistocènes d'Europe. Geobios 37, 279–305. doi: 10.1016/S0016-6995(04)80019-6
Eisenmann, V. (2004b). “Equus: an evolution without lineages?,” in 18th International Senckenberg Conference (Weimar).
Eisenmann, V., Alberdi, M. T., de Giuli, C., and Staesche, U. (1988). “Studying Fossil Horses. Volume I – Methodology,” in Collected Papers After the New York International Hipparion Conference 1981, eds M. O. Woodburne and P. Y. Sondaar (Leiden: Brill Press), 1–71.
Eisenmann, V., and Baylac, M. (2000). Extant and fossil Equus (Mammalia, Perissodactyla) skulls: a morphometric definition of the genus Equus. Zool. Scr. 29, 89–100. doi: 10.1046/j.1463-6409.2000.00034.x
Eisenmann, V., and Boulbes, N. (2020). “New results on equids form the Early Pleistocene site of Untermassfeld”, in The Pleistocene of Untermassfeld near Meiningen, ed. R. D. Kalke (Thüringen: Monograph des Romisch-Germanisches Zentralmuseum), 1295–1320.
Eisenmann, V., and Deng, T. (2005). Equus qingyangensis (Equidae, Perissodactyla) of the upper Pliocne of Bajiazui, China: evidence for North American origin of an Old World lineage distinct from E. stenonis. Quaternaire 2, 113–122.
Forstén, A. (1991). Size decrease in Pleistocene-Holocene true or caballoid horses of Europe. Mammalia 55, 408–419. doi: 10.1515/mamm.1991.55.3.407
Forsten, A. (1998). The fossil horses (Equidae, Mammalia) from the Plio-Pleistocene of Liventsovka near Rostov-Don, Russia. Geobios 31, 645–657. doi: 10.1016/S0016-6995(98)80052-1
Fortelius, M., and Solounias, N. (2000). Functional characterization of ungulate molars using the abrasion-attrition wear gradient: a new method for reconstructing paleodiets. Am. Museum Novitates 3301, 1–36. doi: 10.1206/0003-0082(2000)301<0001:FCOUMU>2.0.CO;2
Gazin, C.L. (1936). A study of the fossil horse remains from the Upper Pliocene of Idaho. Proc. U.S. Natl. Museum 83, 281–320.
Geist, V. (1998). Deer of the World – Their Evolution, Behaviour, and Ecology. Mechanicsburg, PA: Stackpole Books.
Gromova, V. I. (1949). Istorija loshadej (roda Equus) v Starom Svete. Casty 1-2. Trudy paleont. Inst. Akad. Nauk 17, 1–374.
Guérin, C. (1990). “Biozones or mammal units? Methods and limits in biochronology,” in European Neogene Mammal Chronology, eds E. H. Lindsay, V. Fahlbusch, and P. Mein (New York, NY: Plenum Press), 119–130. doi: 10.1007/978-1-4899-2513-8_8
Guthrie, D. R. (2001). Origin and causes of the mammoth steppe: a story of cloud cover, woolly mammal tooth pits, buckles, and inside-out Beringia. Q. Sci. Rev. 20, 549–574. doi: 10.1016/S0277-3791(00)00099-8
Guthrie, R. D. (2003). Rapid body size decline in Alaskan Pleistocene horses before extinction. Nature 426, 169–171. doi: 10.1038/nature02098
Hissa, R., Hohtola, E., Tuomala-Saramäki, T., Laine, T., and Kallio, H. (1998). Seasonal changes in fatty acids and leptin contents in the plasma of the European brown bear (Ursus arctos arctos). Annales Zoologici Fennici 35, 215–224.
Janis, C. M. (1990). “Correlation of cranial and dental variables with body size in ungulates and macropodoids,” in Body Size in Mammalian Palaeobiology – Estimation and Biological Implications, eds J. Damuth and B. J. MacFadden (New York, NY: Cambridge University Press), 255–299.
Jarman, P. J. (1974). The social organisation of antelope in relation to their ecology. Behaviour 48, 215–267. doi: 10.1163/156853974X00345
Kebede, F. (2013). Ecology and Community-Based Conservation of Grevy's Zebra (Equus grevyi) and African Wild ass (Equus africanus) in the Afar Region. Addis Ababa: University of Addis Ababa.
Kingdon, J., and Hoffmann, M. (2013). Mammals of Africa, Volume V, Carnivores, Pangolins, Equids and Rhinoceroses. London: Bloomsbury.
Klingel, H. (1974). Social Organization and behaviour of the Grévy's zebra. Z. Tierpsychol. 36, 36–70,
Klingel, H. (2013). “Equus quagga, plains zebra (common zebra),” in Kingdon Mammals of Africa: Carnivores, Pangolins, Equids, and Rhinoceroses, ed. J. Hoffman (London: Bloomsbury), 428–437.
Kojola, I., Huitu, O., Toppinen, K., Heikura, K., Heikkinen, S., and Ronkainen, S. (2004). Predation on European wild forest reindeer (Rangifer tarandus) by wolves (Canis lupus) in Finland. J. Zool. 263, 229–235. doi: 10.1017/S0952836904005084
Koufos, G. D., Kostopoulos, D. S., and Sylvestrou, I. A. (1997). Equus apolloniensis n. sp. (Mammalia, Equidae) from the latest Villafranchian locality of Apollonia, Macedonia, Greece. Paleontologia i Evolucio 30–31, 49–76.
Kretzoi, M. (1938). Die Raubtiere von Gombaszög nebst einer Übersicht der Gesamtfauna. (Ein Beitrag zur Stratigraphie des Altquartaers). Annal. Musei Nat. Hungarici 31, 88–157.
Legendre, P., and Legendre, L. (2012). Numerical Ecology. 3rd Edn, Developments in Environmental Modelling, Vol. 24. Amsterdam; Oxford: Elsevier.
Leroi-Gourhan, A. (1986). Pollen analysis of sediment samples from Gough's Cave, Cheddar. Proc. Univers. Bristol Spelaeol. Soc. 17, 141–144.
Lindsay, E. H., Opdyke, N. D., and Johnson, N. M. (1980). Pliocene dispersal of the horse Equus and late Cenozoic mammal dispersal events. Nature 287, 135–138. doi: 10.1038/287135a0
Lindstedt, S. L., and Boyce, M. S. (1985). Seasonality, fasting endurance, and body size in mammals. American Naturalist 125, 873–878. doi: 10.1086/284385
Lozano-Fernández, I., López-García, J. L., Aurell-Garrido, J., Alba, D. M., and Madurell-Malapeira, J. (2015). Data review on the small mammals from the late early pleistocene of Vallparadís Estació layer EVT7 (Vallés-Penedès Basin, NE Iberian Peninsula): biochronological and palaeoenvironmental implications. Q. Int. 389, 159–166. doi: 10.1016/j.quaint.2015.01.011
MacFadden, B. J., and Hulbert, R. C. Jr. (1990). “Body size estimates and size distribution of ungulate mammals from the late Miocene Love Bone Bed of Florida,” in Body Size in Mammalian Paleobiology: Estimation and Biological Implications, eds. J. Damuth and B. J. MacFadden (New York, NY: Cambridge University Press), 337–363.
McNab, B. K. (2010). Geographic and temporal correlations of mammalian size reconsidered: a resource rule. Oecologia 164, 13–23. doi: 10.1007/s00442-010-1621-5
Mein, P. (1999). “European Miocene mammal biochronology”, in The Miocene land mammals of Europe, eds G. E. Rössner, and K. Heissig (München: Verlag Dr. Friedrich Pfeil), 25–38.
Moehlman, P. D., Rubenstein, D. I., and Kebede, F. (2008). Equus grevyi. IUCN Red List of Threatened Species. Version 2009.2. Available online at: www.iucnredlist.org (accessed Febuary 15, 2021).
Musil, R. (2001). “Die equiden-reste aus dem Unterpleistozän von Untermaßfeld,” in Das Pleistozän von Untermassfeld bei Meiningen (Thüringen). Teil 2. Monographien des Römisch-Germanischen Zentralmuseums Mainz 40, ed R. D. Kahlke (Bonn: Dr. Rudolf Habelt), 557–587.
Nieminen, M., and Helle, T. (1980). Variations in body measurements of wild and semi-domestic reindeer (Rangifer tarandus) in Fennoscandia. Ann. Zoolo. Fennici 17, 275–283.
Nowak, R. M. (1999). Walker's Mammals of the World, Vol. 1, 6th Edn. Baltimore, MD: Johns Hopkins University Press.
Orlando, L., Ginolhac, A., Zhang, G., Froese, D., Albrechtsen, A., Stiller, M., et al. (2013). Recalibrating Equus evolution using the genome sequence of an early Middle Pleistocene horse. Nature 499, 74–78. doi: 10.1038/nature12323
Palombo, M. R., and Alberdi, M. T. (2017). Light and shadows in the evolution of South European stenonoid horses. Fossil Imprint 73, 115–140. doi: 10.2478/if-2017-0006
Peters, R. H. (1983). The Ecological Implications of Body Size. Cambridge: Cambridge University Press.
Rankama, T., and Ukkonen, P. (2001). On the early history of the wild reindeer (Rangifer tarandus L.) in Finland. Boreas 30, 131–147. doi: 10.1080/713782821
Rivals, F., and Athanassiou, A. (2008). Dietary adaptations in an ungulate community from the late Pliocene of Greece. Palaeogeogr. Palaeoclimatol. Palaeoecol. 265, 134–139. doi: 10.1016/j.palaeo.2008.05.001
Roberts, M. B. (1986). Excavation of the Lower Paleolithic site at Amey's Eartham Pit, Boxgrove, West Sussex: a preliminary report. Proc. Prehistoric Soc. 52, 215–245. doi: 10.1017/S0079497X00006666
Rook, L., Bernor, R. L., Avilla, L. D., Cirilli, O., Flynn, L., Jukar, A. M., et al. (2019). Mammal biochronology (Land Mammal Ages) around the World from the Late Miocene to Middle Pleistocene and major events in Horse evolutionary history. Front. Ecol. Evol. 7:278. doi: 10.3389/fevo.2019.00278
Rubenstein, D. I. (2010). “Ecology, social behavior, and conservation in zebras,” in Advances in the Study Behavior: Behavioral Ecology of Tropical Animals, ed R. Macedo (Oxford: Elsevier Press), 231–258. doi: 10.1016/S0065-3454(10)42007-0
Saarinen, J. (2014). Ecometrics of large herbivorous land mammals in relation to climatic and environmental changes during the Pleistocene (PhD thesis). Department of Geosciences and Geography, University of Helsinki. Retrieved from: http://urn.fi/URN:ISBN:978-952-10-9468-2
Saarinen, J., Eronen, J., Fortelius, M., Seppä, H., and Lister, A. M. (2016). Patterns of diet and body mass of large ungulates from the Pleistocene of Western Europe, and their relation to vegetation. Palaeontol. Electr. 19, 1–58. doi: 10.26879/443
Scott, K. M. (1990). “Postcranial dimensions of ungulates as predictors of body mass,” in Body Size in Mammalian Palaeobiology – Estimation and Biological Implications, eds J. Damuth and B. J. MacFadden (New York, NHY: Cambridge University Press), 301–355.
Skinner, M. P., and Hibbard, C. W. (1972). Early Pleistocene pre-glacial and glacial rocks and faunas of north-central Nebraska. B. Am. Mus. Nat. Hist. 148, 1–148.
Skogland, T. (1983). The effects of density dependent resource limitation on size of wild reindeer. Oecologia 60, 156–168. doi: 10.1007/BF00379517
Strani, F. (2020). Impact of Early and Middle Pleistocene major climatic events on the palaeoecology of Southern European ungulates. Hist. Biol. 1–16. doi: 10.1080/08912963.2020.1782898
Strani, F., DeMiguel, D., Alba, D., Moyà-Solà, S., Bellucci, L., Sardella, R., et al. (2019a). The effects of the “0.9Ma event” on the Mediterranean ecosystems during the Early-Middle Pleistocene transition as revealed by dental wear patterns of fossil ungulates. Quat. Sci. Rev. 210, 80–89. doi: 10.1016/j.quascirev.2019.02.027
Strani, F., DeMiguel, D., Bellucci, L., and Sardella, R. (2018). Dietary response of early Pleistocene ungulate communities to the climate oscillations of the Gelasian/Calabrian transition in Central Italy. Palaeogeogr. Palaeoclimatol. Palaeoecol. 499, 102–111. doi: 10.1016/j.palaeo.2018.03.021
Strani, F., DeMiguel, D., Sardella, R., and Bellucci, L. (2015). Paleoenvironments and climatic changes in the Italian Peninsula during the Early Pleistocene: evidence from dental wear patterns of the ungulate community of Coste San Giacomo. Quat. Sci. Rev. 121, 28–35. doi: 10.1016/j.quascirev.2015.05.008
Strani, F., Pushkina, D., Bocherens, H., Bellucci, L., Sardella, R., and DeMiguel, D. (2019b). Dietary Adaptations of Early and Middle Pleistocene Equids From the Anagni Basin (Frosinone, Central Italy). Front. Ecol. Evol. 7. doi: 10.3389/fevo.2019.00176
Töigo, C., Gaillard, J.-M., Van Laere, G., Hewison, M., and Morellet, N. (2006). How does environmental variation influence body mass, body size, and body condition? Roe deer as a case study. Ecography 29, 301–308. doi: 10.1111/j.2006.0906-7590.04394.x
Urban, B. (1992). “Die Rolle der Quartärbotanik und ihre Bedeutung für die Fundstelle des Homo erectus heidelbergensis von Mauer,” in Schichten von Mauer – 85 Jahre Homo erectus heidelbergensis, eds K. W. Beinhauer, and G. A. Wagner (Mannheim: Edition Braus), 111–119.
Urban, B., and Bigga, G. (2015). Environmental reconstruction and biostratigraphy of late Middle Pleistocene lakeshore deposits at Schöningen. J. Hum. Evol. 89, 57–70. doi: 10.1016/j.jhevol.2015.10.002
Van Asperen, E. N. (2010). Ecomorphological adaptations to climate and substrate in the Middle Pleistocene caballoid horses. Palaeogeogr. Palaeoclimatol. Palaeoecol. 297, 584–596. doi: 10.1016/j.palaeo.2010.09.007
Vekua, A. (1995). Die Wirbeltierfauna des Villafranchium von Dmanisi und ihre biostratigraphische Bedeutung. Jahrbuch des Römisch-Germanischens Zentralmuseum 42, 77–180.
Vilstrup, J. T., Seguin-Orlando, A., Stiller, M., Ginolhac, A., Raghavan, M., Nielsen, S. C. A., et al. (2013). Mitochondrial Phylogenomics of Modern and Ancient Equids. PLoS ONE 8:e55950. doi: 10.1371/journal.pone.0055950
West, R. G., Lambert, C. A., Sparks, B. W., and Dickson, J. H. (1964). Interglacial deposits at Ilford, Essex. Philos. Trans. R. Soc. B 247, 185–212. doi: 10.1098/rstb.1964.0002
Wolverton, S., Huston, M. A., Kennedy, J. H., Cagle, K., and Cornelius, J. D. (2009). Conformation to Bergmann's Rule in white-tailed deer can be explained by food availability. Am. Midland Naturalist 162, 403–417. doi: 10.1674/0003-0031-162.2.403
Zalasiewicz, J. A., Mathers, S. J., Hughesm, M. J., Gibbard, P. L., Peglar, S. M., Harlandm, R., et al. (1988). Stratigraphy and Palaeoenvironments of the Red Crag and Norwich Crag Formations between Aldeburgh and Sizewell, Suffolk, England. Philos. Trans. R. Soc. Lond. Ser. B 322, 221–272. doi: 10.1098/rstb.1988.0125
Keywords: Equus, body size, mesowear, vegetation, sociality, population density, resource availability, Pleistocene
Citation: Saarinen J, Cirilli O, Strani F, Meshida K and Bernor RL (2021) Testing Equid Body Mass Estimate Equations on Modern Zebras—With Implications to Understanding the Relationship of Body Size, Diet, and Habitats of Equus in the Pleistocene of Europe. Front. Ecol. Evol. 9:622412. doi: 10.3389/fevo.2021.622412
Received: 28 October 2020; Accepted: 04 February 2021;
Published: 26 February 2021.
Edited by:
Michel Laurin, UMR7207 Centre de recherche sur la paléobiodiversité et les paléoenvironnements (CR2P), FranceReviewed by:
Tyler Faith, The University of Utah, United StatesManuel F. G. Weinkauf, Charles University, Czechia
Copyright © 2021 Saarinen, Cirilli, Strani, Meshida and Bernor. This is an open-access article distributed under the terms of the Creative Commons Attribution License (CC BY). The use, distribution or reproduction in other forums is permitted, provided the original author(s) and the copyright owner(s) are credited and that the original publication in this journal is cited, in accordance with accepted academic practice. No use, distribution or reproduction is permitted which does not comply with these terms.
*Correspondence: Juha Saarinen, anVoYS5zYWFyaW5lbkBoZWxzaW5raS5maQ==