 Emily D. Fountain1†
 Li-Chen Zhou2†
 Alyssa Karklus3
 Qun-Xiu Liu2
 James Meyers4Ian K. C. Fontanilla5Emmanuel Francisco Rafael6Jian-Yi Yu2Qiong Zhang2Xiang-Lei Zhu2En-Le Pei2Yao-Hua Yuan2*
 Graham L. Banes1,7*
- 1Wisconsin National Primate Research Center, University of Wisconsin – Madison, Madison, WI, United States
- 2Shanghai Zoological Park, Shanghai, China
- 3School of Veterinary Medicine, University of Wisconsin – Madison, Madison, WI, United States
- 4Independent Researcher, Madison, WI, United States
- 5Institute of Biology, College of Science, University of the Philippines Diliman, Quezon City, Philippines
- 6Avilon Zoo, Rodriguez, Rizal, Philippines
- 7Chinese Academy of Sciences Key Laboratory of Computational Biology, Shanghai Institute of Nutrition and Health, Chinese Academy of Sciences, Shanghai, China
Microarrays can be a cost-effective alternative to high-throughput sequencing for discovering novel single-nucleotide polymorphisms (SNPs). Illumina’s iScan platform dominates the market, but their commercial microarray products are designed for model organisms. Further, the platform outputs data in a proprietary format. This cannot be easily converted to human-readable genotypes or be merged with pre-existing data. To address this, we present and validate a novel pipeline to facilitate data analysis from cross-species application of Illumina microarrays. This facilitates the generation of a compatible VCF from iScan data and the merging of this with a second VCF comprising genotypes derived from other samples and sources. Our pipeline includes a custom script, iScanVCFMerge (presented as a Python package), which we validate using iScan data from three great ape genera. We conclude that cross-species application of microarrays can be a rapid, cost-effective approach for SNP discovery in non-model organisms. Our pipeline surmounts the common challenges of integrating iScan genotypes with pre-existing data.
Introduction
Single-nucleotide polymorphisms (SNPs) are a powerful tool for population genetic studies. In contrast with mainstay mitochondrial and microsatellite markers, SNPs can be generated at higher quality and with broader genome coverage and provide equivalent or greater statistical power for downstream studies (Morin et al., 2004). High-density SNP arrays are especially simple and cost-effective for the study of model organisms. In contrast with sequencing approaches, SNP arrays have built-in SNP redundancy (Oliphant et al., 2002) and call genotypes by averaging over multiple calls to increase accuracy. Moreover, they uniformly genotype all individuals at the exact same loci. Commercial arrays are widely available, particularly for association studies in humans (Ha et al., 2014), to develop breeding programs for livestock (Goddard and Hayes, 2009), and to facilitate crop improvement (Gupta et al., 2008). These arrays can be purchased for independent use or for application at service laboratories.
For non-model organisms, however, discovering a panel of informative SNPs can be expensive, time-consuming, and methodologically complex. Non-targeted reduced-representation sequencing approaches, such as RADSeq (Baird et al., 2008), ddRAD (Peterson et al., 2012), and genotyping-by-sequencing (GBS) (Elshire et al., 2011), can allow for finding species-specific markers on a large scale, but can suffer higher error rates than microarrays. Increasing the number of samples in a single next-generation-sequencing run also comes at the expense of decreased coverage per locus. Lower coverage can result in error rates > 2%, yielding SNPs not useful for kinship and GWAS studies (Fountain et al., 2016). Even if SNPs are successfully discovered, genotyping these on a larger scale is likely to be prohibitive: both PCR- and sequencing-based methods are either expensive (e.g., next-generation sequencing panels, or dual-probe TaqMan assays) or impractical for large sample sizes (e.g., Melt Analysis of Mismatch Amplification Mutation Assay, or Sanger sequencing). Designing and manufacturing a custom SNP chip is also unlikely to be practical, given the minimum number of chips that must be ordered. For example, Illumina’s custom Infinium iSelect chips require a commitment of at least 1,152 samples, with chips manufactured in 24-sample format and comprising 3,072–700,000 markers—this will not be cost-effective for all but the largest of studies. The required buy-in can become even more inhibitive if the chosen SNPs do not amplify consistently or provide data of insufficient quality; this issue is especially problematic when genotyping degraded samples (von Thaden et al., 2020), or when the SNP markers were chosen from a small population subset.
Cross-species application of commercial SNP arrays might therefore be considered as a means to rapidly genotype SNPs at low cost and with limited equipment and skills (Miller et al., 2012). This approach to SNP discovery has been previously used in reindeer (Rangifer tarandus) with the BovineSNP50 and OvineSNP50 chips, respectively, intended for cattle and sheep (Kharzinova et al., 2015); Antarctic fur seals (Arctocephalus gazella), with the CanineHD BeadChip intended for dogs (Hoffman et al., 2013); bighorn (Ovis canadensis) and thinhorn (O. dalli) sheep, with the OvineSNP50 chip (Miller et al., 2010); and in Arabian (Oryx leucoryx) and scimitar-horned oryx (O. dammah) with the BovineSNP50 array (Ogden et al., 2011). Their success comes in varying degrees, as the number of polymorphic SNPs obtained can be expected to decline proportionately with phylogenetic distance (Miller et al., 2010). Furthermore, SNP discovery with a small sample size often results in ascertainment bias, skewing the discovery of accurate FST values to obtain population informative SNPs (Trask et al., 2011; Quinto-Cortés et al., 2018). However, this limitation has not diminished the utility of cross-species SNP-chip application. Notably, the Bovine50K SNP chip was successfully used for SNP discovery in deer (Odocoileus spp.), despite the >25 million-year divergence between their taxonomic families (Haynes and Latch, 2012).
A key barrier to broader adoption of the cross-species approach is that most commercial arrays produce data in proprietary formats. In particular, Illumina’s Infinium assays must be processed on their iScan System platform, producing IDAT-format files that record the scanner intensities for each probe on the array. These files are intended to be opened in Illumina’s proprietary GenomeStudio software, to cluster and filter human-readable genotypes—though open-source IDAT parsing tools have since been written to produce the same outcome (e.g., Smith et al., 2013). Yet most cross-species studies will require their data in VCF format, to merge with data from other populations (e.g., from published studies). GenomeStudio can export variants as a GenomeStudio text file in four strand orientations—Illumina’s top-bottom, plus-minus, forward-reverse, or probe-target. Illumina’s top-bottom system was designed to allow for integration even if the reference allele changes in dbSNP or the human reference, but it is often difficult to understand (Guo et al., 2014). GenomeStudio also allows for data to be exported as a PLINK report (comprising .ped and .map files) following the top-bottom format (Purcell et al., 2007), or as an Affymetrix GeneSpring text file following the dbSNP forward strand format, but even using the dbSNP format means that not all SNPs are on the plus strand. There is no way to export a VCF that maintains the standard format and guarantees correct reference alleles for the target species. It is perhaps not coincidental, therefore, that none of the previously cited studies that used microarrays merged their genotypes with pre-existing data derived from non-microarray-based methods for comparative studies. On the contrary, each study analyzed the microarray data as a “closed” population, greatly limiting the utility of these genotypes.
Here, we provide guidance for selecting the most appropriate BeadChip for cross-species use, and for pre-processing the resulting IDAT files in GenomeStudio and PLINK. We then present a custom, cross-platform Python 3 script—iScanVCFMerge.py—that can be used to merge iScan microarray data with a pre-existing VCF comprising genotypes from other sources or samples. To demonstrate the efficacy of our script, we merged iScan data derived from 58 chimpanzees (Pan troglodytes), eight gorillas (Gorilla spp.), and 82 orang-utans (Pongo spp.) generated in this study with publicly available VCFs derived from whole-genome sequencing endeavors (Prado-Martinez et al., 2013). We show that microarrays for non-target species are an ideal tool for rapid and inexpensive SNP discovery.
Materials and Equipment
Use of our pipeline requires Illumina microarray data in IDAT format; the accompanying software program, Illumina GenomeStudio (RRID:SCR_010973); and our custom script, iScanVCFMerge.py (RRID:SCR_021193), which was tested with Python 3.9 (RRID:SCR_008394). The script is available both on GitHub1 and for installation as a Python package (i.e., pip install iScanVCFMerge). Though we describe methods for generating IDAT data (e.g., from great ape blood and tissue samples), this protocol is applicable to IDAT data generated from any cross-species application of Illumina bead chips.
Methods
DNA Extraction, Quantification, and Bead Chip Selection
We collected whole blood (N = 81) or tissue (N = 4) samples from 85 orang-utans (Pongo spp.) in zoos in the United States (N = 65), China (N = 18), and the Philippines (N = 2); whole blood from 58 chimpanzees (Pan troglodytes) in Chinese zoos; and whole blood from eight Western lowland gorillas (Gorilla gorilla) in United States zoos, from 2013 to 2018. Blood was drawn into EDTA Vacutainers during routine veterinary examinations or through voluntary blood-draw training. Tissue was collected during necropsy and stored in tubes or Whirl-paks (Nasco). All samples were stored at −20°C following collection. Genomic DNA was extracted from whole blood samples using the Promega ReliaPrepTM Blood gDNA Miniprep System or using the Promega Maxwell RSC Blood DNA Kit; tissue samples were extracted using the Promega Maxwell RSC Tissue DNA Kit. Extractions utilizing Maxwell RSC kits were automated on the eponymous instrument. We followed the manufacturer’s standard protocols for all extractions, with one modification for tissue samples: we performed an initial overnight digestion in Tail Lysis Buffer (Promega).
We quantified DNA via qPCR on a Roche LightCycler 480 instrument, with SYBRGreen qPCR Master Mix [sensu (Fünfstück et al., 2014)] and primers targeting an 81-bp portion of the c-myc proto-oncogene (Morin et al., 2001). Conditions comprised an initial denaturation of 10 min at 95°C; followed by 40 cycles of 10 s at 95°C, 10 s at 60°C, and 10 s at 72°C; concluding with one cycle of 10 s at 95°C, 60 s at 65°C, and 15 s at 95°C. We derived standard curves from serially diluted human genomic DNA (Promega). Extracts were then processed on the Illumina iScan platform, following the manufacturer’s standard protocols. To select the best chip for use in each species, the probe sequences were obtained from the .bed files provided by Illumina, which we mapped to the human hg18 genome. We then used BLAST to compare the probe sequences from five of Illumina’s commercial Infinium human microarrays (Core 24, Omni 2.5, Omni 5, OmniExpress, and Multi-Ethnic Global) to each species’ reference genome. We chose the chip with the highest proportion of total probes with the single best hit, proportional to the total size of the manifest. Subsequently, we hybridized orang-utan DNA to the Illumina Infinium Multi-Ethnic Global Bead Chip (61.27% single best hit) and chimpanzee DNA to the Illumina Infinium Omni 2.5 Bead Chip (83.21% single best hit). As Illumina probe sequences are designed from the human transcriptome, we considered these values best estimates of on-target probes.
iScan Data Analysis
We analyzed the resulting IDAT files separately for each species in GenomeStudio 2.0. A detailed description of all abbreviations for iScan quality filters is presented in Supplementary Table 1. We first visualized sample performance by plotting the call rate against the P10 GC value; selected any samples that fell outside the majority cluster of samples; and excluded these poorly performing samples (i.e., a call rate below 0.98). After updating SNP statistics, we then filtered out SNPs based on low call quality: those that did not clearly cluster into heterozygotes and homozygotes (based on a Cluster Sep score < 0.3) and those for which more than 25% lacked calls across samples. We again updated SNP statistics, re-clustered all remaining SNPs, and exported the resulting new cluster positions as a custom cluster file for downstream analyses.
Using the custom cluster, we reanalyzed the IDAT files by first visualizing sample performance as above. After updating SNP statistics, we then filtered out SNPs based on low call quality: Cluster Sep score < 0.3 and those for which more than 10% lacked calls across samples. As this study only utilized autosomal SNPs, we filtered out all those on the X, Y, and mitochondrial chromosomes. Next, we filtered those with an AB R Mean < 0.12 (mean of the normalized intensity—R—values for the AB genotypes) and an AB T Mean < 0.15 or >0.85 (mean of the normalized theta values of the heterozygous cluster); i.e., clustered too closely to the homozygous clusters. As the majority of our SNPs were homozygous across all individuals, we filtered SNPs with a Minor Allele Frequency (MAF) > 0.01 and <0.8. Finally, we updated SNP statistics and exported the resulting data in three formats: GenomeStudio Final Report (tab-delimited.txt) using top-bottom strand, PLINK (.ped; Purcell et al., 2007), and GeneSpring (.txt; Agilent Technologies).
Data exported in GenomeStudio and PLINK formats report the reference alleles using top–bottom strand reference. To convert the SNPs to positive strand format, we used the custom script by Robertson (2012) and the Strand and Position Files for each chip as presented by Rayner and McCarthy (2011). After converting the SNPs to the same strand, we then exported the SNPs from PLINK in VCF format for downstream analysis.
Merging iScan Calls With Reference VCF Files
We used the VCF files published by Prado-Martinez et al. (2013), who re-sequenced whole genomes from animals sourced across the natural range of the genera and mapped these to the human hg18 (NCBI Build 36.1, GCF_00000145.12) reference genome. As our iScan chips were in hg19 (GRCh37.p13, GCF_000001405.25) format, we used Picard2 to lift-over the VCFs from hg18 to hg19. For orang-utans, we merged the separate species-specific VCFs into a single VCF using bcftools (Li, 2011).
Our script, iScanVCFMerge.py, is designed to merge two VCF files of any format into a single VCF based on matches of chromosome, position, and certain conditions of major and minor alleles. Matched rows in the two VCFs are concatenated into a single row in the output files. The concatenated row comprises data for all individuals in both VCFs. This process allows the individuals from multiple populations to be analyzed in the same dataset.
Usage: iScanVCFMerge -R reference_file.vcf -I iScan_file.vcf -O output_directory.
The first VCF file (-R, –reference_vcf) should comprise the pre-existing genotypes and will be used as the source of reference for REF and ALT alleles. This step is necessary because GenomeStudio assigns the REF and ALT based on the minor allele frequencies of the population genotyped and not based on a reference genome (i.e., that of the species genotyped). Inevitably, these REF and ALT alleles will not always match; particularly when only small subsections or subpopulations of a species are typed. This VCF file must include a header. The second VCF file (-I, –iScan_vcf) should comprise the novel iScan genotypes, in which the REF and ALT alleles will be updated. A header is not required and would in any case be removed by the program: contig values exported by GenomeStudio and/or PLINK are computed from the BeadChip and will not match the true species’ reference genome. Input VCF files can be in either uncompressed (.vcf) or gzipped (.gzip) format; no index or dictionary files are needed. The script will run substantially faster if the input files are sorted; however, lexicographical sorting of both VCFs is performed irrespective.
At the script’s execution, both VCFs are read into data frames, and only those positions shared between each file are retained for further processing. Because GenomeStudio and PLINK list chromosomes numerically, in contrast with newer reference genomes, the script first checks for a “chr” prefix in the iScan VCF and adds this where missing. Duplicate positions in that VCF are then dropped: this step is essential, as Illumina iScan microarrays often include duplicate or multiple probes for the same position in their design. All INDELs in the iScan VCF are then dropped, as—unlike single nucleotide variants—these may require further in vitro validation cross-species. The iScan VCF is then checked for other GenomeStudio or PLINK anomalies that might occur during pre-processing, e.g., CHROM or POS positions with values of zero. Additional FORMAT and INFO tags are dropped, as they become inapplicable following the merge, though the ID field is retained—if present—from the iScan VCF. Thereon, each position is evaluated for the following cases, prior to one of the four subsequent actions:
Case 1: The positions are biallelic and the alleles in both VCFs match exactly.
That is, the REF and ALT in both the reference and the iScan VCF files are exactly the same. The individuals are all merged into a single row with the major and minor alleles unchanged.
Case 2: The positions are biallelic and the alleles in both VCFs match exactly when reversed.
The reference file’s alleles are used as a reference and samples from this VCF are unchanged. Genotypes in the second file are re-coded to conform to the mirrored state of the REF and ALT alleles inferred by GenomeStudio. For example, where the reference VCF states REF = A and ALT = T, the iScan VCF would state REF = T and ALT = A; thus, the genotypes in that file would be flipped.
Case 3: The positions are multi-allelic; the major (REF) alleles match exactly, but the ALT allele of the iScan VCF matches an alternate allele of the reference VCF.
The reference file’s alleles are used as a reference and samples from this VCF are unchanged. Genotypes from the iScan VCF are re-coded to refer to the necessary ALT allele of the reference VCF. For example, where the reference VCF file states REF = G and ALT = T,A,C, and the iScan VCF states REF = G and ALT = C, an iScan genotype of 1/1 would be re-coded to 1/3.
Case 4: The positions are multi-allelic; the ALT allele of the iScan VCF exactly matches the REF allele of the reference VCF, but the REF allele of the iScan VCF matches either the tri- or quad-ALT allele of the refeence VCF.
The reference file’s alleles are used as a reference and samples from this VCF are unchanged. Genotypes from the iScan VCF are first flipped, and then re-coded to refer to the appropriate REF and ALT alleles of the reference VCF. For example, where the reference VCF file states REF = G and ALT = T,A,C and the iScan VCF states REF = C and ALT = G, an iScan genotype of 0/1 would be re-coded to 1/3.
At completion, the script will output four files containing the passing variants, plus a fifth in which all are merged for downstream analysis (merged.vcf): exact_matches_biallelic.vcf and exact_matches_multiallelic.vcf, containing either bi- or multi-allelic genotypes that matched the reference REF and ALT (or one of the ALTS) exactly; and exact_matches_rev_biallelic.vcf and exact_matches_rev_multiallelic.vcf, comprising those where the iScan REF and one ALT allele matched those of the reference once reversed. A sixth file, rejected.vcf, contains all positions that did not match, and was therefore dropped. The script reports progress and outputs summary statistics of all loci processed.
Results
Following re-clustering in GenomeStudio, we recorded on-target genotyping rates of 95% for chimpanzees and 70% for gorillas and orang-utans. In total, we genotyped 2,382,209 SNPs in chimpanzees and 1,748,250 SNPs in gorillas and orang-utans (Table 1). Of these, the majority were homozygous, as expected, with some SNPs in which all samples were heterozygous for the same alleles: 94% for chimpanzees, 96% for gorillas, and 95% for orang-utans.
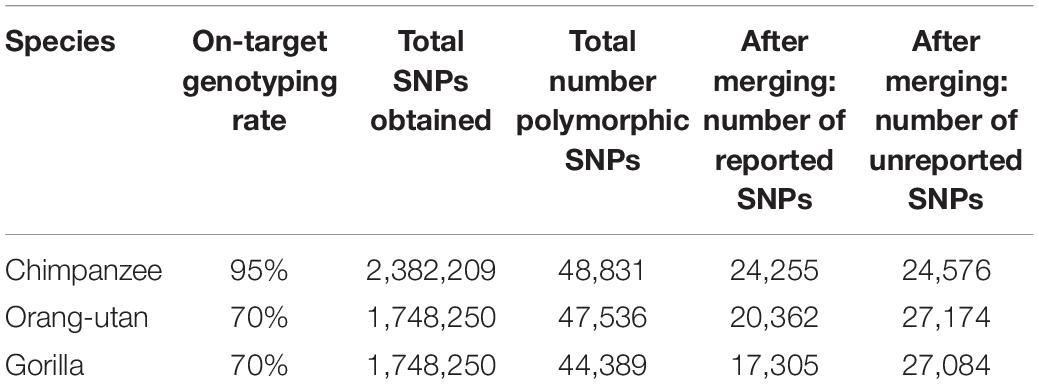
Table 1. On-target genotyping rates and SNP statistics for each species, including the number of reported SNPs (i.e., those previously reported in other studies based on whole-genome sequencing in the target species) and unreported SNPs (i.e., newly discovered SNPs detected in this study, using microarrays) observed in each of the retained polymorphic SNP datasets.
We retained all chimpanzee and gorilla samples for analyses but removed three orang-utan samples that could not cluster correctly. After removing homozygous and purely heterozygous SNPs and filtering for MAF, we were left with 48,831 polymorphic SNPs for chimpanzees, 47,536 polymorphic SNPs for gorillas, and 44,389 polymorphic SNPs for orang-utans (Table 1).
After merging with iScanVCFMerge, our final chimpanzee VCF matched 49.6% of the published SNPs (24,255); thus, 50.4% of our SNPs were previously unreported. Our final gorilla VCF matched 36.4% of the published SNPs (17,305); thus 63.6% were newly discovered. Our final orang-utan VCF matched 45.9% of the published SNPs (20,362); thus, 54.1% of our SNPs were novel (Table 1). The majority of the remaining SNPs were lost during merging due to chromosome and position mismatches, i.e., SNPs were not genotyped at the same location in both the public and the iScan data. Two SNPs were rejected for chimpanzees due to REF and ALT mismatches at a chromosome and position, 28 SNPs were rejected for gorillas, and 53 SNPs were rejected for orang-utans.
Discussion
Our findings reiterate that microarrays can be applied across species, and that—when utilizing our scripted pipeline—novel SNPs can be recovered and merged for downstream analyses with pre-existing data. Our polymorphic SNP recovery rates were slightly higher than in previous studies: 6% of all loci in chimpanzees, 4% in gorillas, and 5% in orang-utans, despite the former having diverged from our common ancestor c. 5 mya, c. 10 mya (Scally et al., 2012), and c. 14 mya, respectively (Locke et al., 2011). In contrast, the OvineSNP50 BeadChip—designed for domestic sheep (Ovis aries)—yielded 570 polymorphic SNPs in bighorn sheep (1.82% of the 48,230 genotyped) and 330 SNPs in thinhorn sheep (0.69% of the 48,004 genotyped), despite their much closer evolutionary history. The effect of species divergence on loci recovery emphasizes the importance of selecting the most appropriate chip. In our case, multiple human chips were available and assessed for their single best hit against the great ape genomes. In contrast, commercial sheep microarrays are less abundant, and are designed to detect recently arisen mutations useful in discerning domestic sheep breeds (Miller et al., 2010).
The utility of cross-species microarray data will depend on the yield of polymorphic SNPs. While whole-genome sequencing (for example) may yield a greater number, the lower input DNA quantities and scanning (vs. library preparation and sequencing) costs offset the disadvantage of lower yields from microarrays. In gorillas, for example, genome-wide SNPs have been obtained from whole-genome sequencing (Prado-Martinez et al., 2013), reduced representation sequencing (Scally et al., 2013), as well as with microarrays (this study). When comparing the number of polymorphic SNPs vs. input DNA and cost of sequencing, our cross-species microarray approach was substantially cheaper (Table 2).
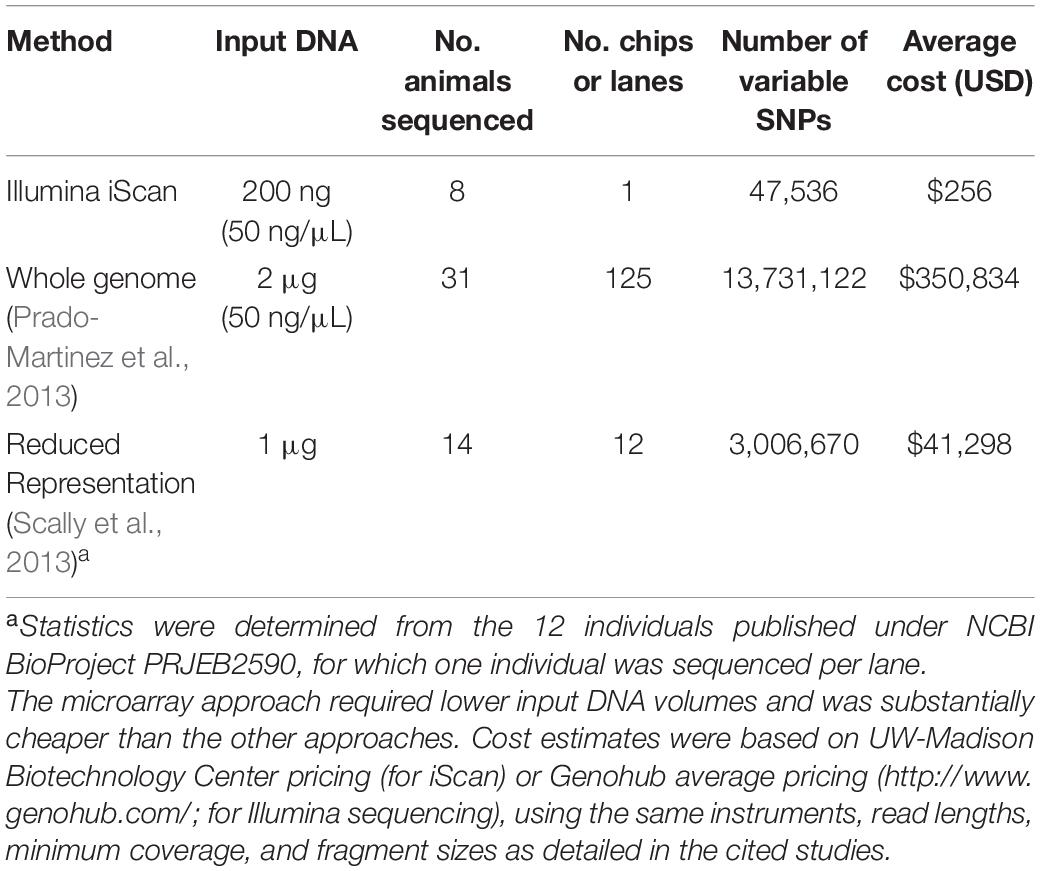
Table 2. Comparative costs of SNP discovery approaches in gorillas, considering either sequencing or BeadChip scanning costs, for either microarrays (this study), whole-genome sequencing (X), and reduced-representation sequencing (X).
Nonetheless, with only small numbers of SNPs, it can be difficult to calculate LD and runs of homozygosity (ROH), which are needed for inferring kinship or to perform QTL and GWAS studies. With a medium-density (50K) SNP array, the number of short ROH can be overestimated even when using microarrays in the species they were designed for (Ferenčaković et al., 2013; Szmatoła et al., 2020). Though it may be tempting to include all SNPs, rather than filter out monomorphic SNPs, this will falsely raise homozygosity estimates and can lead to assumptions of inbreeding—as was observed when using the Bovine50 chip to study LD in reindeer (Shafer et al., 2016). Further, large gaps in SNP coverage can lead to the detection of false ROH islands, most likely caused by ROH detection algorithms not detecting short gaps in the flanking regions of the ROH (Nandolo et al., 2018). Nonetheless, in most non-model studies, microarray data are analyzed as private populations—meaning polymorphisms when compared to other populations cannot be detected. Our pipeline might therefore serve to increase the utility of microarray data from prior studies, if used to merge their outputs with pre-existing genotypes. The present version of iScanVCFMerge does not address the creation of tri-allelic data (i.e., creating a tri-allele when the iScan population has an allele present that is not present in the publicly accessed data). In a future iteration, however, this capability could facilitate discovery of rare alleles and kinship-informative alleles only found in the study population.
Conclusion
Cross-species application of microarrays is a rapid, cost-effective approach for SNP discovery in non-model organisms. The use of Illumina microarrays has to date been hampered by an inability to export genotypes into VCF and combine these with a pre-existing VCF comprising additional data. Our pipeline, utilizing our custom script—iScanVCFMerge—facilitates the simple and rapid merging of such files, enabling the detection of novel SNP loci and increasing the likelihood of observing polymorphic sites.
Data Availability Statement
The great-ape microarray data featured in this study are used as demo data with which to demonstrate the efficacy of our pipeline and script. Because the data were derived from zoo-housed animals, restrictions apply to their availability, as their source biomaterials were used under license for the current study. Data may be available from the corresponding author upon reasonable request and with the permission of each licensor. The pipeline can otherwise be independently verified using any iScan-derived dataset.
Ethics Statement
The animal study was reviewed and approved by the Chinese Academy of Sciences.
Author Contributions
EF, L-CZ, Q-XL, E-LP, Y-HY, and GB designed the study. GB, L-CZ, IF, EFR, E-LP, and Y-HY collected and processed the biological samples. EF, GB, L-CZ, AK, J-YY, QZ, and X-LZ performed the laboratory work. EF, JM, and GB performed the computational analyses and wrote the script. EF and GB wrote the manuscript. All authors read and approved the final manuscript and agreed to be accountable for the content of the work.
Funding
This research was funded by the Shanghai Municipal Forestry Department (to Y-HY and E-LP), the Arcus Foundation, the Ronna Noel Charitable Trust, The Eppley Foundation for Research, Inc., The Orang-utan Conservation Genetics Trust (now The Orang-utan Conservation Genetics Project, Inc.) (all to GB), and the Avilon Wildlife Conservation Foundation (to EFR). AK was supported by the Morris Animal Foundation. This study capitalized on the computing resources and assistance of the UW-Madison Center for High Throughput Computing (CHTC) in the Department of Computer Sciences, which is supported by UW-Madison, the Advanced Computing Initiative, the Wisconsin Alumni Research Foundation, the Wisconsin Institute for Discovery, and the National Science Foundation. In doing so, the study utilized the Open Science Grid, which is supported by the National Science Foundation and the U.S. Department of Energy’s Office of Science. Research reported in this publication was also supported in part by the Office of the Director, National Institutes of Health, under Award Number P51OD011106 to the Wisconsin National Primate Research Center, University of Wisconsin–Madison. In turn, this was conducted in part at a facility constructed with support from Research Facilities Improvement Program grant numbers RR15459-01 and RR020141-01. The content is solely the responsibility of the authors and does not necessarily represent the official views of the National Institutes of Health. Funding bodies had no role in the design of the study; the collection, analysis, and interpretation of data; or in writing the manuscript.
Conflict of Interest
The authors declare that the research was conducted in the absence of any commercial or financial relationships that could be construed as a potential conflict of interest.
Acknowledgments
We would like to thank the University of Wisconsin Biotechnology Center – Gene Expression Center, Madison, WI, United States; the Carver Biotechnology Center, University of Illinois at Urbana-Champaign, Champaign, IL, United States; Genergy Bio, Shanghai, China; and the University of the Philippines – Diliman, Quezon City, Philippines, for facilitating the molecular work. Samples for this project were provided by the following zoos: ABQ BioPark, Zoo Atlanta, Audubon Zoo, Birmingham Zoo, Cameron Park Zoo, Cheyenne Mountain Zoo, Chicago Zoological Society – Brookfield Zoo, Cleveland Metroparks Zoo, Columbus Zoo, St Paul’s Como Park Zoo and Conservatory, Fresno Chaffee Zoo, Fort Wayne Children’s Zoo, Gladys Porter Zoo, Greenville Zoo, Utah’s Hogle Zoo, Indianapolis Zoo, Little Rock Zoo, Zoo Miami, Milwaukee County Zoo, Smithsonian’s National Zoo, Oklahoma City Zoo, Oregon Zoo, Philadelphia Zoo, Phoenix Zoo, Rolling Hills Zoo, Sacramento Zoo, Sedgwick County Zoo, and Seneca Park Zoo (United States); Anji Zhongnan Baicao Yuan, Chongqing Zoo, Hangzhou Wild Animal Park, Shanghai Zoo (China); and AVILON Zoo (Philippines). We thank the Chinese Association of Zoological Gardens (CAZG) and the Philippine Zoos and Aquariums Association (PHILZOOS) for facilitating sample collection in their countries, and the Orangutan, Gorilla and Chimpanzee Species Survival Plan (SSP) Steering Committees for their approval by recommendation for sample collection in US zoos.
Supplementary Material
The Supplementary Material for this article can be found online at: https://www.frontiersin.org/articles/10.3389/fevo.2021.629252/full#supplementary-material
Footnotes
References
Baird, N. A., Etter, P. D., Atwood, T. S., Currey, M. C., Shiver, A. L., Lewis, Z. A., et al. (2008). Rapid SNP discovery and genetic mapping using sequenced RAD markers. PLoS One 3:e3376. doi: 10.1371/journal.pone.0003376
Elshire, R. J., Glaubitz, J. C., Sun, Q., Poland, J. A., Kawamoto, K., Buckler, E. S., et al. (2011). A robust, simple genotyping-by-sequencing (GBS) approach for high diversity species. PLoS One 6:e19379. doi: 10.1371/journal.pone.0019379
Ferenčaković, M., Sölkner, J., and Curik, I. (2013). Estimating autozygosity from high-throughput information: effects of SNP density and genotyping errors. Genet. Sel. Evol. 45:42. doi: 10.1186/1297-9686-45-42
Fountain, E., Pauli, J., Reid, B., Palsbøll, P., and Peery, M. (2016). Finding the right coverage: the impact of coverage and sequence quality on single nucleotide polymorphism genotyping error rates. Mol. Ecol. Resour. 16, 966–978. doi: 10.1111/1755-0998.12519
Fünfstück, T., Arandjelovic, M., Morgan, D. B., Sanz, C., Breuer, T., Stokes, E. J., et al. (2014). The genetic population structure of wild western lowland gorillas (Gorilla gorilla gorilla) living in continuous rain forest. Am. J. Primatol. 76, 868–878. doi: 10.1002/ajp.22274
Goddard, M. E., and Hayes, B. J. (2009). Mapping genes for complex traits in domestic animals and their use in breeding programmes. Nat. Rev. Genet. 10, 381–391. doi: 10.1038/nrg2575
Guo, Y., He, J., Zhao, S., Wu, H., Zhong, X., Sheng, Q., et al. (2014). Illumina human exome genotyping array clustering and quality control. Nat. Protoc. 9, 2643–2662. doi: 10.1038/nprot.2014.174
Gupta, P. K., Rustgi, S., and Mir, R. R. (2008). Array-based high-throughput DNA markers for crop improvement. Heredity 101, 5–18. doi: 10.1038/hdy.2008.35
Ha, N.-T., Freytag, S., and Bickeboeller, H. (2014). Coverage and efficiency in current SNP chips. Eur. J. Hum. Genet. 22, 1124–1130. doi: 10.1038/ejhg.2013.304
Haynes, G. D., and Latch, E. K. (2012). Identification of novel single nucleotide polymorphisms (SNPs) in deer (Odocoileus spp.) using the BovineSNP50 BeadChip. PLoS One 7:e36536. doi: 10.1371/journal.pone.0036536
Hoffman, J. I., Thorne, M. A. S., McEwing, R., Forcada, J., and Ogden, R. (2013). Cross-amplification and validation of SNPs conserved over 44 million years between seals and dogs. PLoS One 8:e68365. doi: 10.1371/journal.pone.0068365
Kharzinova, V. R., Sermyagin, A. A., Gladyr, E. A., Okhlopkov, I. M., Brem, G., and Zinovieva, N. A. A. (2015). Study of applicability of SNP chips developed for bovine and ovine species to whole-genome analysis of reindeer Rangifer tarandus. J. Hered. 106, 758–761.
Li, H. (2011). A statistical framework for SNP calling, mutation discovery, association mapping and population genetical parameter estimation from sequencing data. Bioinformatics 27, 2987–2993. doi: 10.1093/bioinformatics/btr509
Locke, D. P., Hillier, L. W., Warren, W. C., Worley, K. C., Nazareth, L. V., Muzny, D. M., et al. (2011). Comparative and demographic analysis of orang-utan genomes. Nature 469, 529–533.
Miller, J. M., Kijas, J. W., Heaton, M. P., McEwan, J. C., and Coltman, D. W. (2012). Consistent divergence times and allele sharing measured from cross-species application of SNP chips developed for three domestic species. Mol. Ecol. Resour. 12, 1145–1150. doi: 10.1111/1755-0998.12017
Miller, J. M., Poissant, J., Kijas, J. W., Coltman, D. W., and ISG Consortium (2010). A genome-wide set of SNPs detects population substructure and long range linkage disequilibrium in wild sheep. Mol. Ecol. Resour. 11, 314–322. doi: 10.1111/j.1755-0998.2010.02918.x
Morin, P. A., Chambers, K., Boesch, C., and Vigilant, L. (2001). Quantitative polymerase chain reaction analysis of DNA from noninvasive samples for accurate microsatellite genotyping of wild chimpanzees (Pan troglodytes verus). Mol. Ecol. 10, 1835–1844. doi: 10.1046/j.0962-1083.2001.01308.x
Morin, P. A., Luikart, G., Wayne, R. K., and The SNP Workshop Group (2004). SNPs in ecology, evolution and conservation. Trends Ecol. Evol. 19, 208–216. doi: 10.1016/j.tree.2004.01.009
Nandolo, W., Utsunomiya, Y. T., Mészáros, G., Wurzinger, M., Khayadzadeh, N., Torrecilha, R. B. P., et al. (2018). Misidentification of runs of homozygosity islands in cattle caused by interference with copy number variation or large intermarker distances. Genet. Sel. Evol. 50:43.
Ogden, R., Baird, J., Senn, H., and McEwing, R. (2011). The use of cross-species genome-wide arrays to discover SNP markers for conservation genetics: a case study from Arabian and scimitar-horned oryx. Conserv. Genet. Resour. 4, 471–473. doi: 10.1007/s12686-011-9577-2
Oliphant, A., Barker, D. L., Stuelpnagel, J. R., and Chee, M. S. (2002). BeadArray TM technology: enabling an accurate, cost-effective approach to high-throughput genotyping. Biotechniques 32, S56–S61.
Peterson, B. K., Weber, J. N., Kay, E. H., Fisher, H. S., and Hoekstra, H. E. (2012). Double digest RADseq: an inexpensive method for de novo SNP discovery and genotyping in model and non-model species. PLoS One 7:e37135. doi: 10.1371/journal.pone.0037135
Prado-Martinez, J., Sudmant, P. H., Kidd, J. M., Li, H., Kelley, J. L., Lorente-Galdos, B., et al. (2013). Great ape genetic diversity and population history. Nature 499, 471–475.
Purcell, S., Neale, B., Todd-Brown, K., Thomas, L., Ferreira, M. A., Bender, D., et al. (2007). A tool set for whole-genome association and population-based linkage analyses. Am. J. Hum. Genet. 81, 559–575. doi: 10.1086/519795
Quinto-Cortés, C. D., Woerner, A. E., Watkins, J. C., and Hammer, M. F. (2018). Modeling SNP array ascertainment with approximate Bayesian Computation for demographic inference. Sci. Rep. 8:10209.
Rayner, N. W., and McCarthy, M. I. (2011). Genotyping Chips Strand and Build Files. Available online at: https://www.well.ox.ac.uk/~wrayner/strand/ (accessed June 4, 2020).
Robertson, N. (2012). Update_Build.sh. Available online at: https://www.well.ox.ac.uk/~wrayner/strand/update_build.sh (accessed June 4, 2020).
Scally, A., Dutheil, J. Y., Hillier, L. W., Jordan, G. E., Goodhead, I., Herrero, J., et al. (2012). Insights into hominid evolution from the gorilla genome sequence. Nature 483, 169–175.
Scally, A., Yngvadottir, B., Xue, Y., Ayub, Q., Durbin, R., and Tyler-Smith, C. (2013). A genome-wide survey of genetic variation in gorillas using reduced representation sequencing. PLoS One 8:e65066. doi: 10.1371/journal.pone.0065066
Shafer, A. B. A., Miller, J. M., and Kardos, M. (2016). Cross-species application of SNP chips is not suitable for identifying runs of homozygosity. J. Hered. 107, 193–195. doi: 10.1093/jhered/esv137
Smith, M. L., Baggerly, K. A., Bengtsson, H., Ritchie, M. E., and Hansen, K. D. (2013). illuminaio: an open source IDAT parsing tool for Illumina microarrays. F1000Research 2:264. doi: 10.12688/f1000research.2-264.v1
Szmatoła, T., Gurgul, A., Jasielczuk, I., Fu, W., and Ropka-Molik, K. (2020). A detailed characteristics of bias associated with long runs of homozygosity identification based on medium density SNP microarrays. J. Genomics 8, 43–48. doi: 10.7150/jgen.39147
Trask, J. A. S., Malhi, R. S., Kanthaswamy, S., Johnson, J., Garnica, W. T., Malladi, V. S., et al. (2011). The effect of SNP discovery method and sample size on estimation of population genetic data for Chinese and Indian rhesus macaques (Macaca mulatta). Primates 52, 129–138. doi: 10.1007/s10329-010-0232-4
von Thaden, A., Nowak, C., Tiesmeyer, A., Reiners, T. E., Alves, P. C., Lyons, L. A., et al. (2020). Applying genomic data in wildlife monitoring: development guidelines for genotyping degraded samples with reduced single nucleotide polymorphism panels. Mol. Ecol. Resour. 20, 662–680. doi: 10.1111/1755-0998.13136
Keywords: Infinium, BeadArray, BeadChip, bead chip, SNP discovery, genotyping, great apes
Citation: Fountain ED, Zhou L-C, Karklus A, Liu Q-X, Meyers J, Fontanilla IKC, Rafael EF, Yu J-Y, Zhang Q, Zhu X-L, Pei E-L, Yuan Y-H and Banes GL (2021) Cross-Species Application of Illumina iScan Microarrays for Cost-Effective, High-Throughput SNP Discovery. Front. Ecol. Evol. 9:629252. doi: 10.3389/fevo.2021.629252
Received: 13 November 2020; Accepted: 26 April 2021;
Published: 31 May 2021.
Edited by:
Michael G. Campana, Smithsonian Conservation Biology Institute (SI), United StatesReviewed by:
Alexandra K. Fraik, Washington State University, United StatesMario Barbato, Catholic University of the Sacred Heart, Piacenza, Italy
Copyright © 2021 Fountain, Zhou, Karklus, Liu, Meyers, Fontanilla, Rafael, Yu, Zhang, Zhu, Pei, Yuan and Banes. This is an open-access article distributed under the terms of the Creative Commons Attribution License (CC BY). The use, distribution or reproduction in other forums is permitted, provided the original author(s) and the copyright owner(s) are credited and that the original publication in this journal is cited, in accordance with accepted academic practice. No use, distribution or reproduction is permitted which does not comply with these terms.
*Correspondence: Graham L. Banes, YmFuZXNAd2lzYy5lZHU=; Yao-Hua Yuan, eWh5dWFuc2hAMTYzLmNvbQ==
†These authors have contributed equally to this work