 Andrea R. Norris1*
 Leonardo Frid2
 Chloé Debyser2
 Krista L. De Groot1
 Jeffrey Thomas1Adam Lee1Kimberly M. Dohms1Andrew Robinson1Wendy Easton1Kathy Martin3,4Kristina L. Cockle5
- 1Canadian Wildlife Service, Environment and Climate Change Canada, Delta, BC, Canada
- 2Apex Resource Management Solutions, Ottawa, ON, Canada
- 3Department of Forest and Conservation Sciences, University of British Columbia, Vancouver, BC, Canada
- 4Wildlife Research and Landscape Science, Environment and Climate Change Canada, Delta, BC, Canada
- 5Instituto de Biología Subtropical–Consejo Nacional de Investigaciones Cient ficas y Técnicas–Universidad Nacional de Misiones, Puerto Iguazú, Argentina
To halt ongoing loss in biodiversity, there is a need for landscape-level management recommendations that address cumulative impacts of anthropogenic and natural disturbances on wildlife habitat. We examined the cumulative effects of logging, roads, land-use change, fire, and bark beetle outbreaks on future habitat for olive-sided flycatcher (Contopus cooperi), a steeply declining aerial insectivorous songbird, in Canada’s western boreal forest. To predict the occurrence of olive-sided flycatcher we developed a suite of habitat suitability models using point count surveys (1997–2011) spatially- and temporally-matched with forest inventory data. Flycatcher occurrence was positively associated with small (∼10 ha) 10- to 20-year-old clearcuts, and with 10–100% tree mortality due to mountain pine beetle (Dendroctonus ponderosae) outbreaks, but we found no association with roads or distance to water. We used the parameter estimates from the best-fit habitat suitability models to inform spatially explicit state-and-transition simulation models to project change in habitat availability from 2020 to 2050 under six alternative scenarios (three management × two fire alternatives). The simulation models projected that the cumulative effects of land use conversion, forest harvesting, and fire will reduce the area of olive-sided flycatcher habitat by 16–18% under Business As Usual management scenarios and by 11–13% under scenarios that include protection of 30% of the land base. Scenarios limiting the size of all clearcuts to ≤10 ha resulted in a median habitat loss of 4–6%, but projections were highly variable. Under all three management alternatives, a 50% increase in fire frequency (expected due to climate change) exacerbated habitat loss. The projected losses of habitat in western boreal forest, even with an increase in protected areas, imply that reversing the ongoing population declines of olive-sided flycatcher and other migratory birds will require attention to forest management beyond protected areas. Further work should examine the effects of multiple stressors on the demographic mechanisms driving change in aerial insectivore populations, including stressors on the wintering grounds in South America, and should aim to adapt the design of protected areas and forest management policies to projected climate-driven increases in the size and frequency of wildfires.
Introduction
Over the past half century, steep population declines in terrestrial birds have coincided with changes in climate and land-use patterns across North America (Butchart et al., 2010; Northrup et al., 2019). Climate-driven increases in the frequency and intensity of natural disturbance events, such as fire and insect outbreaks, may compound or ameliorate the negative effects of human-induced habitat loss on bird populations (Vitousek, 1994; Betts et al., 2017). Over the 50-year period from 1966 to 2006, birds that feed on flying insects, or aerial insectivores, showed the strongest declines of any songbird group in North America, with long-distance migrants (to South America) showing the most acute negative trends (Nebel et al., 2010; Smith et al., 2015; Rosenberg et al., 2019). To halt these widespread declines, we need policies that identify and minimize loss of critical habitat, account for climate change, and fully integrate biodiversity goals (Butchart et al., 2010; Favaro et al., 2014; Nebel et al., 2020). Such policies can be developed quantitatively by using avian habitat models in landscape simulations to project future habitat conditions under a range of land-use scenarios and natural disturbance events (Mahon et al., 2014).
There is strong evidence that natural and anthropogenic disturbances drive changes in bird populations, especially in systems that experience large-scale natural disturbance events, such as boreal and hemi-boreal forests (Drapeau et al., 2000; Schmiegelow and Mönkkönen, 2002; Norris and Martin, 2010). It has been hypothesized that boreal birds are adapted to large-scale natural disturbances, such as insect outbreaks and fire, making them more resilient to human-caused fragmentation (e.g., forest harvesting, roads, and/or oil and gas pipelines) relative to species occupying habitats with less frequent natural disturbances (Schmiegelow and Mönkkönen, 2002; Schmiegelow and Villard, 2009). Indeed, some species and even entire communities show positive population-level responses to some levels of forest harvesting in the boreal and hemi-boreal forests of Canada (Lemelin et al., 2007; Drever and Martin, 2010). However, recent evidence suggests that forest harvesting, in the presence of other disturbances such as those associated with oil and gas extraction, can have compounding negative effects for many boreal bird species (Mahon et al., 2019). Furthermore, climate change is likely to exacerbate negative population-level responses to harvesting in boreal forests (Cadieux et al., 2020). In addition to current and significant industrial activity in northern and western forests, climate change is projected to increase the frequency and severity of fires and insect outbreaks (Wootton, 2010; Cohen et al., 2019). In British Columbia, the area burned annually by wildfires was three times higher in 2017 and 2018 compared with the previous decade (Government of British Columbia, 2019a), after years of major outbreaks of mountain pine beetle (Dendroctonus ponderosae). Thus, to understand and reverse population declines of birds breeding in severely climate-impacted western boreal forests, there is a need to evaluate the cumulative, additive, and/or interactive effects of multiple natural and human-induced disturbances (cumulative effects; Schmiegelow and Villard, 2009; Duinker et al., 2012; Mahon et al., 2014).
To assess cumulative effects of multiple disturbances on boreal migratory birds, Mahon et al. (2014) modeled future habitat supply and population size for a suite of species under various landscape change scenarios. They found that population objectives set for these species (Government of Canada, 2013) would not be met under the current climate and current management prescriptions. The study provided a robust framework for assessing cumulative effects, developed habitat-based objectives required to restore or maintain populations, and highlighted the need to incorporate population-specific habitat requirements in regional cumulative effects assessment processes to simulate future habitat availability in other parts of the boreal forest where habitat associations likely differ.
Here, we assess the cumulative effects of multiple stressors on habitat suitability for the steeply declining olive-sided flycatcher (Contopus cooperi), across multiple spatial and temporal scales in boreal forest in the southern Peace River region of northeastern British Columbia (Supplementary Figure 1). Pressed against the east side of the northern Rocky Mountains (North America’s continental divide), the southern Peace River region is part of a major avian migration route and home to one of Canada’s most diverse avian assemblages (Campbell et al., 1997), but is under intense development pressure from hydroelectric dams, mining, agriculture, forestry, and oil and gas production (Nitschke, 2008). It therefore represents an important location to examine the cumulative effects of multiple stressors on avian habitat. We chose to study the olive-sided flycatcher because it is a broadly distributed, elevational generalist, aerial insectivorous bird species, undergoing steep population declines across the Americas, including a decline of approximately 70% in Canada between 1970 and 2017 (Smith et al., 2019). Olive-sided flycatchers are typically associated with small forest gaps created by fire and/or tree mortality in disturbance-driven forested ecosystems, and ∼40% of all individuals that occur in Canada breed in British Columbia (Haché et al., 2014; Altman and Sallabanks, 2020; Boreal Avian Modelling Project, 2020).
Our objective was to assess the cumulative effects of multiple human-induced and natural environmental stressors on olive-sided flycatchers, using a stepwise approach. First, we built Bayesian generalized linear mixed-effects models that predicted occurrence of flycatchers in point count surveys from spatially- and temporally-matched forest inventory data, to determine how multiple environmental factors influence habitat suitability. Second, we used spatially explicit state-and-transition simulation models to project future land use, forest harvesting and regrowth, fires, and insect outbreaks, under six scenarios representing the combination of three management alternatives and two fire alternatives (Table 1). The management alternatives included (1) Business As Usual, (2) Increased Protected Area (protect from harvest 30% of the land base by adding protection to publicly managed forest with a stand older than 75 years and affected by mountain pine beetle), and (3) Reduced Cutblock Size (restrict timing and size of cutblocks to match optimal habitat conditions as defined by habitat suitability models). The fire alternatives were (1) Baseline Fire (current conditions) and (2) Increased Fire [fire frequency increased by 50% compared to current conditions, following projections for British Columbia under the Intergovernmental Panel on Climate Change (IPCC)-A2 emissions scenario; Wootton, 2010]. Third, we used our best-supported habitat suitability models to predict habitat suitability for olive-sided flycatcher at baseline (current conditions) and under each future scenario. Based on previous research (Haché et al., 2014; Bale et al., 2019; Westwood et al., 2019), we expected that olive-sided flycatcher densities would be highest in forest stands with small openings, such as wetlands and roads, but show thresholds in response to disturbances such that larger clearcuts would have negative effects on abundance. We further expected that land cover change (from forest to other uses, e.g., cropland or urban), clearcut logging, and fire would exacerbate habitat loss over the coming decades under Business As Usual scenarios, but that conservation measures represented in the Increased Protected Area and Reduced Cutblock Size scenarios would mitigate habitat loss.
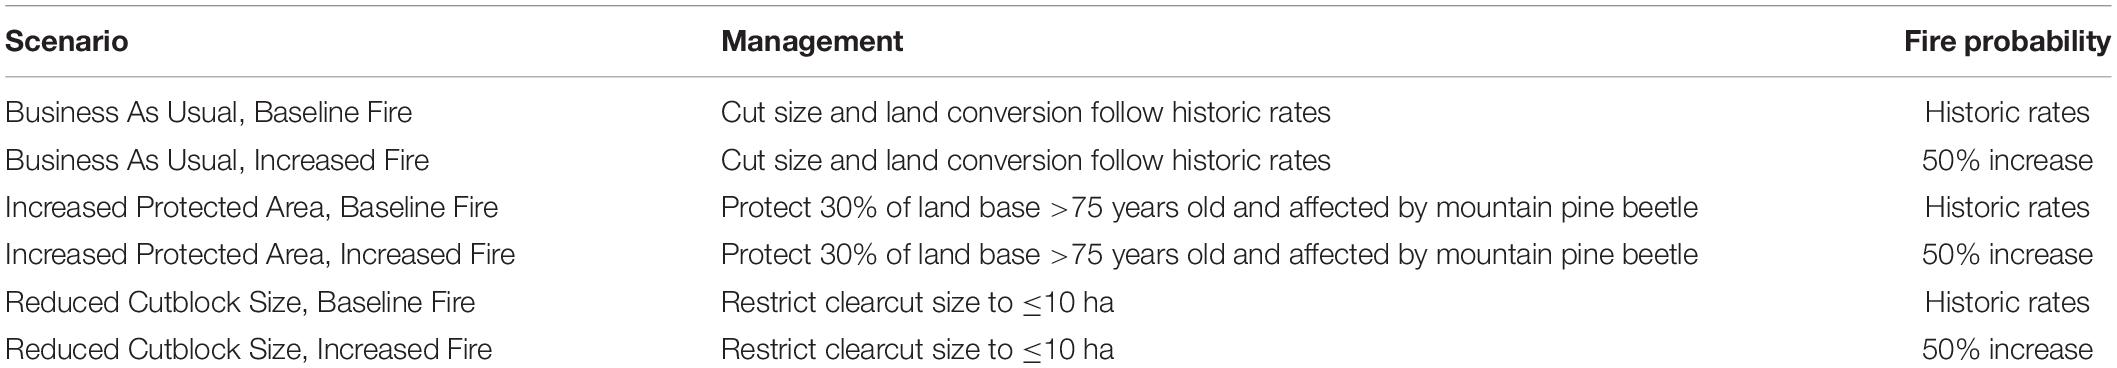
Table 1. Landscape simulation scenarios applied to current landscape in the southern Peace River region of British Columbia, Canada.
Materials and Methods
Study Area
The southern Peace River region of northeastern British Columbia (Dawson Creek Timber Supply Area) covers about 2.6 million ha of boreal forest between the boreal plains in the east and the central Canadian Rocky Mountains in the west (Government of British Columbia, 2013; Supplementary Figure 1). The climate is characterized by cold, prolonged winters and warm, short summers, and the area includes four biogeoclimatic zones: Boreal White and Black Spruce, Engelmann Spruce-Subalpine Fir, Sub-Boreal Spruce, and Alpine Tundra (Pojar et al., 1987). The primary tree species are white spruce (Picea glauca), black spruce (Picea mariana), lodgepole pine (Pinus contorta), subalpine-fir (Abies lasiocarpa), trembling aspen (Populus tremuloides), and balsam poplar (Populus balsamifera); mixed coniferous/broadleaf stands are common. The mean allowable annual cut within the 758,335 ha available for harvest in the Dawson Creek Timber Supply Area was 1.81 million m3 for the study period between 1998 and 2011 (Government of British Columbia, 2014).
Olive-sided Flycatcher Data
We acquired point count datasets from the Breeding Bird Atlas compiled by Birds Canada (2008–2011; BC Breeding Bird Atlas, 2008) and from the Wildlife Species Inventory provided by the BC Ministry of Environment and Climate Change Strategy (1993–2011; Government of British Columbia, 2020a). We included only point counts conducted by a stationary observer over a fixed length of time and geo-referenced within the Dawson Creek Timber Supply Area between 54.5 degrees and 56.5 degrees latitude (Supplementary Figure 1). All point counts were conducted in forested ecosystems (Supplementary Table 1). Some points were missing the spatial coordinates of the observer’s location, but included coordinates for each bird detected. In these cases, we took the centroid of all bird coordinates as the point count location. Combining datasets resulted in some repeated points (same day, location within two point count radii), and these were removed by eliminating the corresponding Breeding Bird Atlas points. Because point count surveys were designed to capture abundance and diversity of multiple species of resident and migratory birds, many were conducted before olive-sided flycatchers arrived from wintering grounds or after their main period of vocal activity. We therefore constrained the dataset to points between 31 May (earliest detection of olive-sided flycatcher) and 29 June (1 day after penultimate detection of 28 June; latest detection was 19 July) for all years (Supplementary Figure 2).
All point counts were conducted between 0400 and 1000 h, but protocols varied with respect to point count radii (80 m, 100 m, 200 m, or unlimited distance) and duration (3, 5, 8, or 10 min per point count). The probability of detecting birds during any given breeding bird survey (detectability) is the product of the singing rate of individuals (availability) and the probability of the observer receiving the cue (perceptibility; Diefenbach et al., 2007). We calculated an offset correction factor (QPAD) by applying previously published estimates of singing rate and effective detection radius for olive-sided flycatcher from a Canada-wide study (Boreal Avian Modelling Project, 2020) to correct our occurrence data according to the survey duration and radius of each count in the R package “qpad” (Sólymos et al., 2013; Sólymos, 2016). We calculated the probability of detection, p = 0.788, and the effective detection radius, EDR = 121 m. Singing rate for this species can decline during the day (i.e., from dawn to afternoon) and as breeding stage advances (i.e., from female arrival through nest building and care of young; Wright, 1997). It is possible that some individuals were missed due to point counts occurring late in the morning or after pair formation; however, we were unable to account for these factors due to limitations in the data.
Land Cover Data
Georeferenced land cover data were acquired from multiple sources and matched to point count locations using the North American Datum 1983 and BC Environment Albers coordinate reference system, in the program ArcGIS (Environmental Systems Research Institute [ESRI], 2015). We used data from the Freshwater Atlas of British Columbia (Government of British Columbia, 2016d) to determine the planar distance from each point count location to the nearest body of water (wetland, lake, or river). We used annual aerial insect surveys (Government of British Columbia, 2020b) to determine the presence and severity of mountain pine beetle infestation at each point count location: zero if no recently killed trees were detected in the polygon, light if 0–10% of trees were recently killed; moderate to very severe if 11–100% of trees were killed (severity classifications; Government of British Columbia, 2019b). We used data from the British Columbia Digital Road Atlas (Government of British Columbia, 2016c) to determine the type of any roads within a 50-m radius of the point count (paved or unpaved road vs. no roads). Trails were not considered as roads. Using British Columbia forest cutblock and fire perimeter data (Government of British Columbia, 2016a, b), we determined size and time since cutting or fire for any cutblock or burned area occurring within a 50-m radius of the point count. Median cutblock size where point counts were conducted was 47 ha and cuts occurred a median of 6 years prior to the point count survey. We had no point counts in recent burns (<15 years old), and thus we were unable to model the direct effects of fire on habitat suitability. Therefore, we assumed that olive-sided flycatchers would respond to forest gaps created by fire in the same way as they responded to gaps created by clearcuts (Altman and Sallabanks, 2020; see Simulation of Future Habitat, below).
Habitat Suitability Models
We analyzed data following the protocol described in Zuur et al. (2010). Since olive-sided flycatcher populations likely vary year-to-year at a regional scale, we included year as a random effect in habitat suitability models. All predictor variables were checked for pairwise correlations before including in the same models, and no pairs exceeded a Spearman’s rank correlation coefficient of 0.5. Habitat suitability models were created and evaluated in RStudio running R version 3.5.3 (R Core Team, 2019). We applied the QPAD offset correction factor to the olive-sided flycatcher occurrence data, so that the response variables produced the probability of occurrence per hectare, while accounting for detection error. Although we had a large sample of point counts (n = 1134), detections of olive-sided flycatcher were sparse (n = 43), and initial attempts to model presence (1) or absence (0) of flycatchers using Generalized Linear Models resulted in complete or quasi-complete separation of the data, with most models failing to converge. We thus employed penalized regression by using the bglmer command in the blme package (Chung et al., 2013) to model presence/absence of olive-sided flycatcher using Bayesian Generalized Linear Models (binomial family, logit link), imposing zero-mean Normal priors (with a standard deviation of 3) on the fixed effects (Bolker, 2015). A standard deviation of 2.5 or 3.5 gave very similar results (Supplementary Figure 3). We specified optimization by quadratic approximation (BOBYQA) with 200,000 iterations.
We were unable to include all potential predictors in a single habitat model because some variables of interest were mutually exclusive (e.g., if a site was uncut there could be no time-since-cut or cut size). We thus divided the dataset according to whether points were located within 50 m of a cutblock (Post-cut) or not (Uncut), and analyzed each subset of the data using a separate set of models. We had no point count data from 1998, 2000, 2001, or 2003–2005, and within each data subset we removed years that had no detections of olive-sided flycatcher, so the resulting post-cut dataset included 5 years (1997, 2002, 2007, 2008, 2010) and the uncut dataset included 6 years (2006–2011). We compared models within each model set using an information theoretic approach, to find combinations of habitat factors that best explained variation in olive-sided flycatcher occurrence. We scaled continuous variables to have a mean of 0 and a standard deviation of 1. In both model sets we included models with fixed effects of roads and distance to water. The first model set, Post-cut, additionally included cut size, time since cut, and their quadratic effects. We restricted these data to points in cutblocks <300 ha, to avoid undue influence of extremely large cutblocks where olive-sided flycatchers were never detected, and to reflect the natural range of variation in cutblock size found in areas with high densities of olive-sided flycatchers (the species occurs in cutblocks ranging in size from 0.005 to 284 ha; Norris and Martin, unpublished data). Restricting the data to cutblocks <300 ha did not impact the sign or significance of the coefficient of cut size on the probability of detection, but reduced the magnitude of the coefficient; further restricting the data to cutblocks <150 or <100 ha had little effect on the results (see Supplementary Figure 4). The second model set, Uncut, included mountain pine beetle as a fixed effect (in addition to roads and distance to water). Within each set, we compared models using Akaike’s Information Criterion corrected for small sample size (AICc) and Akaike weights, and considered models to be plausible if they fell within two AICc points of the lowest AICc model. We calculated the area under the curve of the receiver operating characteristic (AUC) using the performance command in the ROCR package to evaluate classifier performance independent of cutoff values (Sing et al., 2005). AUC ranges from 0 to 1, where a value of 1 indicates perfect prediction, and a value of 0.5 indicates prediction no better than random; we considered models with AUC > 0.7 to have acceptable predictive ability (Hosmer et al., 2013).
Parameter estimates in our models were the natural logarithm of the odds ratios. The odds ratio for each parameter indicates the change in odds of occurrence of olive-sided flycatchers associated with a one unit increase in the (scaled) predictor variable (Crawley, 2007). We examined odds ratios and their 90% Wald confidence intervals for all parameters in all models. For prediction of olive-sided flycatcher occurrence, we looked within the subset of plausible models (ΔAICc < 2) with acceptable predictive ability (AUC > 0.7) for each set, and chose the simplest model that included all of the parameters (from the model set) whose odds ratios had confidence intervals that did not overlap 1.
Landscape Simulation Models
To forecast the future cumulative effects of multiple stressors on habitat, we first developed a spatially explicit model of land use and land cover change for the study area. We then processed the spatial model projections through the habitat models described in the previous section to produce spatial habitat projections. We used the ST-Sim package (version 3.2.21) for SyncroSim (version 2.2.27; ApexRMS, 2021) to construct a state-and-transition simulation model (Daniel et al., 2016) that simulated future land use and land cover change within the study area from 2020 to 2050. The simulation study area encompassed a landscape just under three million hectares in size, subdivided into nearly 3.7 million 90 × 90-m simulation cells. We stratified the landscape according to both ecological characteristics (British Columbia Biogeoclimatic Ecosystem Classification zone and subzone; Government of British Columbia, 2011) and jurisdiction (private, protected, or land managed primarily by the provincial government; Government of British Columbia, 2020d). Both types of stratification affected transition rates in the model. Ecological and jurisdictional strata were static in their location within each model simulation, although the location of jurisdictional strata varied among simulation scenarios (i.e., the location of protected areas). In addition to stratification, the landscape was classified according to eleven possible dynamic state classes: cropland, developed (urban or industrial), grassland, barren (i.e., rock, ice), water, wetland and five classes of forest (Figure 1). The five forest classes were: forest stands having recently experienced a moderate to very severe mountain pine beetle outbreak (classified as pine), pine stands having recently experienced a clearcut or burn, undisturbed pine stands, non-pine stands having recently experienced a clearcut or burn, and undisturbed non-pine stands. Pine stands are those vegetated polygons defined as having experienced, at any time, a moderate to very severe mountain pine beetle outbreak or where >10% of trees are pine (Government of British Columbia, 2018). To simulate transitions between state classes, the state-and-transition simulation model included the following transition types: clearcut logging, wildfire, urbanization, and agricultural expansion.
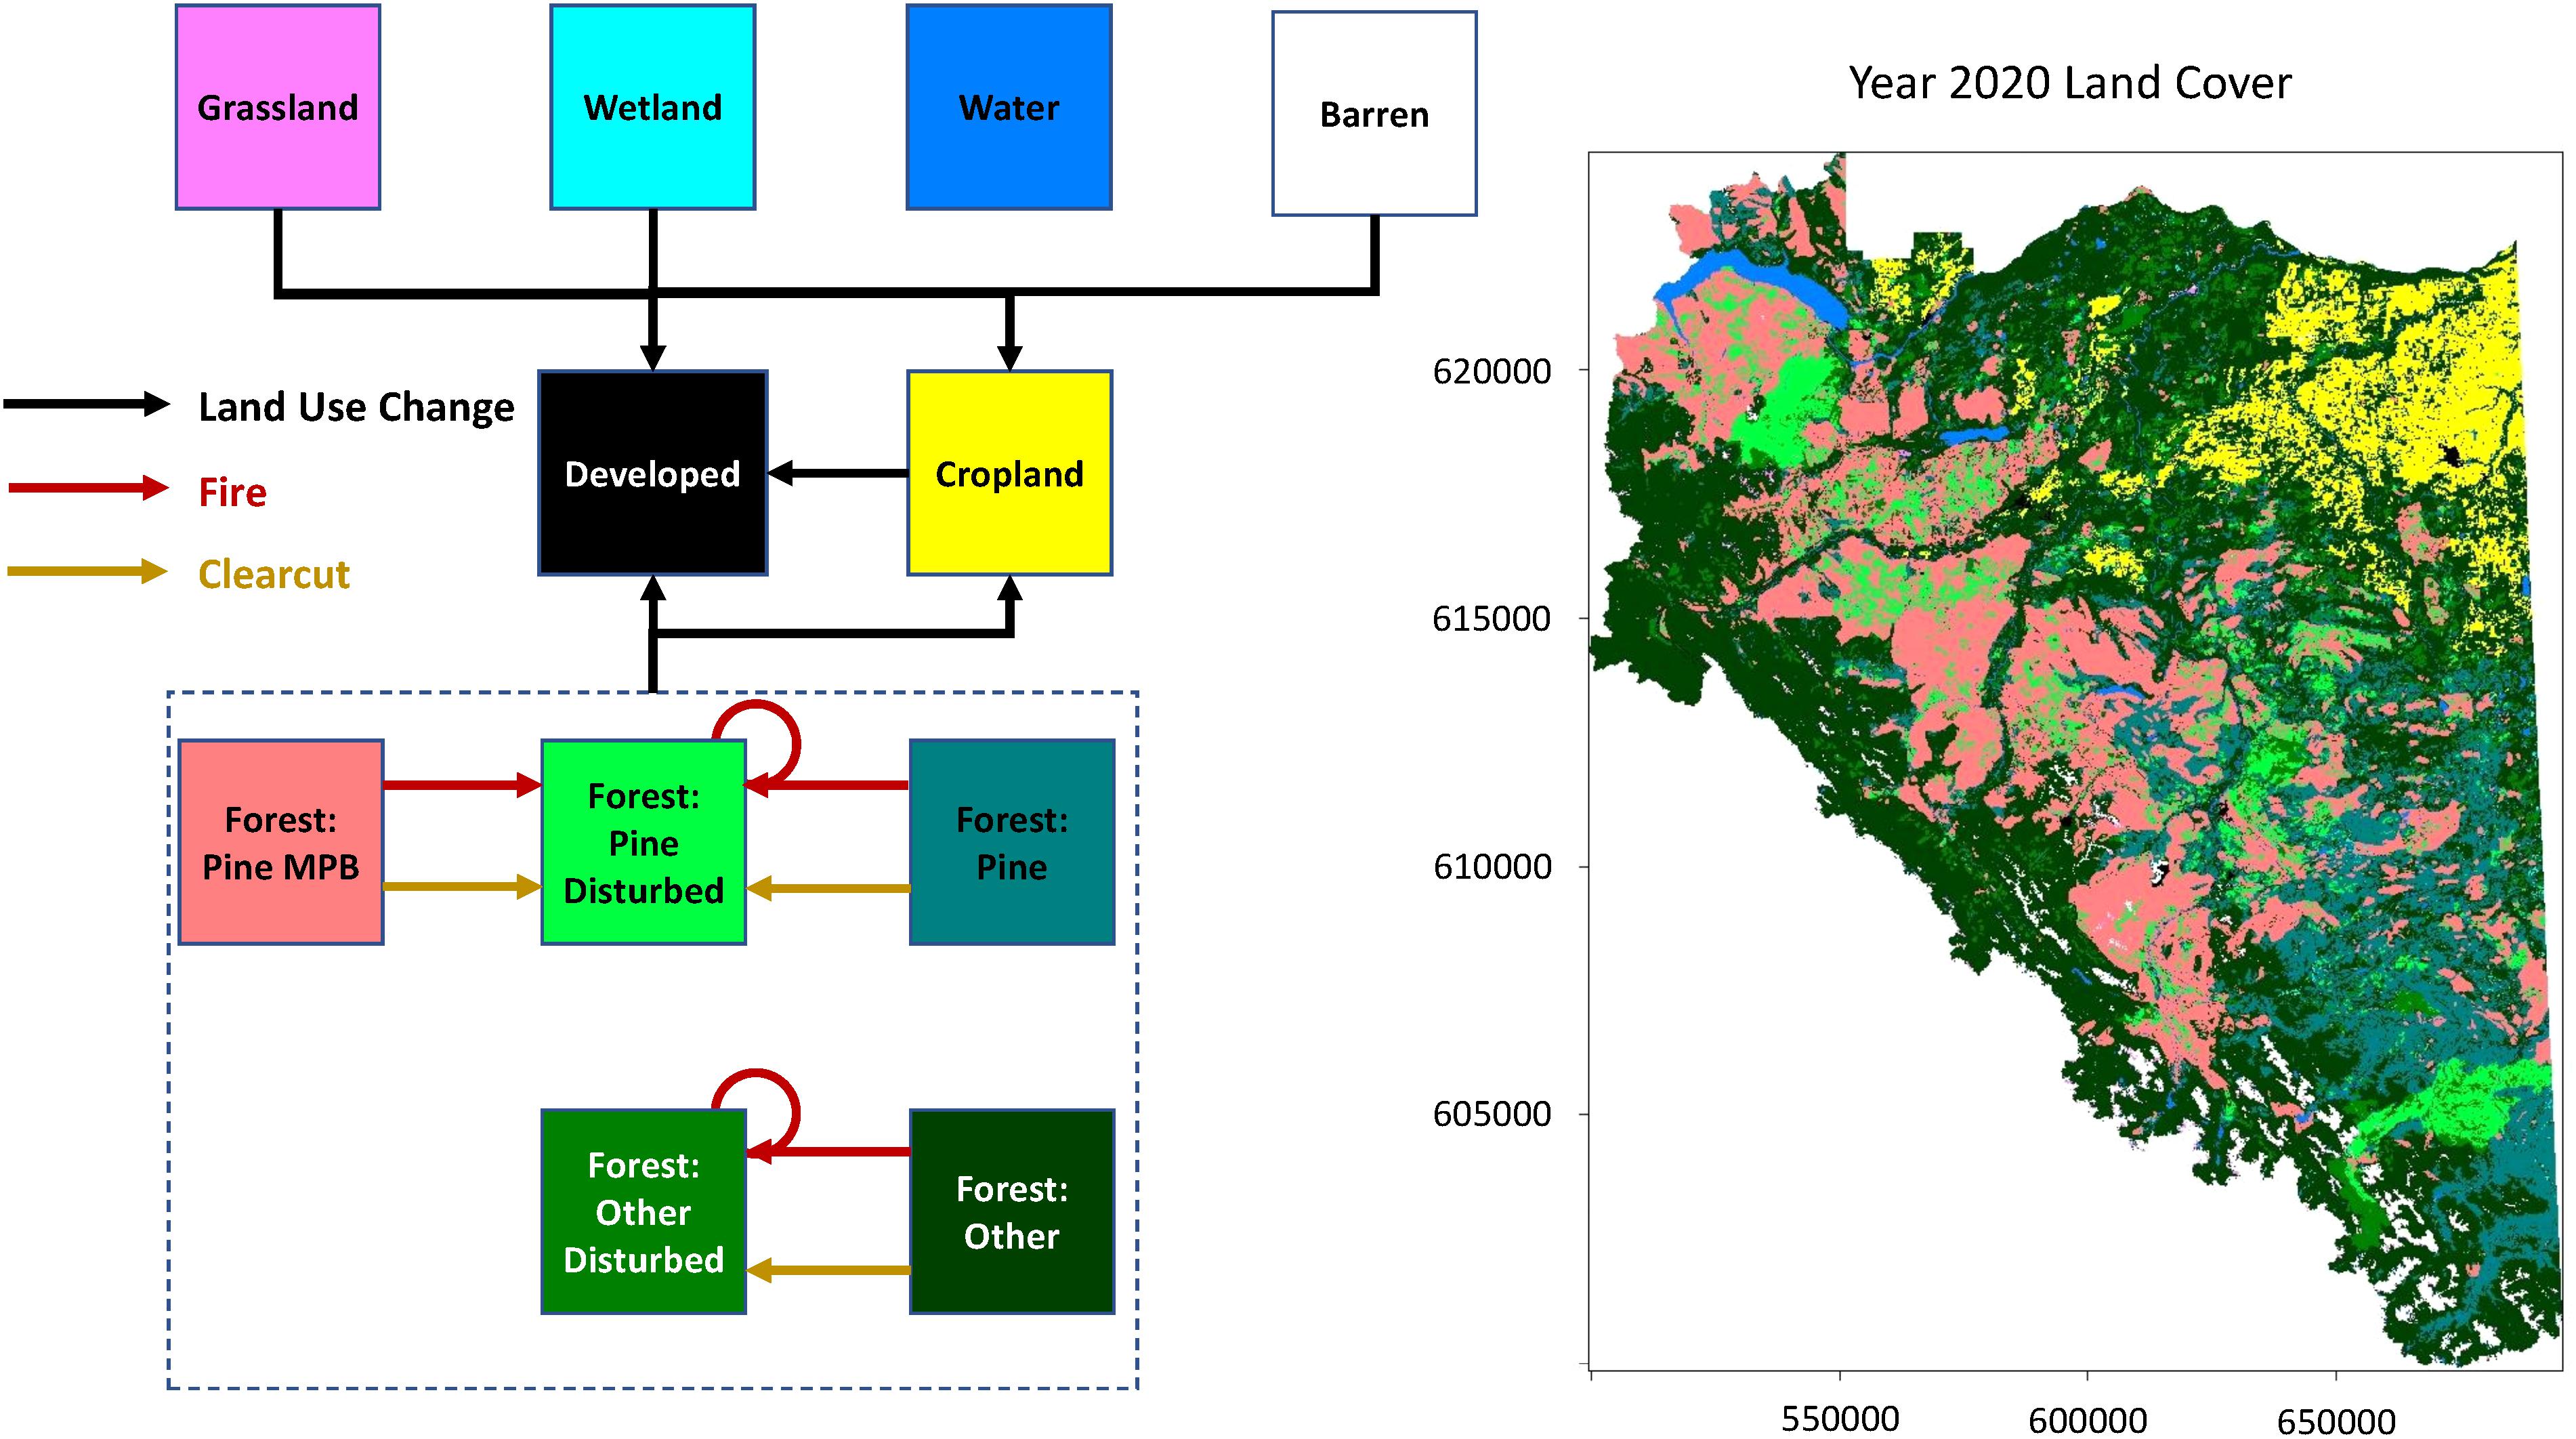
Figure 1. Transition diagram for state-and-transition simulation model for the Dawson Creek Timber Supply Area in the southern Peace River region of British Columbia, Canada. Squares indicate states, and arrows indicate possible transitions between states. Broken rectangle encompasses all forest states, all of which can transition to developed land or cropland via land use change. Map of study area shows land cover in 2020.
State variables for each simulation cell were initialized for 2020 by extracting land cover class (Figure 1) from The Agriculture and Agri-Food Canada 2010 Land Use Map (Government of Canada, 2010); Biogeoclimatic Ecosystem Classification subzone, forest age, and forest composition from The Vegetation Resources Inventory (Government of British Columbia, 2018); jurisdiction class (private, protected, or other provincially managed land) from The British Columbia Parcel and Conservation Lands Maps (Government of British Columbia, 2020c); beetle-attack status from the annual aerial insect surveys (Government of British Columbia, 2020b); burned status from the British Columbia Historical Fire Perimeters Map (Government of British Columbia, 2016a); and cut status from the Consolidated Cutblocks Map (Government of British Columbia, 2016b). Simulation cells having experienced a clearcut in any year were classified as clearcut when initializing the landscape for 2020. Wildfire events, which tend not to affect all trees in a stand, were not considered in our 2020 landscape initialization if the burn was >40 years old. Finally, simulation cells having previously experienced both fire and a mountain pine beetle infestation of moderate or greater severity were initialized using the most recent of the two disturbance events.
Historic urbanization and agricultural expansion rates (ha per year) were estimated using the difference between the Agriculture and Agri-Food Canada 2010 and 2000 Historical Land Use Maps (Government of Canada, 2010). In our simulations, these annual rates were assumed to continue from 2020 through 2050. Urbanization and agricultural expansion transitions were constrained within the model to only occur on cells adjacent to the developed (urbanization) and cropland (agricultural expansion) state classes. The probability of these transitions increased linearly with the number of neighboring cells in the destination state class.
Historic logging rates (ha per year) were estimated using the Consolidated Cutblocks Map from the year 2000 to 2018 (Government of British Columbia, 2016b). Area logged was stratified by Biogeoclimatic Ecosystem Classification subzone and jurisdiction (private, protected and provincially managed). For each model realization and time step, we sampled a year between 2000 and 2018 and then applied the historic logging rate for that year to that future simulation time-step according to Biogeoclimatic Ecosystem Classification subzone and jurisdiction. In this way, we maintained within-year correlations in the amount of logging across Biogeoclimatic Ecosystem Classification subzones and jurisdictions.
Annual fire probabilities (stratified by Biogeoclimatic Ecosystem Classification subzone) were estimated using the British Columbia Historical Fire Perimeters Map (Government of British Columbia, 2016a) using the ratio of area burned to area available to burn each year and averaged across all years in the fire history. In addition, we calculated the historic normalized area burned each year across the landscape for each historic year and sampled from this distribution as a multiplier against the base fire probability for each model time-step and realization, thus including a level of variability in our projections that is comparable to what was observed historically.
Fires and clearcuts were both simulated as spatial events using size distribution estimated using the corresponding historic perimeters. For fire sizes, we sampled from the entire historic distribution of fire size. For clearcut sizes, we sampled from historic cutblock sizes starting in the year 2000. We also simulated two scenarios where cutblocks were constrained to a maximum size of 10 ha. Because mountain pine beetle outbreaks are expected on a ∼50-year cycle, and the most recent outbreak occurred after 2000, we did not simulate new outbreaks before 2050. Forests classified as beetle-attacked in 2020 remained as beetle-attacked forests until they transitioned to cleared forest through clearcutting or wildfire.
Simulation Scenarios
We ran six simulation scenarios representing the combination of three management alternatives (“Business As Usual,” “Increased Protected Area,” and “Reduced Cutblock Size”) and two fire alternatives (“Baseline Fire” and “Increased Fire”). The Business As Usual scenarios applied historic rates and spatial patterns of land use and logging. The Increased Protected Area scenarios increased protected areas from 13% to 30% of the land base by adding provincially managed land that was unprotected in 2020, and was covered by forest older than 75 years of age having experienced a moderate to very severe mountain pine beetle infestation. We considered older forest and forest affected by mountain pine beetle to be high quality habitat for insectivorous forest birds (Mahon et al., 2014; Saab et al., 2014). The protected area figure reflects Canada’s goal of protecting 30% of habitat by 2030 (Government of Canada, 2019). The Reduced Cutblock Size scenarios constrained clearcuts to a maximum size of 10 ha but maintained the historic distribution of area logged. We applied fire probabilities at the historic rate (Supplementary Table 2) for the Baseline Fire alternative, and at 150% of the historic rate for the Increased Fire alternative, according to likely future scenarios of climate-induced fire frequencies (Wootton, 2010). Each model scenario was replicated with 100 Monte Carlo realizations.
Simulation of Future Habitat
Once simulations were complete, we created 600 maps projecting habitat suitability for olive-sided flycatcher in 2050 (six scenarios × 100 Monte Carlo realizations) by processing the spatial model projections through the top-ranked habitat suitability models for cut and uncut sites, respectively (Table 2). For each realization, we sampled from the distribution estimated for the parameters of the selected habitat suitability model to account for uncertainty around model parameters. Thus, variation in the results of projected habitat suitability reflects both uncertainty in the simulations of land cover, and uncertainty in the parameters of habitat suitability models for olive-sided flycatcher. We were unable to include fire history as a predictor in our habitat models, so we assumed that the probability of olive-sided flycatcher occurrence in burned areas was equivalent to the probability of occurrence in a clearcut of the same size and age (i.e., olive-sided flycatchers tend to be associated with forest gaps created by fire and/or tree removal; Altman and Sallabanks, 2020). Habitat suitability (ha) was calculated as the sum product of cell area and probability of occurrence for each year and Monte Carlo realization. Percent change in habitat suitability was calculated as the difference between habitat suitability in 2020 vs. 2050, divided by habitat suitability in 2020 and multiplied by 100. Simulated habitat suitability in 2020 varied slightly across scenarios (Supplementary Table 4) because for each Monte Carlo realization we sampled the habitat model parameters from their estimated distributions to calculate habitat at the start (2020) and end (2050) of that realization. We then calculated the habitat change from 2020 to 2050 for each Monte Carlo realization before summarizing percent change in habitat (Supplementary Table 4). Information on accessing model datasets is available in the Supplementary Materials.
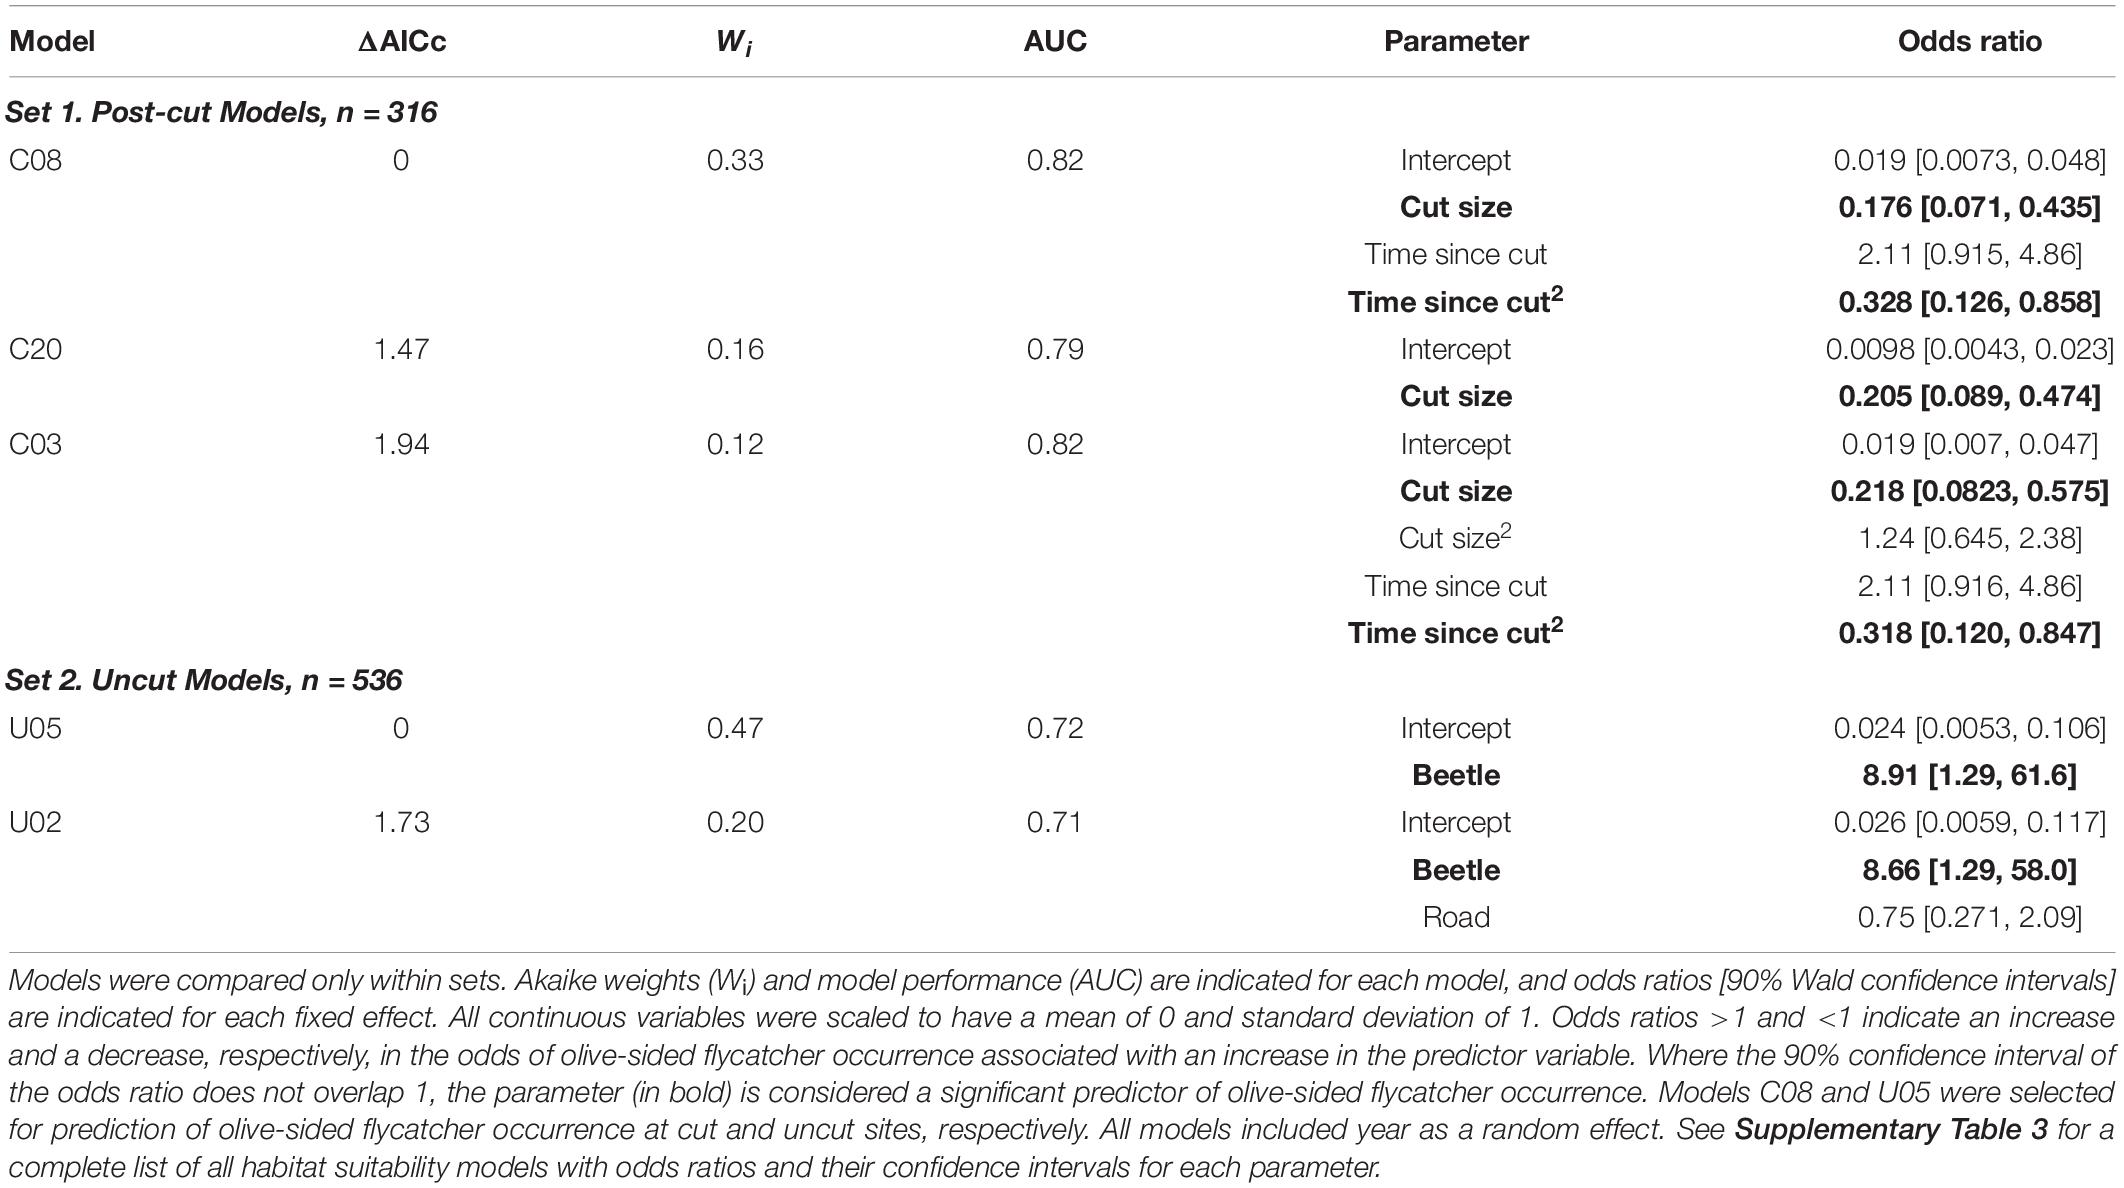
Table 2. Plausible (ΔAICc < 2) habitat suitability models (Bayesian Generalized Linear Mixed Models) for olive-sided flycatcher in two sets: (1) Post-cut, and (2) Uncut.
Results
Habitat Suitability for Olive-sided Flycatcher
In the first set of habitat suitability models (Post-cut models), plausible models included clearcut size and a quadratic effect of time since cut as predictor variables for which the 90% confidence intervals on the odds ratios did not overlap 1 (Table 2 and Supplementary Table 3). According to the top-ranked model in this set, the probability of olive-sided flycatcher occurrence declined with increasing cutblock size (Table 2 and Figure 2A), an effect that was robust across candidate models (Supplementary Table 3) and also robust to the exclusion of extreme values of fixed effects (cut size and time since cut; Supplementary Figure 4). Probability of olive-sided flycatcher occurrence was highest for mid-aged clearcuts (10–20 years old); confidence intervals on the odds ratio were large but did not overlap 1 (Table 2 and Figure 2B), and again this effect was robust across candidate models and robust to the exclusion of extreme values of fixed effects (Supplementary Table 3 and Supplementary Figure 4). Year (random effect) had a small effect on olive-sided flycatcher occurrence (SD = 0.53, vs. parameter estimates of −1.74 for cut size, 0.75 for time since cut, and −1.11 for [time since cut]2; Supplementary Figure 5). Among the models in the second set (Uncut), mountain pine beetle was the only parameter for which the confidence intervals on the odds ratio did not overlap 1 (Supplementary Table 3). According to the top-ranked model in this set, points with moderate to very severe mountain pine beetle had 8.9 times the odds of olive-sided flycatcher occurrence, compared to points with no or light amounts of mountain pine beetle; again, confidence intervals on the odds ratio were large but did not overlap 1 and the effect was robust across candidate models in the set (Table 2, Figure 2C, and Supplementary Table 3). Year (random effect) had an effect on olive-sided flycatcher occurrence of similar magnitude to the fixed effect of mountain pine beetle (SD = 1.83 for year, vs. parameter estimate of 2.19 for beetle; Supplementary Figure 5).
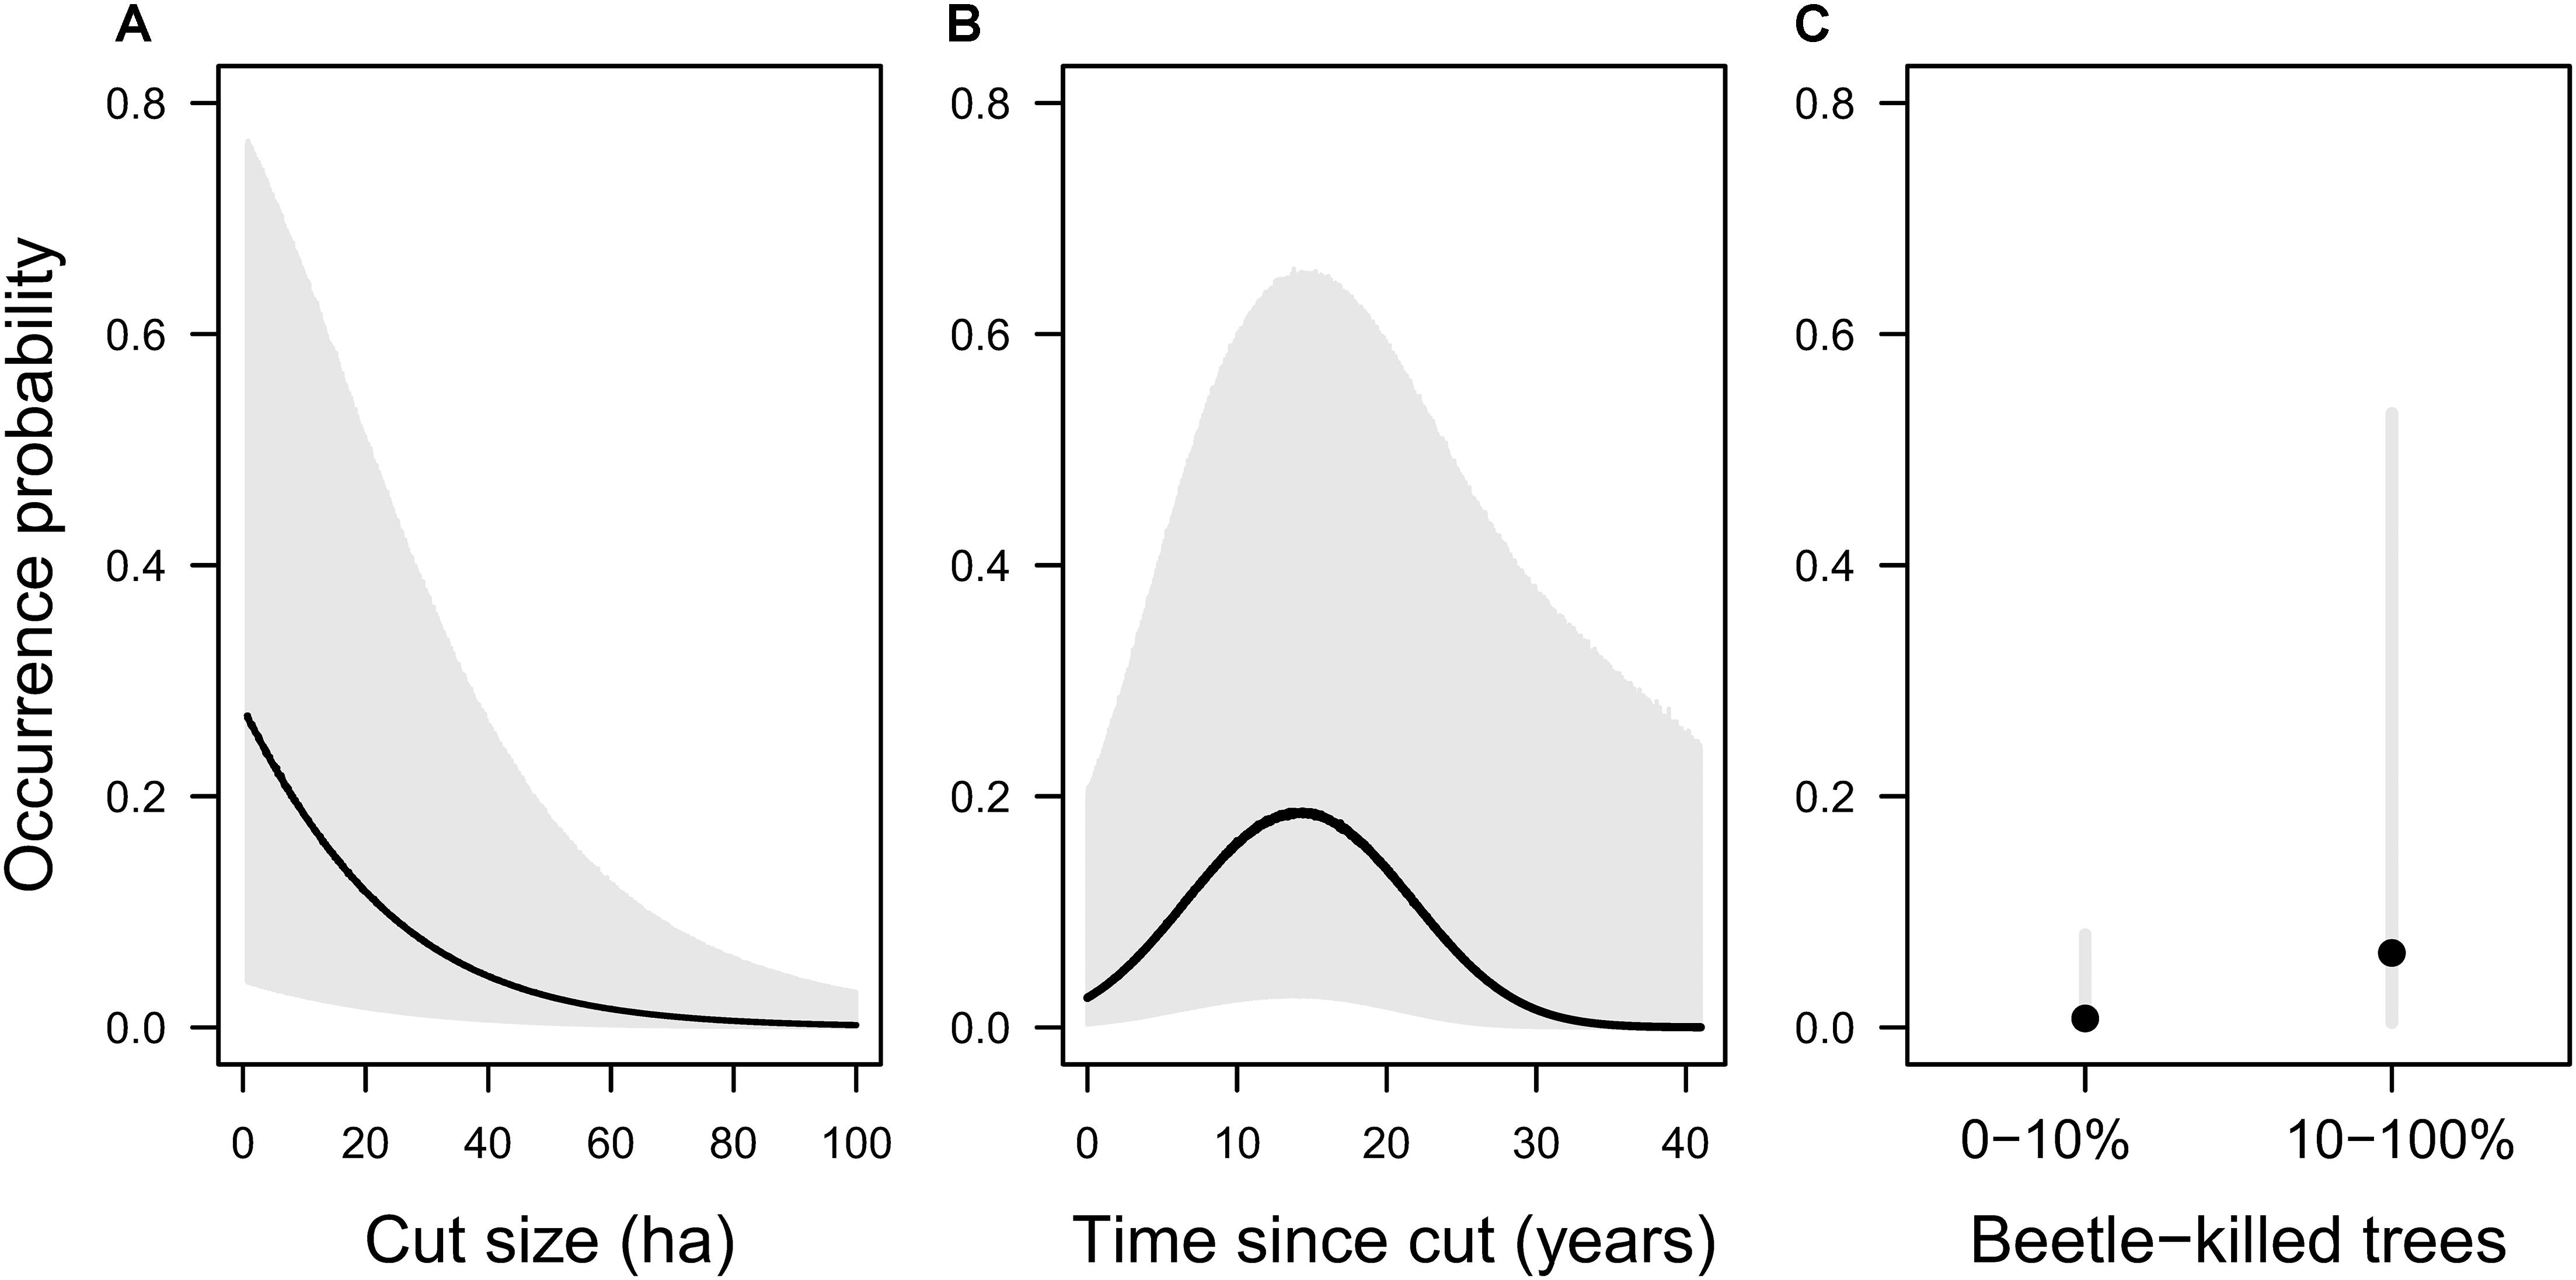
Figure 2. Probability of olive-sided flycatcher occurrence (black) with 90% prediction intervals (gray) according to top-ranked models. (A,B) Top ranked model in the first set (Post-cut), for points within 50 m of a clearcut: Occurrence ∼ Cut size + Time since cut + Time since cut2 + 1| Year. (C) Top-ranked model in the second set (Uncut), for points >50 m from a clearcut: Occurrence ∼ mountain pine beetle + 1| Year). We allowed (A) cut size, (B) time since cut, and (C) mountain pine beetle, to vary, while holding the other fixed effects near their optima (A: time since cut = 15 years, B: cut size = 10 ha). The predicted value and prediction interval for each value of the predictor variables represents the mean of 50,000 simulations using the predictInterval command in the merTools package of R, and includes the uncertainty related to residual variance, the uncertainty in the fixed coefficients, and some of the uncertainty in the variance parameters for the random effect of year (Knowles and Frederick, 2020).
Landscape Conditions and Projected Change
Within the study area, Vegetation Resources Inventory data (Government of British Columbia, 2018) were available for three million ha, of which approximately 2.6 million ha were forested in 2020. Historic logging rates (2000–2018) were 7744 ± 566 ha/year (mean ± SE) with a mean cutblock area of 30 ± 0.61 ha (range: <1–405 ha). Mean annual historic fire probability varied by subzone within the Biogeoclimatic Ecosystem Classification, from 0.00005 (fire every 20,000 years) in the Engelmann Spruce Subalpine Fir wet cold parkland zone to 0.0029 (fire every 345 years) in the Boreal White and Black Spruce moist warm zone; Supplementary Table 2). Twelve percent of the land was under private jurisdiction, 13% was in protected areas, and 75% was land managed primarily by the provincial government.
On average, our scenarios projected that a cumulative area of ∼405,000 ha (16% of current forest) would be burned or cut between 2020 and 2050, if historic levels of fire are maintained, versus ∼462,000 ha (18% of current forest) under the alternative of a 50%-increased fire probability (Supplementary Table 4). The Business As Usual with Baseline Fire scenario resulted in the smallest cumulative area of forest burned or cut (median 387,434 ha, 95% CI: 311,425, 523,908), and the Reduced Cutblock Size with Increased Fire scenario led to the largest cumulative area of forest burned or cut (median 493,264 ha, 95% CI: 329,357, 570,488; Supplementary Table 4).
Projected Change in Olive-sided Flycatcher Habitat
Overall, probability of olive-sided flycatcher occurrence was highest in the forests surrounding the Rocky Mountains, where much of the forest was affected by mountain pine beetle (Figure 3). Estimated habitat suitability across the landscape was 182,473 ha in 2020 (see Supplementary Table 4 for details), and by 2050 it was projected to decrease by 16.4% (median of 100 Monte Carlo realizations) under the Business As Usual scenario with Baseline Fire, and by 18.1% under the Increased Fire alternative (Figures 3, 4). Under the Increased Protected Area alternative, median habitat suitability was projected to decrease by 10.6% with Baseline Fire, and by 12.5% with Increased Fire (Figures 3, 4). Almost all Monte Carlo realizations for the Business As Usual and Increased Protected Area scenarios projected declines in habitat suitability (Figure 4). Results of the Reduced Cutblock Size scenarios were highly variable among Monte Carlo realizations, resulting in confidence intervals for change in habitat suitability that overlapped zero, but, for most realizations, large declines in habitat suitability were not projected under these scenarios (median habitat loss of 4.0% under the Baseline Fire alternative, and 5.6% under the Increased Fire alternative; Figures 3, 4). Uncertainty in the projected change in habitat suitability was greatest for the Reduced Cutblock Size scenarios (Figure 4).
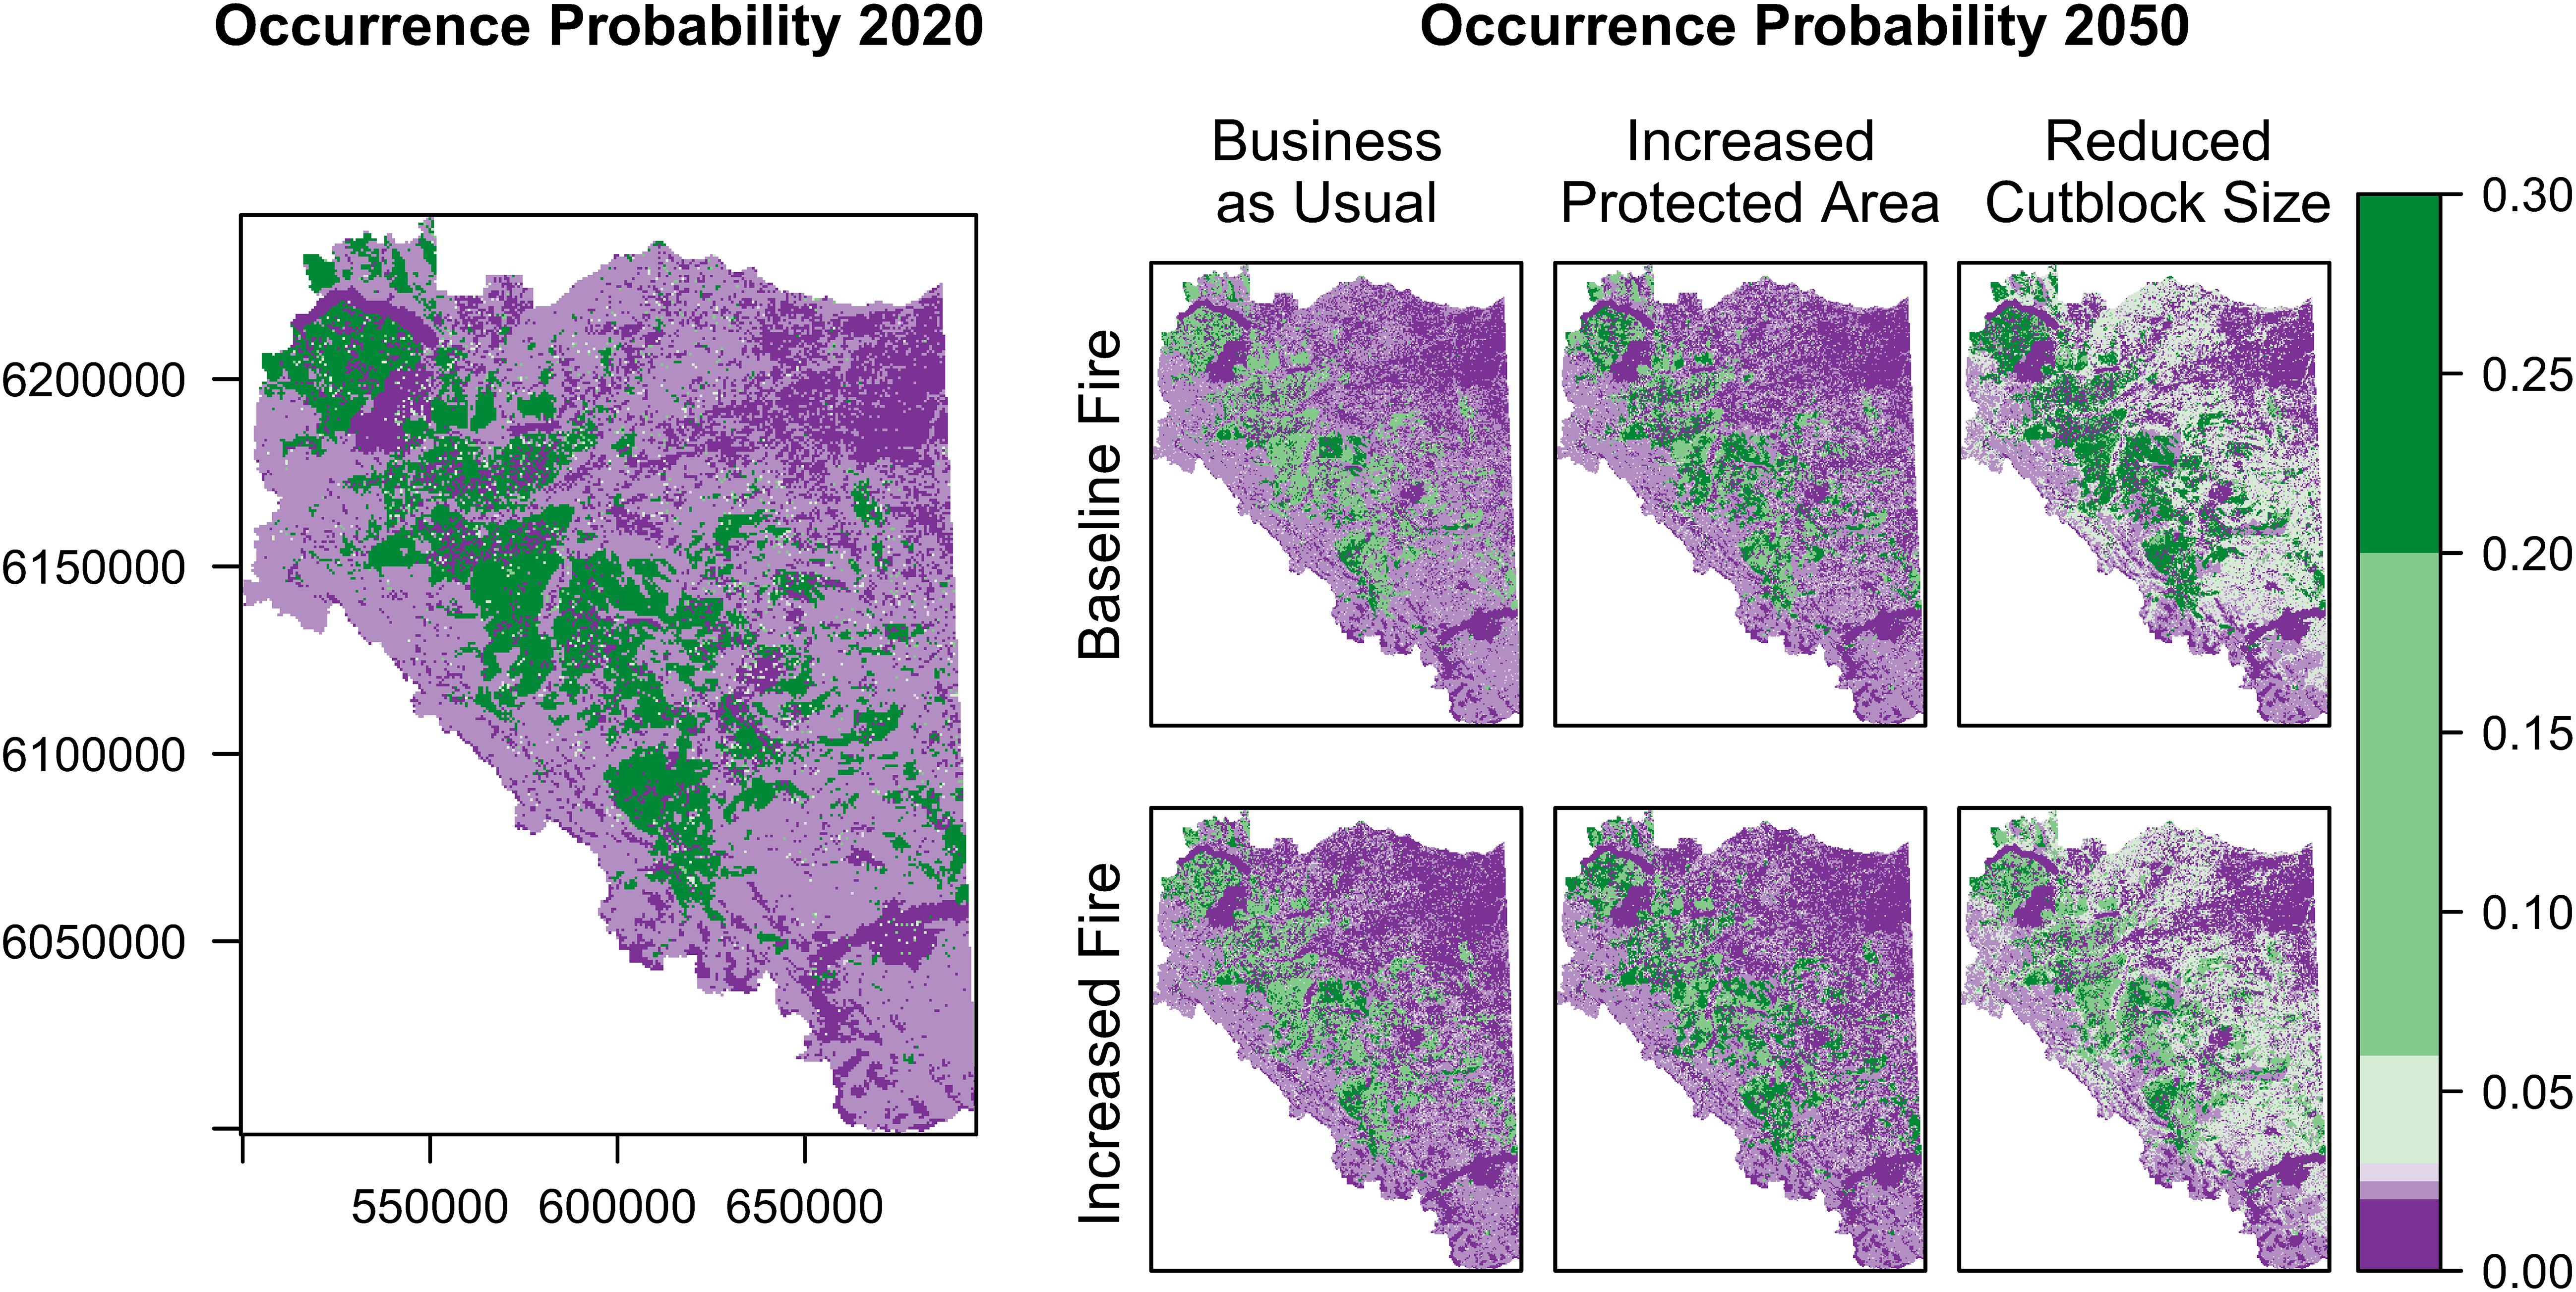
Figure 3. Occurrence probability of olive-sided flycatchers across the southern Peace River region of British Columbia, based on habitat suitability indices derived from parameter estimates of top-ranked habitat suitability models C08 and U05 (Table 2). Values closer to 1.0 (green) indicate the most suitable habitat and values closer to 0 (purple) indicate the least suitable habitat. The 2020 map shows probability of olive-sided flycatcher occurrence under current conditions, including recent mountain pine beetle outbreaks. The 2050 maps show future expected probability of olive-sided flycatcher occurrence, given projected forest harvesting, wildfires, urbanization, and agricultural expansion, under six scenarios that combined three management alternatives with two wildfire alternatives. Management alternatives were: Business As Usual, Increased Protected Area (protected areas increased from 13% to 30% of land base), and Reduced Cutblock Size (size of clearcuts limited to 10 ha). Wildfire alternatives were: Baseline Fire (fire frequency maintained at historic levels) and Increased Fire (50% increase over historic levels). Results are limited to three million ha for which data were available. The Rocky Mountains run northwest to southeast across the study area.
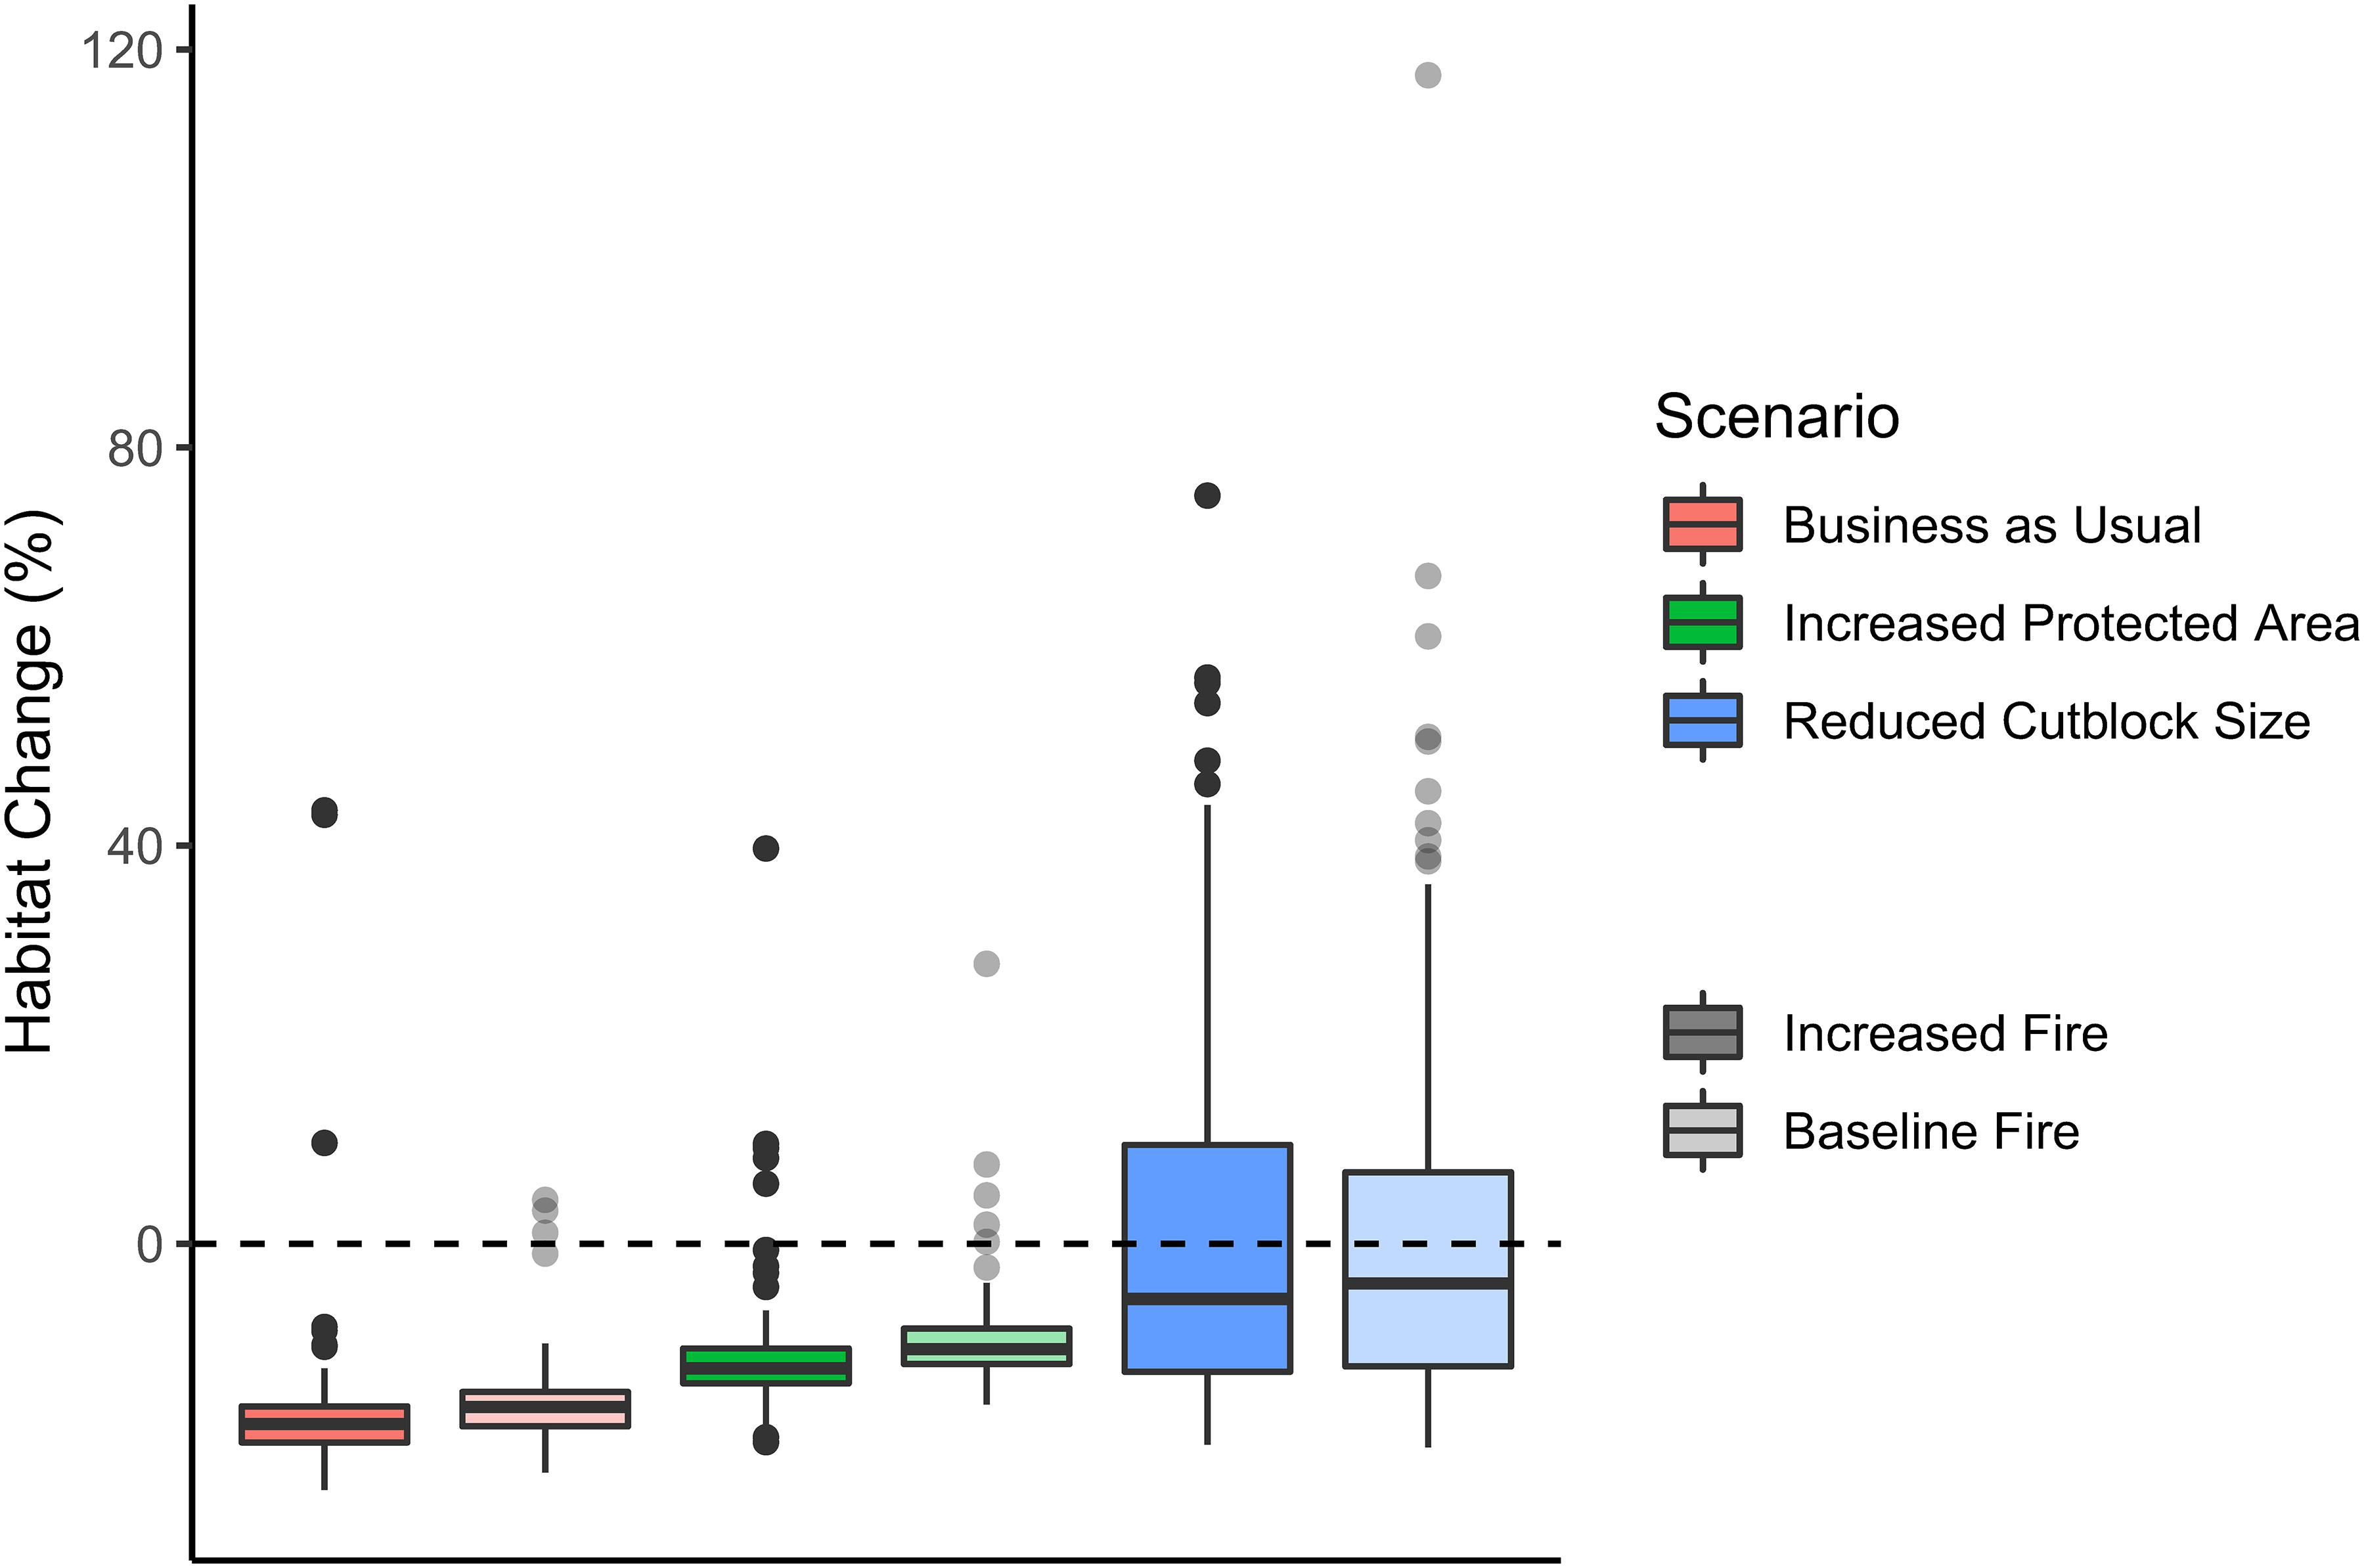
Figure 4. Percent change in habitat suitability for olive-sided flycatchers from 2020 to 2050 across the southern Peace River region of British Columbia under six scenarios of landscape change. Habitat suitability was calculated for 2020 and 2050 by multiplying the projected probability of olive-sided flycatcher occurrence (per ha) for each simulation cell by the area of the cell (0.81 ha) then summing over all cells. Percent change in habitat suitability was the difference between suitable habitat in 2020 vs. 2050, divided by suitable habitat in 2020 and multiplied by 100. Thick black bars indicate the median % habitat change from 100 Monte Carlo realizations, boxes indicate the 1st and 3rd quartiles, whiskers extend to the maximum and minimum values within 1.5× the interquartile range, and points indicate the results of simulations that fell outside of this range. Variation in the projected change in habitat suitability within each scenario reflects both uncertainty in the simulations of land cover, and uncertainty in the parameters of habitat suitability models for olive-sided flycatcher. Darker shades of color indicate Increased Fire scenarios (50% increase in fire frequency), and lighter shades indicate Baseline Fire scenarios (fire frequency remained at the historic average).
Within each scenario, the direction of change in suitable habitat (increase or decrease) was consistent across subzones within the Biogeoclimatic Ecosystem Classification (Supplementary Figure 6). When we examined habitat changes according to jurisdiction, we found that the Reduced Cutblock Size scenarios reduced habitat loss (compared to other scenarios) primarily on land managed by the provincial government (Supplementary Figure 7). Within protected areas, there were no major differences across scenarios, and overall projected loss in future habitat was less than the loss projected for private and provincially managed land.
Discussion
We assessed current and future habitat suitability for declining populations of olive-sided flycatchers considering the cumulative effects of multiple stressors in the southern Peace River region of British Columbia. The quantity of suitable habitat for olive-sided flycatchers is likely to decline in the next 30 years, in the absence of changes to current forest management policies. Consistent with our predictions, olive-sided flycatcher occurrence was correlated positively with small, 10- to 20-year-old clearcuts and moderate to very high severity mountain pine beetle outbreaks. Contrary to our predictions, olive-sided flycatcher occurrence was not correlated with distance to roads or wetlands. State-and-transition simulation models projected declines in suitable habitat if current management continues (Business As Usual alternative), and even if protected areas are increased to 30% (Increased Protected Area alternative). Increased wildfire under current Business As Usual and Increased Protected Area scenarios would amplify these declines in habitat suitability. Many static conservation approaches for at risk species spend limited conservation dollars to increase the size of protected areas, potentially increasing the intensity and scope of forest harvesting outside of protected areas. Our results suggest that in this portion of the olive-sided flycatcher’s range, changes to forest management outside of protected areas will also be critical, and require implementation of harvesting alternatives such as restricting clearcut size to ≤10 ha to help limit projected declines in habitat suitability under baseline fire conditions. While we found considerable variability in the projected habitat change under the Reduced Cutblock Size scenario, significantly reducing clearcut size could function as an ‘other effective area-based conservation measure’ (OECM) to help stem the steep continental declines of this neotropical migrant (Rosenberg et al., 2016; Watson et al., 2016).
Cumulative Effects of Stressors on Availability of Suitable Habitat
Our result that olive-sided flycatchers were associated with small clearcuts and mountain pine beetle is consistent with other studies, in which olive-sided flycatchers were associated with forest openings, where they may find increased foraging opportunities (Robertson and Hutto, 2007; Bale et al., 2019; Westwood et al., 2019; Altman and Sallabanks, 2020). Olive-sided flycatchers can adapt to, and likely select for, small-scale human-induced changes such as small patch forest cutting and/or small-scale fires (Altman and Sallabanks, 2020) as were traditionally applied by Indigenous peoples before European colonization of the southern Peace River region (Gillies, 2015). However, the amount of habitat suitable for olive-sided flycatcher was projected to decline under both Business As Usual and Increased Protected Area scenarios, especially if fire frequency increases, indicating a cumulative effect of larger-sized clearcutting and climate change on habitat loss.
The best scenario for reducing habitat loss was limiting cutblock size to 10 ha, while fire was maintained at historic levels. However, assuming environmental stability when designing conservation networks and developing individual site-management strategies is inappropriate (Hole et al., 2011) and projections assuming baseline historic fire conditions may be overly optimistic, considering future climate projections (Wootton, 2010). Further, we simulated future fire frequencies using only the IPCC-A2 emissions scenario, which was predicted to be the most likely climate scenario. Habitat projections would differ if emissions are less than, or surpass expected levels, and fire frequency is subsequently higher or lower than anticipated in our models. To optimize the future effectiveness of a conservation network, planning frameworks must address the long-term value of individual sites and resilience of the network as a whole to climate change (Hole et al., 2011). In a cumulative effects assessment for northeastern Alberta, olive-sided flycatchers were associated with recently burned forest and were projected to increase slightly in abundance over 50 years under harvesting scenarios that resulted in an overall increase in forest age; however, consistent with our findings, the projected increases were lessened by increased fire frequencies expected as a result of climate change (Leston et al., 2020). As the frequency of fires increases across the western boreal forest, maintaining suitable habitat for olive-sided flycatchers in the southern Peace River region seems possible only by reducing allowable annual cut in the Dawson Creek Timber Supply Area. Future work should include scenarios that reduce the total allowable annual cut, to determine the amount of area that is required to compensate for the losses in forest habitat due to expected climate-induced wildfires. Future management of breeding habitat for olive-sided flycatchers should support efforts to reduce greenhouse gases that contribute to climate change, restrict the size of clearcuts, and incorporate the traditional Indigenous land-use practices of creating small forest openings (Gillies, 2015).
Conservation Prospects
Canada-wide population declines of olive-sided flycatcher have slowed recently, from 80% decline between 1973 and 2009, to 19% between 2006 and 2016 (Committee on the Status of Endangered Wildlife in Canada [COSEWIC], 2018). The greatest regional-level decreases occurred west of the Rocky Mountains, in British Columbia, where breeding densities are highest (Committee on the Status of Endangered Wildlife in Canada [COSEWIC], 2018; Boreal Avian Modelling Project, 2020). However, following IUCN criteria of ≤30% decline across three generations (10 years for birds) across Canada, olive-sided flycatcher was recently recommended for down-listing from “Threatened” to “Special Concern” (Committee on the Status of Endangered Wildlife in Canada [COSEWIC], 2018). Although its legal status has not yet changed under the Canadian federal Species at Risk Act (Government of Canada, 2002), a down-listing to Special Concern removes the requirement to identify critical habitat for federal protection. The current short-term population objective for olive-sided flycatcher in Canada is to halt the national decline by 2025 while ensuring the population does not decrease more than 10% over this time, and the long-term (after 2025) population objective is to ensure a positive 10-year population trend (Government of Canada, 2016). Our simulations of breeding habitat indicate that current management practices are not likely halting population declines in Northeastern British Columbia, and it will be difficult to reverse declines in breeding habitat over the next 30 years, even under the best-case scenarios. Given the steep declines west of the Rocky Mountains and our projected negative trends in habitat suitability on the east slope of the mountains, our results support a decision to assess olive-sided flycatcher population trends by management units matched to bird conservation regions, to ensure that declines are detected and critical habitat is identified and protected where needed. In addition, we recommend that landscape simulations be applied in areas where the dates and locations of point counts are closely matched with the dates and locations of land cover data so that disturbance thresholds, such as limits to cutblock size, can be identified. Given the removal of protections associated with down-listing species in Canada, we suggest that for bird species with sufficient data, declines should be assessed over a longer timescale than a single decade, and should take into account the probability of future recovery.
Our landscape simulations indicated that current forest management in western Canada may be contributing to observed declines in olive-sided flycatcher populations, and that changing the management of breeding habitat to limit clearcut size could potentially reduce population declines. However, such measures should be accompanied by efforts to understand and address additional stressors across their full annual life cycle, including prolonged heat events that increase energetic demands of thermoregulation; exposure to contaminants; collisions with buildings and other infrastructure; direct nest loss due to forestry and other industrial activities; and phenological mismatches and declines in high quality insect prey (Calvert et al., 2013; Wilson et al., 2018; Spiller and Dettmers, 2019; Andreasson et al., 2020). Outside of the breeding season, Rodewald et al. (2019) estimated that 10.7% of olive-sided flycatchers winter in mining concessions in the northern Andes, where a transition to active mines is expected to result in habitat loss, fragmentation, and pollution. Additional non-breeding records across the Brazilian Amazon, Cerrado and Atlantic Forest (Willis, 1993; de Lima-Pereira, 2016) occur in regions already subject to high levels of forest loss; for example, 88% of the original Brazilian Atlantic Forest and 46% of the Cerrado have already been cleared, and large-scale agriculture is projected to replace 31–34% of the remaining Cerrado by 2050 (Ribeiro et al., 2009; Strassburg et al., 2017). If researchers can obtain data on non-breeding habitat use by olive-sided flycatchers and other aerial insectivores, they can use landscape simulations to assess cumulative effects of multiple stressors on wintering grounds. An important next step is to integrate full life-cycle population models (e.g., Wilson et al., 2018) into landscape simulations to identify specific management practices in each part of the annual life cycle that can have the greatest effect on reversing population declines.
Caveats
Our study uses the best available data to project suitable habitat for olive-sided flycatcher in the southern Peace River Region of British Columbia, taking into account the cumulative effects of multiple disturbances, but with several caveats. First, although olive-sided flycatchers often show positive numerical responses to fire (Hutto, 1995; Kotliar et al., 2002; Haché et al., 2014; Altman and Sallabanks, 2020), we were unable to test directly for effects of fire on occurrence, and had to assume that fires would have a similar effect as clearcuts (positive effect of small gaps; negative effect of large gaps). Second, we do not know the fitness consequences of breeding in clearcuts or burned areas: in some studies, nest survival was lower in harvested areas and burned areas, and in others, nest survival was higher in burned areas (Kotliar et al., 2002; Robertson and Hutto, 2007; Altman and Sallabanks, 2020). Before-after-control-impact studies are necessary to determine how burning influences habitat suitability relative to other important disturbance factors such as clearcuts and insect outbreaks. Further, we did not examine how climate-related variables, such as weather during breeding, influenced annual variation in populations and habitat associations. Therefore, we cannot evaluate the relative importance of breeding habitat factors in the face of increasing climate change pressures. Third, we used Biogeoclimatic Ecosystem Classification zones to stratify our landscape simulation because forest managers use these zones in planning, but the detections in our point count data were too sparse to stratify habitat suitability models by the same zones. Olive-sided flycatchers occur across forested zones, and our preliminary inspection of the data did not suggest that detections were correlated with Biogeoclimatic Ecosystem Classification zone, soil moisture, elevation, crown closure, or spatial coordinates. Fourth, 72% of the point counts in our dataset were within 100 m of a road. Although we did not find a relationship between the occurrence of olive-sided flycatchers and the presence of roads in the southern Peace River region, roadside surveys can under-sample certain habitats in boreal forest, and under-represent bird densities (Sólymos et al., 2020). Simulations of future habitat availability would be best suited to areas with higher densities of the target species (which can, however, be difficult for species that have experienced steep declines) and more comprehensive land cover and point count data, and subsequently, lower error in habitat suitability models. To better align with forest planning objectives, the design of point count surveys should take into account regional forest classifications (such as Biogeoclimatic Ecosystem Classification in British Columbia), attempt to cover off-road areas, and encompass a wider variety of disturbances, including smaller cutblocks, areas exposed to recent wildfires and insect outbreaks, and areas exposed to both insects and cutting (specific recommendations in Mahon and Pelech, in press). Collecting a minimum of habitat data (tree species, stand age, severity of disturbances) during point count studies would improve resolution and reduce the problem of missing land cover data.
Conclusion
Our simulation study highlights potential avenues to explore in adaptive management or with experiments on the ground. We suggest testing the generality of our scenarios as prescriptions for management of olive-sided flycatcher habitat, especially outside the study area. Moreover, management for olive-sided flycatcher and other birds associated with small forest openings will need to balance the benefits of limiting cut block size with the cost of increased road infrastructure and increasing forest fragmentation, which can affect other wildlife populations at risk (e.g., woodland caribou Rangifer tarandus caribou; Johnson et al., 2015). Our landscape simulations highlight the importance of integrating disturbance thresholds (such as clearcut size) into land-use planning, when protected areas alone are insufficient to halt or reverse population declines.
Data Availability Statement
The original contributions presented in the study are included in the article/Supplementary Material, further inquiries can be directed to the corresponding author.
Ethics Statement
Ethical review and approval was not required for the animal study because the study used existing datasets and did not involve handling of animals.
Author Contributions
ARN, KLD, LF, and AR conceived the idea. ARN, JT, and AL sourced and curated the data. ARN, CD, KLC, and LF performed the analyses. ARN, KLC, and LF wrote the manuscript with suggestions from other authors. All authors contributed to the manuscript and approved the submitted version.
Funding
The research was funded by the Canadian Wildlife Service, Environment and Climate Change Canada, Pacific Region. ECCC did not influence the content of the manuscript nor require approval of the manuscript prior to publication.
Conflict of Interest
The co-authors LF and CD were employed by Apex RMS Ltd., with financial contribution by ECCC to assist in the development of the landscape models and preparation of the manuscript.
The remaining authors declare that the research was conducted in the absence of any commercial or financial relationships that could be construed as a potential conflict of interest.
Acknowledgments
This study took place in the lands and territories of the McLeod Lake, Lheidli T’enneh, Aseniwuche Winewak, Beaver, Tsuu T’ina, Horse Lake, Driftpile, Swan River, Moosomin, Lhoosk’uz Dene, and Kelly Lake First Nations and the Métis Settlement Society. We would like to acknowledge their integral role in managing the ecosystems of this area. We thank the British Columbia Breeding Bird Atlas, Kathleen Moore, Rene McKibbin, Coral DeShield, Catherine Jardine, Christopher Di Corrado, Diana Demarchi, and the BC Ministry of Environment for supplying and summarizing data and providing comments on previous drafts of the manuscript. We would also like to thank the following partners: BC Nature, BC Field Ornithologists, Biodiversity Centre for Wildlife Studies, Louisiana Pacific, and the Pacific Wildlife Foundation, as well as all of the volunteer participants who gathered data for the projects.
Supplementary Material
The Supplementary Material for this article can be found online at: https://www.frontiersin.org/articles/10.3389/fevo.2021.635872/full#supplementary-material
References
Altman, B., and Sallabanks, R. (2020). “Olive-sided flycatcher (Contopus cooperi)”, version 1.0,” in Birds of the World, eds A. F. Poole and F. B. Gill (Ithaca, NY: Cornell Lab of Ornithology)
Andreasson, F., Nilsson, J. -Å, and Nord, A. (2020). Avian reproduction in a warming world. Front. Ecol. Evol. 8:337. doi: 10.3389/fevo.2020.576331
ApexRMS (2021). ST-Sim SyncroSim Package. Version 3.2.21. Available online at: http://docs.stsim.net/ (accessed April 21, 2021).
Bale, S., Beazley, K. F., Westwood, A., and Bush, P. (2019). The benefits of using topographic features to predict climate-resilient habitat for migratory forest landbirds: an example for the Rusty Blackbird, Olive-sided Flycatcher, and Canada Warbler. Condor 122, 1–19. doi: 10.1093/condor/duz057
Betts, M. G., Wolf, C., Ripple, W. J., Phalan, B., Millers, K. A., Duarte, A., et al. (2017). Global forest loss disproportionately erodes biodiversity in intact landscapes. Nature 547, 441–444. doi: 10.1038/nature23285
Bolker, B. M. (2015). “Linear and generalized linear mixed models,” in Ecological Statistics: Contemporary Theory and Application, eds G. A. Fox, S. Negrete-Yankelevich, and V. J. Sosa (Oxford: Oxford University Press), 309–333.
Boreal Avian Modelling Project (2020). Generalized National Models Documentation, Version 4.0. Available online at: https://borealbirds.github.io/ (Accessed January 20, 2020).
BC Breeding Bird Atlas (2008). NatureCounts. Avian Knowledge Network. Bird Studies Canada. Available online at: http://www.naturecounts.ca/ (Accessed December 9, 2014)
Butchart, S. H. M., Walpole, M., Collen, B., van Strien, A., Scharlemann, J. P. W., Almond, R. E. A., et al. (2010). Global biodiversity: indicators of recent declines. Science 328, 1164–1168. doi: 10.1126/science.1187512
Cadieux, P., Boulanger, Y., Cyr, D., Taylor, A. R., Price, D. T., Sólymos, P., et al. (2020). Projected effects of climate change on boreal bird community accentuated by anthropogenic disturbances in western boreal forest, Canada. Divers. Distrib. 26, 668–682. doi: 10.1111/ddi.13057
Calvert, A. M., Bishop, C. A., Elliot, R. D., Krebs, E. A., Kydd, T. M., Machtans, C. S., et al. (2013). A synthesis of human-related avian mortality in Canada. Avian Conserv. Ecol. 8:11. doi: 10.5751/ACE-00581-080211
Campbell, R. W., Dawe, N. K., McTaggart-Cowan, I., Cooper, J. M., Kaiser, G. W., and McNall, M. C. E. (1997). “The birds of British Columbia,” in Passerines: Flycatchers Through Vireos Vol. IV, (Vancouver, BC: UBC Press).
Chung, Y., Rabe-Hesketh, S., Dorie, V., Gelman, A., and Liu, J. (2013). A nondegenerate penalized likelihood estimator for variance parameters in multilevel. Psychometrika 78, 685–709. doi: 10.1007/s11336-013-9328-2
Cohen, S., Bush, E., Zhang, X., Gillett, N., Bonsai, B., Derksen, C., et al. (2019). “Synthesis of Findings for Canada’s Regions,” in Canada’s Changing Climate Report, eds E. Bush and D. S. Lemmen (Ottawa: Government of Canada), 424–443.
Committee on the Status of Endangered Wildlife in Canada [COSEWIC] (2018). Assessment and Status Report on the Olive-sided Flycatcher (Contopus cooperi) in Canada. Available online at: https://www.canada.ca/en/environment-climate-change/services/species-risk-public-registry/cosewic-assessments-status-reports/olive-sided-flycatcher-2018.html#toc3 (Accessed March 18, 2019)
Daniel, C. J., Frid, L., Sleeter, B. M., and Fortin, M. J. (2016). State-and-transition simulation models: a framework for forecasting landscape change. Methods Ecol. Evol. 7, 1413–1423. doi: 10.1111/2041-210X.12597
de Lima-Pereira, K. M. (2016). Olive-sided Flycatcher, Contopus cooperi, in the Cerrado biome, and a review of records in Brazil. Rev. Bras. Ornitol. 24, 46–52. doi: 10.1007/bf03544328
Diefenbach, D. R., Marshall, M. R., Mattice, J. A., and Brauning, D. W. (2007). Incorporating availability for detection in estimates of bird abundance. Auk 124, 96–106. doi: 10.1642/0004-8038(2007)124[96:iafdie]2.0.co;2
Drapeau, P., Leduc, A., Giroux, J. F., Savard, J. P. L., Bergeron, Y., and Vickery, W. L. (2000). Landscape-scale disturbances and changes in bird communities of boreal mixed-wood forests. Ecol. Monogr. 70, 423–444. doi: 10.1890/0012-9615(2000)070[0423:lsdaci]2.0.co;2
Drever, M. C., and Martin, K. (2010). Response of woodpeckers to changes in forest health and harvest: implications for conservation of avian biodiversity. For. Ecol. Manage. 259, 958–966. doi: 10.1016/j.foreco.2009.11.038
Duinker, P. N., Burbidge, E. L., Boardley, S. R., and Greig, L. A. (2012). Scientific dimensions of cumulative effects assessment: toward improvements in guidance for practice. Environ. Rev. 21, 40–52. doi: 10.1139/er-2012-0035
Favaro, B., Claar, D. C., Fox, C. H., Freshwater, C., Holden, J. J., Roberts, A., et al. (2014). Trends in extinction risk for imperiled species in Canada. PLoS One 9:e113118. doi: 10.1371/journal.pone.0113118
Gillies, R. S. H. (2015). Indigenous Landscapes: Historical Ecology of the Peace River Watershed, British Columbia, Canada. Master’s thesis York: University of York.
Government of British Columbia (2011). BC Ministry of Forests, Lands and Natural Resource Operations. Research Branch. Biogeoclimatic Ecosystem Classification Program. Available online at: https://www.for.gov.bc.ca/hre/becweb/index.html (Accessed January 31, 2017)
Government of British Columbia (2013). BC Ministry of Forests, Lands, and Natural Resource Operations. Dawson Creek TSA Timber Supply Analysis Public Discussion Paper. Available online at: http://www.dawsoncreek.ca/wordpress/wp-content/uploads/community-profile-forestry-sector/Dawson-Creek-TSA-Timber-Supply-Analysis-Sep-2013.pdf (Accessed September 23, 2020).
Government of British Columbia (2014). BC Ministry of Forests, Lands, and Natural Resource Operations. Dawson Creek Timber Supply Area: Rationale for Allowable Annual Cut (AAC) Determination. Available online at: https://www2.gov.bc.ca/gov/content/industry/forestry/managing-our-forest-resources/timber-supply-review-and-allowable-annual-cut/allowable-annual-cut-timber-supply-areas/dawson-creek-tsa (Accessed September 29, 2020).
Government of British Columbia (2016a). BC Ministry of Forests, Lands, and Natural Resource Operations. Fire Perimeters. Available online at: https://catalogue.data.gov.bc.ca/dataset/fire-perimeters-current (Accessed December 4, 2018).
Government of British Columbia (2016b). BC Ministry of Forests, Lands, Natural Resource Operations. Harvested Areas of BC (Consolidated Cutblocks). Available online at: https://catalogue.data.gov.bc.ca/dataset/harvested-areas-of-bc-consolidated-cutblocks- (Accessed August 12, 2018).
Government of British Columbia (2016c). Digital Road Atlas dataset. Available online at: https://www2.gov.bc.ca/gov/content/data/geographic-data-services/topographic-data/roads (Accessed August 17, 2017).
Government of British Columbia (2016d). Freshwater Atlas. GeoBC. Available online at: https://www2.gov.bc.ca/gov/content/data/geographic-data-services/topographic-data/freshwater (Accessed May, 3, 2017).
Government of British Columbia (2018). BC Ministry of Forests, Lands, and Natural Resource Operations. DataBC. Vegetation Resources Inventory. Available online at: https://catalogue.data.gov.bc.ca/dataset?tags=VRI (Accessed April 22, 2018).
Government of British Columbia (2019a). BC Ministry of Forests, Lands, and Natural Resource Operations. Wildfire Averages. Available online at: https://www2.gov.bc.ca/gov/content/safety/wildfire-status/about-bcws/wildfire-statistics/wildfire-averages (Accessed January 9, 2020).
Government of British Columbia (2019b). BC Ministry of Forests, Lands, Natural Resource Operations and Rural Development. Forest Health Aerial Overview Survey Standards for British Columbia. Available online at: https://www.for.gov.bc.ca/ftp/HFP/external/!publish/Aerial_Overview/Data_stds/AOS%20Standards%202019.pdf (Accessed July 22, 2020)
Government of British Columbia (2020a). BC Ministry of Environment and Climate Change Strategy. DataBC. Wildlife Species Inventory Survey Observations (2020). Available online at: https://catalogue.data.gov.bc.ca/dataset/wildlife-species-inventory-survey-observations-all (Accessed April 8, 2020).
Government of British Columbia (2020b). BC Ministry of Forests, Lands, Natural Resource Operations and Rural Development. Pest Infestation Polygons. Available online at: https://catalogue.data.gov.bc.ca/dataset/pest-infestation-polygons (Accessed January 29, 2020).
Government of British Columbia (2020c). BC Ministry of Forests, Lands, Natural Resource Operations and Rural Development. Wildlife and Habitat. Conservation Lands. Available online at: https://catalogue.data.gov.bc.ca/dataset/conservation-lands (Accessed February 21, 2020).
Government of British Columbia (2020d). DataBC Program. ParcelMap. BC Parcel Fabric. BC Ministry of Citizens Services. Available online at: https://catalogue.data.gov.bc.ca/dataset/parcelmap-bc-parcel-fabric (Accessed September 10, 2019).
Government of Canada (2002). Species at Risk Act. SC 2002, c 29. Available online at: http://Laws-lois.justice.gc.ca/PDF/S-15.3.pdf (Accessed July 7, 2019)
Government of Canada (2013). Bird Conservation Strategy for Bird Conservation Region 6 in Prairie and Northern Region: Boreal Taiga Plains. Edmonton, AB: Canadian Wildlife Service, Environment Canada, 288.
Government of Canada (2010). Agriculture and Agri-Food Canada. Land Use 1990, 2000 & 2010. Available online at: https://open.canada.ca/data/en/dataset/18e3ef1a-497c-40c6-8326-aac1a34a0dec (Accessed November 17, 2019).
Government of Canada (2016). Recovery Strategy for the Olive-sided Flycatcher (Contopus cooperi) in Canada. Species at Risk Act Recovery Strategy Series. Ottawa: Environment Canada, 52.
Government of Canada (2019). Environment and Climate Change Canada. Minister of Environment and Climate Change Mandate Letter. Available online at: https://pm.gc.ca/en/mandate-letters/2019/12/13/minister-environment-and-climate-change-mandate-letter (Accessed October 9, 2020).
Haché, S., Solymos, P., Fontaine, T., Bayne, E. M., Cumming, S. G., Schmiegelow, F. K. A., et al. (2014). Critical Habitat of Olive-sided Flycatcher, Canada Warbler, and Common Nighthawk in Canada. Technical Report for Environment and Climate Change Canada, Boreal Avian Modelling Project. Edmonton, CA: University of Alberta.
Hole, D. G., Huntley, B., Arinaitwe, J., Butchart, S. H., Collingham, Y. C., Fishpool, L. D., et al. (2011). Toward a management framework for networks of protected areas in the face of climate change. Conserv. Biol. 25, 305–315.
Hosmer, D. W. Jr., Lemeshow, S., and Sturdivant, R. X. (2013). Applied Logistic Regression, Third Edn. Hoboken, NJ: John Wiley & Sons.
Hutto, R. L. (1995). Composition of bird communities following stand-replacement fires in Northern rocky mountain (U.S.A.) conifer forests. Conserv. Biol. 9, 1041–1058. doi: 10.1046/j.1523-1739.1995.9051033.x-i1
Johnson, C. J., Ehlers, L. P. W., and Seip, D. R. (2015). Witnessing extinction - Cumulative impacts across landscapes and the future loss of an evolutionarily significant unit of woodland caribou in Canada. Biol. Conserv. 186, 176–186. doi: 10.1016/j.biocon.2015.03.012
Knowles, J. E., and Frederick, C. (2020). merTools: Tools for Analyzing Mixed Effect Regression Models. R package version 0.5.2. Available online at: https://CRAN.R-project.org/package=merTools (Accessed November 23, 2020).
Kotliar, N. B., Hejl, S. J., Hutto, R. L., Saab, V. A., Melcher, C. P., and McFadzen, M. E. (2002). Effects of fire and post-fire salvage logging on avian communities in conifer-dominated forests of the western United States. Stud. Avian Biol. 25, 49–64.
Lemelin, L.-V., Imbeau, L., Darveau, M., and Bordage, D. (2007). Local, short-term effects of forest harvesting on breeding waterfowl and common loon in forest-dominated landscapes of Quebec. Avian Conserv. Ecol. 2:10. doi: 10.1115/power2014-32114
Leston, L., Bayne, E., Dzus, E., Sólymos, P., Moore, T., Andison, D., et al. (2020). Quantifying long-term bird population responses to simulated harvest plans and cumulative effects of disturbance. Front. Ecol. Evol. 8:252. doi: 10.3389/fevo.2020.00252
Mahon, C. L., and Pelech, S. (in press). Guidance for Analytical Methods to Cumulative Effects Assessment for terrestrial Species. Environmental Reviews.
Mahon, C. L., Bayne, E. M., Sólymos, P., Matsuoka, S. M., Carlson, M., Dzus, E., et al. (2014). Does expected future landscape condition support proposed population objectives for boreal birds? For. Ecol. Manage. 312, 28–39. doi: 10.1016/j.foreco.2013.10.025
Mahon, C. L., Holloway, G. L., Bayne, E. M., and Toms, J. D. (2019). Additive and interactive cumulative effects on boreal landbirds: winners and losers in a multi-stressor landscape. Ecol. Appl. 29:e01895. doi: 10.1002/eap.1895
Nebel, S., Casey, J., Cyr, M. A., Kardynal, K. J., Krebs, E. A., Purves, E. F., et al. (2020). Falling through the policy cracks: implementing a roadmap to conserve aerial insectivores in North America. Avian Conserv. Ecol. 15:23. doi: 10.5751/ACE-01618-150123
Nebel, S., Mills, A., Mccracken, J. D., and Taylor, P. D. (2010). Declines of aerial insectivores in North America follow a geographic gradient. Avian Conserv. Ecol. 5:1. doi: 10.5751/ACE-00391-050201
Nitschke, C. R. (2008). The cumulative effects of resource development on biodiversity and ecological integrity in the Peace-Moberly region of Northeast British Columbia, Canada. Biodivers. Conserv. 17, 1715–1740. doi: 10.1007/s10531-008-9376-6
Norris, A. R., and Martin, K. (2010). The perils of plasticity: dual resource pulses increase facilitation but destabilize populations of small-bodied cavity-nesters. Oikos 119, 1126–1135. doi: 10.1111/j.1600-0706.2009.18122.x
Northrup, J. M., Rivers, J. W., Yang, Z., and Betts, M. G. (2019). Synergistic effects of climate and land-use change influence broad-scale avian population declines. Glob. Chang. Biol. 25, 1561–1575. doi: 10.1111/gcb.14571
Pojar, J., Klinka, K., and Meidinger, D. V. (1987). Biogeoclimatic ecosystem classification in British Columbia. For. Ecol. Manage. 22, 119–154. doi: 10.1016/0378-1127(87)90100-9
R Core Team (2019). R: A Language and Environment for Statistical Computing. Vienna: R Foundation for Statistical Computing.
Ribeiro, M. C., Metzger, J. P., Martensen, A. C., Ponzoni, F. J., and Hirota, M. M. (2009). The Brazilian Atlantic Forest: how much is left, and how is the remaining forest distributed? Implications for conservation. Biol. Conserv. 142, 1141–1153. doi: 10.1016/j.biocon.2009.02.021
Robertson, B. A., and Hutto, R. L. (2007). Is selectively harvested forest an ecological trap for olive-sided flycatchers? Condor 109, 109–121. doi: 10.1650/0010-5422(2007)109[109:ishfae]2.0.co;2
Rodewald, A. D., Strimas-Mackey, M., Schuster, R., and Arcese, P. (2019). Beyond canaries in coal mines: co-occurrence of Andean mining concessions and migratory birds. Perspect. Ecol. Conserv. 17, 151–156. doi: 10.1016/j.pecon.2019.08.002
Rosenberg, K. V., Dokter, A. M., Blancher, P. J., Sauer, J. R., Smith, A. C., Smith, P. A., et al. (2019). Decline of the North American avifauna. Science 366, 120–124. doi: 10.1126/science.aaw1313
Rosenberg, K. V., Kennedy, J. A., Dettmers, R., Ford, R. P., Reynolds, D., Alexander, J. D., et al. (2016). Partners in Flight Landbird Conservation Plan: 2016 Revision for Canada and Continental United States. Partners in Flight Science Committee. Available online at: https://www.partnersinflight.org/wp-content/uploads/2016/08/pif-continental-plan-final-spread-single.pdf (accessed March 19, 2021).
Saab, V. A., Latif, Q. S., Rowland, M. M., Johnson, T. N., Chalfoun, A. D., Buskirk, S. W., et al. (2014). Ecological consequences of mountain pine beetle outbreaks for wildlife in Western North American forests. For. Sci. 60, 539–559. doi: 10.5849/forsci.13-022
Schmiegelow, F. K. A., and Mönkkönen, M. (2002). Habitat loss and fragmentation in dynamic landscapes: avian perspectives. Ecol. Appl. 12, 375–389. doi: 10.2307/3060949
Schmiegelow, F. K. A., and Villard, M. (2009). Conservation of boreal birds and the case for resilience: does it pass the test? Avian Conserv. Ecol. 4:4.
Sing, T., Sander, O., Beerenwinkel, N., and Lengauer, T. (2005). ROCR: visualizing classifier performance in R. Bioinformatics 21, 3940–3941. doi: 10.1093/bioinformatics/bti623
Smith, A. C., Hudson, M. A. R., Downes, C. M., and Francis, C. M. (2015). Change points in the population trends of aerial-insectivorous birds in North America: synchronized in time across species and regions. PLoS One 10:e0130768. doi: 10.1371/journal.pone.0130768
Smith, A. C., Hudson, M.-A. R., Aponte, V., and Francis, C. M. (2019). North American Breeding Bird Survey - Canadian Trends Website, Data-version 2017. Gatineau, CA: Environment and Climate Change Canada.
Sólymos, P. (2016). QPAD Version 3 Documentation. Technical Report, Boreal Avian Modelling Project. Available online at: http://www.borealbirds.ca/library/index.php/technical_reports (accessed July 4, 2020)
Sólymos, P., Matsuoka, S. M., Bayne, E. M., Lele, S. R., Fontaine, P., Cumming, S. G., et al. (2013). Calibrating indices of avian density from non-standardized survey data: making the most of a messy situation. Methods Ecol. Evol. 4, 1047–1058. doi: 10.1111/2041-210X.12106
Sólymos, P., Toms, J. D., Matsuoka, S. M., Cumming, S. G., Barker, N. K. S., Thogmartin, W. E., et al. (2020). Lessons learned from comparing spatially explicit models and the Partners in Flight approach to estimate population sizes of boreal birds in Alberta. Canada. Condor 122, 1–22. doi: 10.1093/condor/duaa007
Spiller, K. J., and Dettmers, R. (2019). Evidence for multiple drivers of aerial insectivore declines in North America. Condor 121, 1–13. doi: 10.1093/condor/duz010
Strassburg, B. B. N., Brooks, T., Feltran-Barbieri, R., Iribarrem, A., Crouzeilles, R., Loyola, R., et al. (2017). Moment of truth for the Cerrado hotspot. Nat. Ecol. Evol. 1, 13–15. doi: 10.1038/s41559-017-0099
Vitousek, P. (1994). Beyond global warming: ecology and global change. Ecology 75, 1861–1876. doi: 10.2307/1941591
Watson, J. E., Darling, E. S., Venter, O., Maron, M., Walston, J., Possingham, H. P., et al. (2016). Bolder science needed now for protected areas. Conserv. Biol. 30, 243–248. doi: 10.1111/cobi.12645
Westwood, A. R., Staicer, C., Sólymos, P., Haché, S., Fontaine, T., Bayne, E. M., et al. (2019). Estimating the conservation value of protected areas in maritime canada for two species at risk: the Olive-sided Flycatcher (Contopus cooperi) and Canada Warbler (Cardellina canadensis). Avian Conserv. Ecol. 14:16. doi: 10.5751/ACE-01359-140116
Wilson, S., Saracco, J. F., Krikun, R., Flockhart, D. T. T., Godwin, C. M., and Foster, K. R. (2018). Drivers of demographic decline across the annual cycle of a threatened migratory bird. Sci. Rep. 8:7316. doi: 10.1038/s41598-018-25633-z
Wootton, J. T. (2010). Experimental species removal alters ecological dynamics in a natural ecosystem. Ecology 91, 42–48. doi: 10.1890/08-1868.1
Wright, J. M. (1997). Preliminary Study of Olive-sided Flycatchers, July 1994 - April 1997. Final research report. Endangered species conservation fund federal aid studies SE-3-3, 4 and 5. Juneau: Alaska Department of Fish and Game, 34.
Keywords: aerial insectivore, bark beetle outbreak, clearcut logging, climate change, cumulative effects, habitat suitability, landscape simulation, wildfire
Citation: Norris AR, Frid L, Debyser C, De Groot KL, Thomas J, Lee A, Dohms KM, Robinson A, Easton W, Martin K and Cockle KL (2021) Forecasting the Cumulative Effects of Multiple Stressors on Breeding Habitat for a Steeply Declining Aerial Insectivorous Songbird, the Olive-sided Flycatcher (Contopus cooperi). Front. Ecol. Evol. 9:635872. doi: 10.3389/fevo.2021.635872
Received: 30 November 2020; Accepted: 31 March 2021;
Published: 13 May 2021.
Edited by:
Anouschka R. Hof, Wageningen University and Research, NetherlandsReviewed by:
Nagore G. Medina, Autonomous University of Madrid, SpainTiago Vasconcelos, São Paulo State University, Brazil
Copyright © 2021 Norris, Frid, Debyser, De Groot, Thomas, Lee, Dohms, Robinson, Easton, Martin and Cockle. This is an open-access article distributed under the terms of the Creative Commons Attribution License (CC BY). The use, distribution or reproduction in other forums is permitted, provided the original author(s) and the copyright owner(s) are credited and that the original publication in this journal is cited, in accordance with accepted academic practice. No use, distribution or reproduction is permitted which does not comply with these terms.
*Correspondence: Andrea R. Norris, YW5kcmVhLm5vcnJpc0BjYW5hZGEuY2E=