 Alexandre Silva de Paula1
 Carlos Barreto1,2
 Mike Cerqueira Martins Telmo1
 Lileia Diotaiuti3
 Cleber Galvão4*
- 1Laboratório de Sistemática e Biogeografia, Instituto de Ciências Exatas e Biológicas, Universidade Federal de Ouro Preto, Ouro Preto, Brazil
- 2Department of Biology, Western University, London, ON, Canada
- 3Instituto René Rachou, Fundação Oswaldo Cruz, Belo Horizonte, Brazil
- 4Laboratório Nacional e Internacional de Referência em Taxonomia de Triatomíneos, Instituto Oswaldo Cruz, Fundação Oswaldo Cruz, Rio de Janeiro, Brazil
The Rhodniini tribe is one of the five tribes in the subfamily Triatominae and is notorious for its domestic blood-sucking pests and vectors of Trypanosoma cruzi across Latin America. The human and economic costs of the Chagas disease in the American tropics are considerable, and these insects are of unquestionable importance to humans. We used mitochondrial rDNA (16S), nuclear ribosomal RNA (28S) and wingless (Wg) sequences to perform phylogenetic analysis to derive trees based on parsimony and maximum likelihood. Nucleotide sequences were used in molecular-clock analyses to estimate time divergence between species of Rhodniini. The potential distribution of each species was modeled and compared with Kappa statistic. Multivariate niches with bioclimatic variables were used to describe differences between the species using discriminant analysis. The results of this study indicate that the Rhodniini originated 17.91 Mya ago. Rhodnius domesticus is the oldest species having its origin at 9.13 Mya. Rhodniini are closely related to Salyavatinae that are specialist termite predators and diverged from this subfamily 30.43 Mya. Most species are clearly allopatric and have distinct bioclimatic niches. The colonization of bromeliads, palms trees and bird nests represent important events for the speciation of these taxa. The hematophagous habit can be described as a scenario where Rhodniini’s ancestor could be pre-adapted for the invasion of bromeliads, palm trees, and bird nests where they would find significant water availability and thermal damping. These environments are widely used by vertebrate inquilines that would be the source of food for the species of Rhodniini. Lastly, our results show an alternative position of Psammolestes in the phylogenetic tree.
Introduction
The Rhodniini tribe is one of the five tribes in the subfamily Triatominae and is notorious for its domestic blood-sucking pests and vectors of Trypanosoma cruzi (Chagas, 1909) (Kinetoplastida, Trypanosomatidae) across Latin America. The tribe has a wide geographical distribution ranging from Central America to the Southern Cone (Hernández et al., 2020). The human and economic cost of the Chagas disease in the American tropics is considerable, totaling the annual burden of $627.46 million in health-care costs (Lee et al., 2013). There are about six million chronic disease carriers in the Americas and these insects are of unquestionable importance to humans (PAHO/WHO, 2020). Because of this, Rhodniini has been extensively studied due to its epidemiological importance (Schofield and Galvão, 2009). The tribe is considerably diverse, with 24 described species (21 of the genus Rhodnius Stål and three of Psammolestes Bergroth) (Zhao et al., 2021). The members of the genus Rhodnius have been classified into three groups—pallescens (trans-Andean), pictipes (cis-Andean), and prolixus—based on geographical distribution and morphology (Schofield and Galvão, 2009; Hernández et al., 2020). Although the taxonomy of Rhodnius has been widely studied, there are controversies regarding the number of species, the classification of these species into groups, and the phylogenetic relationships and monophyletic status of these groups that deserve further studies to elucidate Rhodnius taxonomic status. This is the case of R. zeledoni Jurberg et al., 2009, which seems to be very similar to R. domesticus Neiva and Pinto, 1923 (Galvão, 2014, 2020). The unique specimen was found very damaged in Sergipe state, Brazil, a region included in the distribution range of R. domesticus, therefore, examination of further material is essential to confirm whether or not R. zeledoni is a valid species. Following Monteiro et al. (2018), R. marabaensis dos Santos Souza et al., 2016 has been suggested to be a genetic variant very close to R. robustus Larrousse, 1927 (specific status recently considered valid by Castro et al., 2020) and R. taquarussuensis (Rosa et al., 2017), was synonymized with R. neglectus Lent, 1954 by Nascimento et al. (2019) based on interspecific crosses and molecular markers.
Issues in the phylogenetic relationships in Rhodnius have arisen from the conflicting results of morphometric analyses and molecular markers (Schofield and Galvão, 2009; Monteiro et al., 2018). Monteiro et al. (2003) and Pavan et al. (2013) proposed the paraphyly of R. robustus with respect to R. prolixus Stål, 1859, despite not including other populations of the species of the prolixus complex—R. nasutus Stål, 1859 and R. neglectus. Although rarely studied and recognized, the cross-contamination between R. prolixus and R. robustus colonies is fairly frequent. Mesquita et al. (2015) and Monteiro et al. (2018) proposed that the colony material should always be genotyped and compared with the established taxonomic standards, particularly when the research involves taxa with known cryptic variation. Misidentification of cryptic species must also be considered.
Triatominae species are almost entirely hematophagous, although there are cases of some species that feed on other invertebrates (Sandoval et al., 2004, 2010). Through evolutionary processes, Triatominae species have specialized morphological, physiological, and behavioral adaptations for feeding on blood. Among them are mouthparts, specifically saliva composition and enzymes, along with digestive symbionts that are the most noticeable (Otálora-Luna et al., 2015). The ecological, morphological and molecular changes that are involved in the transition from a predatory lifestyle to hematophagous Triatominae are still unclear due to the lack of robust and densely sampled phylogenies, preventing the development of significant hypothesis tests on these issues (Monteiro et al., 2018). The transition from predatory habits in Reduviidae to hematophagous habits in Triatominae could have occurred by colonization of vertebrate nests. Furthermore, the evolution of blood feeding in the tribes Triatomini and Rhodniini + Cavernicolini may have occurred independently (Hwang and Weirauch, 2012).
de Paula et al. (2005) presented the first molecular evidence for the polyphyletic origin of the subfamily Triatominae and showed a separation between Rhodniini and Triatomini tribes from predatory groups. In that study, it is suggested that the Reduviinae subfamily is a sister group of Triatomini, and the subfamilies Salyavatinae and Harpactorinae are sister groups of Rhodniini. According to Hwang and Weirauch (2012), Triatominae are paraphyletic with respect to the Opisthacidius Berg, 1879 (Reduviinae), and this contrasts prior hypotheses that found Triatominae to be monophyletic or polyphyletic. In addition, the same authors, as well as Patterson and Gaunt (2010) and Justi et al. (2016) proposed Zelurus Hahn, 1826 and Opisthacidius as sister groups to Triatominae in their phylogenetic analysis. Despite that, several issues remain underlying on the hypotheses of the origin of Rhodniini. The most common involves the period in which one group has arisen and the geologic and biogeographic events that have conditioned it. Understanding the mechanisms and processes underlying patterns of species distributions remains a central question in historical biogeography (Lomolino et al., 2016).
Molecular dating studies involving Triatominae species included Gaunt and Miles (2002); Hwang and Weirauch (2012), and Justi et al. (2016). Until the work of Justi et al. (2016), the Rhodniini tribe had been analyzed in biogeography studies by de Paula et al. (2007) and Abad-Franch et al. (2009). Other biogeographical hypotheses for Rhodniini’s evolution have also been tested (Hypša et al., 2002; Hwang and Weirauch, 2012). Justi et al. (2016) presented the first comprehensive phylogenetic study aiming to understand the geological events that led to Triatominae diversification using fossils as calibration points for time estimates and correlating the geological changes in the Neotropics to Triatominae evolution. They showed that the major geological changes in the Neotropics since the Eocene have played a role in the diversification of Triatominae, including the effects of the Andean uplift in the Amazonian area, comprising the formation of the Pebas system (23–10 Mya); the formation of the Acre system (10–7 Mya); the formation of the connection between the Amazon and the Atlantic Forest; the GAARlandia (GAAR = Greater Antilles + Aves Ridge) land bridge; the period of biodiversity exchange resulting from the closure of the Isthmus of Panama (10–2.7 Mya); the Florida and Gulf Coast inundations during the Miocene; and dispersal across the Bering Land Bridge during the Eocene.
The goal of the study reported here was to expand on our analysis (de Paula et al., 2007) by providing an update on the biogeographic hypotheses to explain the modern geographic distribution of Rhodniini species. We also performed molecular dating analysis for each species and presented an evolutionary hypothesis for the evolution of hematophagy. A fundamental question that we propose in this work is to evaluate the relationship between the Rhodniini tribe and the subfamilies Reduviinae and Salyavatinae. Salyavatinae are specialist termite predators (Cobben, 1978; van Doesburg and Forero, 2012) while Reduviinae are generalist predators (Hwang and Weirauch, 2012). Consequently, there are two possible scenarios to explain the haematophagic habit in Rhodniini that need to be elucidated. Lastly, we used bioclimatic data to show potential areas of distribution of each species.
Materials and Methods
Sequence Alignment, Phylogenetic Analysis, and Molecular Dating
The study makes use of mitochondrial rDNA sequences (16S), nuclear ribosomal RNA (28S) and wingless (Wg) sequences currently available in GenBank. We chose these markers because they are available for the outgroup and for most of the Rhodniini species studied.
Analyses of 16S rDNA, 28S rDNA and Wg sequences were performed by aligning sequences using MUSCLE (Edgar, 2004a, b1), and treating the gaps as missing (?) (Swofford, 2019). Zelurus alcides (Stål, 1863) (Reduviinae), Opisthacidius chinai Lent and Wygodzinsky, 1956 (Reduviinae), and Lisarda rhypara (Stål, 1859) (Salyavatinae) were used as outgroups in the 16S + 28S + Wg analyses based on previous studies (de Paula et al., 2005; Patterson and Gaunt, 2010; Hwang and Weirauch, 2012; Justi et al., 2016; Supplementary Table 1). We used PAUP 4.0a167 (Swofford, 2019) in the phylogenetic analysis to derive trees based on parsimony and maximum likelihood (ML). Parsimony branch-and-bound search was performed on the alignment, in addition to bootstrap analysis employing a heuristic search with 1000 bootstrap replicates using 100 random stepwise addition (tree-bisection-reconnection, TBR). We defined values for bootstrap support >90% as strongly supported, 90–70% as well-supported/moderate support, and < 70% as weakly supported (Hwang and Weirauch, 2012). Characters were treated as unordered and of equal weight. The topology of the retained trees was tested with maximum likelihood (ML) using a model of estimated gamma distribution, HKY85 variant, unequal base frequencies, different substitution rates, empirical base frequencies, estimated substitution model following heuristic stepwise addition using TBR branch-swapping (de Paula et al., 2005, 2007), and molecular clock enforced. The best evolutionary model was selected under the corrected Akaike Information Criterion (AIC) (Swofford and Bell, 2017; Liu et al., 2018), likelihood estimation (−ln L), and Kishino-Hasegawa test using normal approximation (KH-test) (Swofford and Bell, 2017).
Nucleotide sequences have been the most common form of data used in molecular clock analyses. Several models using molecular information have been developed and implemented to infer divergence times, although they do not assume a strict molecular clock, and yet are commonly applied to empirical data. The divergence time estimate analysis was conducted using BEAST 2.6.2 (Bouckaert et al., 2019), which goal is to estimate the joint posterior probability of the branch rates and times given a set of sequences and calibration information. The gamma model was set to general time reversible (GTR), and base frequencies and lognormal relaxed clock (Uncorrelated) were estimated. We adjusted the scale parameter to reduce the prior density (α = 2 and β = 0.25). The ucldMean and ucldStdev were set to exponential. Age estimates from fossil organisms are the most common form of divergence time calibration information. Fossils are part of the same diversification process (i.e., birth-death model) that generated the extant species and these data were used as age constraints on their putative ancestral nodes (Ho and Phillips, 2009; Heled and Drummond, 2010, 2012; Heath, 2012). Recent analyses using relaxed clock models calibrated with fossils converge estimates on the origin of Triatominae around 35 Mya to just over 40 Mya (Hwang and Weirauch, 2012; Ibarra-Cerdeña et al., 2014; Justi et al., 2016). We calibrated the origin of Salyavatinae to 42.0 Mya (Hwang and Weirauch, 2012) and lognormal prior distribution (M = 1.0 and S = 1.25). By default, BEAST sets the number of generations to 10,000,000 and length of chain to 1,000,000, thus these parameters were applied. The first 10% of the samples in each tree file were discarded using TREEANNOTATOR 2.6.2 (Bouckaert et al., 2019). The remaining trees were used to produce the maximum clade credibility tree that was visualized in FIGTREE 1.3.1 (Rambaut, 2018).
Ecological Niche Model
The potential distribution of each species was modeled using the MAXENT 3.4.1 (Phillips et al., 2018). The distribution data for Rhodniini was obtained from Ceccarelli et al. (2018) (see Supplementary Table 2). Georeferenced data were checked for inconsistencies using DIVA-GIS 7.5 (Hijmans et al., 2012), and duplicated data were removed. WorldClim bioclimatic variables version 2 (Fick and Hijmans, 2017) were used to perform the analyses. The rasters had a 2.5 min resolution, which represents the value of the 19 bioclimatic variables in the study area (see Supplementary Table 3). We used 10 replicate analyses based on cross validation. The distributional data for each species were separated into two sets: one for model calibration (70% of points) and one for model evaluation (30% of points) (Elith et al., 2010; Merow et al., 2013; de Paula and Barreto, 2020). The cloglog format was used to output the results in ASCII format, and the average output grids were imported into DIVA-GIS 7.5 (Hijmans et al., 2012) for assessments and analyses. To define the potential distribution for Rhodniini species, we used a 10% training presence threshold (the probability value at which 90% of the presence points fall within the potential area) to generate binary rasters with potential distribution areas for each individual species (Phillips et al., 2006, 2017; Phillips, 2017). We used the Area Under Curve (AUC) to evaluate models’ performances. AUC values range from 0 (a model worse than random) to 1 (perfect discrimination) with a cut-off of 0.5, meaning the model does not have a better fit than random prediction models.
We compared potential distribution maps of related species with Kappa statistic tool in the MAP COMPARISON KIT (MCK) 3.2.1 (Visser and de Nijs, 2006; Research Institute for Knowledge Systems BV, 2010). The Kappa comparison method is based on a straightforward cell-by-cell map comparison, which considers whether each pair of cells on the two maps are equal or not. This results in a comparison map displaying the spatial distribution of agreement. This comparison method does not require any parameters. The kappa statistic ranges from −1 to +1, where +1 indicates perfect agreement and values of zero or less indicate a performance no better than random (Cohen, 1960; van Vliet et al., 2011).
Species Discrimination
Linear discriminant function analysis (i.e., discriminant analysis) performs a multivariate test of differences between groups. This classification technique introduced by Fisher (1936) is based on the idea of discriminant function analysis to provide a set of weightings that allow the groups to be distinguished. It requires that the individuals be divided into groups and it is used when there are observations from pre-determined groups with two or more response variables recorded for each observation. It then generates a linear combination of variables that maximizes the probability of correctly assigning observations to their pre-determined groups. Linear discriminant function analysis was used to test the efficacy of the bioclimatic variables to classify the species of Rhodniini. Multivariate niches with all 19 bioclimatic variables were used to describe differences between the species (Supplementary Table 4). The values of bioclimatic variables were extracted from the WorldClim 2 layers (Fick and Hijmans, 2017). Twenty locations for each species were randomly selected, except for R. brethesi Matta, 1919 (12), R. domesticus (15), and R. stali Lent et al., 1993 (10), which selection comprised all locations. The discriminant analysis was performed using the stepwise method, Willks’ Lambda (λ), and computing F values for pairwise distances. Wilks’ λ is the ratio of within-groups sum of squares to the total sum of squares and it is designed to indicate whether a particular variable contributes significantly to explaining additional variance in the dependent variable. There are an F and a p-value associated with Wilks’ λ that indicates the level of significance (Quinn and Keough, 2002; McLachlan, 2004). The analysis was performed in SPSS SOFTWARE 20 (IBM, 2011). The criteria for entry sets were F values of 3.84 to enter a new variable and 2.71 to remove an already entered variable. These F values represent significance levels of approximately 0.05 and 0.10, respectively. We defined F values from groups size option for prior probabilities for classification—the groups are weighted by the proportion of the number of cases in each group.
Results
Sequence Alignment, Phylogenetic Analysis, and Molecular Dating
The parsimony analysis combining 16S + 28S + Wg sequences retained five trees with CI = 0.838, −ln L ranging from 6101.613 to 6110.204, and AIC from 12245.226 to 12262.408 (Table 1). The tree in Figure 1A shows the topology with the best scores for the test for significance of likelihood-score differences—Kishino-Hasegawa test (KH) (Table 1). The bootstrap values varied between 62 and 100, although the species R. domesticus + Psammolestes had no bootstrap support (Figure 1B). The stronger bootstrap value was seen for the pictipes group (100%). The pallescens group had weakly supported bootstrap values (65%) and the prolixus group was well-supported (87%). One of the five trees had a phylogenetic relationship where Psammolestes species—P. tertius and P. coreodes—were not retained in the clade R. domesticus + prolixus group (Figure 1C, −ln L = 6104.380, AIC = 12250.760). This topology was not showed in any publication prior to our study. The result of the maximum likelihood analysis (ML) is shown in Figure 2 and showed better supports than the trees retained in the parsimony analysis (−ln L = 5895.714, AIC = 11833.428). The main difference in the topology of this tree is the split of the tribe into two evolutionary lineages—pallescens group + pictipes group, and R. domesticus + Psammolestes + prolixus group, contrasting the trees retained in the analysis of parsimony that showed three clades—pallescens group, pictipes group, and R. domesticus + Psammolestes + prolixus group. The results of our phylogenetic analyses did not show the species Z. alcides and O. chinai as closely related to Rhodniini, as previously found (Patterson and Gaunt, 2010; Hwang and Weirauch, 2012; Justi et al., 2016). The results support the hypothesis proposed in de Paula et al. (2005), where Salyavatinae was the sister clade to Rhodniini.
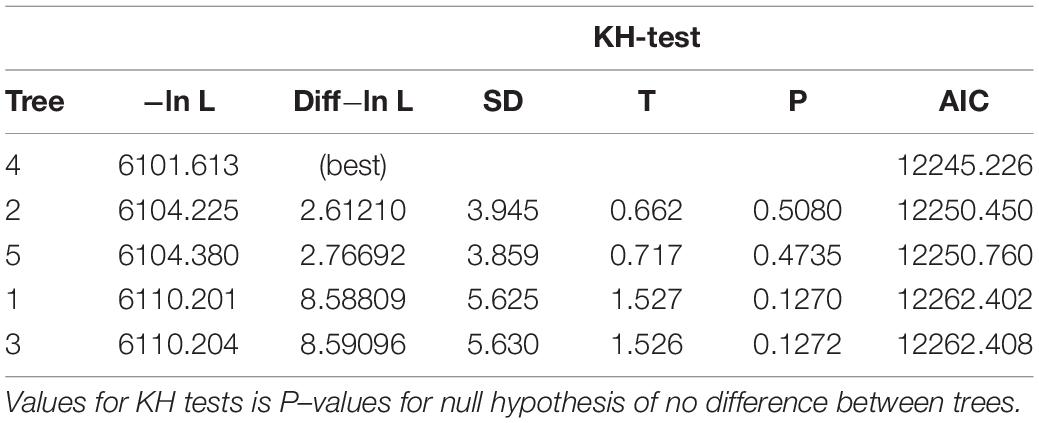
Table 1. Test for significance of likelihood-score differences Kishino-Hasegawa test (KH) using normal approximation, two-tailed test.
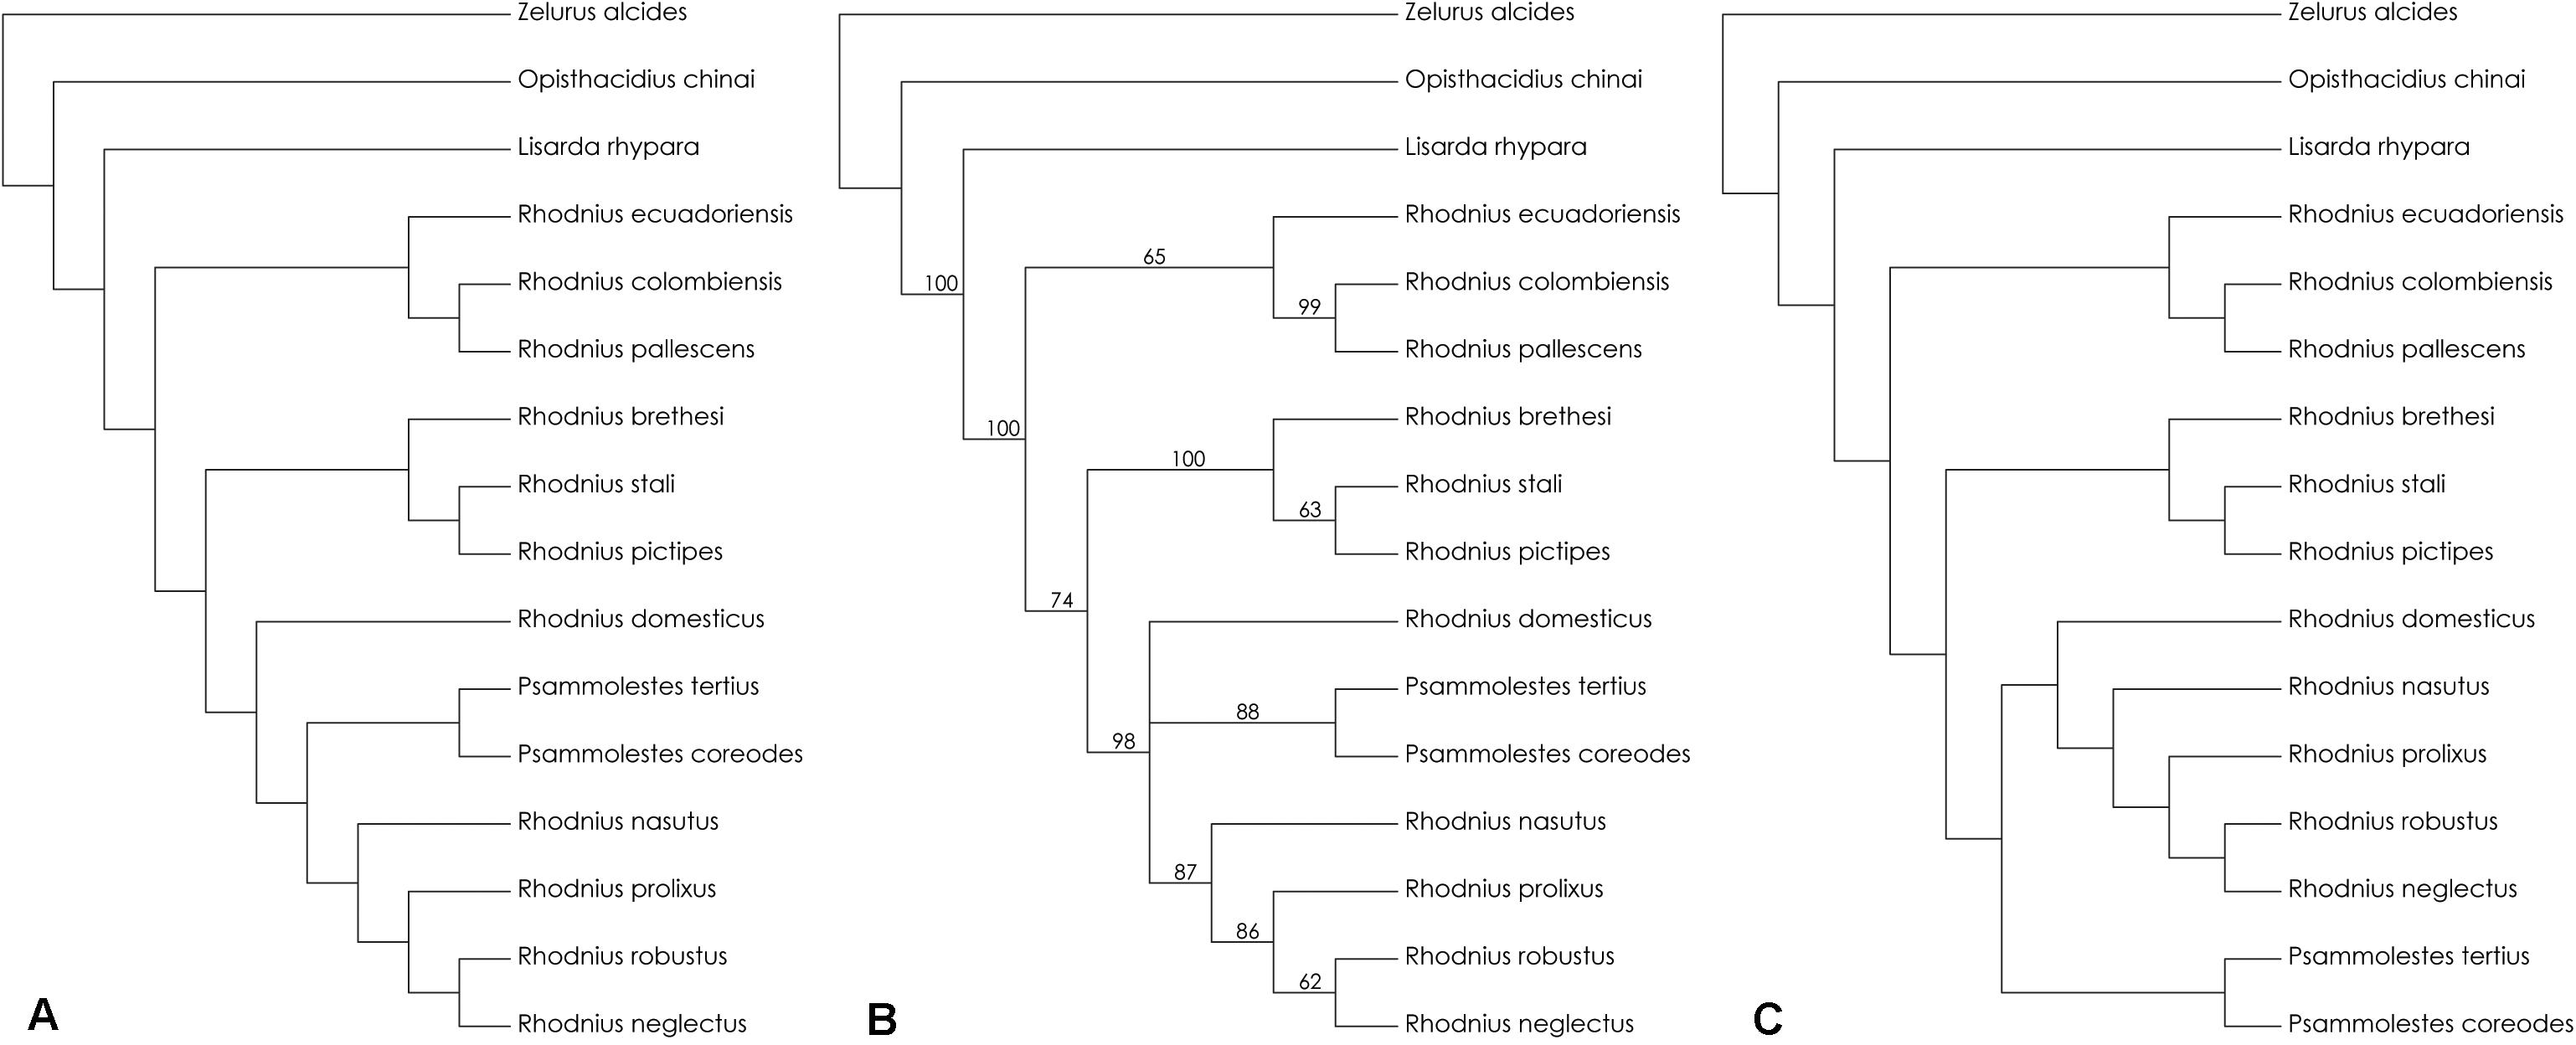
Figure 1. The topology of the retained trees in the parsimony analysis combining 16S + 28S + wingless sequences retained five trees with CI = 0.838, –ln L ranging from 6101.613 to 6110.204, and AIC from 12245.226 to 12262.408 (see Table 1). (A) the topology with the best scores for the test for significance of likelihood-score differences—Kishino-Hasegawa test (KH). (B) bootstrap support values employing a heuristic search with 1,000 bootstrap replicates using 100 random stepwise addition (tree-bisection-reconnection, TBR). We defined values for bootstrap support > 90% as strongly supported, 90–70% as well-supported/moderate support, and <70% as weakly supported. (C) the topology showing the alternative position of the genus Psammolestes. It was used PAUP 4.0 in the phylogenetic analysis to derive trees based on parsimony.
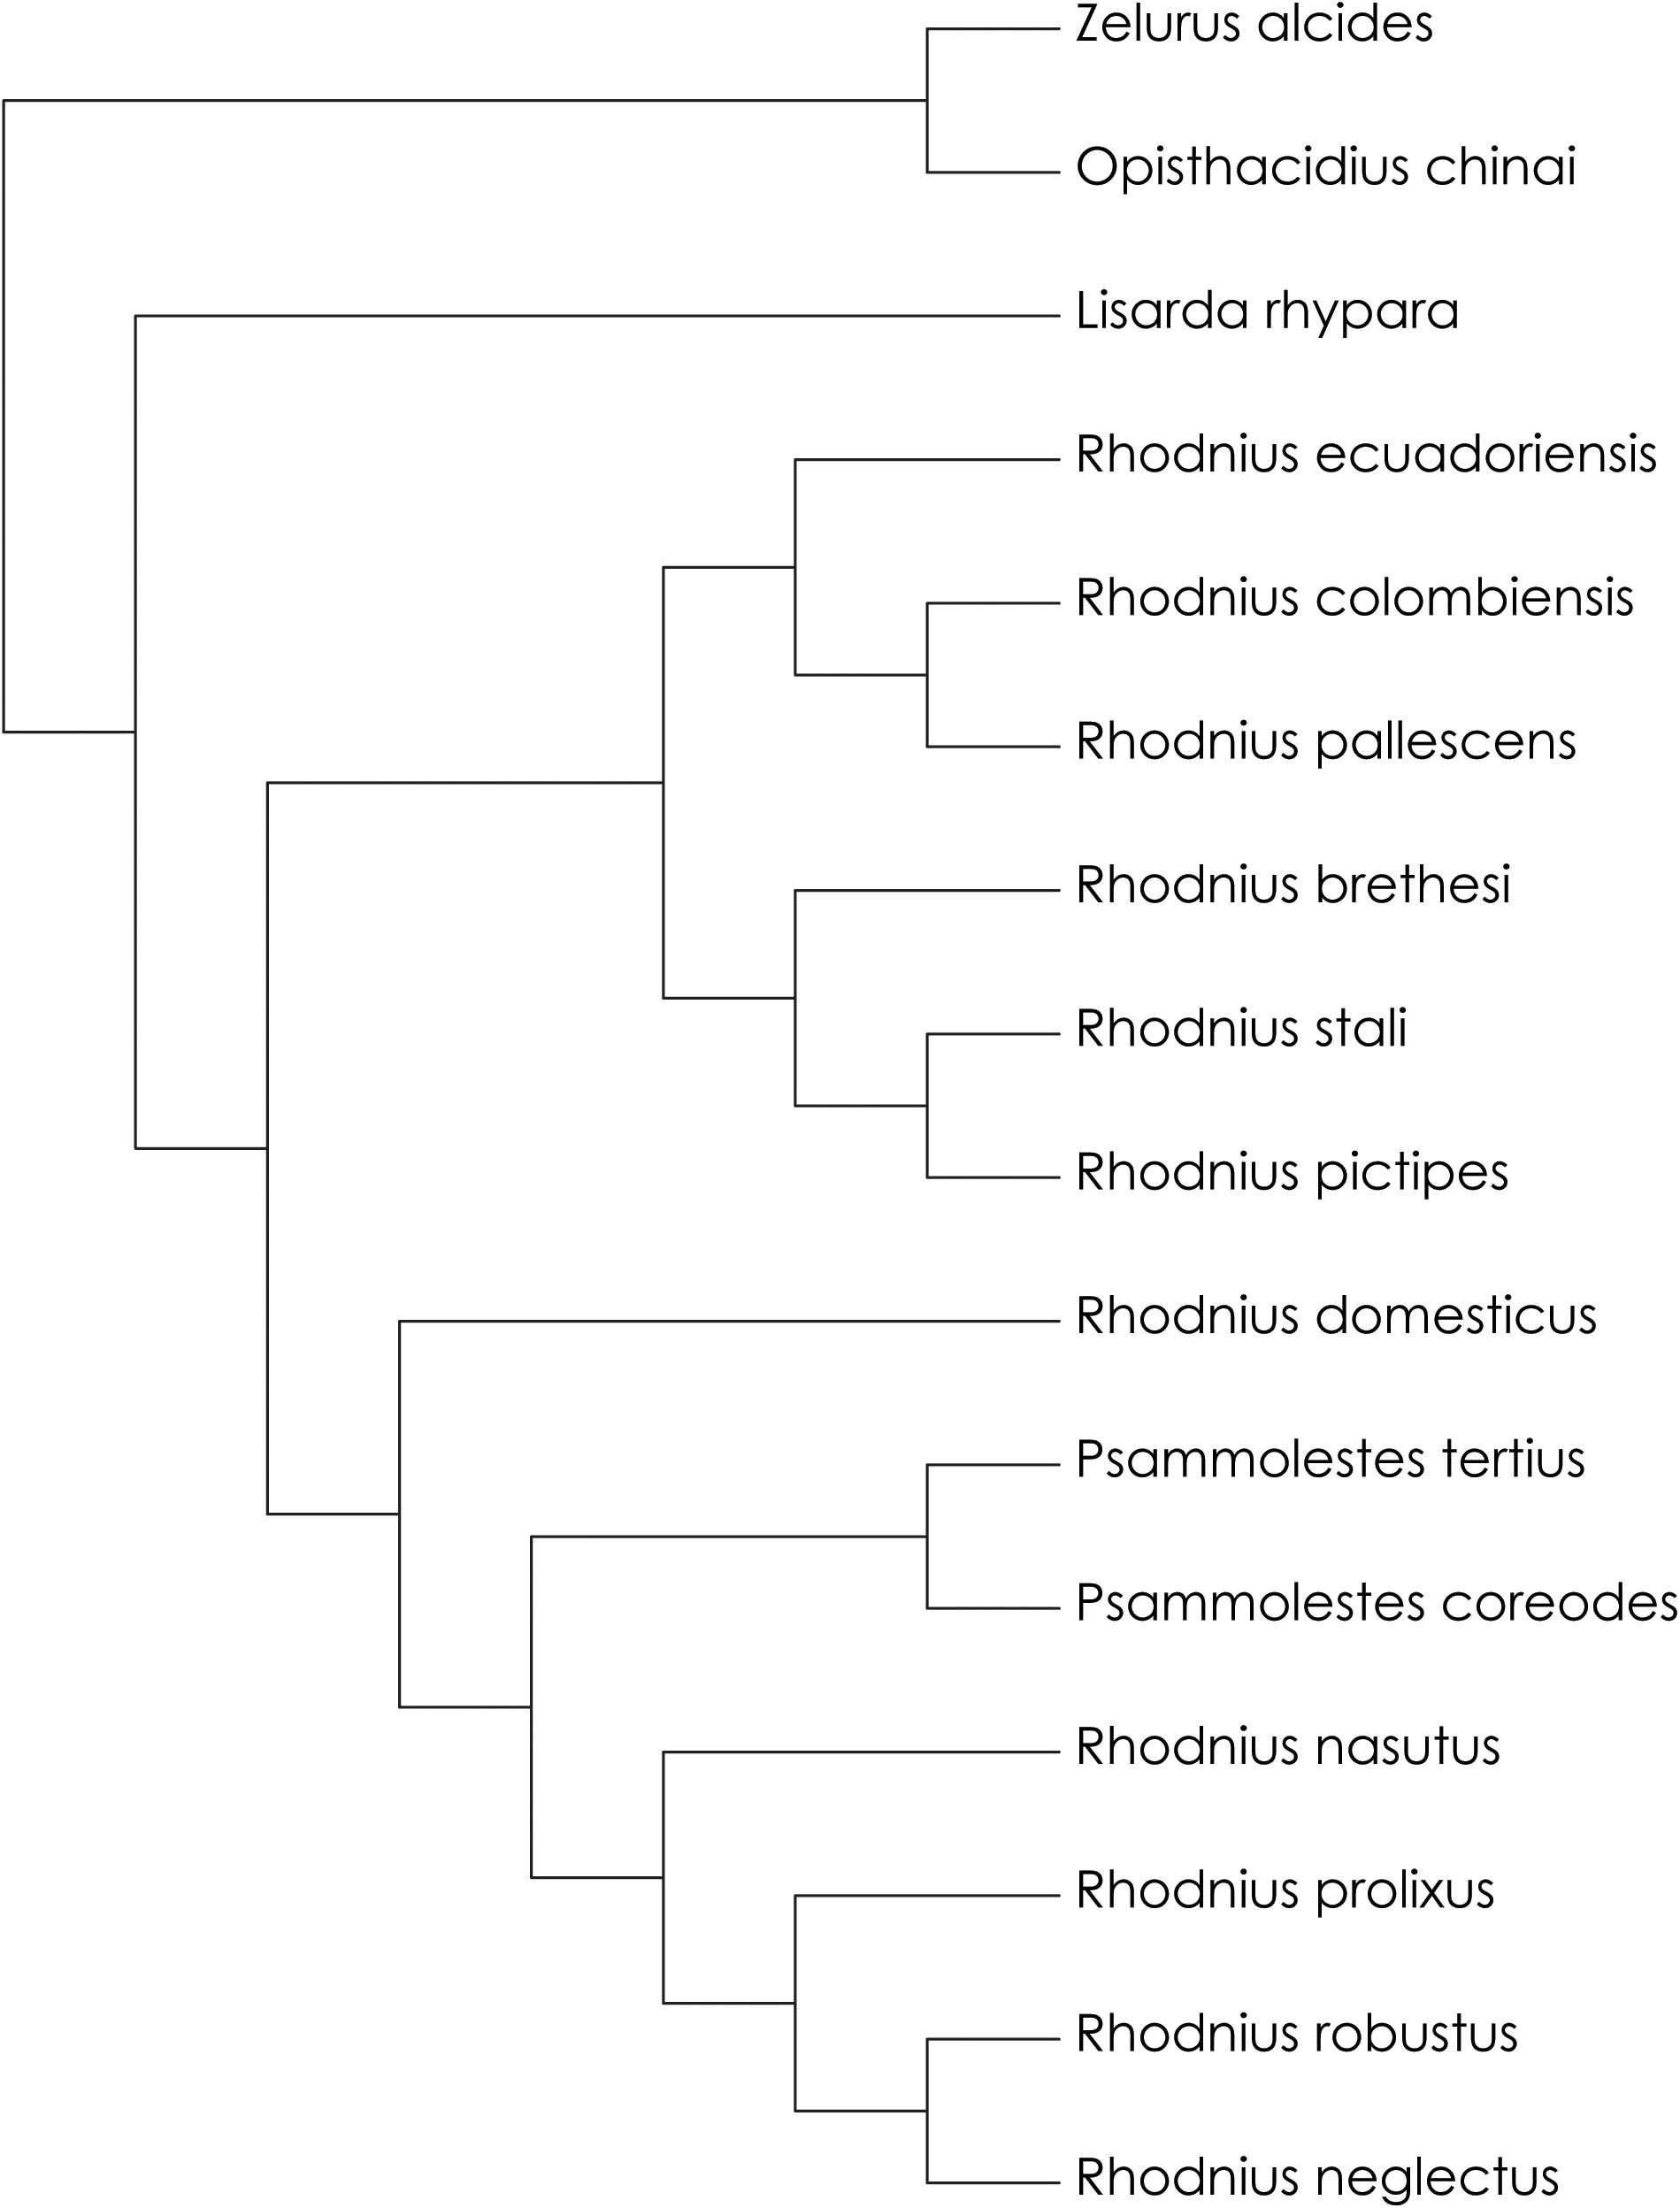
Figure 2. The topology of the maximum likelihood analysis combining 16S + 28S + wingless sequences (–ln L = 5895.714, AIC = 11833.428). It was used PAUP 4.0 in the phylogenetic analysis to derive trees based maximum likelihood (ML).
The BEAST analysis (Figure 3) showed that O. chinai and Z. alcides are more recent than the origin of the Rhodniini and originated 12.91 Mya (95% credibility interval: 0.02; 0.67). This more recent dating for the species of the subfamily Reduviinae in our results reinforces the hypothesis that Salyavatinae is closely related to Rhodniini. Four main clades appear in this figure—pallescens group, pictipes group, R. domesticus + Psammolestes, and prolixus group. The posterior probability values are strong for most of the species of Rhodniini, ranging from 1 to 0.84.
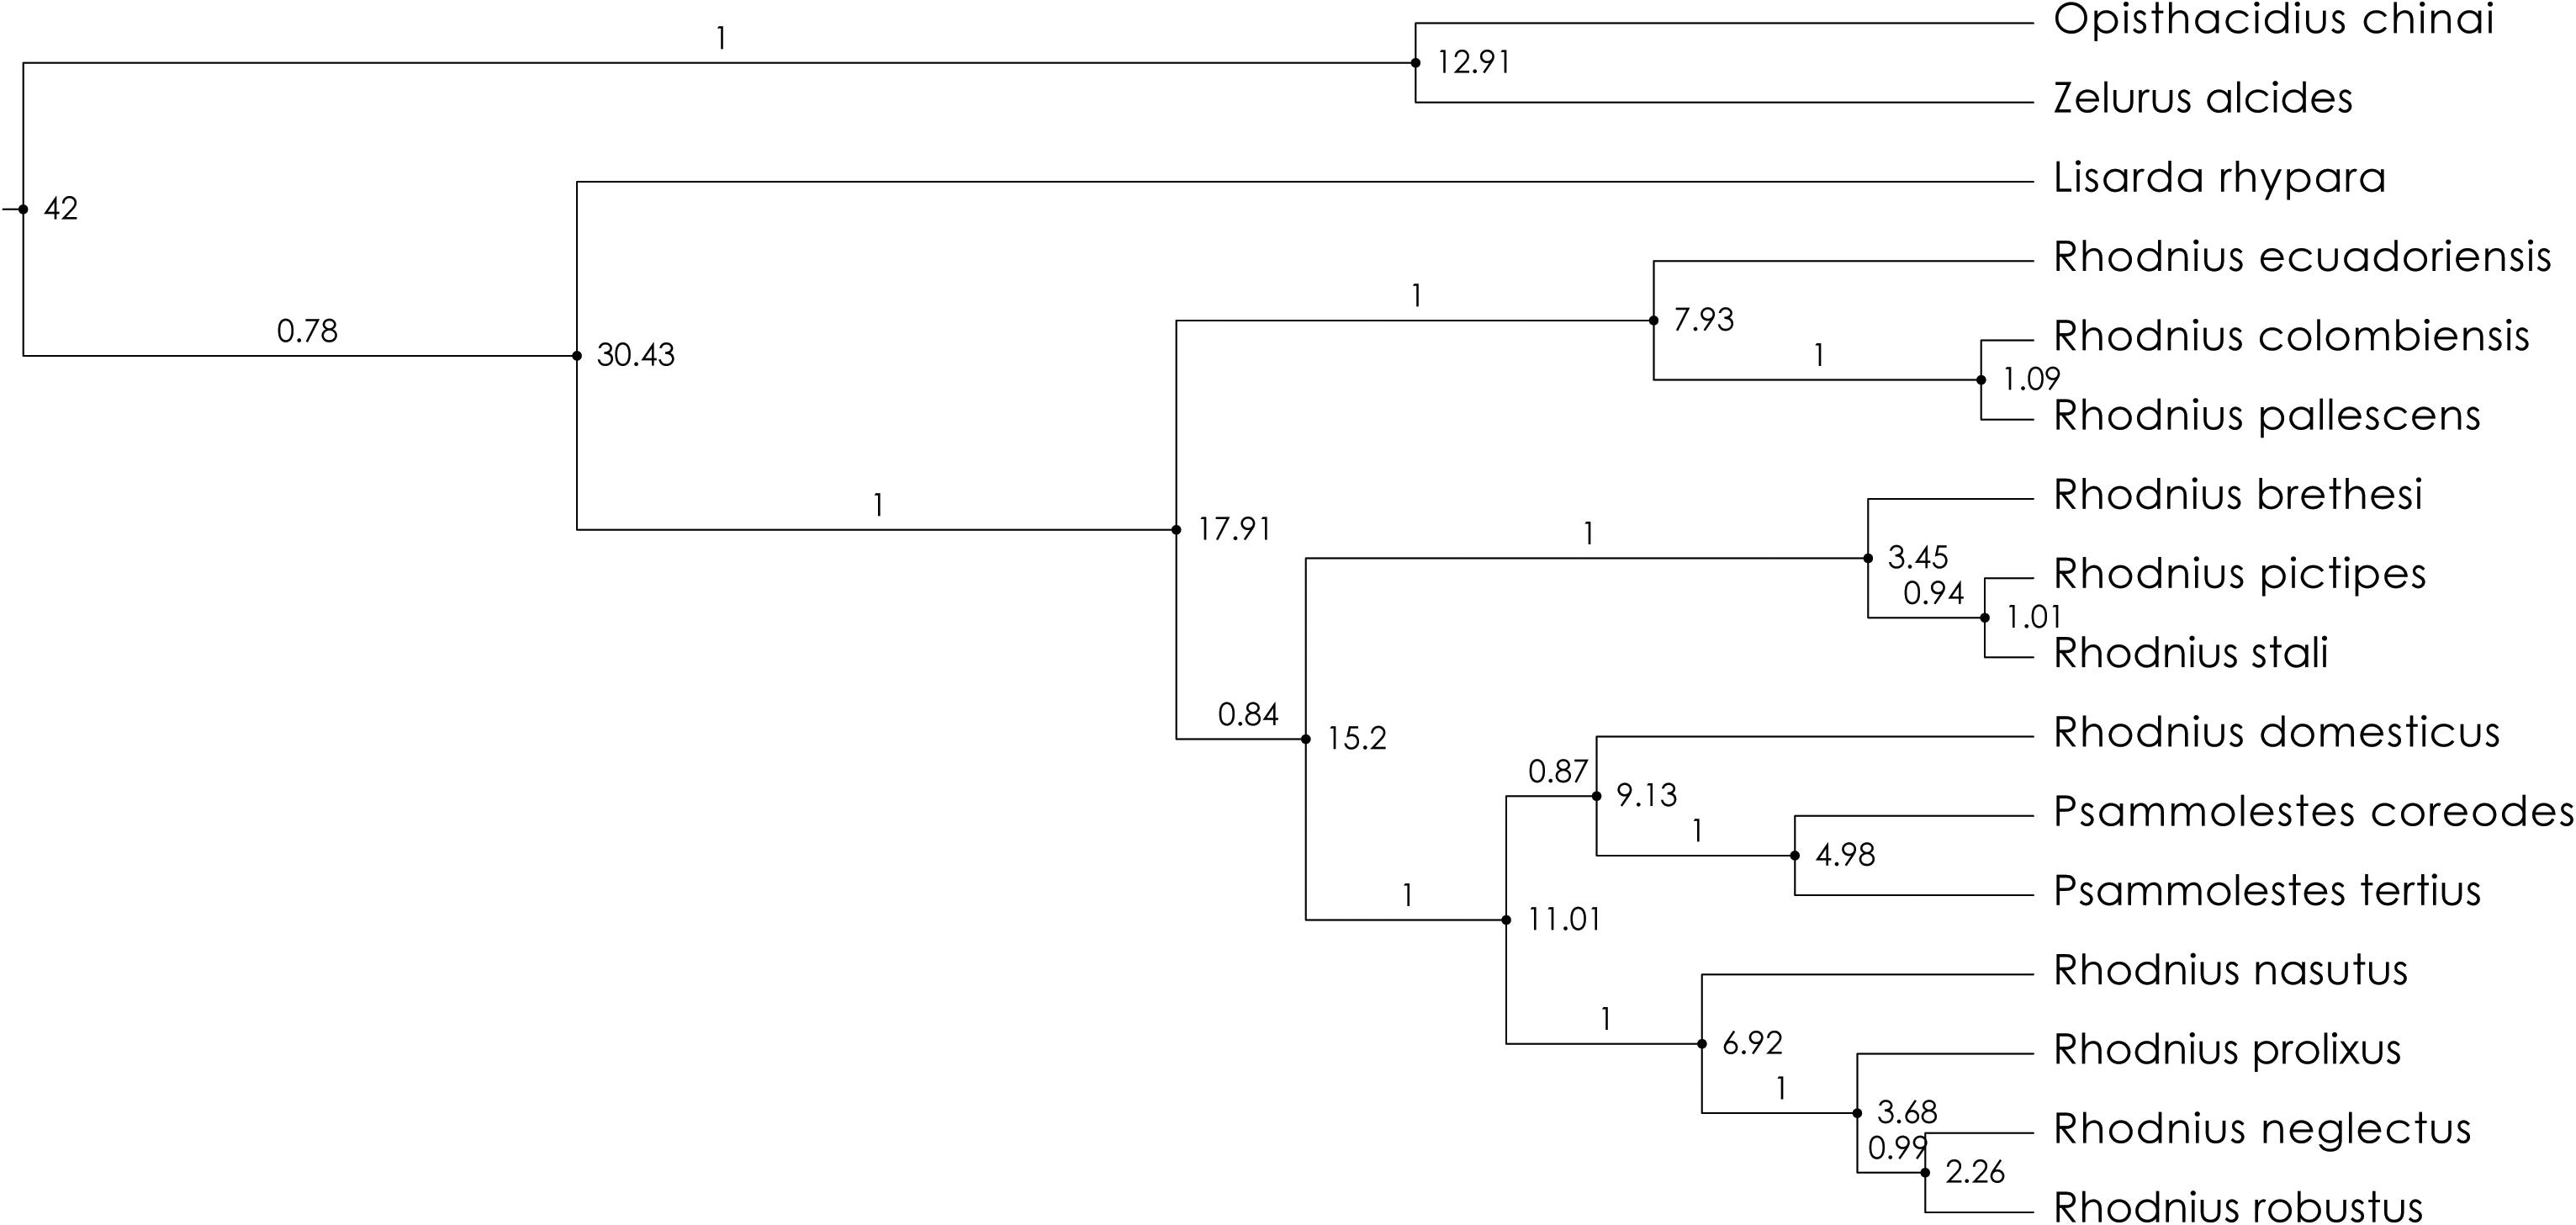
Figure 3. Molecular clock analyses (BEAST 2.6.2) combining the 16S + 28S + wingless sequences, and using gamma model, generalized time reversible (GTR), and lognormal relaxed clock. The values in the nodes represents time in millions of years ago (Mya). The values above the branches are posterior probability.
Rhodniini are closely related to Salyavatinae that are specialist termite predators and diverged from this subfamily 30.43 Mya. The origin of the Rhodniini occurred 17.91 Mya (95% credibility interval: 0.02, 0.97) (Figure 3). Following the tribe origin, four main clades have emerged, the pallescens group (7.93 Mya, 95% credibility interval: 0.01, 0.47), the pictipes group (3.45 Mya, 0.00, 0.22), the prolixus group (6.92 Mya, 0.01, 0.39), and the clade R. domesticus + Psammolestes (9.13 Mya, 0.01, 0.48). In pallescens group, R. ecuadoriensis Lent and León, 1958 had its origin 7.93 Mya (0.01, 0.47), R. colombiensis Moreno Mejía et al., 1999, and R. pallescens Barber, 1932 both 1.09 Mya (0.00, 0.08). In pictipes group, R. brethesi had its origin 3.45 Mya (0.00, 0.22), and R. pictipes Stål, 1872 and R. stali originated 1.01 Mya (95% credibility interval: 0.00, 0.07). R. domesticus had 9.13 Mya (0.01, 0.48), Psammolestes species appeared 4.98 Mya (0.00, 0.27), R. nasutus 6.92 Mya (0.00, 0.20), R. prolixus 3.68 Mya (0.00, 0.13), and R. neglectus and R. robustus 2.26 Mya (0.00, 0.00). The prolixus group split up from R. domesticus 11.01 Mya (0.01, 0.60).
Ecological Niche Model
All ecological niche models had Training AUC values above 0.8 and Test AUC values above 0.8, which confirms the high sensitivity of the analysis (Supplementary Table 5). The average values of the 10 replicate analyses based on cross validation, considering 10% training presence binomial probability, were significant, except for the species R. brethesi (0.443), R. colombiensis (0.101), R. domesticus (0.154), and R. stali (0.298). In these species, the average result was replaced by the best results among the 10 replicate analyses—R. brethesi (0.004), R. colombiensis (0.000), R. domesticus (0.023), R. stali (0.094) (Supplementary Table 5). These results were used to generate binary rasters with potential distribution areas for each individual species, where 90% of the presence points fall within the potential area (Figures 4–6, white areas).
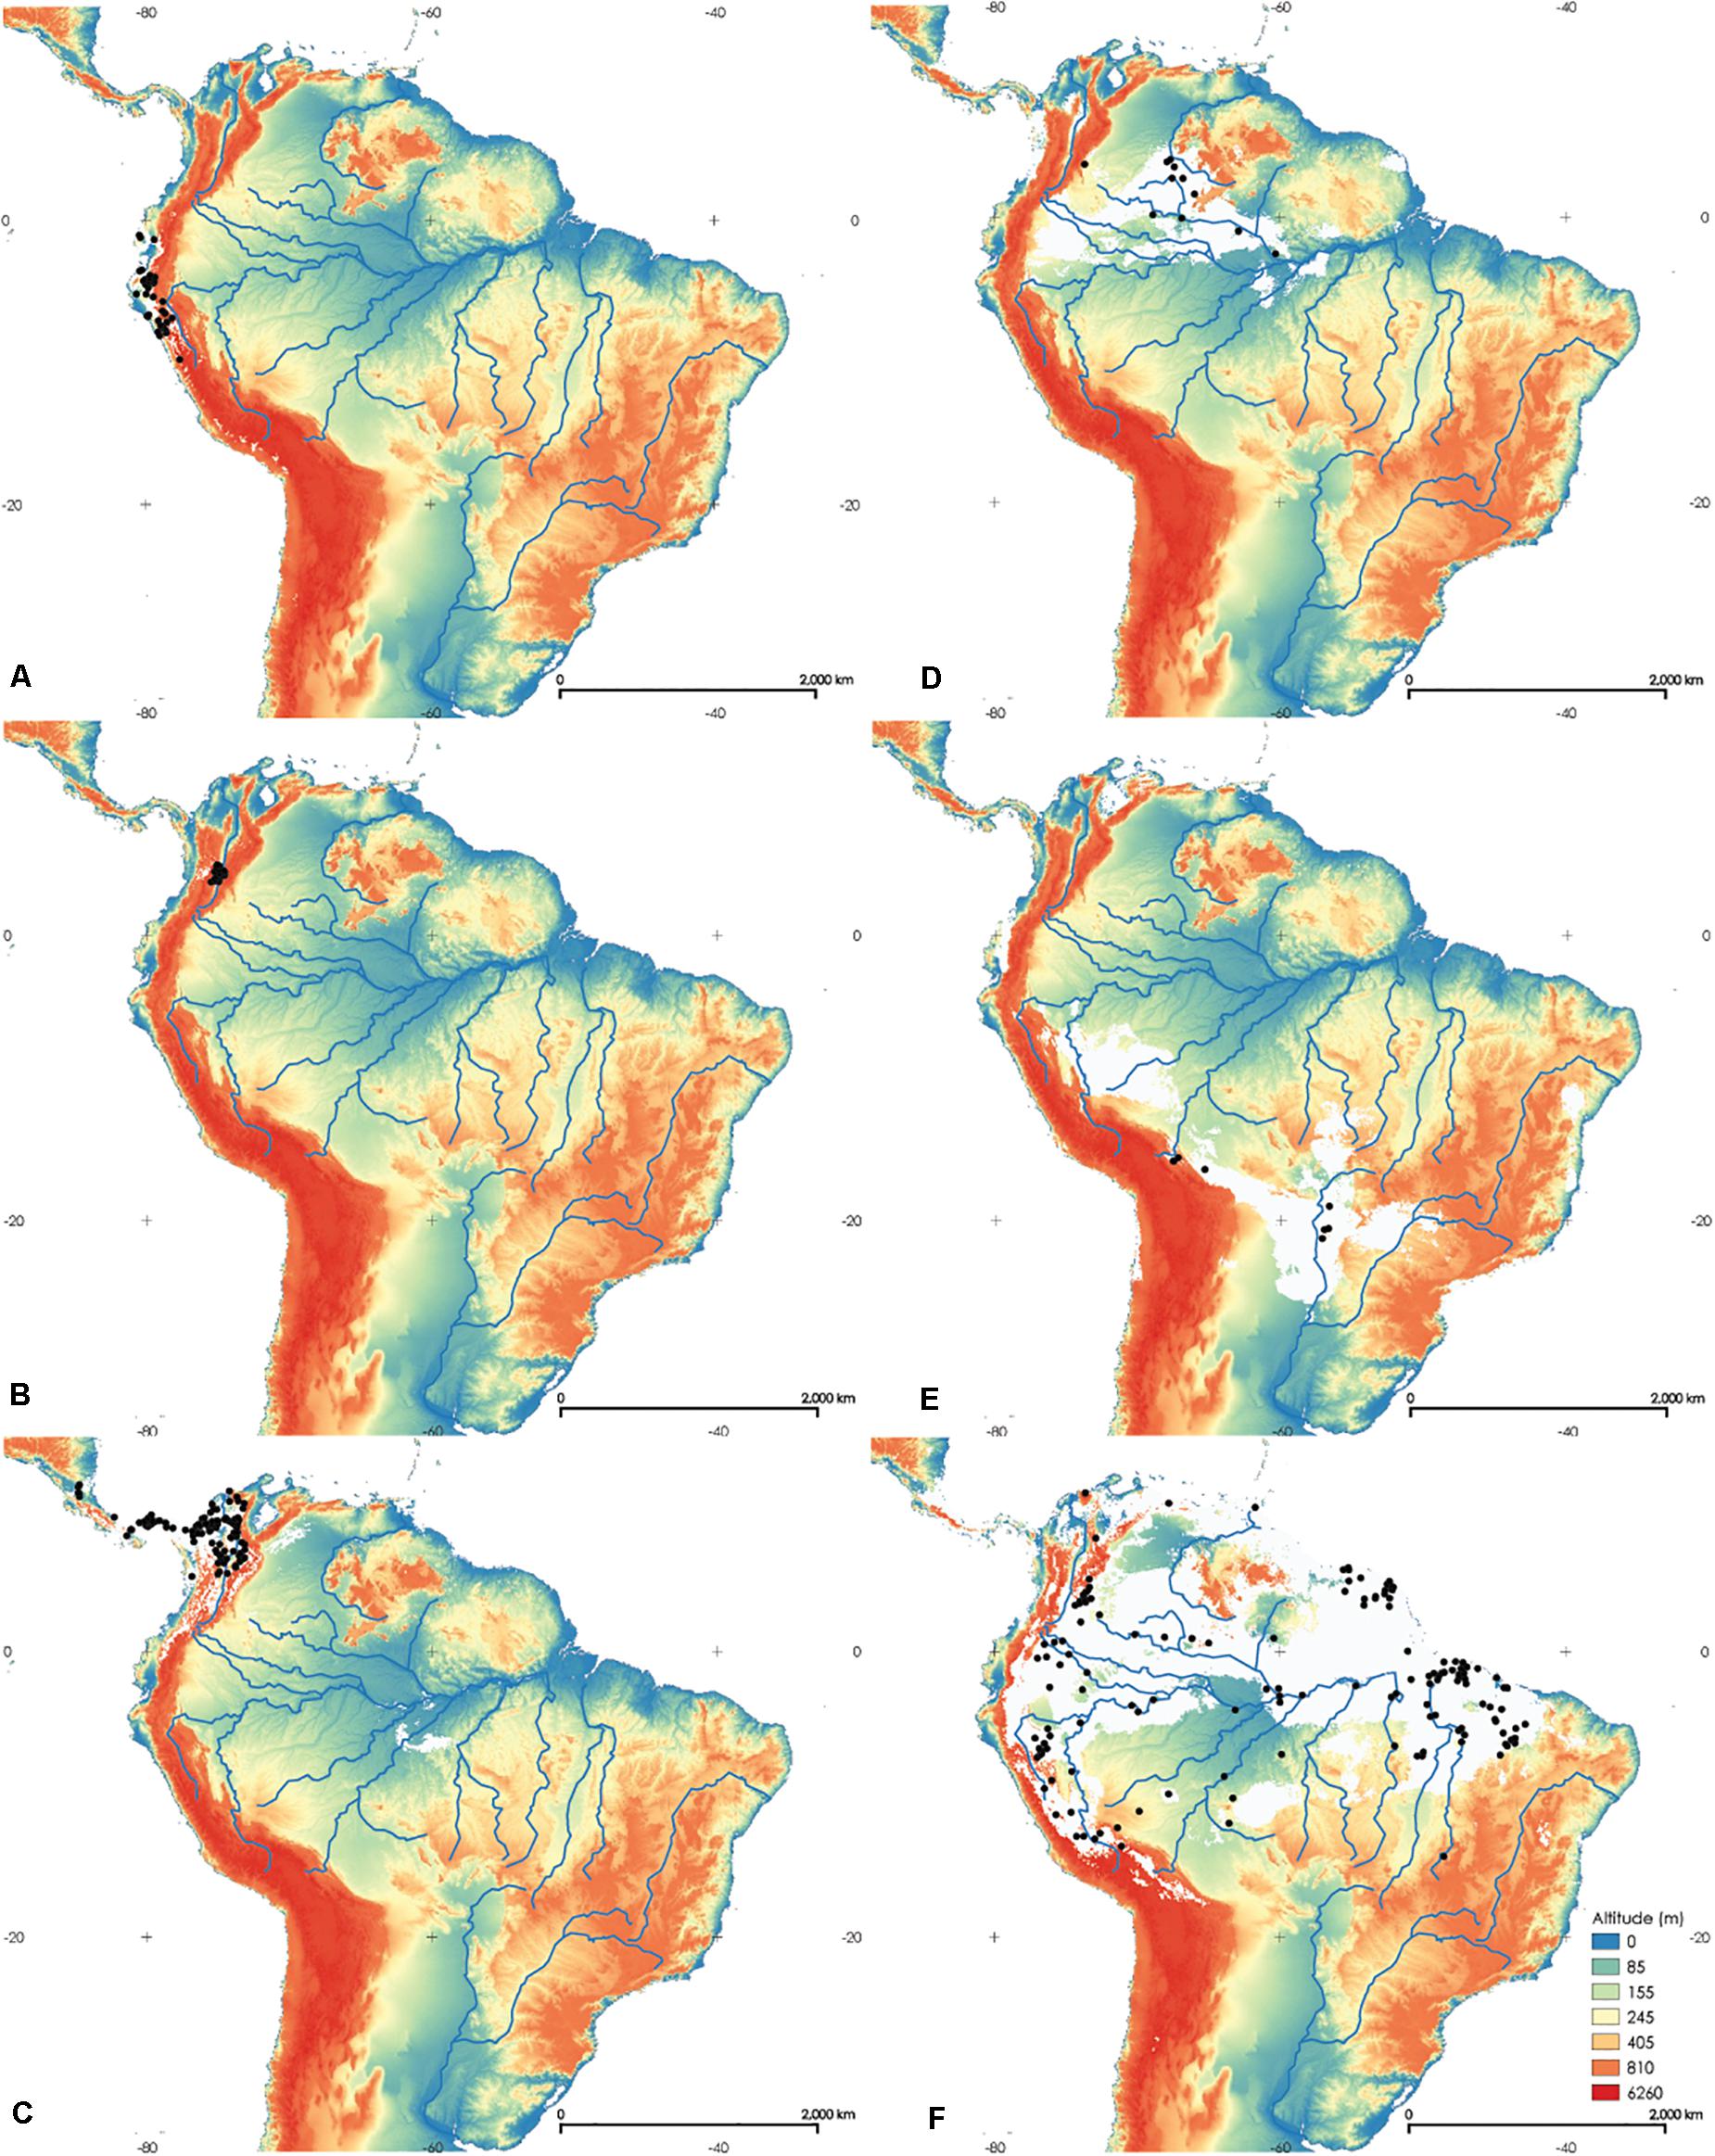
Figure 4. Maps of the potential distribution of Rhodniini based on 19 bioclimatic variables in the study area. pallescens group—(A) Rhodnius ecuadoriensis, (B) R. colombiensis, (C) R. pallescens; pictipes group—(D) R. brethesi, (E) R. stali, (F) R. pictipes. The white areas comprise the probability value at which 90% of the presence points fall within the potential area. The black dots indicate records of each species.
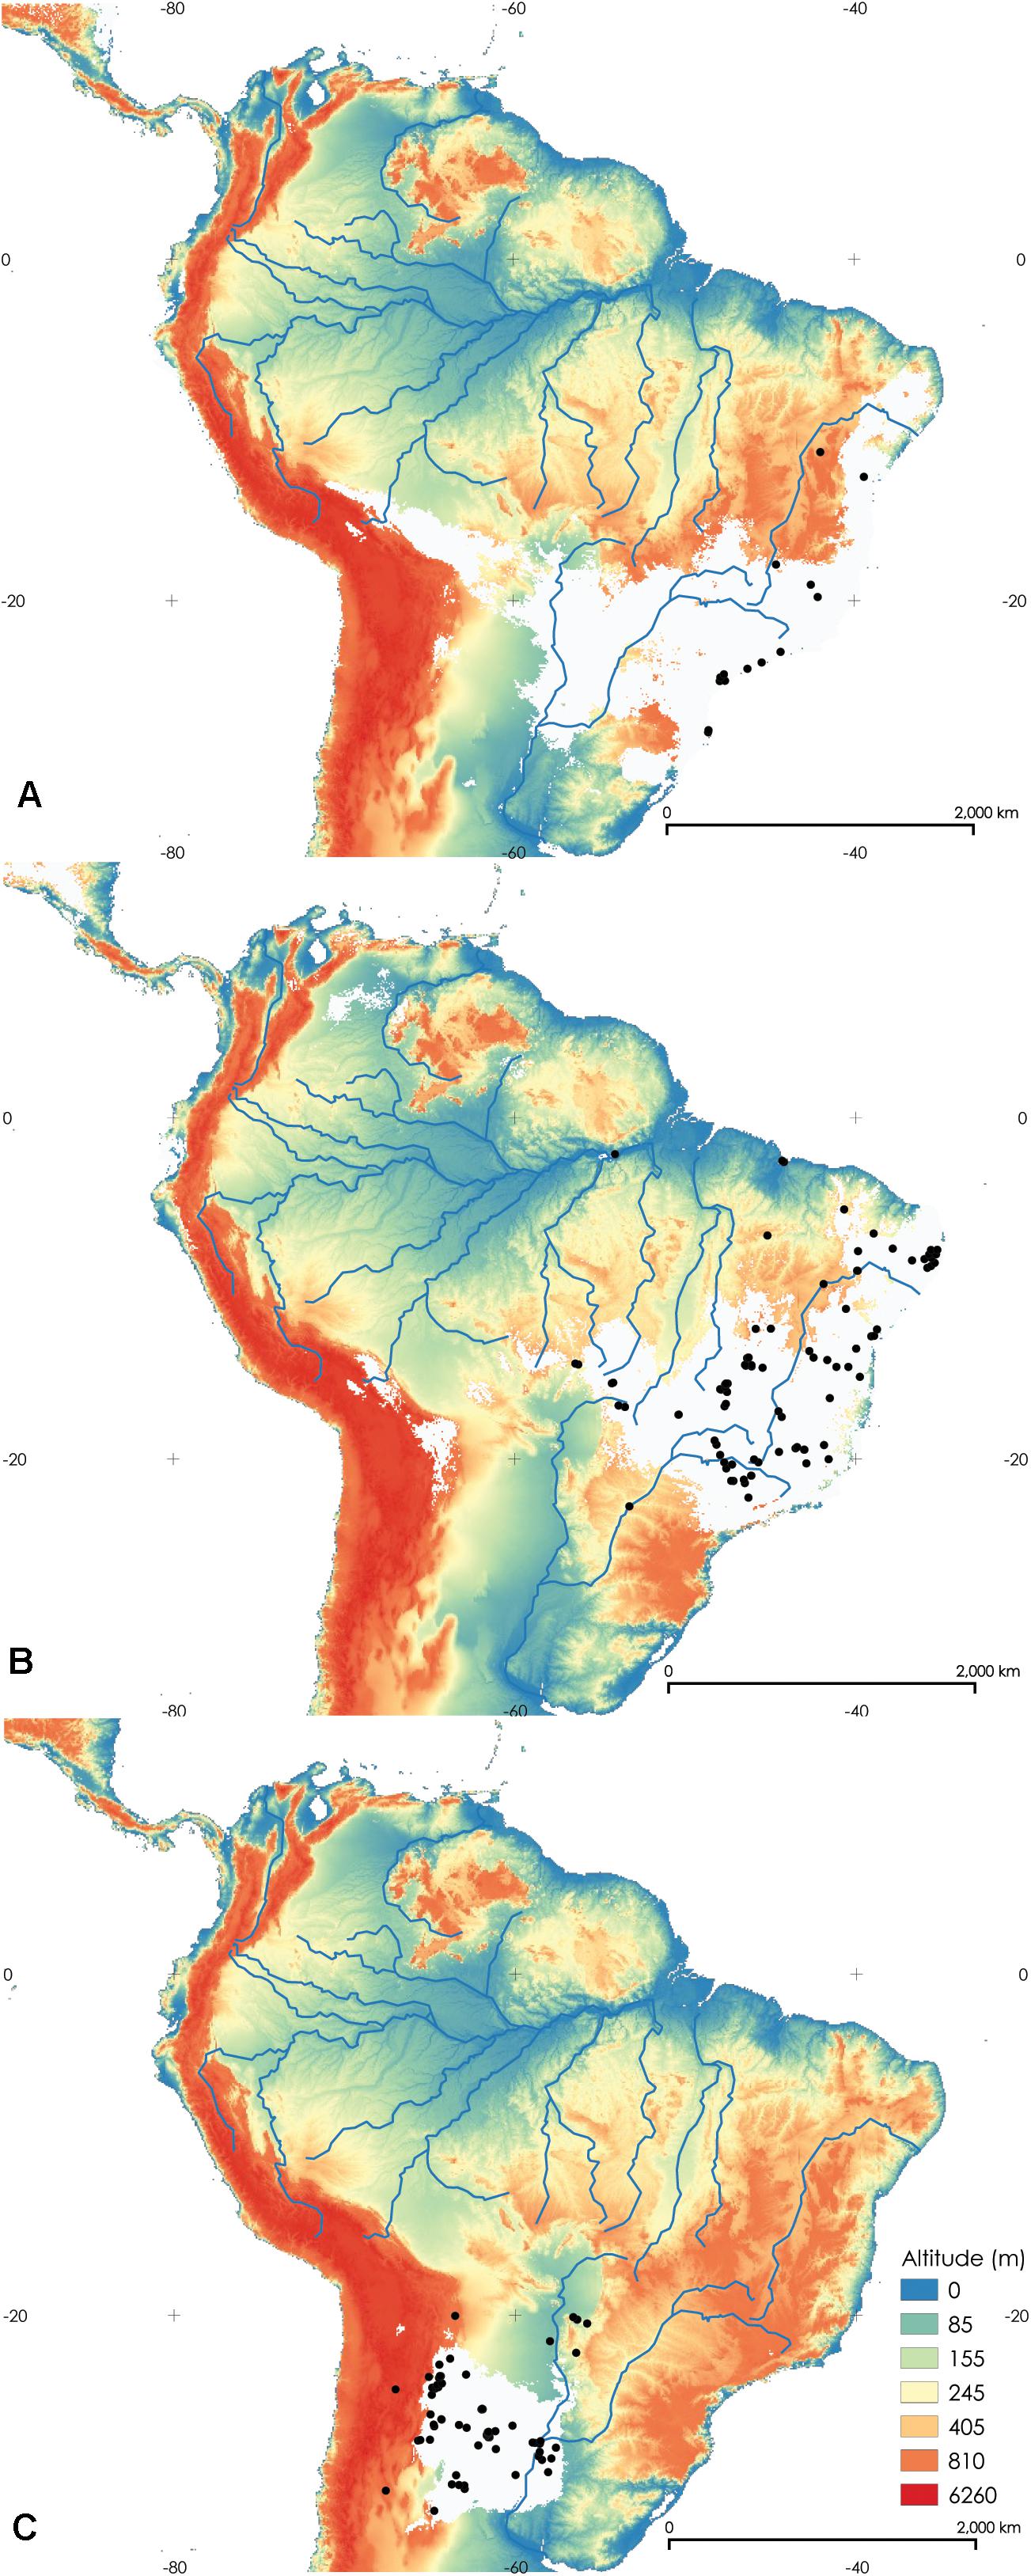
Figure 5. Maps of the potential distribution of Rhodniini based on 19 bioclimatic variables in the study area. (A) Rhodnius domesticus, (B) Psammolestes tertius, and (C) P. coreodes. The white areas comprise the probability values at which 90% of the presence points fall within the potential area. The black dots indicate records of each species.
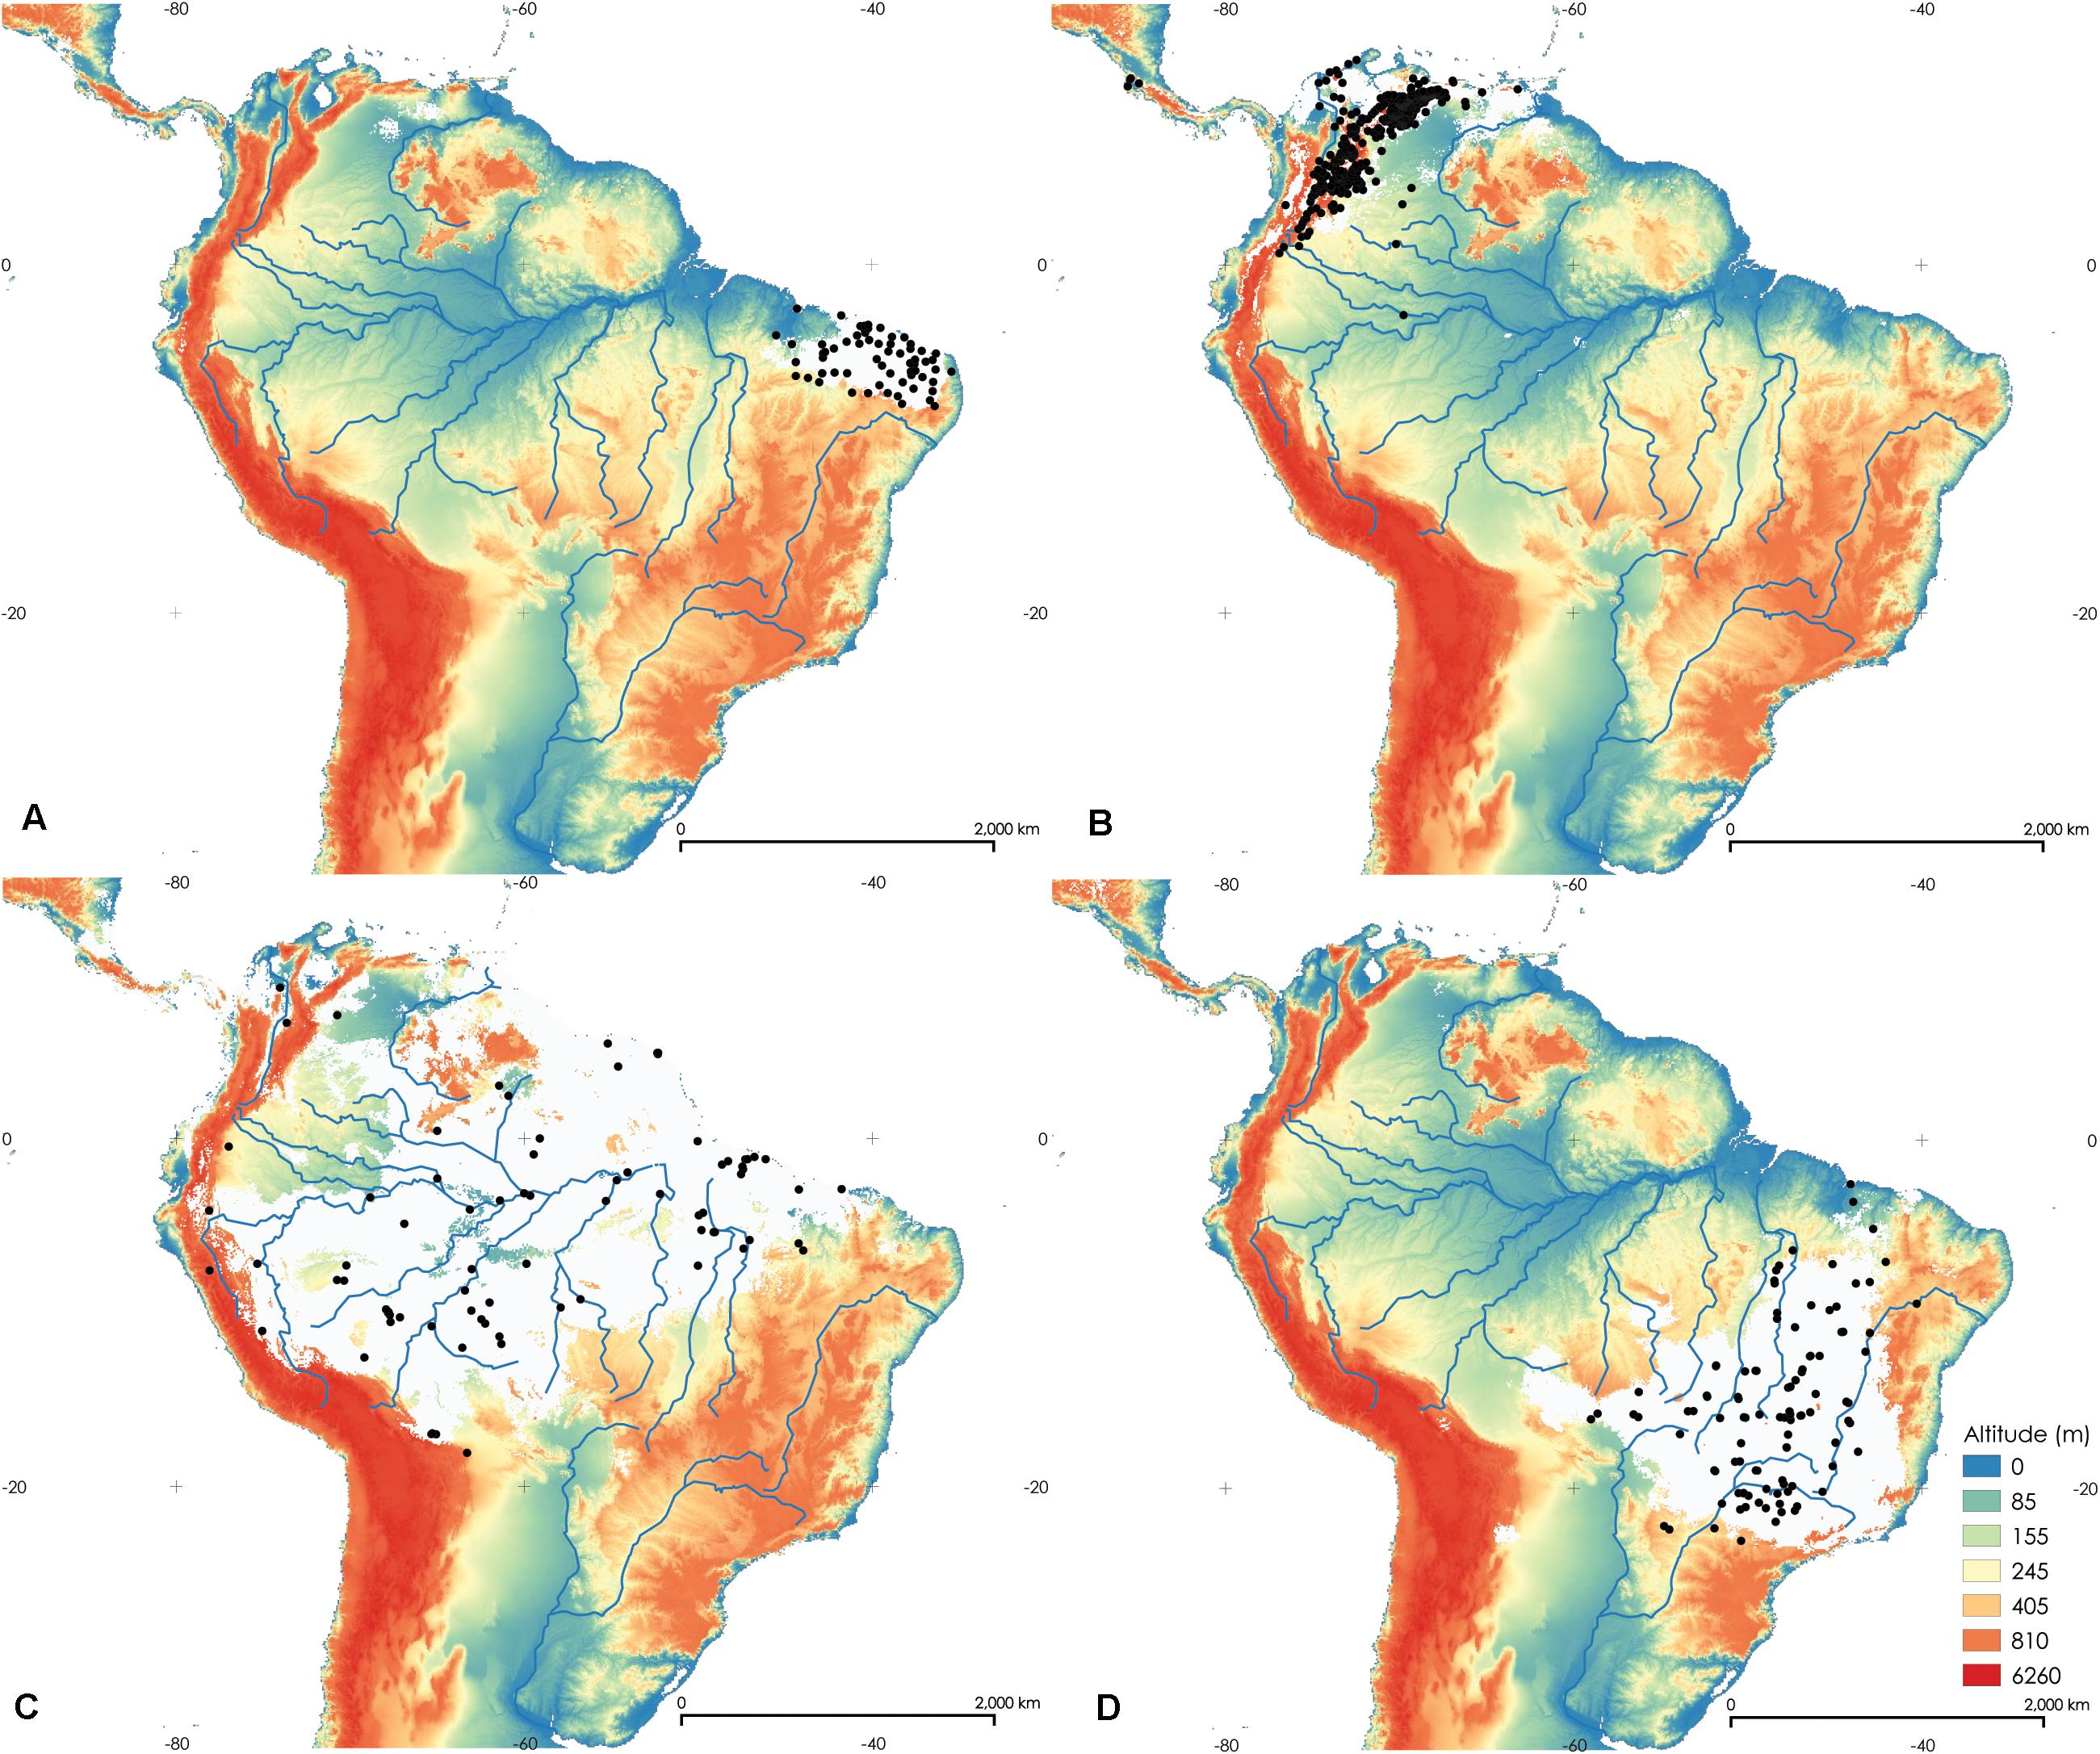
Figure 6. Maps of the potential distribution of Rhodniini based on 19 bioclimatic variables in the study area. prolixus group—Rhodnius nasutus (A), R. prolixus (B), R. robustus (C), (D) R. neglectus. The white areas comprise the probability value at which 90% of the presence points fall within the potential area. The black dots indicate records of each species.
The distribution of the species Rhodnius ecuadoriensis, R. colombiensis, and R. pallescens are shown in Figures 4A–C, and these species form the pallescens group (trans-Andean). All these species have combinations of Kappa values below 0 (performance no better than random). The Fraction correct was above 0.95. These results indicate speciation by vicariance, where the species are clearly allopatric. The pictipes group includes Rhodnius brethesi (Figure 4D), R. stali (Figure 4E), and R. pictipes (Figure 4F) (cis-Andean). Rhodnius brethesi and R. stali are clearly allopatric (Kappa = −0.083, Supplementary Table 6). Rhodnius pictipes distribution overlapped with that of R. brethesi (Kappa = 0.218) to the north of its distributional area. Rhodnius pictipes and R. stali are closely related but had little overlap in their areas of potential distribution (Kappa = −0.119). Based on this, we can assume that R. stali and R. brethesi originated by vicariance, and R. pictipes would have also originated by vicariance followed by post-speciation dispersal.
The distribution of R. domesticus is shown in Figure 5A, P. tertius Lent and Jurberg, 1965 in Figure 5B and P. coreodes Bergroth, 1911 in Figure 5C. The species P. coreodes and P. tertius are distinctively allopatric species (Kappa = −0.080). In this scenario, we can assume that P. coreodes and P. tertius originated by vicariance. P. tertius overlaps with R. domesticus (Kappa = 0.218) and P. coreodes and R. domesticus are clearly allopatric (Kappa = −0.006).
The prolixus group includes R. nasutus, R. prolixus, R. robustus, and R. neglectus. Their distributions are shown in Figures 6A–D. R. nasutus and R. prolixus are clearly allopatric (Kappa = −0.020). There is no overlap between the distribution areas of R. nasutus and R. robustus (Kappa = −0.016), and between R. nasutus and R. neglectus (Kappa = −0.006). Therefore, they are clearly allopatric. In addition, R. prolixus does not overlap with the areas of distribution of R. robustus (Kappa = −0.006) and R. neglectus (Kappa = −0.066). The other species in the group, R. robustus and R. neglectus, are allopatric (Kappa = −0.203). Consequently, all species of the prolixus group originated by vicariance.
Species Discrimination
Multivariate niches with all 19 bioclimatic variables were used to describe differences between the species. Discriminant dimensions for all Rhodniini species (Figure 7) were significantly different in the results of pairwise F-ratios for testing group differences (Supplementary Table 7). In total, 75.4% of original grouped cases were correctly classified, and 66.5% of cross-validated grouped cases were correctly classified. Wilks’ λ showed p < 0.05 for all bioclimatic variables, indicating that they are indeed significant predictors for Rhodniini species (Tests of Equality of Group Means, Supplementary Table 8). Variables in species discrimination analysis after 12 steps (Supplementary Table 9) included Temperature seasonality, Precipitation seasonality, Isothermality, Mean temperature of driest quarter, Annual mean diurnal range, Annual precipitation, Precipitation of driest quarter, Precipitation of warmest quarter, Precipitation of wettest quarter, Precipitation of wettest month, Annual temperature range, and Mean temperature of wettest quarter. These results indicate that Rhodniini species clearly show distinct multivariate niches.
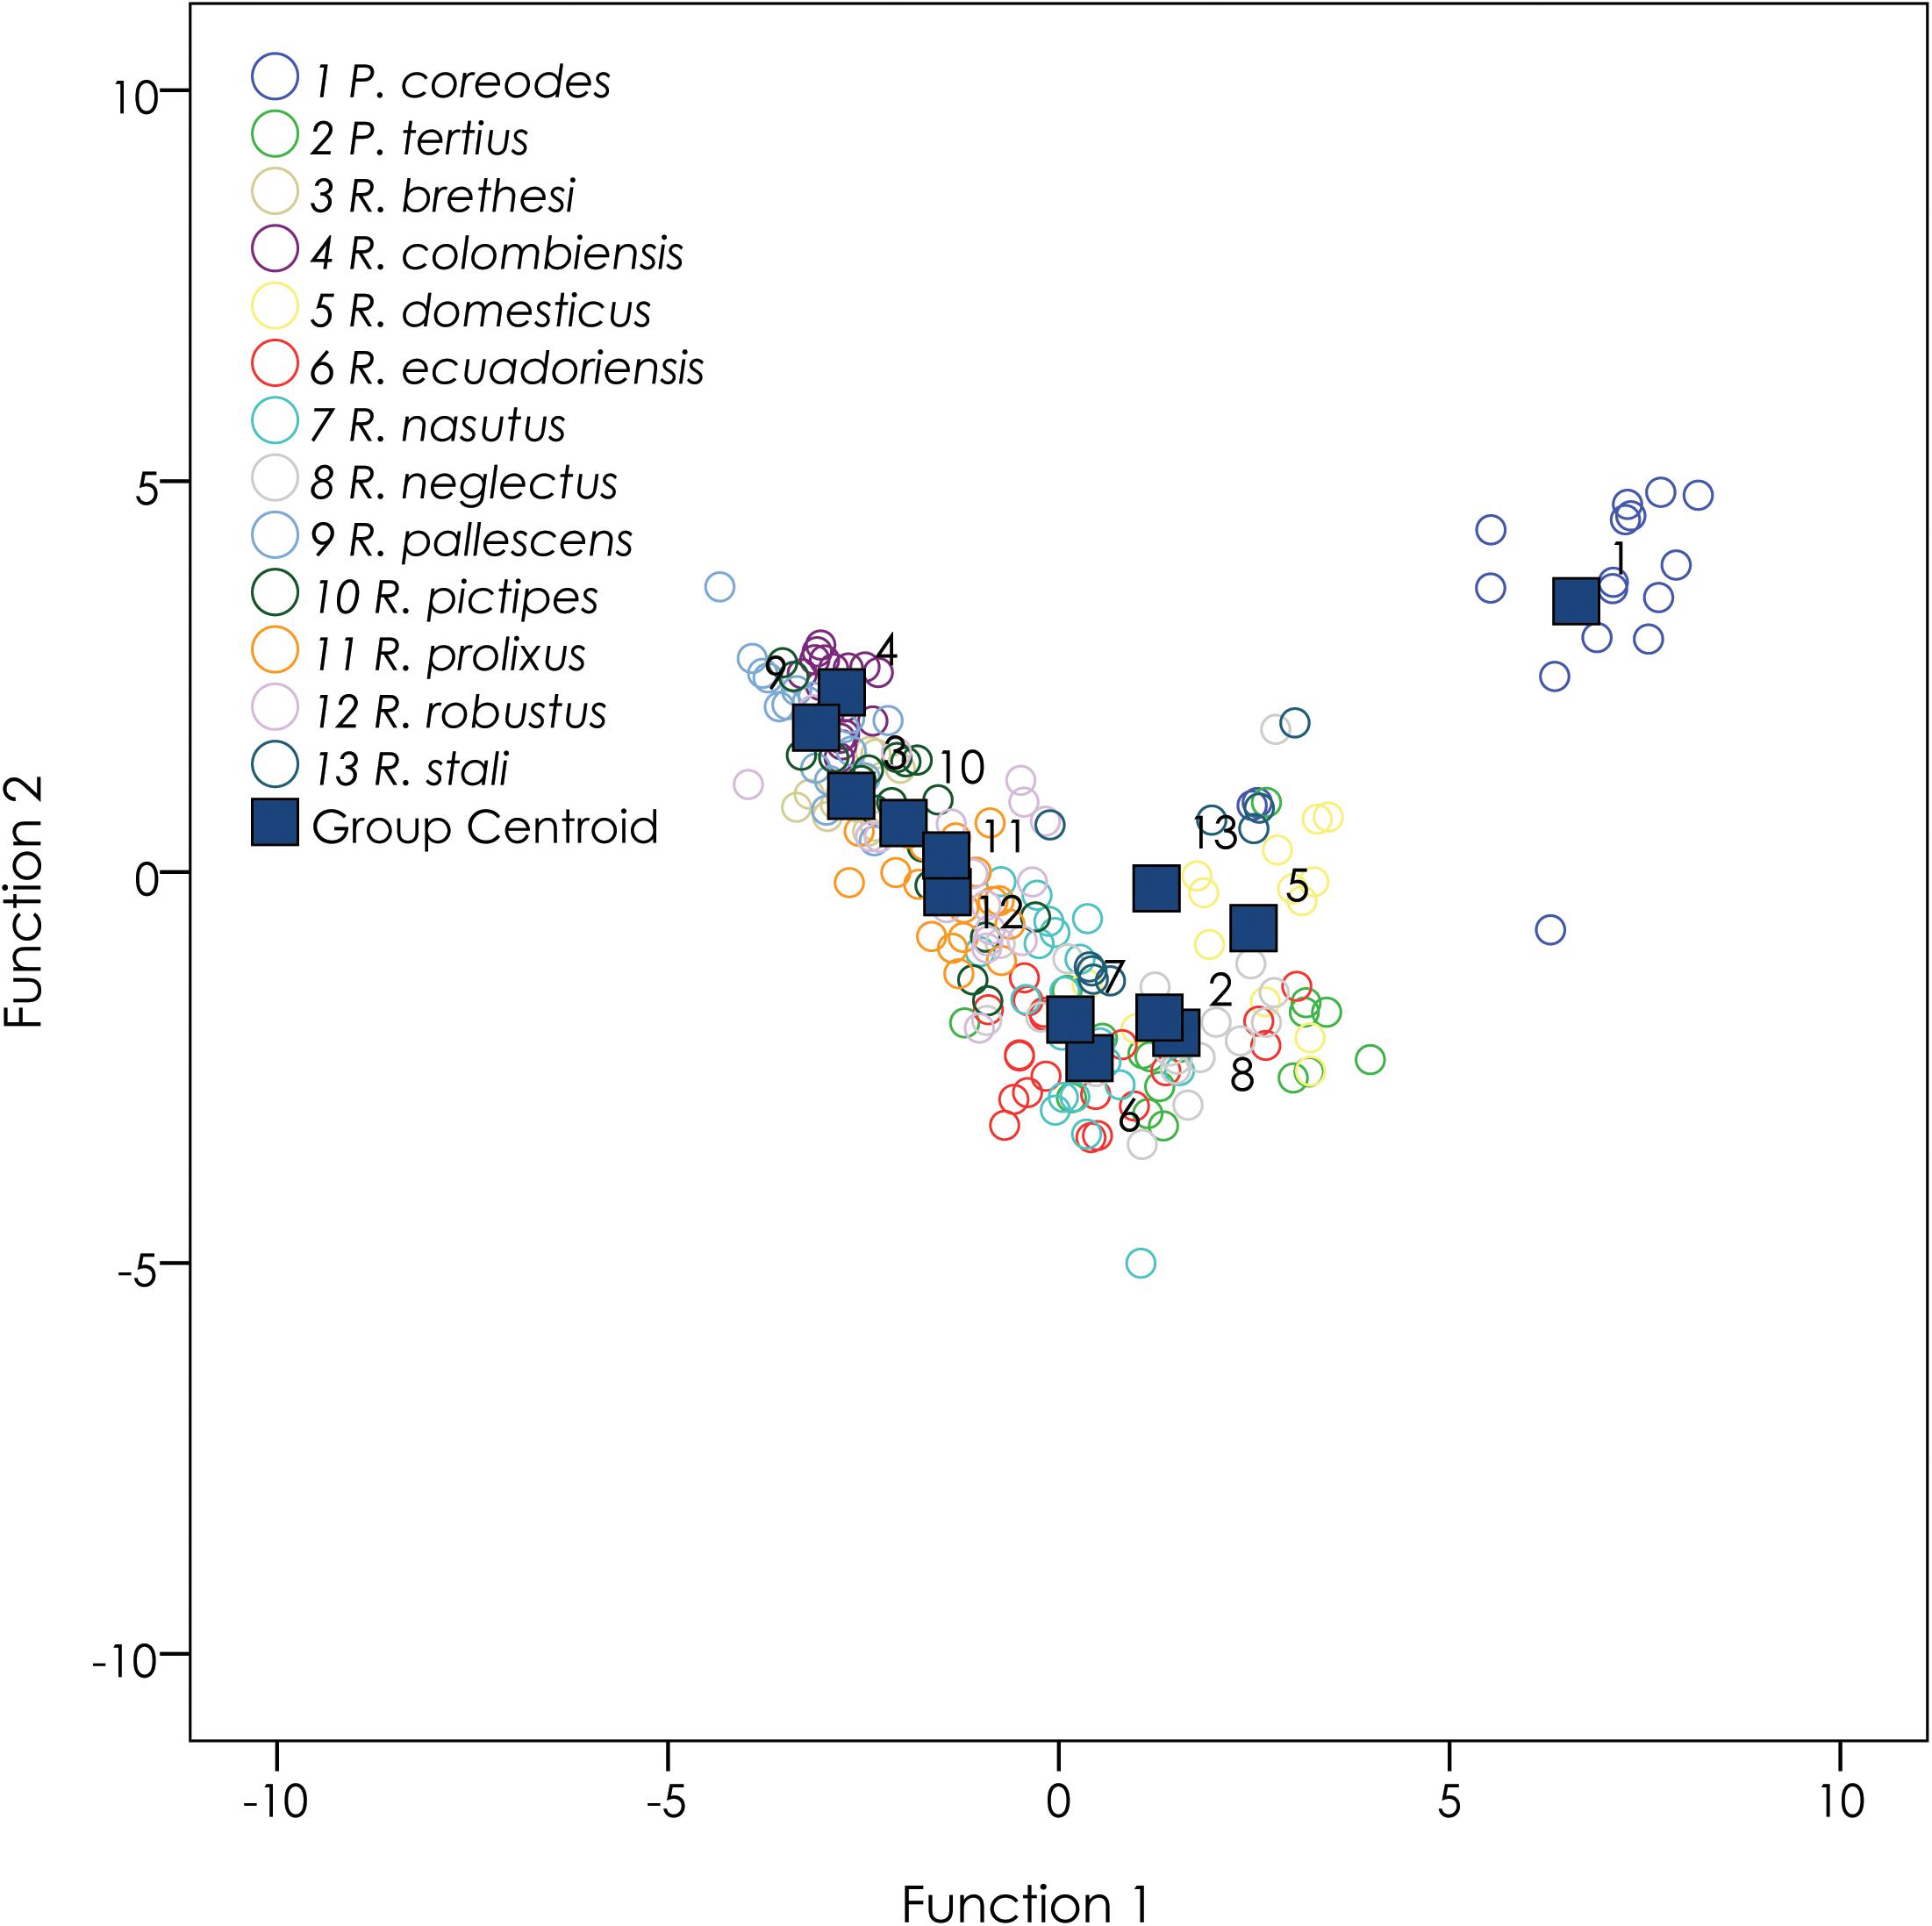
Figure 7. Linear discriminant functional analysis for Rhodniini. All species were significantly different in the results of pairwise F-ratios for testing group differences (see Supplementary Table 7). 75.4% of original grouped cases were correctly classified. 66.5% of cross-validated grouped cases were correctly classified.
Discussion
Historical Biogeography
The software TREEMAP was used by de Paula et al. (2007) to deduce taxon–area associations to propose a biogeographical hypothesis of the Rhodniini in the Neotropics. In this study, tanglegrams were used to show the relationship between the Neotropical areas of endemism and Rhodniini species. TREEMAP generated 12 optimal solutions with the lowest total cost. These optimal reconstructions required six vicariance events, 20 duplications (sympatry), at least three dispersals, and at least one extinction event. In our study, though, results indicate a parsimonious scenario comprising vicariance events. The origin of the Rhodniini tribe occurred 17.91 Mya (Figure 3), and this result is more recent than the study of Hwang and Weirauch (2012), which defined the origin of Rhodniini as 22.18 Mya. This divergence estimate is much younger than the 107 Mya age proposed by Patterson and Gaunt (2010). Although molecular and biogeographic divergences support the diversification of the species of the Rhodniini tribe (as discussed below), karyotype and chromosomal homogeneity demonstrate that species of this tribe have not suffered structural changes in chromosomes during speciation events (Alevi et al., 2018; Oliveira et al., 2018; Ravazi et al., 2021).
The formation of the Pebas system (23–10 Mya, Hoorn et al., 2010) split the clades that originate the pallescens (trans-Andean) and pictipes groups (cis-Andean) (17.91 Mya). The rapid uplift of the Eastern Cordillera between 5 and 2 Mya (Hoorn et al., 2010) may be related to the origin of the species R. colombiensis and R. pallescens (1.09 Mya). The tectonic uplifts of the Northern Andes, called Quechua 2 (9–8 Mya), may be related to the origin of R. ecuadoriensis (7.93 Mya). Hydrological connections between the Araguaia–Amazon basins in Early and Middle Miocene (20.4–9.0 Mya, Albert et al., 2018) would be a possible additional event that split the cis-Andean + trans-Andean clades of the R. domesticus + Psammolestes + prolixus group (15.2 Mya). This hydrological connection incorporated the Pantanal system in the Upper Miocene-Lower Miocene (10.0–4.5 Mya, Albert et al., 2018), resulting in the separation of Pantanal from the Atlantic Forest. This event may have contributed to the formation of Psammolestes species when P. coreodes and P. tertius were then originated (4.98 Mya).
New species establish themselves in new habitats under new climate regimes and can persist in a changing environment. Rhodnius nasutus occurs in the Borborema Province (NE Brazil), which consists of a complex mosaic of rocks composed mainly by Proterozoic metasedimentary belts that amalgamate Archean-to-Paleoproterozoic gneiss-migmatite complexes (Oliveira and Medeiros, 2018). The distribution of R. nasutus is bounded to the west by the Parnaíba River, which is trapped between the Amazonian craton and the Borborema orogenic belt (Daly et al., 2014). Arid biomes mainly expanded after 15 Mya ago by pronounced cooling events during the Miocene (10 Mya). Nearly all the dated shifts into the arid biome occurred after this time (Crisp et al., 2009). Rhodnius nasutus appeared 6.92 Mya (Figure 3) and occurs in Caatinga Steppe, an arid biome. We here propose that R. nasutus originated during cooling events, possibly when it colonized carnaúba palm trees [Copernicia prunifera (Miller)].
Rhodnius prolixus originated 3.68 Mya and its distribution area may be related to the hydrological connection between the Llanos-Amacuro basins that occurred between 10 and 4.5 Mya (Albert et al., 2018). Rhodnius robustus and R. neglectus were dated at 2.26 Mya and would probably be related to the hydrological connection between the Amazonas-Araguaia basins that occurred between 4.5 and 0 Mya (Albert et al., 2018). Lastly, the transcontinental Amazon Stage 2 (Albert et al., 2018) occurred since middle Pliocene to Recent (4.5–0 Mya), and may be related to the origin of R. stali (1.01 Mya).
Evolution of Hematophagy
Schofield (1988) proposed that different species and genera of triatomines have different ecological preferences and postulated that Triatominae may not represent a clade, but different hematophagous lineages that could have evolved independently of predatory ancestors that shared microhabitat. According to Hwang and Weirauch (2012), the evolution of blood-feeding may have occurred once or twice independently among predatory assassin bugs. All prey specialists evolved from generalist ancestors, with multiple evolutionary origins of termite and ant specializations. The hematophagous habit seen in Rhodniini is associated with major morphological, physiological and behavioral adaptations that have accumulated throughout the evolutionary history of the various lineages of blood-sucking arthropods (Lazzari et al., 2013). Hwang and Weirauch (2012) showed that the generalist predatory feeding strategy is ancestral for Reduviidae, and that all prey specialists evolved from generalist ancestors. The transition from predatory to hematophagous habits could have occurred by the colonization of vertebrate nests.
Ambrose (1999) suggested that the reduviids could be broadly divided into two groups based on whether or not they possessed tibial pads. Those without tibial pads live in tropical forest ecosystems and are known as timid predators that do not use their forelegs to capture prey, instead impaling prey items with their long rostra. Rain forest reduviids may have developed tibial pads and other features that made them more efficient predators when they migrated to deciduous scrub forest and other semi-arid habitats. Although the forelegs are more simplified in Triatominae, some species exhibit similar extendible adhesive organs (spongy pads) in both the fore and middle tibia of the adults, which allow them climbing smooth surfaces (Weirauch, 2007), a useful adaptation of hemipterans that fly and live in trees, as do species of the Rhodnius genus. Ambrose (1999) also considered the members of Salyavatinae ancestral to the subfamilies Triatominae and Ectrichodiinae. This hypothesis is supported by de Paula et al. (2005).
The pantropical Salyavatinae, subfamily used as outgroup in this study, are suspected specialist termite predators (Cobben, 1978; van Doesburg and Forero, 2012), and show morphological and camouflaging behavior that may represent adaptations to termite feeding (Weirauch, 2006). Considering Salyavatinae and Rhodniini closely related (de Paula et al., 2005, 2007), we propose a scenario where the Rhodniini’s ancestor could be pre-adapted to the invasion of bromeliads and palm trees, where they would find significant water availability and thermal damping. Rhodniini are closely related to Salyavatinae that are specialist termite predators and diverged from this subfamily 30.43 Mya (Figure 3).
Dias et al. (2011) suggested that microclimate plays an important role in establishing a stable relationship between Rhodniini species and palm trees, further influencing the adaptation of the bugs to different palm genera. Rhodniini expresses a clear thermo and hygropreference, such as amenable microclimates in terms of temperature and relative humidity (Lazzari et al., 2013). Furthermore, Rhodniini species need to find adequate shelter for protection from daylight, which can make them vulnerable to potential predators. Besides that, food source detection in Rhodniini is achieved via the detection of air currents carrying distinctive odors, water vapors and heat (Lazzari et al., 2013). Natural habitats (burrows, nests, hollow tree-trunks) provide an abundance of shelters, although many of them may not offer suitable conditions. Shelters can be subject to high temperatures, humidity and intense illumination or may not be inhabited by colonies of conspecifics. We believe that the transition from the predatory lifestyle to hematophagy may have been a gradual process that involved specialist termite predators who sought shelter in vertebrate nests and then opportunistically fed on arthropods that inhabit nests. In laboratory conditions, R. prolixus nymphs showed signs of cannibalism and cleptohematophagy (Piñero et al., 1988).
The species of the tribe Rhodniini included in this study have clearly distinct bioclimatic niches (Figure 7 and Supplementary Table 7). Consequently, the colonization of bromeliads, palm trees and nests represent important events for the speciation of these taxa. Rhodnius domesticus can be found in bromeliads, rodents and marsupial refuges, hollow trees, and under barks (Lent and Wygodzinsky, 1979; Monteiro et al., 2018). The results of our study indicate that R. domesticus is the oldest species of Rhodniini, having its origin at 9.13 Mya (Figure 3). In this scenario, the invasion of palm trees would have occurred only once, with subsequent colonization of bromeliads and bird nests in the R. domesticus + Psammolestes lineage. These clades had their origins at 15.2 Mya (pictipes), 7.93 Mya (pallescens), 11.01 Mya (prolixus + R. domesticus + Psammolestes), respectively (see Figure 3).
Psammolestes species are adapted to explore bird nest microhabitats, and seem to use palms opportunistically (Abad-Franch et al., 2015). Psammolestes species are wild and found in bird nests, mostly from birds in Furnariidae family (Lent and Wygodzinsky, 1979). For instance, the nest of Furnarius rufus (Gmelin) (Furnariidae) is a domed mud structure, with a clear separation between the breeding chamber and the outside. In general, each couple builds one nest per year, but each nest is used for one clutch or two consecutive clutches in the same breeding season. Some nests can remain in the field for 2 or 3 years, but some have a longer permanence (up to more than 8 years). Thus, the nests are widely used by other vertebrate inquilines too (Turienzo and di Iorio, 2010), which would be the source of food for the species of Psammolestes, in addition to birds. The species of Psammolestes, P. coreodes and P. tertius, have an origin dated 4.98 Mya (see Figure 3).
The results of this study indicate that the Rhodniini tribe originated 17.91 Mya ago, with R. domesticus being the oldest species, originated 9.13 Mya. The biogeographic history of the studied species comprised vicariance events. Rhodniini species clearly have distinct bioclimatic niches, and the colonization of bromeliads, palm trees and bird nests also represent important events for the speciation of these taxa. Their hematophagous habit can be described as a scenario where the ancestor of Rhodniini could have been pre-adapted to the invasion of bromeliads, palm trees, and bird nests, where it would have had available water and thermal damping. These habitats are used by vertebrates that the ancestor would have fed on. These environments are widely used by vertebrate inquilines that would be the food source for Rhodniini.
Data Availability Statement
The datasets presented in this study can be found in online repositories. The names of the repository/repositories and accession number(s) can be found in the article/Supplementary Material.
Author Contributions
ASDP: conceptualization, methodology, formal analysis, and writing. CB: methodology, formal analysis, and writing review and editing. MT: methodology, formal analysis, and writing. LD and CG: conceptualization and writing. All authors contributed to the article and approved the submitted version.
Funding
Initial phases of this work were supported by the Brazilian National Council for Scientific and Technological Development (grant nos. PIBIC 129897/2009-4 and PIBIC 117649/2010-4 to CB).
Conflict of Interest
The authors declare that the research was conducted in the absence of any commercial or financial relationships that could be construed as a potential conflict of interest.
Acknowledgments
Special thanks to Dr. Danon Clemes Cardoso (Laboratório de Genética Evolutiva e de Populações—UFOP) for critical reading and suggestions in the first draft of the manuscript. We also thank Matthew Meehan (Western University) for final comments, and JADR and AR for their constructive criticism and time. CB and MT thank UFOP for the support of their undergraduate thesis research.
Supplementary Material
The Supplementary Material for this article can be found online at: https://www.frontiersin.org/articles/10.3389/fevo.2021.660151/full#supplementary-material
Footnotes
References
Abad-Franch, F., Lima, M. M., Sarquis, O., Gurgel-Gonçalves, R., Sánchez-Martín, M., Calzada, J., et al. (2015). On palms, bugs, and Chagas disease in the Americas. Acta Trop. 151, 126–141. doi: 10.1016/j.actatropica.2015.07.005
Abad-Franch, F., Monteiro, F. A., Jaramillo, O. N., Gurgel-Gonçalves, R., Dias, F. B. S., and Diotaiuti, L. (2009). Ecology, evolution, and the long-term surveillance of vector-borne Chagas disease: a multi-scale appraisal of the tribe Rhodniini (Triatominae). Acta Trop. 110, 159–177. doi: 10.1016/j.actatropica.2008.06.005
Albert, J. S., Val, P., and Hoorn, C. (2018). The changing course of the amazon river in the Neogene: center stage for Neotropical diversification. Neotrop. Ichthyol. 16:e180033. doi: 10.1590/1982-0224-20180033
Alevi, K. C. C., de Oliveira, J., da Rosa, J. A., and de Azeredo-Oliveira, M. T. V. (2018). Karyotype evolution of Chagas disease vectors (Hemiptera, Triatominae). Am. J. Trop. Med. Hyg. 99, 87–89. doi: 10.4269/ajtmh.17-0166
Bouckaert, R., Vaughan, T. G., Barido-Sottani, J., Duchêne, S., Fourment, M., Gavryushkina, A., et al. (2019). BEAST 2.5: an advanced software platform for Bayesian evolutionary analysis. PLoS Comput. Biol. 15:e1006650. doi: 10.1371/journal.pcbi.1006650
Castro, M. R. J., Goubert, C., Carareto, C. M. A., Monteiro, F. A., and Vieira, C. (2020). Homology-free detection of transposable elements unveils their dynamics in three ecologically distinct Rhodnius species. Genes 11:170. doi: 10.3390/genes11020170
Ceccarelli, S., Balsalobre, A., Medone, P., Cano, M. E., Gonçalves, R. G., Feliciangeli, D., et al. (2018). Data descriptor: DataTri, a database of American triatomine species occurrence. Sci. Data 5:180071. doi: 10.1038/sdata.2018.71
Cobben, R. H. (1978). Evolutionary trends in heteroptera. Part II. Mouth-part structures and feeding strategies. Meded. Landbouwhogesch. Wageningen 78, 1–407.
Crisp, M. D., Arroyo, M. T. K., Cook, L. G., Gandolfo, M. A., Jordan, G. J., McGlone, M. S., et al. (2009). Phylogenetic biome conservatism on a global scale. Nature 458, 754–756. doi: 10.1038/nature07764
Daly, M. C., Andrade, V., Barousse, C. A., Costa, R., McDowell, K., Piggott, N., et al. (2014). Brasiliano crustal structure and the tectonic setting of the Parnaíba basin of NE Brazil: results of a deep seismic reflection profile. Tectonics 33, 2102–2120. doi: 10.1002/2014TC003632
de Paula, A. S., and Barreto, C. (2020). Potential distribution of Nysius simulans (Stål) (Hemiptera: Lygaeidae) in soybean crops in South America under current and future climate. J. Econ. Entomol. 113, 1702–1710. doi: 10.1093/jee/toaa089
de Paula, A. S., Diotaiuti, L., and Galvão, C. (2007). Systematics and biogeography of Rhodniini (Heteroptera: Reduviidae: Triatominae) based on 16S mitochondrial rDNA sequences. J. Biogeogr. 34, 699–712. doi: 10.1111/j.1365-2699.2006.01628.x
de Paula, A. S., Diotaiuti, L., and Schofield, C. J. (2005). Testing the sister-group relationship of the Rhodniini and Triatomini (Insecta: Hemiptera: Reduviidae: Triatominae). Mol. Phylogenet. Evol. 35, 712–718. doi: 10.1016/j.ympev.2005.03.003
Dias, F. B. S., de Paula, A. S., Belisário, C. J., Lorenzo, M. G., Bezerra, C. M., Harry, M., et al. (2011). Influence of the palm tree species on the variability of Rhodnius nasutus Stål, 1859 (Hemiptera, Reduviidae, Triatominae). Infect. Genet. Evol. 11, 869–877. doi: 10.1016/j.meegid.2011.02.008
dos Santos Souza, E., von Atzingen, N. C. B., Furtado, M. B., de Oliveira, J., Nascimento, J. D., Vendrami, D. P., et al. (2016). Description of Rhodnius marabaensis sp. n. (Hemiptera, Reduviidade, Triatominae) from Pará State, Brazil. ZooKeys 621, 45–62. doi: 10.3897/zookeys.621.9662
Edgar, R. C. (2004a). MUSCLE: a multiple sequence alignment method with reduced time and space complexity. BMC Bioinformatics 5:113. doi: 10.1186/1471-2105-5-113
Edgar, R. C. (2004b). MUSCLE: multiple sequence alignment with high accuracy and high throughput. Nucleic Acids Res. 32, 1792–1797. doi: 10.1093/nar/gkh340
Elith, J., Kearney, M., and Phillips, S. (2010). The art of modelling range-shifting species. Methods Ecol. Evol. 1, 330–342. doi: 10.1111/j.2041-210x.2010.00036.x
Fick, S. E., and Hijmans, R. J. (2017). WorldClim 2: new 1-km spatial resolution climate surfaces for global land areas. Int. J. Climatol. 37, 4302–4315. doi: 10.1002/joc.5086
Fisher, R. A. (1936). The use of multiple measurement in taxonomic problems. Ann. Eugen. 7, 179–188.
Galvão, C. (2014). Vetores da Doença de Chagas no Brasil. Curitiba: Sociedade Brasileira de Zoologia, 289.
Galvão, C. (2020). “Taxonomia dos vetores da doença de Chagas da forma à molécula, quase três séculos de história,” in Atualidades em Medicina Tropical no Brazil: Vetores, eds J. de Oliveira, K. C. C. Alevi, L. M. A. Camargo, and D. U. O. Meneguetti (Rio Branco: Stricto Sensu), 9–37. doi: 10.35170/ss.ed.9786586283129.01
Gaunt, M., and Miles, M. (2002). An insect molecular clock dates the origin of the insects and accords with palaeontological and biogeographic landmarks. Mol. Biol. Evol. 19, 748–761.
Heath, T. A. (2012). A hierarchical Bayesian model for calibrating estimates of species divergence times. Syst. Biol. 61, 793–809. doi: 10.1093/sysbio/sys032
Heled, J., and Drummond, A. J. (2010). Bayesian inference of species trees from multilocus data. Mol. Biol. Evol. 27, 570–580. doi: 10.1093/molbev/msp274
Heled, J., and Drummond, A. J. (2012). Calibrated tree priors for relaxed phylogenetics and divergence time estimation. Syst. Biol. 61, 138–149. doi: 10.1093/sysbio/syr087
Hernández, C., da Rosa, J. A., Vallejo, G. A., Guhl, F., and Ramírez, J. D. (2020). Taxonomy, evolution, and biogeography of the Rhodniini tribe (Hemiptera: Reduviidae). Diversity 12:97. doi: 10.3390/d12030097
Hijmans, R. J., Guarino, L., and Mathur, P. (2012). DIVA-GIS: A Geographic Information System for the Analysis of Species Distribution Data. California. Patent No. 5,710,835.
Ho, S. Y. W., and Phillips, M. J. (2009). Accounting for calibration uncertainty in phylogenetic estimation of evolutionary divergence times. Syst. Biol. 58, 367–380. doi: 10.1093/sysbio/syp035
Hoorn, C., Wesselingh, F. P., ter Steege, H., Bermudez, M. A., Mora, A., Sevink, J., et al. (2010). Amazonia through time: Andean uplift, climate change, landscape evolution, and biodiversity. Science 330, 927–931. doi: 10.1126/science.1194585
Hwang, W. S., and Weirauch, C. (2012). Evolutionary history of assassin bugs (Insecta: Hemiptera: Reduviidae): insights from divergence dating and ancestral state reconstruction. PLoS One 7:e45523. doi: 10.1371/journal.pone.0045523
Hypša, V., Tietz, D., Zrzavý, J., Rego, R., Galvão, C., and Jurberg, J. (2002). Phylogeny and biogeography of Triatominae (Hemiptera: Reduviidae): molecular evidence of a New World origin of the Asiatic clade. Mol. Phylogenet. Evol. 23, 447–457.
Ibarra-Cerdeña, C. N., Zaldívar-Riverón, A., Peterson, A. T., Sánchez-Cordero, V., and Ramsey, J. M. (2014). Phylogeny and niche conservatism in North and Central American Triatomine bugs (Hemiptera: Reduviidae: Triatominae), vectors of Chagas’ disease. PLoS Negl. Trop. Dis. 8:e3266. doi: 10.1371/journal.pntd.0003266
Jurberg, J., Rocha, D., da, S., and Galvão, C. (2009). Rhodnius zeledoni sp. nov. afim de Rhodnius paraensis Sherlock, Guitton & Miles, 1977 (Hemiptera, Reduviidae, Triatominae). Biota Neotrop. 9, 123–128. doi: 10.1590/s1676-06032009000100014
Justi, S. A., Galvão, C., and Schrago, C. G. (2016). Geological changes of the Americas and their influence on the diversification of the Neotropical kissing bugs (Hemiptera: Reduviidae: Triatominae). PLoS Negl. Trop. Dis. 10:e0004527. doi: 10.1371/journal.pntd.0004527
Lazzari, C. R., Pereira, M. H., and Lorenzo, M. G. (2013). Behavioural biology of Chagas disease vectors. Mem. Inst. Oswaldo Cruz 108, 34–47. doi: 10.1590/0074-0276130409
Lee, B. Y., Bacon, K. M., Bottazzi, M. E., and Hotez, P. J. (2013). Global economic burden of Chagas disease: a computational simulation model. Lancet Infect. Dis. 13, 342–348. doi: 10.1016/S1473-3099(13)70002-1
Lent, H., and Wygodzinsky, P. (1979). Revision of the Triatominae (Hemiptera, Reduviidae) and their significance as vectors of Chagas disease. Bull. Am. Mus. Nat. Hist. 163:3.
Liu, Y., Song, F., Jiang, P., Wilson, J. J., Cai, W., and Li, H. (2018). Compositional heterogeneity in true bug mitochondrial phylogenomics. Mol. Phylogenet. Evol. 118, 135–144. doi: 10.1016/j.ympev.2017.09.025
Lomolino, M. V., Riddle, B. R., and Whittaker, R. J. (2016). Biogeography, Biological Diversity Across Space and Time, 5th Edn. Sunderland, MA: Sinauer Associates, Inc.
McLachlan, G. J. (2004). Discriminant Analysis and Statistical Pattern Recognition. New York, NY: J. W. & Sons.
Merow, C., Smith, M. J., and Silander, J. A. Jr. (2013). A practical guide to MaxEnt for modeling species’ distributions: what it does, and why inputs and settings matter. Ecography 36, 1058–1069. doi: 10.1111/j.1600-0587.2013.07872.x
Mesquita, R. D., Vionette-Amaral, R. J., Lowenberger, C., Rivera-Pomar, R., Monteiro, F. A., Minx, P., et al. (2015). Genome of Rhodnius prolixus, an insect vector of Chagas disease, reveals unique adaptations to hematophagy and parasite infection. Proc. Natl. Acad. Sci. U.S.A. 112, 14936–14941. doi: 10.1073/pnas.1506226112
Monteiro, F. A., Barrett, T. V., Fitzpatrick, S., Cordon-Rosales, C., Feliciangeli, D., and Beard, C. B. (2003). Molecular phylogeography of the Amazonian Chagas disease vectors Rhodnius prolixus and R. robustus. Mol. Ecol. 12, 997–1006. doi: 10.1046/j.1365-294X.2003.01802.x
Monteiro, F. A., Weirauch, C., Felix, M., Lazoski, C., and Abad-Franch, F. (2018). Evolution, systematics, and biogeography of the Triatominae, vectors of Chagas disease. Adv. Parasitol. 99, 265–344. doi: 10.1016/bs.apar.2017.12.002
Nascimento, J. D., da Rosa, J. A., Salgado-Roa, F. C., Hernández, C., Pardo-Diaz, C., Alevi, K. C. C., et al. (2019). Taxonomical over splitting in the Rhodnius prolixus (Insecta: Hemiptera: Reduviidae) clade: are R. taquarussuensis (da) and R. Neglectus (Lent, 1954) the same species? PLoS One 14:e0211285. doi: 10.1371/journal.pone.0211285
Neiva, A., and Pinto, C. (1923). Dos hemipteros hematophagos do Norte do Brasil, com a descrição de duas novas especies. Bras. Med. 37, 73–76.
Oliveira, J., Alevi, K. C. C., Ravazi, A., Herrera, H. M., Santos, F. M., de Azeredo-Oliveira, M. T. V., et al. (2018). New evidence of the monophyletic relationship of the genus Psammolestes Bergroth, 1911 (Hemiptera, Reduviidae, Triatominae). Am. J. Trop. Med. Hyg. 99, 1485–1488. doi: 10.4269/ajtmh.18-0109
Oliveira, R. G., and Medeiros, W. E. (2018). Deep crustal framework of the Borborema Province, NE Brazil, derived from gravity and magnetic data. Precambrian Res. 315, 45–65. doi: 10.1016/j.precamres.2018.07.004
Otálora-Luna, F., Pérez-Sánchez, A. J., Sandoval, C., and Aldana, E. (2015). Evolution of hematophagous habit in Triatominae (Heteroptera: Reduviidae). Rev. Chil. Hist. Nat. 88:4. doi: 10.1186/s40693-014-0032-0
PAHO/WHO (2020). Chagas Disease. Available online at: https://www.paho.org/en/topics/chagas-disease (accessed September 6, 2020).
Patterson, J. S., and Gaunt, M. W. (2010). Phylogenetic multi-locus codon models and molecular clocks reveal the monophyly of haematophagous reduviid bugs and their evolution at the formation of South America. Mol. Phylogenet. Evol. 56, 608–621. doi: 10.1016/j.ympev.2010.04.038
Pavan, M. G., Mesquita, R. D., Lawrence, G. G., Lazoski, C., Dotson, E. M., Abubucker, S., et al. (2013). A nuclear single-nucleotide polymorphism (SNP) potentially useful for the separation of Rhodnius prolixus from members of the Rhodnius robustus cryptic species complex (Hemiptera: Reduviidae). Infect. Genet. Evol. 14, 426–433. doi: 10.1016/j.meegid.2012.10.018
Phillips, S. J. (2017). A Brief Tutorial on MaxEnt. AT&T Research. Available online at: http://biodiversityinformatics.amnh.org/open_source/maxent/ (accessed March 15, 2020).
Phillips, S. J., Anderson, R. P., Dudík, M., Schapire, R. E., and Blair, M. E. (2017). Opening the black box: an open-source release of Maxent. Ecography 40, 887–893. doi: 10.1111/ecog.03049
Phillips, S. J., Anderson, R. P., and Schapire, R. E. (2006). Maximum entropy modeling of species geographic distributions. Ecol. Model. 190, 231–259. doi: 10.1016/j.ecolmodel.2005.03.026
Phillips, S. J., Dudík, M., and Schapire, R. E. (2018). Maxent Software for Modelling Species Niches and Distributions. (Version 3.4.1). Available online at: http://biodiversityinformatics.amnh.org/open_source/maxent/ (accessed December 16, 2020).
Piñero, D. F., Carcavallo, R. U., and Fernandez, E. (1988). Canibalismo y transmisión directa de Trypanosoma cruzi entre ninfas de Rhodnius prolixus. Chagas 5, 18–22.
Quinn, G. P., and Keough, M. J. (2002). Experimental Design and Data Analysis for Biologists. New York, NY: Cambridge University Press.
Rambaut, A. (2018). FigTree. Available online at: http://tree.bio.ed.ac.uk/software/figtree (accessed November 25, 2018).
Ravazi, A., Olaia, N., de Oliveira, J., Souza, E. D. S., da Rosa, J. A., de Azeredo-Oliveira, M. T. V., et al. (2021). Revisiting the chromosomal diversification of the genus Rhodnius (Stål, 1859) (Hemiptera, Triatominae). Am. J. Trop. Med. Hyg. 104, 656–658. doi: 10.4269/ajtmh.20-0875
Research Institute for Knowledge Systems BV (2010). Map Comparison Kit 3 - User Manual. Maastricht: Research Institute for Knowledge Systems BV, 53.
Rosa, J. A., Justino, H. H. G., Nascimento, J. D., Mendonça, V. J., Rocha, C. S., de Carvalho, D. B., et al. (2017). A new species of Rhodnius from Brazil (Hemiptera, Reduviidae, Triatominae). ZooKeys 675, 1–25. doi: 10.3897/zookeys.675.12024
Sandoval, C. M., Duarte, R., Gutíerrez, R., da Silva Rocha, D., Angulo, V. M., Esteban, L., et al. (2004). Feeding sources and natural infection of Belminus herreri (Hemiptera, Reduviidae, Triatominae) from dwellings in Cesar, Colombia. Mem. Inst. Oswaldo Cruz 99, 137–140. doi: 10.1590/S0074-02762004000200004
Sandoval, C. M., Ortiz, N., Jaimes, D., Lorosa, E., Galvão, C., Rodriguez, O., et al. (2010). Feeding behaviour of Belminus ferroae (Hemiptera: Reduviidae), a predaceous Triatominae colonizing rural houses in Norte de Santander, Colombia. Med. Vet. Entomol. 24, 124–131. doi: 10.1111/j.1365-2915.2010.00868.x
Schofield, C. J. (1988). “Biosystematics of the Triatominae,” in Biosystematics of Haematophagous Insects, ed. M. W. Service (Oxford: Clarendon Press), 284–312.
Schofield, C. J., and Galvão, C. (2009). Classification, evolution, and species groups within the Triatominae. Acta Trop. 110, 88–100. doi: 10.1016/j.actatropica.2009.01.010
Swofford, D. L. (2019). PAUP. Available online at: http://phylosolutions.com/paup-test/ (accessed November 20, 2019).
Turienzo, P., and di Iorio, O. (2010). Insects found in birds’ nests from Argentina. Furnarius rufus (Gmelin, 1788) (Aves: Furnariidae) and their inquiline birds, the true hosts of Acanthocrios furnarii (Cordero & Vogelsang, 1928) (Hemiptera: Heteroptera: Cimicidae). Zootaxa 2700, 1–112.
van Doesburg, P. H., and Forero, D. (2012). Revision of the genus Salyavata Amyot & Audinet-Serville, 1843 (Heteroptera: Reduviidae: Salyavatinae). Zool. Meded. 86, 515–568.
van Vliet, J., Bregt, A. K., and Hagen-Zanker, A. (2011). Revisiting Kappa to account for change in the accuracy assessment of land-use change models. Ecol. Model. 222, 1367–1375. doi: 10.1016/j.ecolmodel.2011.01.017
Visser, H., and de Nijs, T. (2006). The map comparison kit. Environ. Model. Softw. 21, 346–358. doi: 10.1016/j.envsoft.2004.11.013
Weirauch, C. (2006). Anatomy of disguise: camouflaging structures in nymphs of some Reduviidae (Heteroptera). Am. Mus. Novit. 3542, 1–18.
Weirauch, C. (2007). Hairy attachment structures in Reduviidae (Cimicomorpha, Heteroptera), with observations on the fossula spongiosa in some other Cimicomorpha. Zool. Anz. 246, 155–175. doi: 10.1016/j.jcz.2007.03.003
Keywords: MAXENT, molecular clock, Neotropical, Rhodnius, Psammolestes, vicariance
Citation: de Paula AS, Barreto C, Telmo MCM, Diotaiuti L and Galvão C (2021) Historical Biogeography and the Evolution of Hematophagy in Rhodniini (Heteroptera: Reduviidae: Triatominae). Front. Ecol. Evol. 9:660151. doi: 10.3389/fevo.2021.660151
Received: 28 January 2021; Accepted: 12 April 2021;
Published: 10 May 2021.
Edited by:
Anthony I. Cognato, Michigan State University, United StatesReviewed by:
João Aristeu Da Rosa, Universidade Estadual Paulista Júlio de Mesquita Filho, BrazilAmanda Ravazi, São Paulo State University, Brazil
Copyright © 2021 de Paula, Barreto, Telmo, Diotaiuti and Galvão. This is an open-access article distributed under the terms of the Creative Commons Attribution License (CC BY). The use, distribution or reproduction in other forums is permitted, provided the original author(s) and the copyright owner(s) are credited and that the original publication in this journal is cited, in accordance with accepted academic practice. No use, distribution or reproduction is permitted which does not comply with these terms.
*Correspondence: Cleber Galvão, Y2xlYmVyZ2FsdmFvQGdtYWlsLmNvbQ==