 Sisimac A. Duchicela1†
 Francisco Cuesta2*†
 Carolina Tovar3†
 Priscilla Muriel4
 Ricardo Jaramillo4,5
 Edison Salazar5Esteban Pinto2,6
- 1Department of Geography and the Environment, University of Texas at Austin, Austin, TX, United States
- 2Grupo de Investigación en Biodiversidad, Medio Ambiente y Salud -BIOMAS- Universidad de Las Américas, Quito, Ecuador
- 3Jodrell Laboratory, Royal Botanic Gardens, Kew, United Kingdom
- 4Laboratorio de Ecofisiología, Escuela de Ciencias Biológicas, Pontificia Universidad Católica del Ecuador, Quito, Ecuador
- 5Independent Researcher, Quito, Ecuador
- 6University System of Georgia, Columbus State University, Columbus, GA, United States
Due to warming, changes in microclimatic temperatures have shifted plant community structure and dynamics in tundra and alpine regions. The directionality and magnitude of these changes are less known for tropical alpine ecosystems. To understand the likely trajectory of these shifts in the Andes, we conducted a warming experiment in the northern Andes—using open-top chambers (OTC). In this study, we ask (1) how do OTCs affect air and soil temperatures in microclimates of tropical alpine regions, year-round and during the dry season? (2) What are the effects of 7 years of warming on (a) the aboveground biomass (AGB) and (b) the plant taxonomic and growth form diversity? We installed five monitoring blocks in 2012 at ca. 4,200 m asl with 20 OTCs and 50 control plots randomly distributed within each block. We measured AGB, plant community diversity, and growth form diversity between 2014 and 2019. After 7 years of warming, we found significant increases in mean monthly (+0.24°C), daily (+0.16°C), and night air temperatures (+0.33°C) inside the OTCs, and the OTCs intensified microclimatic conditions during the dry season. Additionally, OTCs attenuated extreme temperatures—particularly in the soil—and the number of freezing events. AGB significantly increased in OTCs, and by 2019, it was 27% higher in OTCs than in control. These changes were driven mainly by a progressive increment of tussock grasses such as Calamagrostis intermedia, typical of lower elevations. The increase of tussocks led to a significant decrease in species diversity and evenness inside OTCs, but not in species richness after accounting by sampling time. Furthermore, cushions and herbs decreased inside OTCs. Our results show that experimental warming using OTCs in equatorial regions leads to decreased daily thermal amplitude and night temperatures rather than the level of increase in mean temperatures observed in temperate regions. The increase of tussocks and decrease in diversity of species and growth forms due to prolonged modifications in microclimatic temperature might be a step toward shrub-dominated ecosystems. Further research on this topic would help understand shifts in growth form dominance and the direction and rate of change of the system.
Introduction
In tropical alpine ecosystems, macroclimatic conditions and large-scale climatological phenomena play an important but secondary role in limiting plant life compared to microclimatic conditions (Sklenář et al., 2015). Microclimates are subtly affected by the topography, substrate, and aspect of the landscape and are also modified by plants (Anthelme et al., 2014; Opedal et al., 2015). While regional climate warming predictions for tropical alpine regions forecast an increase in temperature between 1 and 5°C with mean values of 2 and 3.5°C (Vuille et al., 2018), at a small scale, these projected increases in temperatures may differ (Cuesta et al., 2019). In tropical alpine ecosystems, the interaction between microclimatic change and its effect on vegetation is not well understood. One potential strategy is that plants might alter important functional characteristics to cope with this change (Körner, 2003) or become less dominant or even locally extinct. Therefore, it is vital to examine how changes in microclimatic temperatures affect plant diversity and productivity to further assess the consequences of climate warming on tropical alpine ecosystems.
Temperature, humidity and seasonality gradients due to elevation and latitude (Weberbauer, 1945; Troll, 1959; Sarmiento, 1986; Cuesta et al., 2017, 2020) define different ecological niches in tropical alpine systems. To fill this mosaic of niches, tropical alpine plants developed various morphological and physiological adaptations (e.g., Cleef, 1978; Smith and Young, 1987; Ramsay, 2001; Ramsay and Oxley, 2001). For example, plant community composition and growth forms change gradually as elevation increases as a coping response to harsh environmental conditions particularly, cold temperatures, where facilitation mechanisms prevail over competition (Sklenář and Ramsay, 2001; Anthelme et al., 2012).
To empirically examine the effects of climate change on mountain ecosystems, experimental studies shorten the space-time scale (i.e., warming experiments and transplant experiments) and link global warming with the dynamic changes of plant communities and their effect on ecosystem functions (Tito et al., 2020). Among the benefits that space for time experimentation provides is the potential to compare with studies that look at changes over a prolonged timeframe. Passive warming experiments use various methodologies and structures to simulate the temperatures and conditions predicted for the future. While similar studies have used open-side chambers (Pancotto et al., 2020), International Tundra Experiment (ITEX) corners, and circular chambers (Rustad et al., 2001), the method that has been successful in comparable systems is the open-top chamber (OTC) designed by ITEX (Marion et al., 1997). This OTC has a hexagonal shape made of polycarbonate sides hinged together to have a smaller area at the top of the structure than at the bottom. It allows airflow above, below and between the corners of the chamber yet retains warmth when shortwave radiation enters and delays the escape of longwave radiation, as would occur in a greenhouse, passively and minimally increasing the area’s temperature.
Currently, passive warming studies have been reported mainly for the tundra and Northern hemisphere alpine ecosystems and two in southern South America (Rustad et al., 2001; Sierra-Almeida and Cavieres, 2010; Pancotto et al., 2020; Fazlioglu and Wan, 2021). These studies have focused on understanding vegetation community responses to climate warming, including changes in biomass, plant phenology, freezing resistance mechanisms, species distribution shifts, increased dominance of certain species, and changes in the alpha and beta diversity of the ecosystem (Klein et al., 2004; Elmendorf et al., 2012; Liu et al., 2018; Yang et al., 2018). Studies that have used OTCs have reported temperature increases in mean air temperatures of 1.7°C for tropical alpine ecosystems (Lasso et al., 2021) and increases in daily soil temperatures of up to 0.4°C (Klein et al., 2004, 2007; Pancotto et al., 2020), as well as changes in the number of freezing events and their intensities (Sierra-Almeida and Cavieres, 2010). Presently, only one study has reported the effect of experimental warming on plant communities of tropical alpine ecosystems (Lasso et al., 2021), but no study has reported the long-term (over three years) effects of experimental warming in these systems.
The observed impacts of passive warming experiments on tundra/alpine vegetation are shifts in the abundance of dominant species, dominant growth forms, and changes in aboveground biomass (AGB). Studies that successfully undertook experimental warming (Klein et al., 2004; Yang et al., 2018) attributed the change in species composition to an increase in competition between current dominant species and species that migrated from lower elevations, which resulted in a decrease in species richness. For example, Klein et al. (2004) reported that warming decreased species richness by five to 14 species, depending on habitat and grazing history, in one year and by nine to 15 species in another year. Regarding growth forms, Lasso et al. (2021) reported shifts in growth form dominance, attributed to an increase in graminoids and shrubs, observed after three years of warming in the tropical alpine region of Colombia. Therefore, although it seemed that the upward migration of new species would increase species richness (Steinbauer et al., 2018, 2020), these experimental studies suggest that increase may be temporary. Moreover, the effect of climate warming could be the loss of species and growth forms characteristic of tundra/alpine ecosystems. Regarding AGB, studies have reported decreases (by a maximum of 23%; Fu et al., 2013), increases (by 72 g/m2 in 2000 and 102 g/m2 in 2001 in one site; Klein et al., 2007), or no effect on AGB or aboveground productivity due to experimental warming (Liu et al., 2018). Given these results, it is important to assess the direction and magnitude of the effect of climate warming on tropical alpine vegetation.
The tropical region of the northern Andes, also known as paramo, is a highly diverse alpine ecosystem (Sklenář et al., 2014), where the potential impact of warming on biodiversity is not well known (Buytaert et al., 2011). It has three main belt-units defined by the physiognomy and structure of the vegetation: (1) the subpáramo or shrub páramo, (2) grass páramo, and (3) superpáramo. These belt units are equivalent to the subalpine, alpine, and subnival belts. Along the elevational gradient, shrubs (e.g., Pentacalia, and Diplostephium) and tussock grasses (e.g., Calamagrostis, Festuca) decrease in dominance in favor of cushion plants (e.g., Azorella), acaulescent rosettes (e.g., Werneria), sclerophyllous shrubs (e.g., Loricaria), and short-stem tussock grasses (e.g., Poa) (Cleef, 1981; Ramsay and Oxley, 1997; Sklenář and Balslev, 2005, 2007).
In this study, we analyze for the first time the effects of a prolonged passive warming experiment (7 years) on plant communities in the páramo habitats of Ecuador. By implementing a warming experiment using OTCs installed in the Yanacocha Reserve in 2012, we seek to answer the following questions: (1) How do OTCs affect air and soil temperatures in the microclimate of tropical alpine regions year-round and during the dry season? Furthermore, how are these temperatures affected in the dry season? (2) What are the effects of 7 years of continuous passive experimental warming on (a) the AGB and (b) species diversity, and (c) growth form diversity of tropical alpine ecosystems?
In terms of the effects of the OTCs on microclimate temperatures, given the results reported from multiple studies (Klein et al., 2004, 2007; Sierra-Almeida and Cavieres, 2010), we expected daily mean air temperature to increase a minimum of 0.4°C and a smaller increase in soil temperature to a maximum of 0.4°C. We expected these differences to be particularly noticeable in the dry season. Regarding biodiversity, we expected to find a decrease in species diversity and evenness due to a dominance of certain species characteristic of lower elevations. Given the gradual change in species and growth form diversity as elevation increases, we expected changes in growth form diversity. For example, we expected an increase in graminoid and shrub species because their growth form might be more resilient to changes in microclimatic conditions or, in the case of shrubs, higher temperatures result in favorable conditions for them (Harte and Shaw, 1995; Cruz-Maldonado et al., 2021; Lasso et al., 2021). While there has not been a clear trend for AGB under warming conditions, we expected an increase in AGB due to the previously mentioned increase in shrubs and graminoids that may contribute more biomass per square meter than other growth forms.
Materials and Methods
Study Area
The Yanacocha Reserve, located about 15 km northwest of Quito, the capital of Ecuador (Figure 1A), was created by the Jocotoco Foundation, a World Land Trust Partner spanning 1,200 ha (960 ha of montane evergreen forest and 240 ha of páramo). The study area, embedded in the eastern flank of the Pichincha Volcanic Complex, is located in the western mountain range of the Andes in Ecuador. The western mountain range is found in Ecuador’s north and central regions and is geologically more recent than the eastern mountain range (Hughes and Pilatasig, 2002). It is influenced climatically by air masses that originate in the Pacific Ocean (Vuille et al., 2000). Precipitation varies seasonally—there is more precipitation between January and May and October to December, whereas June through September is the dry season (Navarro-Serrano et al., 2020). The average annual precipitation is 1,500 mm year–1 (Rugel, 2019) and less than 250 mm for the dry season (Sklenář et al., 2008). Therefore, a decrease in monthly rainfall during the dry season, coupled with increased UV radiation due to cloud-free skies leads to augmented thermal convection, resulting in higher maximum and minimum daily temperatures. Soils within the Yanacocha Reserve study area are Andosols, typical of the high Andes (WRB, 2015) with well-defined layers of volcanic ash intercalated with the organic layers. The topsoil layer in both forest and páramo varies from 15 to 18 cm in depth containing more than 7% of soil organic matter (Calderón-Loor et al., 2020).
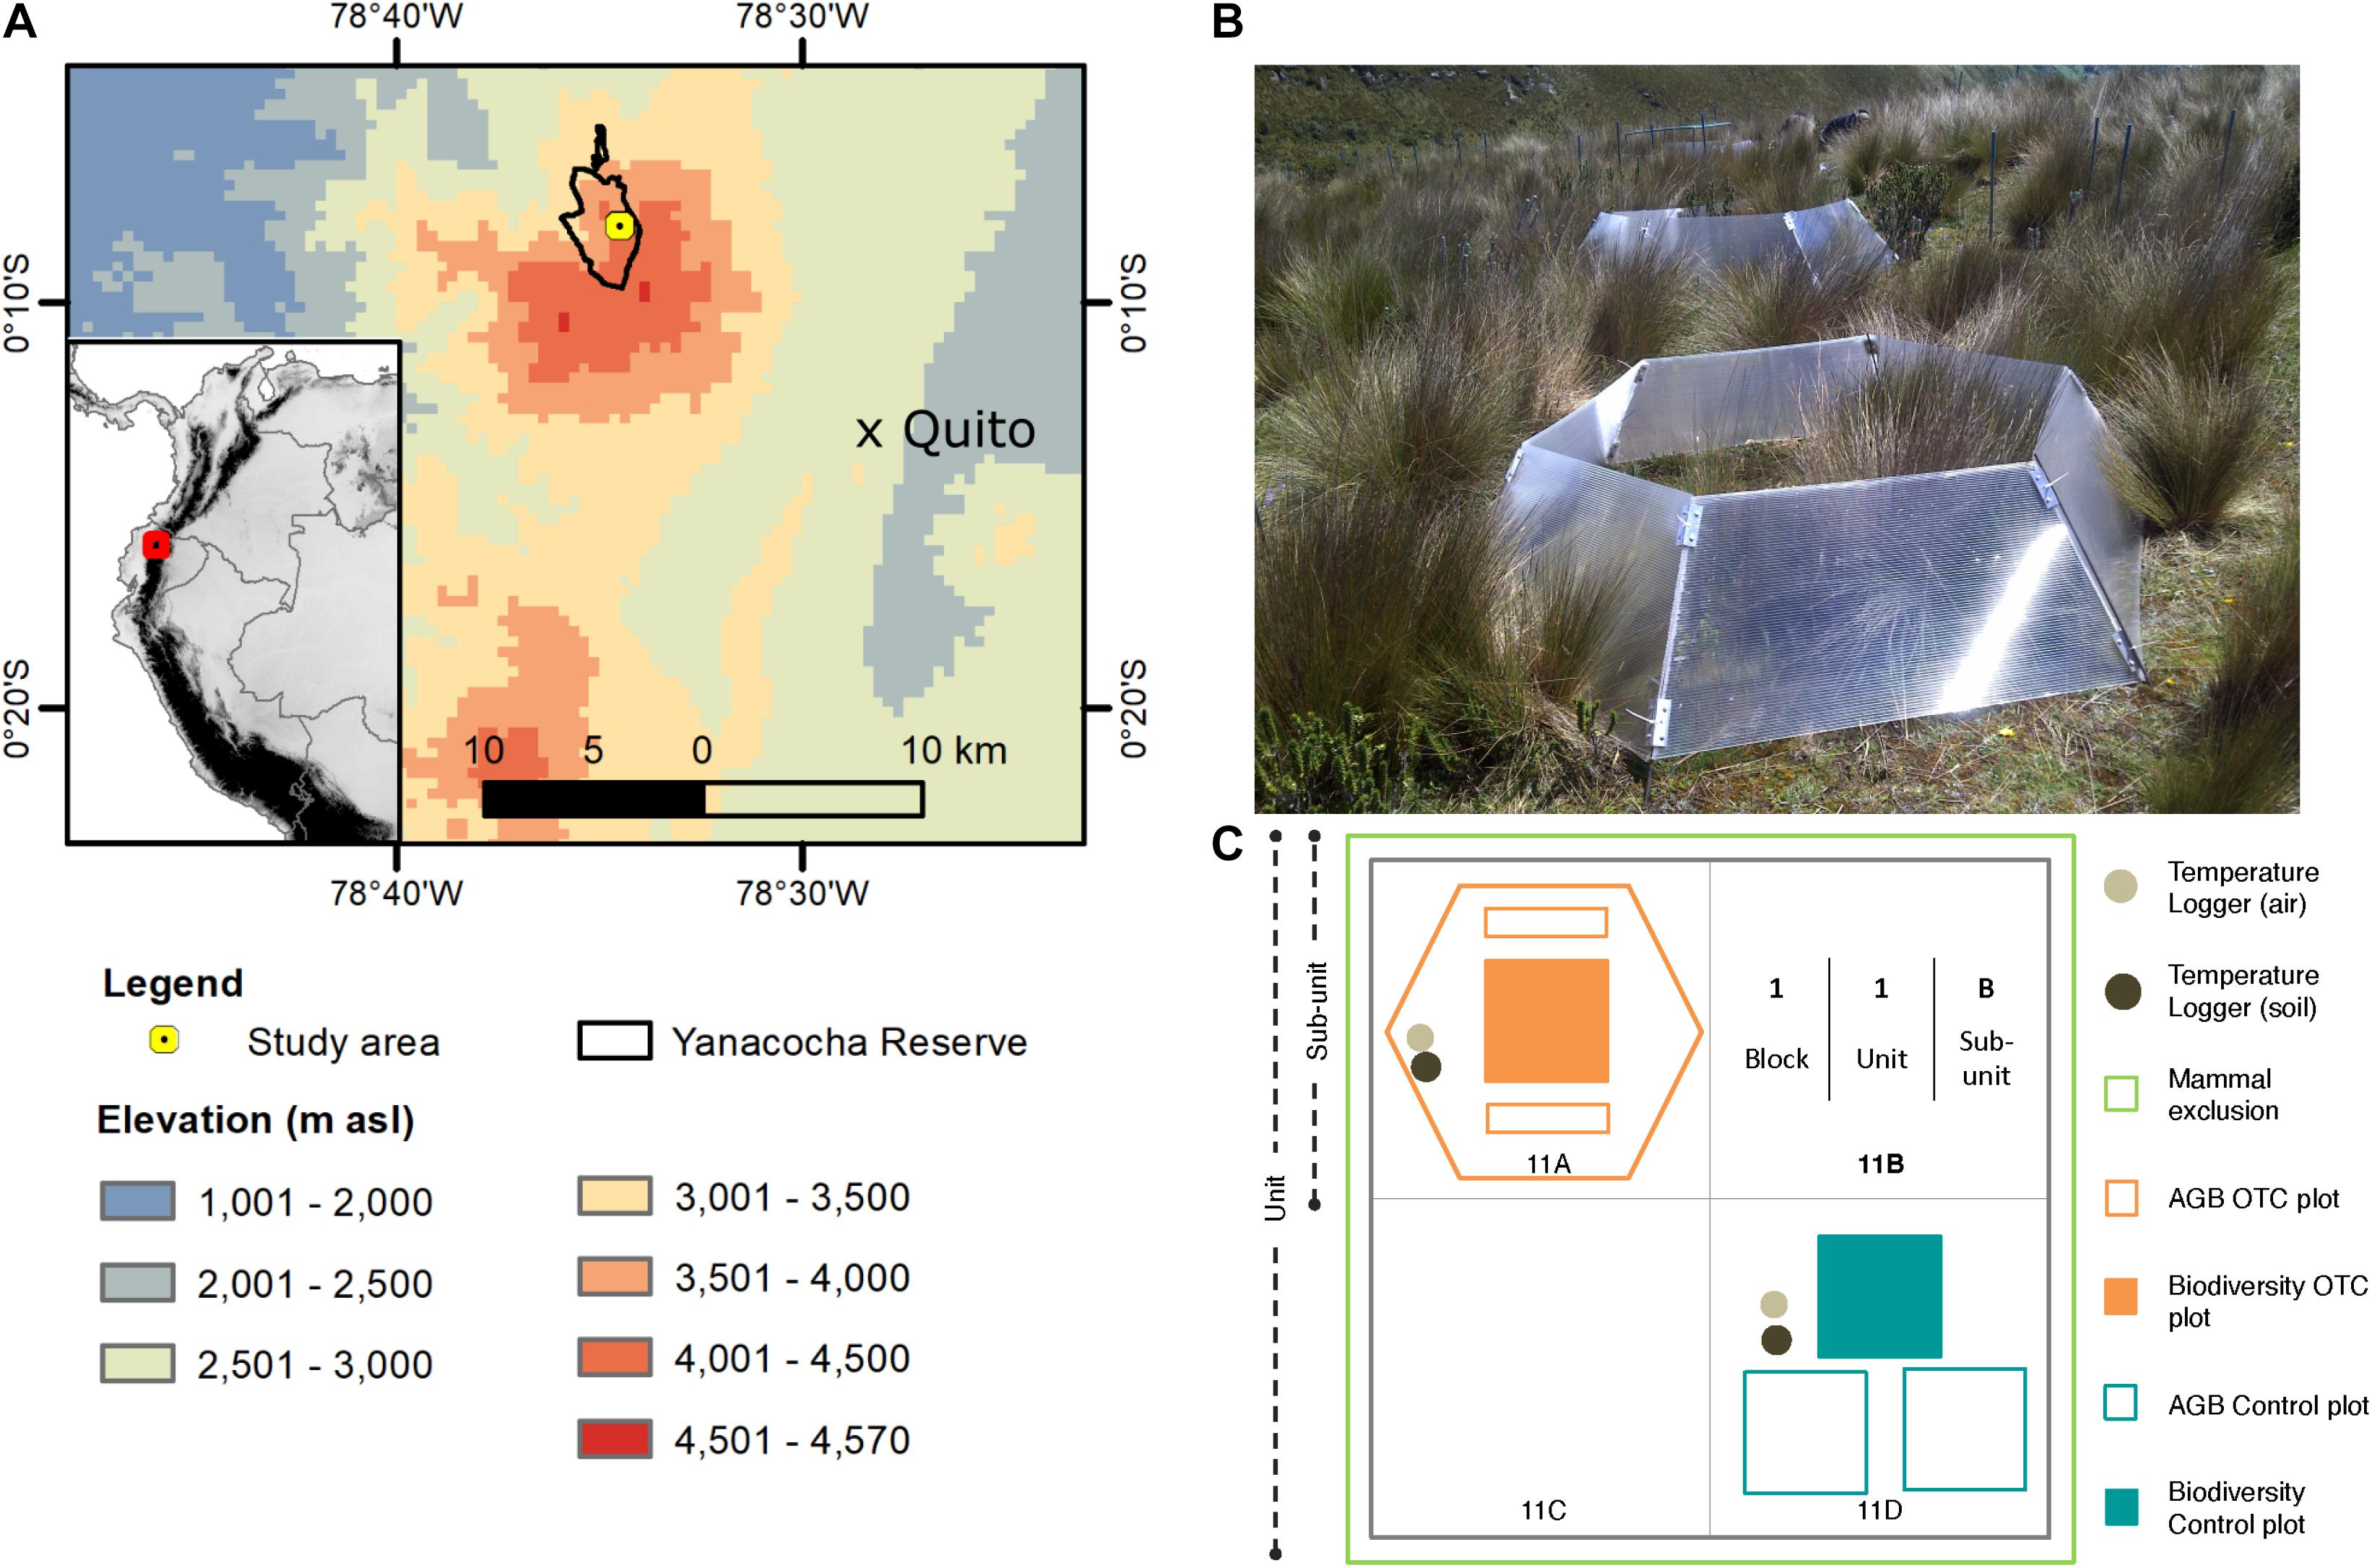
Figure 1. Location and set-up of study site. (A) Map of location with respect to the city of Quito. (B) Image of an open-top chamber in 2013. The total area of the OTC covers the space of one sub-unit. (C) Diagram of unit set-up. Each unit is subdivided into four sub-units, where one sub-unit contains biodiversity and biomass control plots, and one sub-unit contains an OTC. The sub-units are named by the number of the block, followed by the number of the unit and lastly, the letter of the sub-unit. This figure is based on a freely available Digital Elevation Model produced by hydrosheds: https://www.hydrosheds.org/downloads.
The páramo vegetation in the Pichincha Volcanic Complex, dominated by shrubs like Monnina crassifolia (Bonpl.) Kunth and Brachyotum ledifolium (Desr.) Triana, herbs like Hieracium frigidum Wedd. and Lachemilla orbiculata (Ruiz & Pav.) Rydb., and tussock grasses like Calamagrostis intermedia (J. Presl) Steud., starts at ca. 3,900 m asl. At 4,200 m asl—the location of the experimental plots—the dominant growth-forms shift to mainly tussock grasses with interspersed sclerophyllous shrubs [including Chuquiraga jussieui J.F. Gmel. and Loricaria thuyoides (Lam.) Sch. Bip.], and prostrate herbs, acaulescent rosettes and cushions (including Cerastium floccosum Benth., Werneria nubigena Kunth, and Plantago rigida Kunth). Our study area lies in the transition zone between grass páramo and superpáramo.
Experimental Design
In 2012, the Yanacocha Reserve became the location of a long-term ecological research site to monitor vegetation changes at different elevations and under different scenarios (Teunissen van Manen et al., 2019, 2020; Calderón-Loor et al., 2020; Llerena-Zambrano et al., 2021). For example, the Yanacocha Reserve houses two of the GLORIA monitoring summits for the Pichincha Volcanic Complex (Cuesta et al., 2020; Tovar et al., 2020). In July of 2012, a passive warming experiment was established. It started only with control plots using a hierarchical block design and later, after the installation of the OTCs in 2012 (Figure 1B), the monitoring of the experimental plots started in 2013.
Five monitoring blocks—installed at 4,200 m asl (−0.13518 Lat, −78.57458 Long)—contained ten units of 6 m × 6 m each, with four sub-units of 3 m × 3 m for every unit. Two sub-units contained the control and experimental plots: (1) one biodiversity control plot of 1 m × 1 m and two control AGB plots of 1 m × 1 m each; and (2) one experimental biodiversity plot of 1 m × 1 m and two 1 m × 0.1 m experimental AGB plots (Figure 1C). Furthermore, OTCs were placed randomly in four units per block, covering the biodiversity and AGB experimental plots. Therefore, four units per block had an OTC sub-unit, making a total of 20 OTC sub-units and 50 control sub-units among all five blocks (Báez et al., 2013). The blocks were placed at a minimum distance of 5 m from each other to reduce spatial autocorrelation. Through incidence-based species accumulation and rarefaction curves—using the functions specaccum and rarecurve both from the Vegan package in R (Oksanen et al., 2020)—the saturation of the curves showed an appropriate sampling effort (Supplementary Figure 1).
To confirm that temperature caused the effects observed in the OTCs and that any change in biomass or diversity would not be attributed to a possible reduction in herbivory—caused by the physical blocking of the OTC walls (Marion et al., 1997)—six herbivore exclusion units were installed among the five blocks in 2012. The exclusions consisted of 1-meter-tall fences buried 30 cm below ground and covered the area of a whole unit within a block. Before installing the exclusion, we cleared all small mammals: genera Thomasomys, Cryptotis, Sylvilagus, and Microryzomys. To prepare the area, we trapped and then released them outside of the exclusions.
Field Methods
Control and OTC biodiversity was monitored once a year between 2014 and 2019 (Table 1) using permanent the 1 m × 1 m plots, sub-divided in 10 cm × 10 cm squares to determine species cover (percent) and composition. In addition, we collected control AGB samples from one of the two designated AGB plots located within one of the sub-units, following Calderón-Loor et al. (2020), once per year between 2012 and 2019 (Table 1 and Figure 1C)—through two strips of 10 cm × 1 m at the top and the bottom of the plot. In the OTC sub-units, we collected AGB from the outer limit of the biodiversity plot, where 1 m × 10 cm strips were harvested outward instead of inward, as was the case for the control plots (Figure 1C). AGB samples were tagged, bagged, and placed inside plastic coolers to preserve the integrity of the collected samples before laboratory processing. In sum, the monitoring included assessing the effect of temperature on the following variables over time: AGB, which refers explicitly to live plus dead plant material collected above ground level, and vegetation composition.
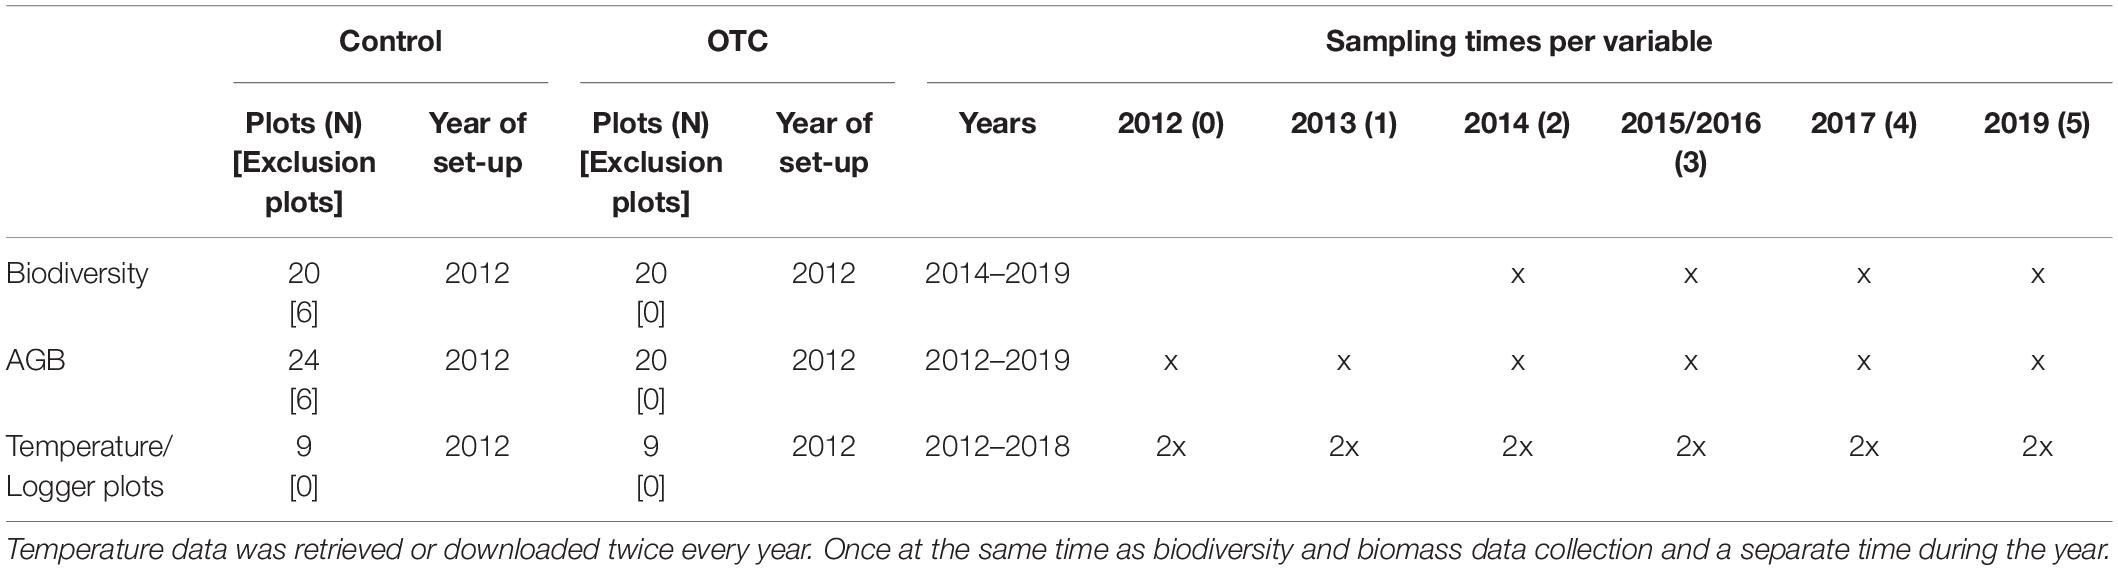
Table 1. Summary of plots per treatment per year and sampling time periods.
Thermochron ibuttons® (DS 1922L-F5#) were installed in the soil (at 10 cm in depth) and at 10 cm above the ground to measure soil and air temperature, respectively, in 18 plots (9 for both control and OTCs), making a total of 36 loggers, within blocks 1 through 3. The loggers recorded the temperature every hour. We also placed Hygrochron® temperature and humidity data loggers (DS 1923-F5#) when installing the blocks, but they failed after the second year of sampling. Therefore, for this study, we focused on temperature data only.
Laboratory and Herbarium Methods
We first weighed the AGB samples in the field with a manual scale to obtain fresh weight. Then we transferred the samples to a laboratory where we sorted them between above ground necromass and live mass. We distinguished between necromass and live mass based on the color and rigidity of the plants—yellow/brown leaves for necromass and rigid green leaves for live mass (Calderón et al., 2013). Samples were then dried at 60°C for 72 h in an oven until they reached a stable weight. Once the samples were dried, we weighed them again separately. This study’s statistical analysis used the sum of the dry aboveground necromass and live mass.
At the QCA Herbarium, we processed and deposited vouchers of plants identified in the field and confirmed the plant identifications (Supplementary Table 1). Identification of plant vouchers were done in the QCA Herbarium where samples were also deposited. We identified 51 out of 70 morphospecies to species level. The rest of the 19 morphospecies were left at their most substantiated level and grouped into family groups. For example, the “Apiaceae group” housed individuals that look like species within the Oreomyrrhis and Niphogeton genera but were not identified up to species. The “Asteraceae group” included individuals that look like species from the Aphanactis, Gamochaeta, and Achyrocline genera. The “Poaceae group” included most species from the Poaceae family except C. intermedia and Calamagrostis fibrovaginata Lægaard, grouped in their own Calamagrostis group (Supplementary Table 1).
Trait Data
We obtained the growth form data for each species and morphospecies from the GLORIA-Andes database (Muriel et al., unpublished data), which uses a revised version of the Ramsay and Oxley classification (Ramsay and Oxley, 1997). We used the following growth form categories: cushion, herb, rosette, shrub, and tussocks.
Statistical Analysis
Temperature Analysis
Temperature data was downloaded from all loggers twice a year from June 2012 to 2019 to obtain a complete yearly log of hourly temperatures. However, due to a malfunctioning in some of the loggers, gaps in the annual sequence occurred in 2015, 2016, and 2018. Therefore, we bootstrapped the dataset, with the boot function in the boot package in R, to resample the years 2012, 2013, 2014, 2017, and 2018—using 1,000 bootstrap replicates—to minimize the impact of gaps in the dataset (Canty and Ripley, 2021). With this resampled data, we calculated summary statistics—including freezing events and intensities and the mean, minimum and maximum temperatures for air and soil, for every day of the year, of the dry season and night temperatures for OTC and control loggers—as well as the 95% confidence intervals (Crowley, 1992; Dixon, 1993).
We estimated statistics for the dry season using temperature data from June to September. Night temperatures were estimated using the values between 6 PM and 6 AM. Finally, we calculated freezing times by counting the number of times in 24 h the temperature was below zero and the intensity of the freezing period by counting the consecutive hours the temperature was below zero in 24 h (Sierra-Almeida and Cavieres, 2010).
We assessed the difference between control and OTC plots for every month of the year with T-tests on the temperature data (not bootstrapped) and Wilcoxon two-sample test for freezing lengths (Sokal and Rohlf, 2012)—using the stat v3.3 package in base R (R Core Team, 2021). Afterward, we used a linear mixed-effects model to assess the effect of the OTC on temperature, where the treatment interacts with the position of the logger (either air or soil), and the random effects are the hour of the day and the logger number. We used the lme4 package in R (Bates et al., 2014). We ran this model for the total temperature dataset, dry season temperatures, and night temperatures separately, using the bootstrapped data.
Estimation of Diversity Metrics
We used three different metrics to estimate taxonomic diversity: species richness (count), Pielou’s Evenness (J = H′/ln(S)),and Hill’s Diversity Index (N1; ) following Chao et al. (2014). We also calculated evenness and N1 for growth form coverage data.
Assessing the Effect of Warming
Aboveground biomass was estimated as the sum of dry aboveground necromass and live mass in kilograms per square meter and then tested for normality using Q-Q plots in R. Since we did not obtain normality from these data, the dataset was log-transformed for our analysis. No transformations were done for any of the other variables since they all met the normality assumption.
Like with temperature, we compared all diversity metrics and AGB between control and OTC plots through two methods. First, to show differences when we do not account for time and other factors, we used the Wilcoxon two-sample test to compare warmed and control plots. Then, we used generalized linear mixed-effects models and general linear mixed-effects models to analyze the effects of the warming treatment and time (year) on these response variables using the glmer and lmer functions from the lme4 package in R (Bates et al., 2014). For AGB we tested the following three models: (a) biomass from control plots against OTC plots, (b) biomass from exclusion plots against control plots, and (c) biomass from exclusion plots against OTC plots. Finally, we used a Poisson distribution for the species richness model.
Results
Microclimate
Compared to controls, daily mean air temperature increased in OTCs by 0.16°C (Table 2). During the dry season, the OTCs had the most increase in air temperature for the daily average maximum by 2.33°C (Table 2). At night, the mean temperature increased for OTCs compared to controls by 0.33°C, and the highest increase was in the average maximum temperature by 1.31°C (Table 2). On the contrary, the OTCs significantly decreased the daily mean soil temperature by −0.08°C (Table 2). The highest increase in soil temperature was for the daily average minimum by 0.32°C (Table 2).
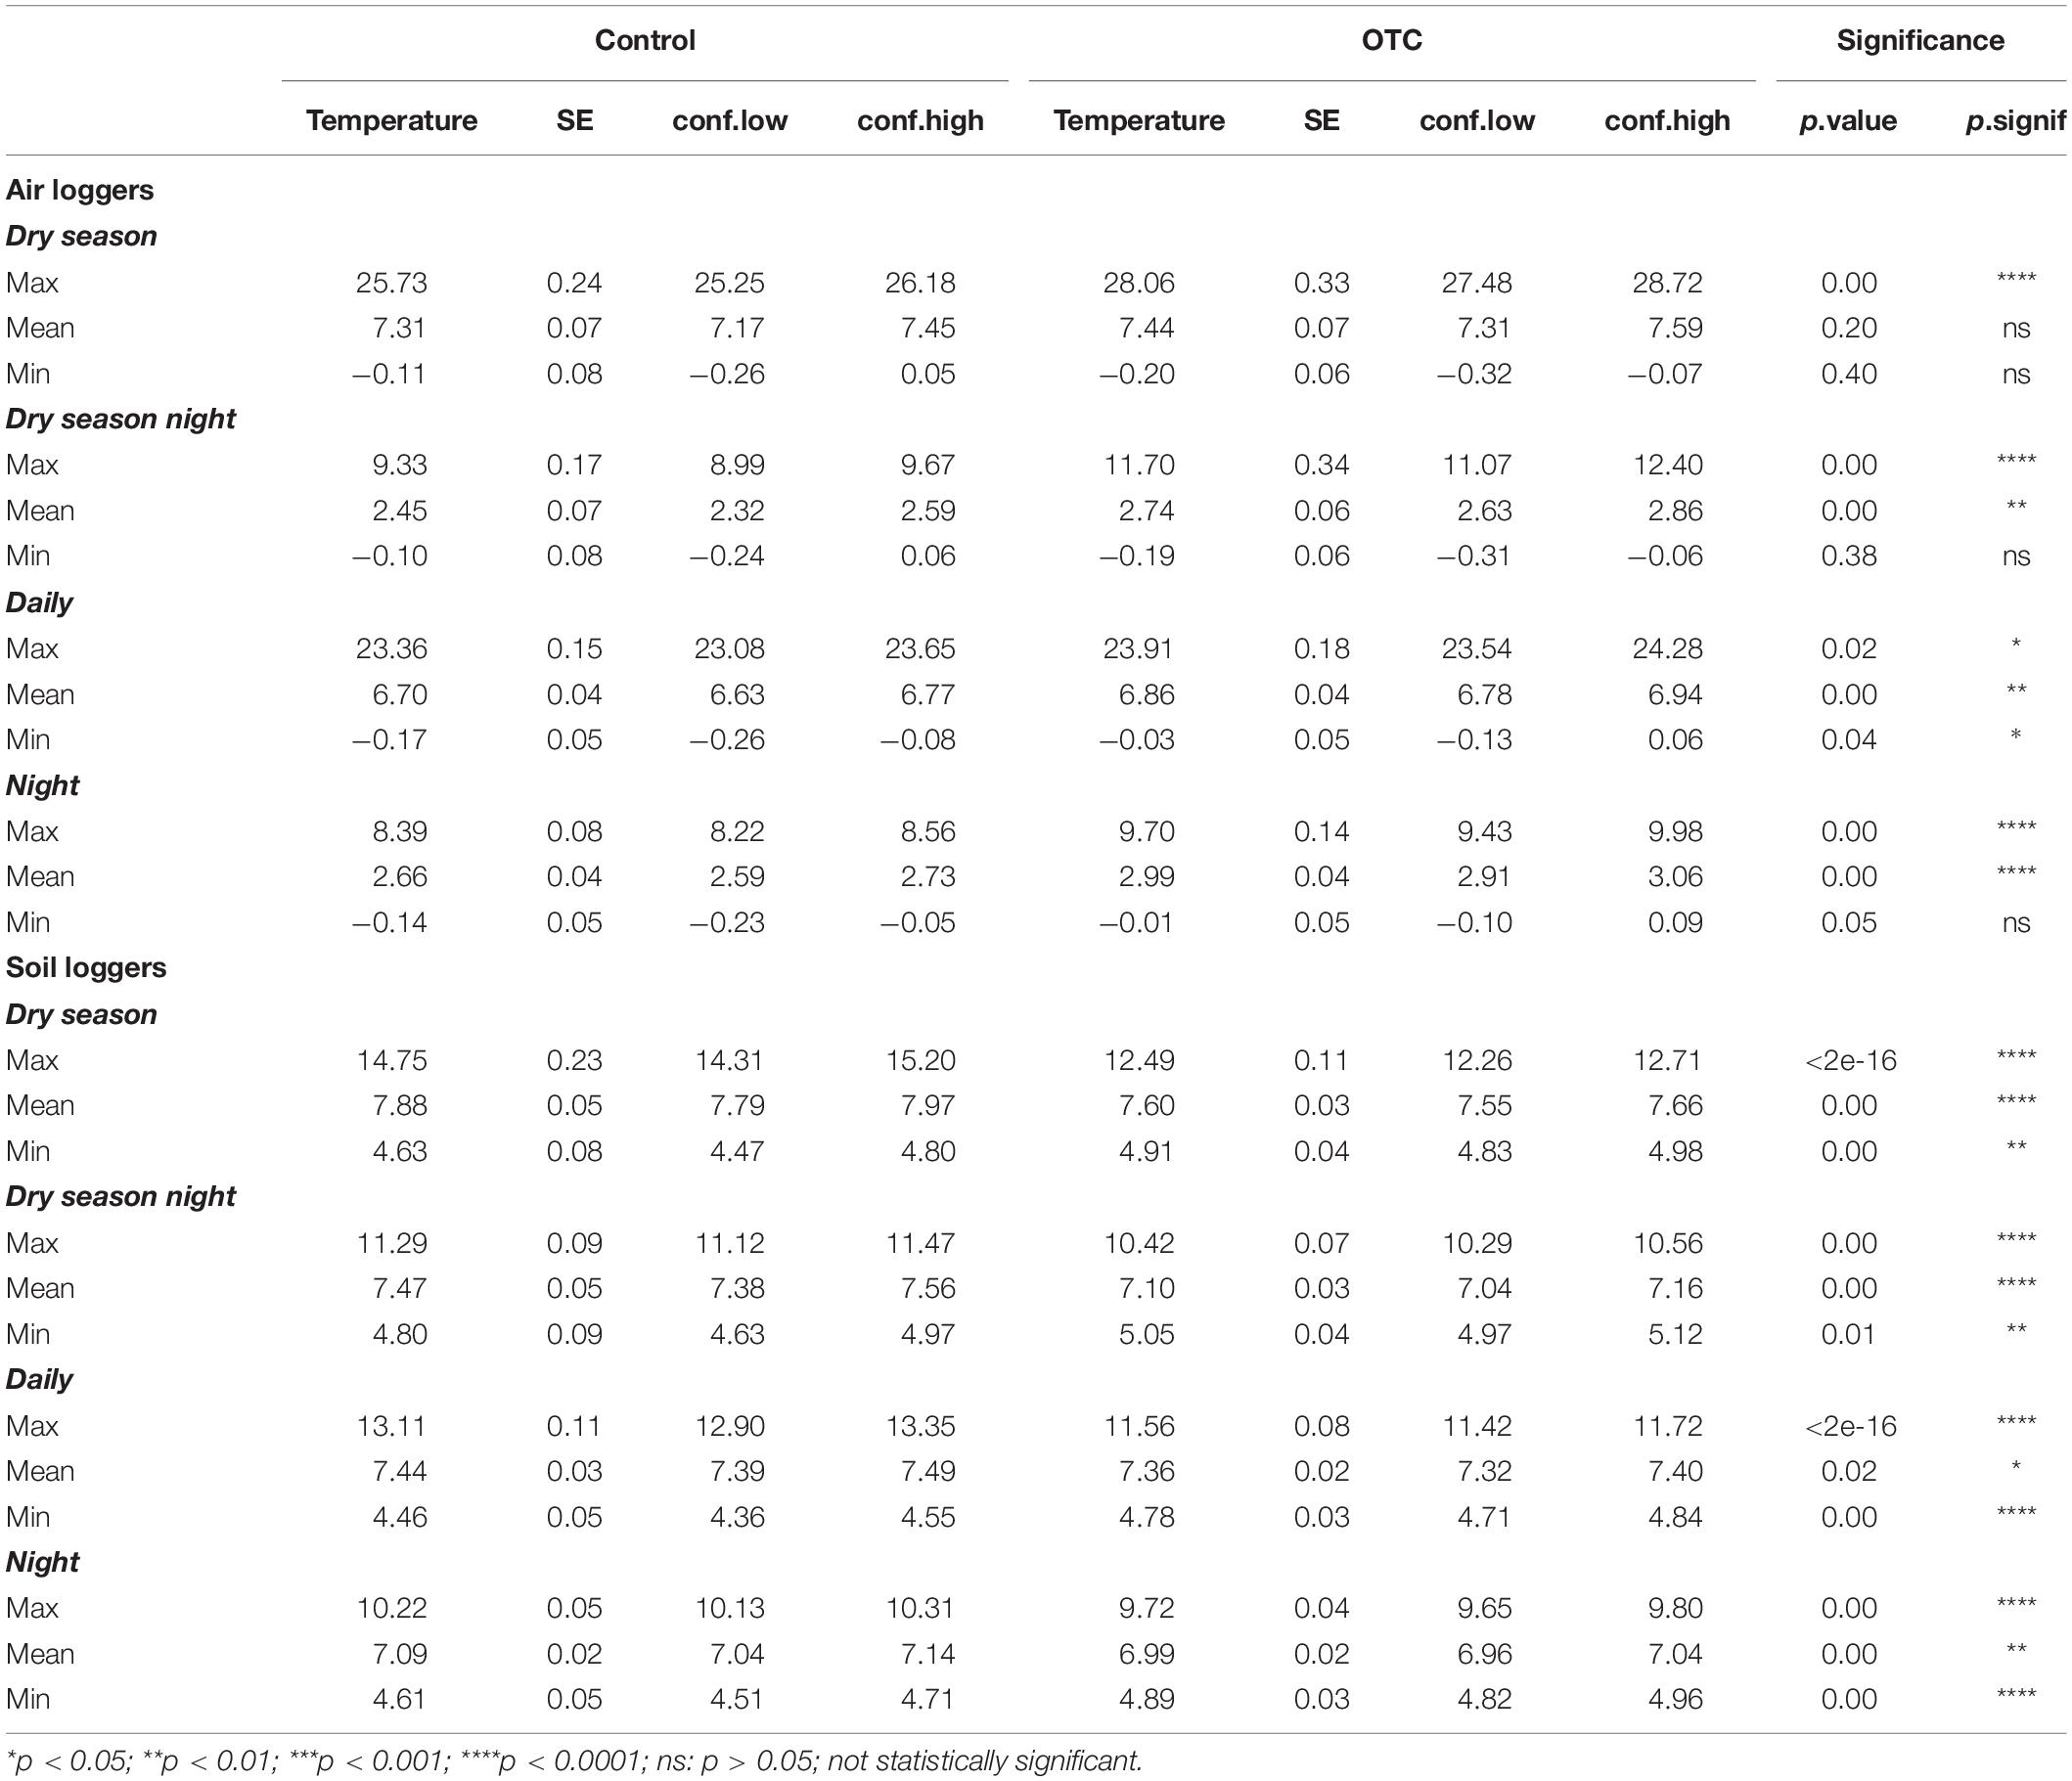
Table 2. Summary of statistics for temperature in control and OTC plots for air and soil loggers.
The OTCs significantly increased the mean monthly air temperature by an average of 0.24°C except in September and October, at the end of the dry season (Figure 2A). In contrast, the monthly mean and maximum soil temperature in OTCs were lower than controls from July to October and April to December, respectively (Figure 2B). The OTCs attenuated soil monthly minimums and maximums in most of the year except for the height of the wet season in February and March (Figure 2B).
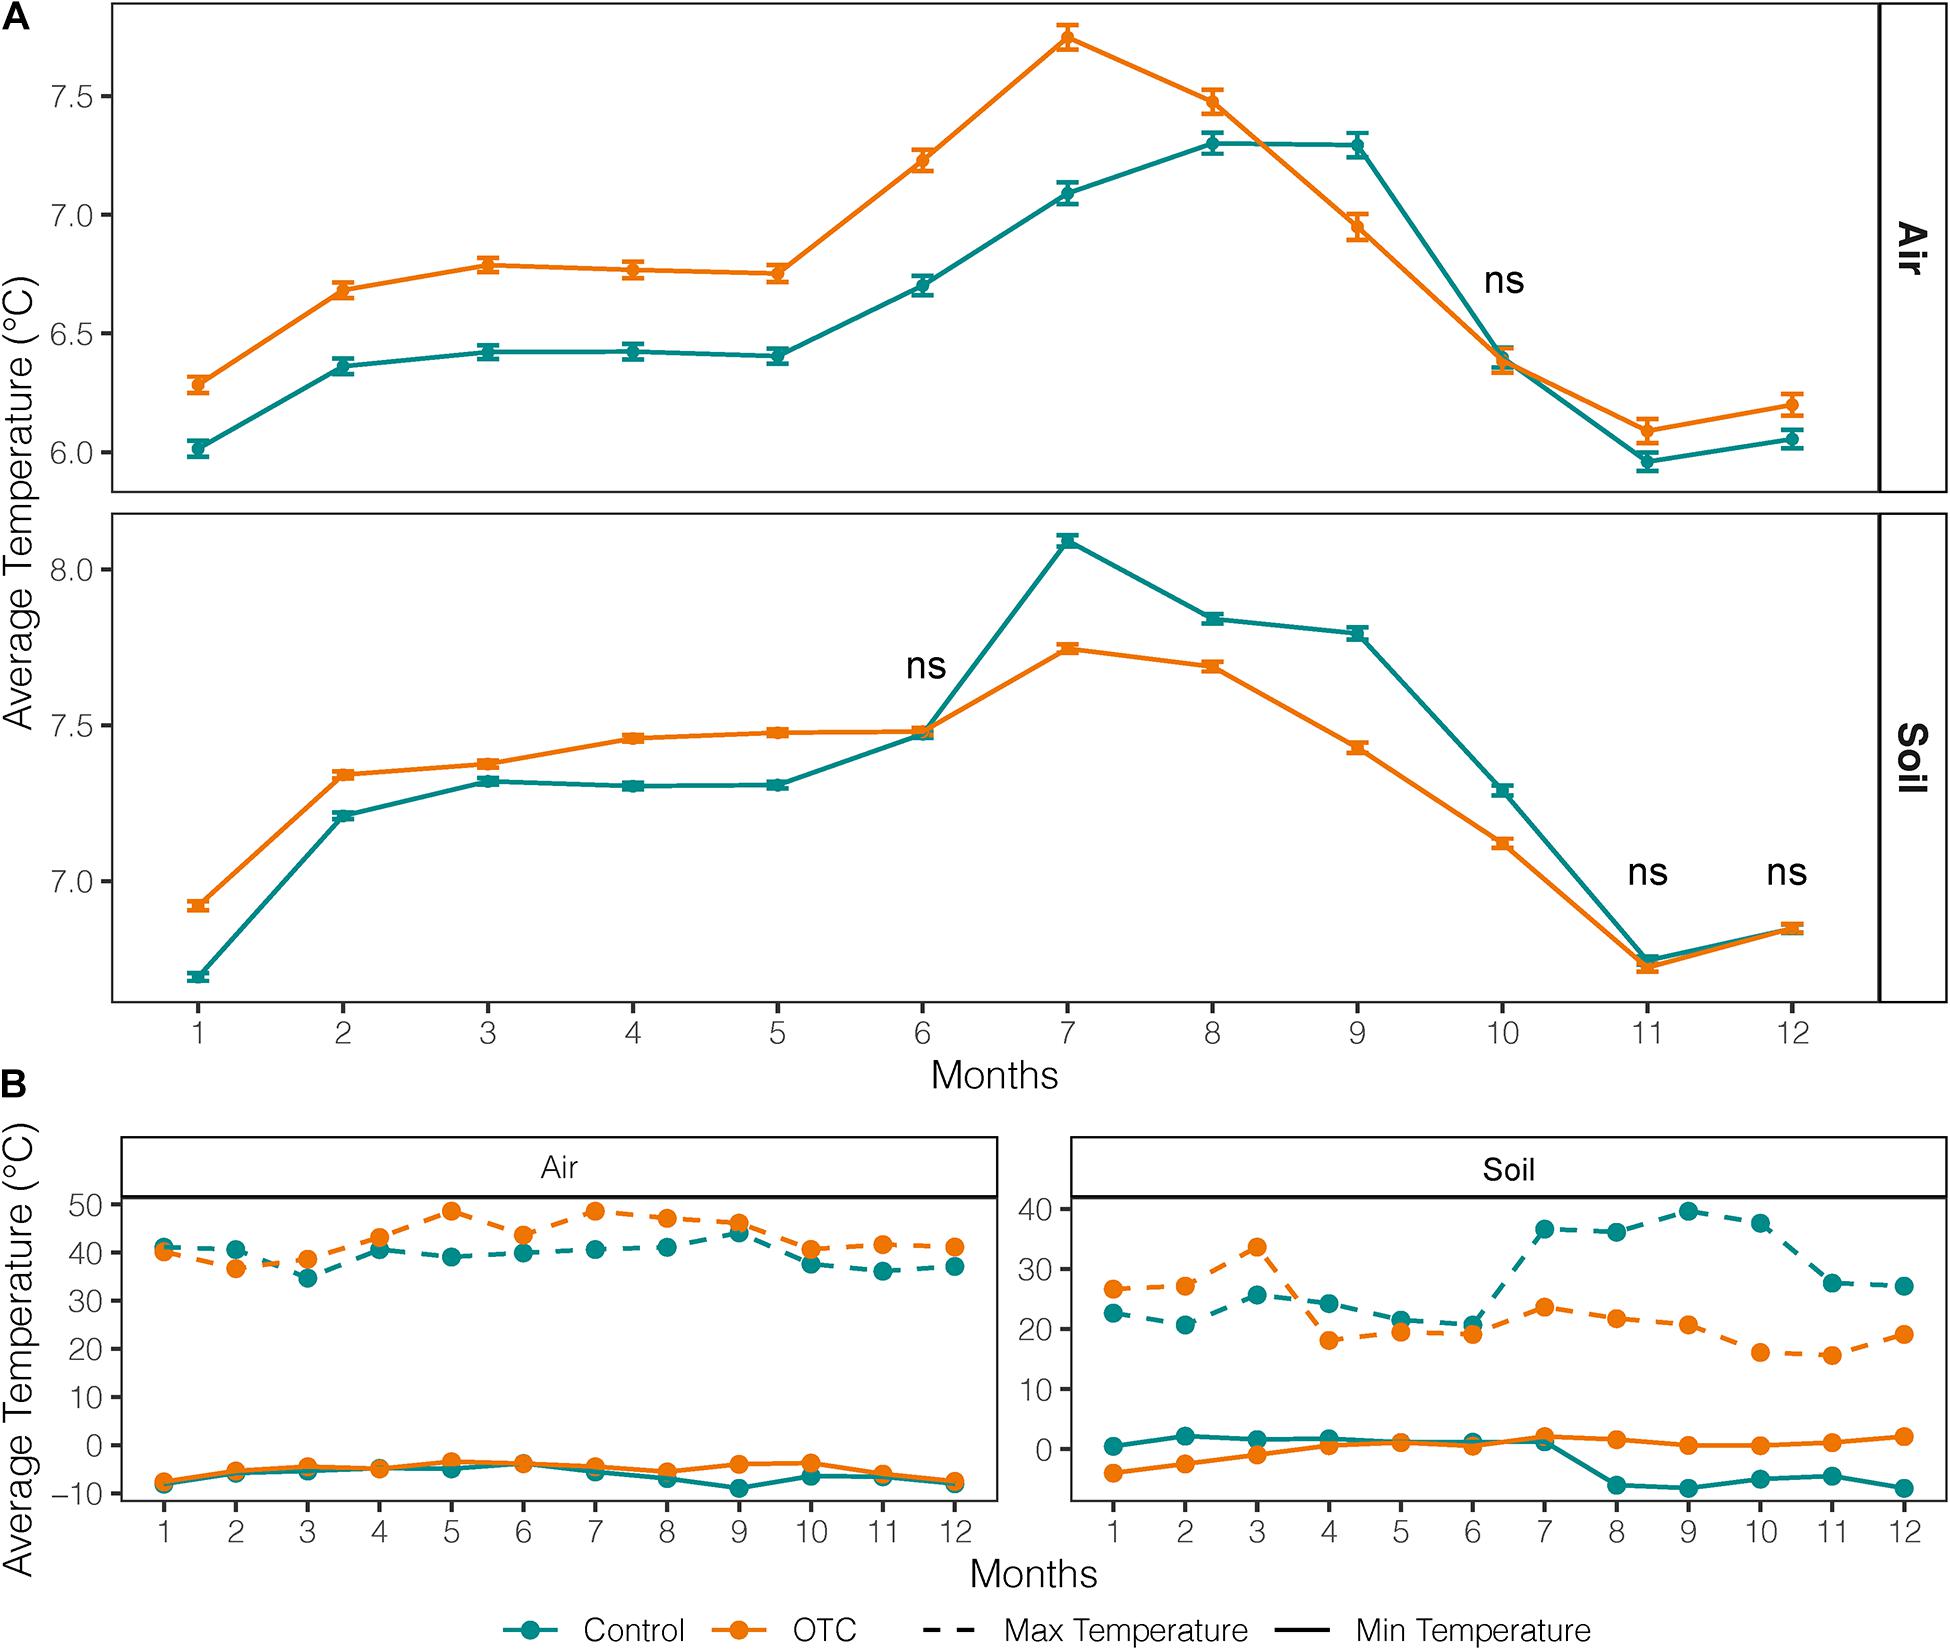
Figure 2. Averaged monthly mean, minimum and maximum air and soil temperature inside and outside the OTC (plots under warming and control plots, respectively). Data covers the period 2012–2018. (A) Average monthly temperature from air and soil loggers in control and OTC plots. Bars represent standard error. (B) Average monthly minimum and maximums in air and soil from air and soil loggers in control and OTC plots.
There were significantly fewer freezing events and of less intensity in OTCs than in control in soil and air during the dry season, but OTCs and control had a similar number of freezing events in the air during the whole year (Supplementary Tables 3, 4). Temperature loggers in the soil recorded zero freezing events during the dry season (daily and nightly; Supplementary Table 3).
Biomass
Over the entire study period, mean AGB was significantly higher within OTCs (mean = 1.11 kg/m2; sd = ± 0.13) than in control plots (mean = 0.93 kg/m2; sd = ± 0.13) by 9% (W = 9,423; p = 0.029; Figure 3A; Supplementary Table 5). The biggest difference in AGB within the same year between OTC and control was in 2019 with 27.9% (p = 0.007). However, AGB decreased over time in both OTCs and control plots as shown by the negative values of the mixed-effects model coefficients (Figure 3B and Supplementary Table 5). Exclusion plots (mean = 1.24 kg/m2; sd = ± 0.16) did not show significant differences with OTC plots (mean = 1.11 kg/m2; sd = ± 0.16) or control plots (mean = 0.93 kg/m2; sd = ± 0.16; Figure 3B and Supplementary Table 6).
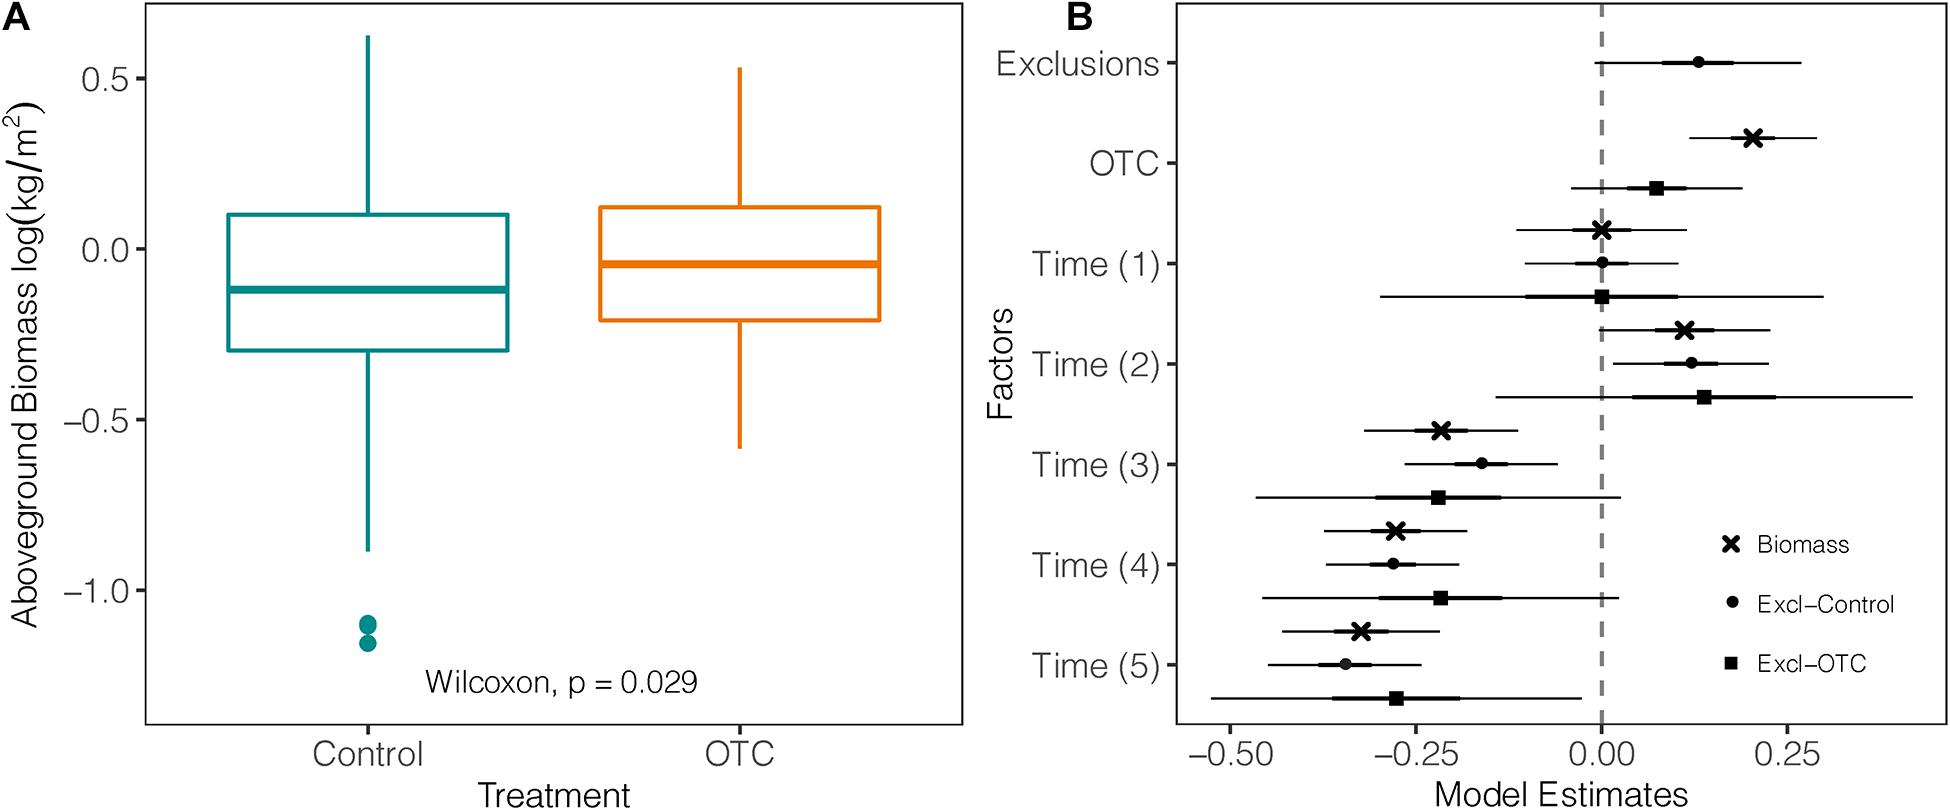
Figure 3. Impact of warming on biomass. (A) Difference in above ground biomass measured in plant communities under natural and warming conditions over the five sampled years between 2012 and 2019 [Time (0) = 2012 used as a reference against the other sampling years, Time (1) = 2013, Time (2) = 2014, Time (3) = 2015/2016, Time (4) = 2017, and Time (5) = 2019]. (B) Coefficients of three mixed-effects models testing log-transformed biomass from control against the effects of exclusions, warming (OTC), and the effects of exclusion against warming (OTC). The vertical line represents the null value (where fixed effects are not significant when their CI cross this line). Fixed effects to the right of the vertical line have a significant positive relation with the response variable, and a negative one if they are on the left.
Biodiversity
Species diversity (Hill index) in OTCs (mean = 3.66; sd = ± 1.9) was significantly lower than in control over the entire study period (mean = 4.47; sd = ± 1.9; W = 3,499; p = 0.041; Figure 4A). However, this difference is not significant when accounting by sampling time in the mixed-effects model (t = −1.85; p = 0.065). In the mixed-effects model the years 2016, 2017, and 2019 had lower diversity values than 2015 (Figure 4B and Supplementary Tables 7, 8).
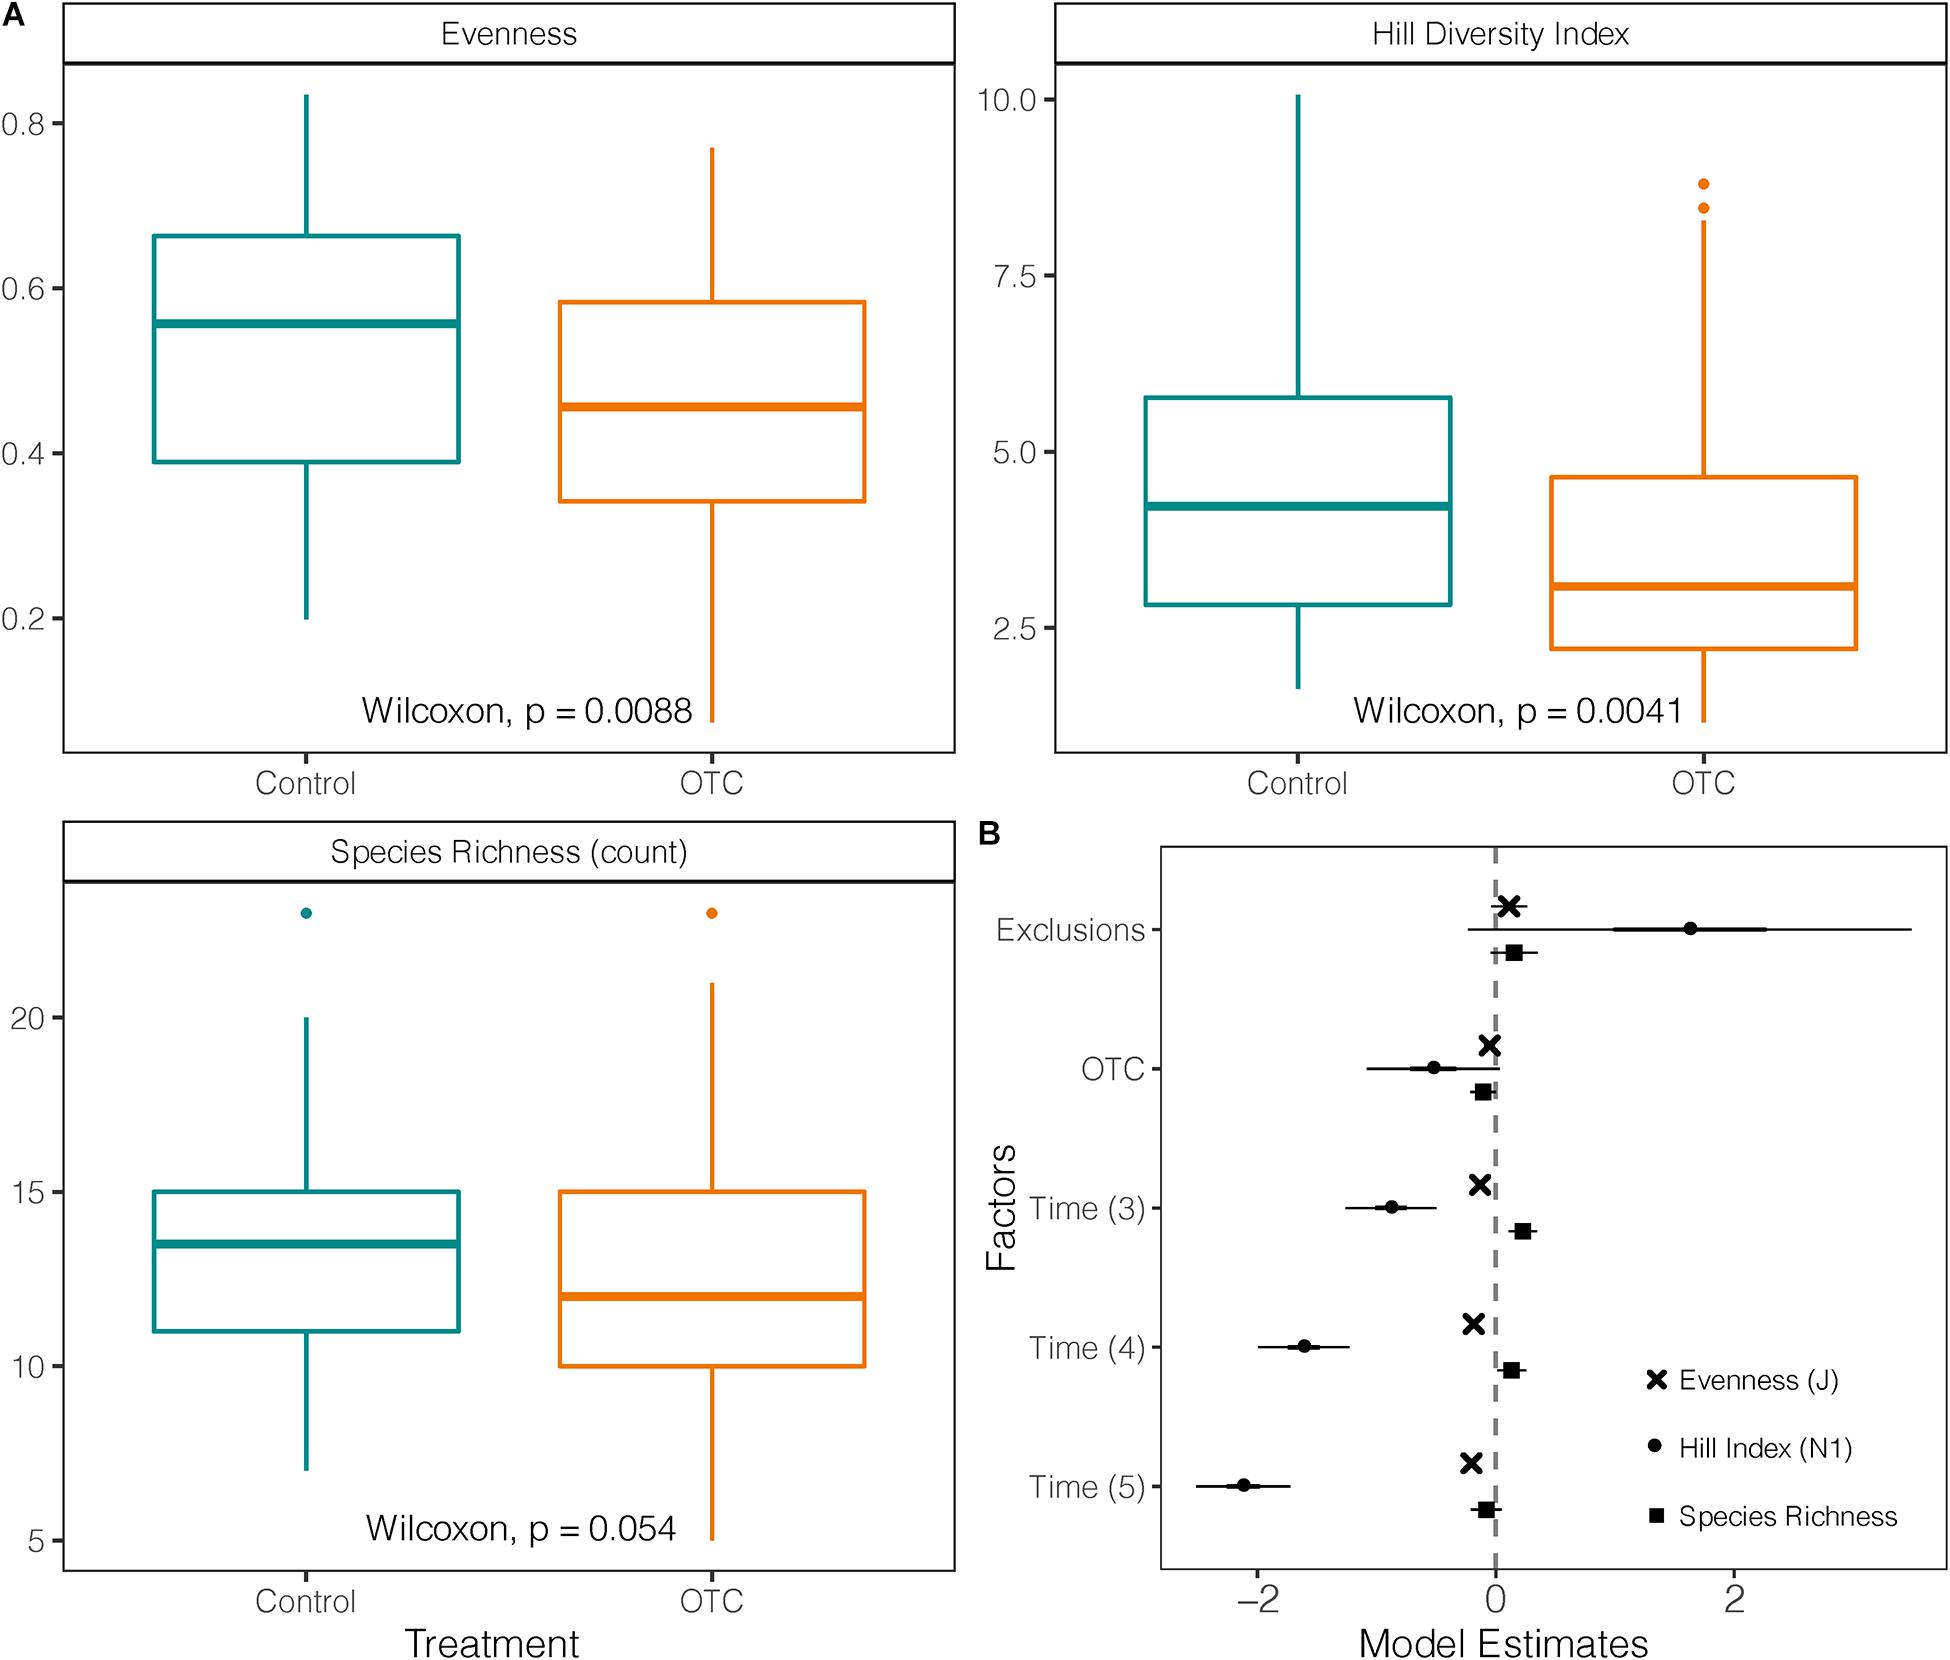
Figure 4. Impact of warming on taxonomic diversity. (A) Species richness, evenness and Hill Diversity Index (N1) measured in plant communities under warming (OTC) and control conditions (outside OTC) in 4 sampling times between 2014 and 2019. (B) Coefficients of three mixed-effects models testing Hill Diversity Index, Evenness and Species Richness against the effects of exclusions, warming (OTC) and sampling year. The vertical line represents the null value (where fixed effect are not significant when their CI cross this line). Fixed effects to the right of the vertical line have a significant positive relation with the response variable, and a negative one if they are on the left [Time (2) = 2014 used as a reference against the other sampling years, Time (3) = 2015/2016, Time (4) = 2017, and Time (5) = 2019].
Evenness in the OTCs (mean = 0.46; sd = ± 0.17) was significantly lower than in control plots (mean = 0.54; sd = ± 0.16) over the entire study period (W = 3,434; p = 0.0088; Figure 4A). This pattern was further confirmed when time was held as a fixed factor in the mixed model, and evenness for 2016, 2017, and 2019 was lower than in 2015 (Supplementary Table 8 and Figure 4B).
There was no significant difference in species richness between control plots and OTCs (Figure 4A). Only in 2019, species richness was significantly lower in OTCs (mean = 9.6; sd = ± 2.4) than in control (mean = 12.19; sd = ± 2.7) as was suggested by the Wilcoxon test (p = 0.015) and visualized by the mixed-effects model (Supplementary Table 7 and Figure 4B). Nevertheless, by 2019, five out of the 57 recorded species [e.g., Astragalus geminiflorus Bonpl., Azorella pedunculata (Spreng.) Mathias & Constance] were no longer present inside the OTCs, and six more demonstrated a progressive reduction in the warmed plots (Supplementary Table 1). On the other hand, only two species appeared in the OTC plots as the warming experiment progressed without being present in the control plots, Bartsia laticrenata Benth. and G. acostae Cuatrec.
Growth Forms
Growth form diversity was significantly lower (p = 0.0026) in the OTC plots (mean = 2.36; sd = ± 0.7) than in control plots (mean = 2.73; sd = ± 0.71) but decreased in both treatments over time (Figure 5A). This difference holds after accounting by sampling time in the mixed-effects model (Figure 5B and Supplementary Table 9). Growth form evenness was also significantly lower (p = 0.003) in OTC plots (mean = 0.56; sd = ± 0.2) than in control plots (mean = 0.66; sd = ± 0.17) over the entire study period and decreased over time in both (Figure 5B). However, after accounting by time in the mixed-effects model, evenness in OTCs was not significantly different from control, and all times had lower evenness compared to 2014 (Figure 5B and Supplementary Table 9).
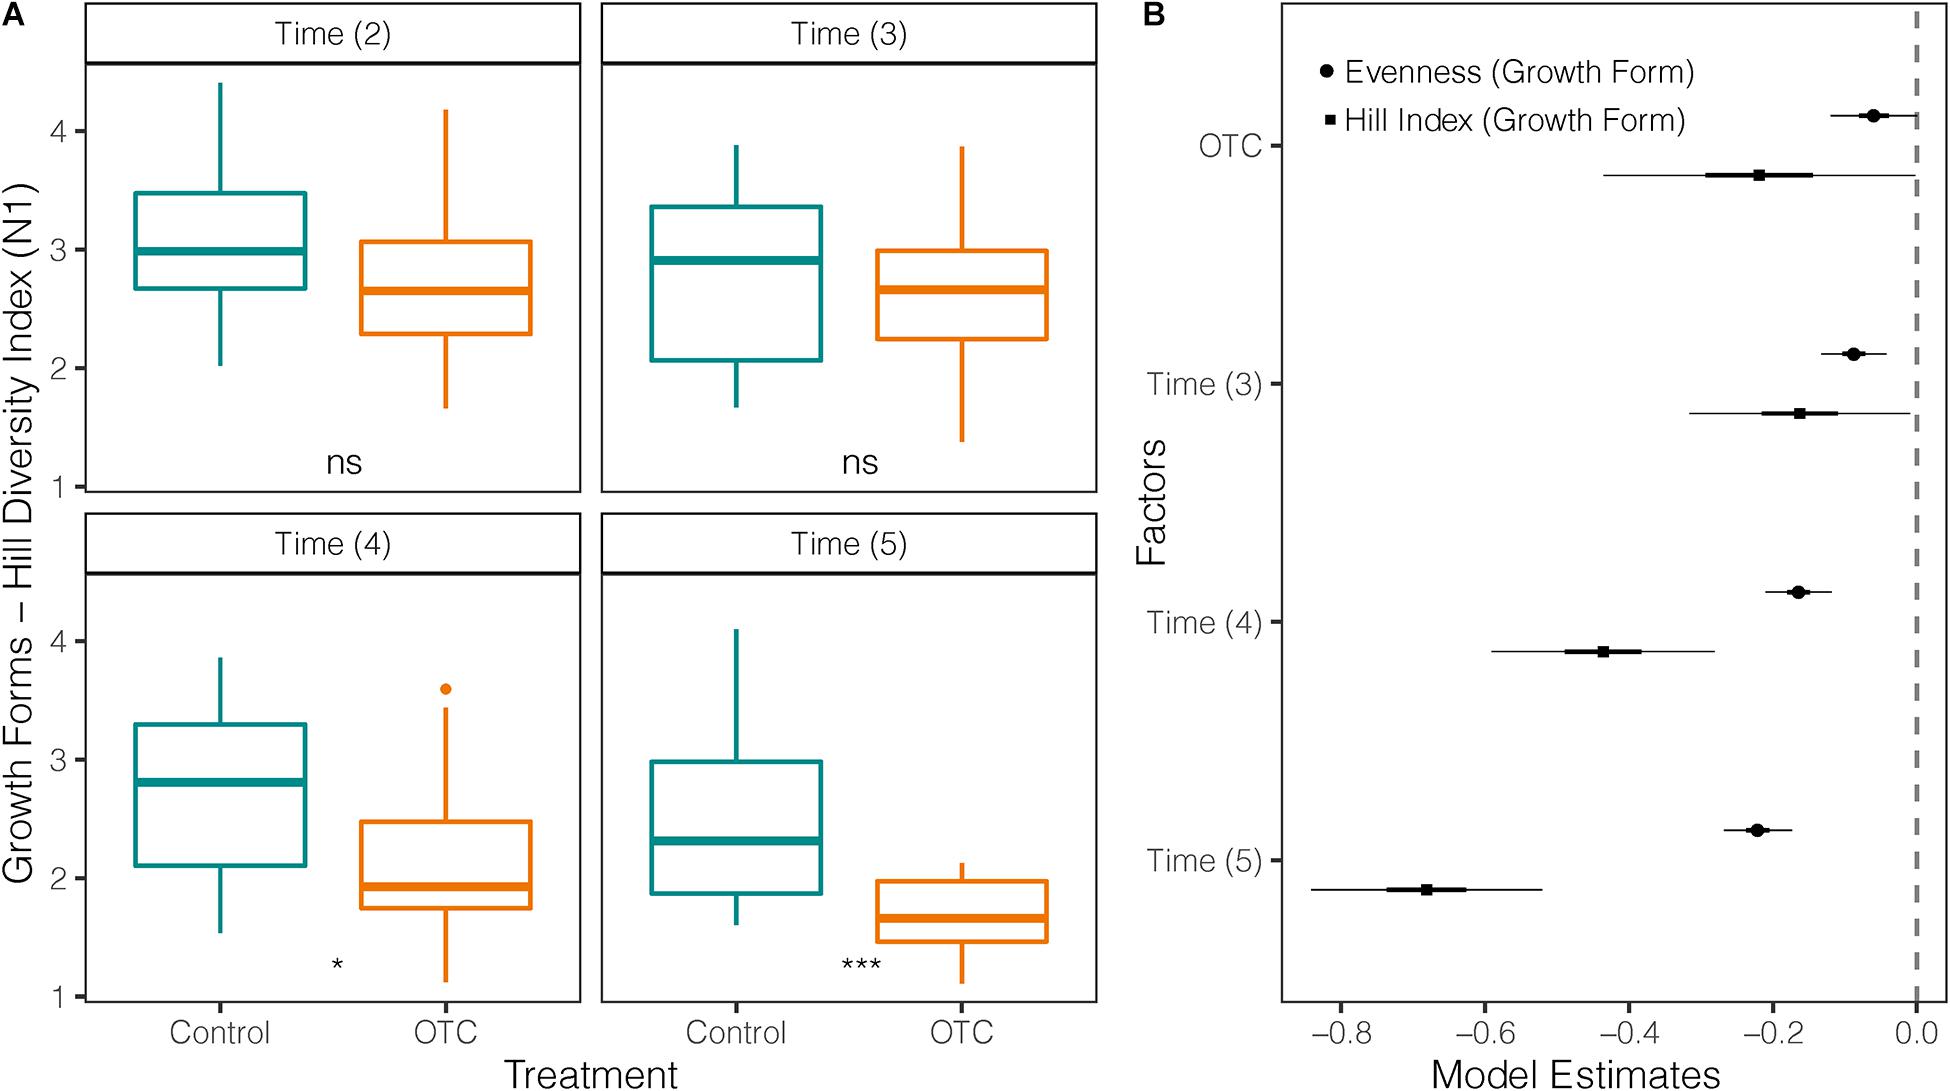
Figure 5. Impact of warming on the diversity of growth forms in 4 sampling times between 2014 and 2019. Time (2) = 2014 used as a reference against the other sampling times, Time (3) = 2015/2016, Time (4) = 2017, and Time (5) = 2019. (A) Comparison of Hill’s diversity index between plant communities under warming (OTC) and control conditions (outside OTC) over time. (B) Coefficients of two mixed-effects models testing Hill Diversity Index and Evenness of growth forms against the effects of warming (OTC) and sampling year. The vertical line represents the null value (where fixed effect are not significant when their CI cross this line). Fixed effects to the right of the vertical line have a significant positive relation with the response variable, and a negative one if they are on the left. *p < 0.05 and ***p < 0.001.
Percent cover of cushion growth form was significantly lower in OTCs than in control plots, while tussock cover was significantly higher over the entire study period (Figure 6A and Supplementary Table 10). Over time, cushion species cover decreased in the OTCs but increased in control plots (Figure 6B and Supplementary Table 10). Meanwhile, percent cover of tussock species (e.g., Calamagrostis group) increased over time in OTCs by 16.5% but kept similar cover values in control plots (Figure 6B and Supplementary Table 10).
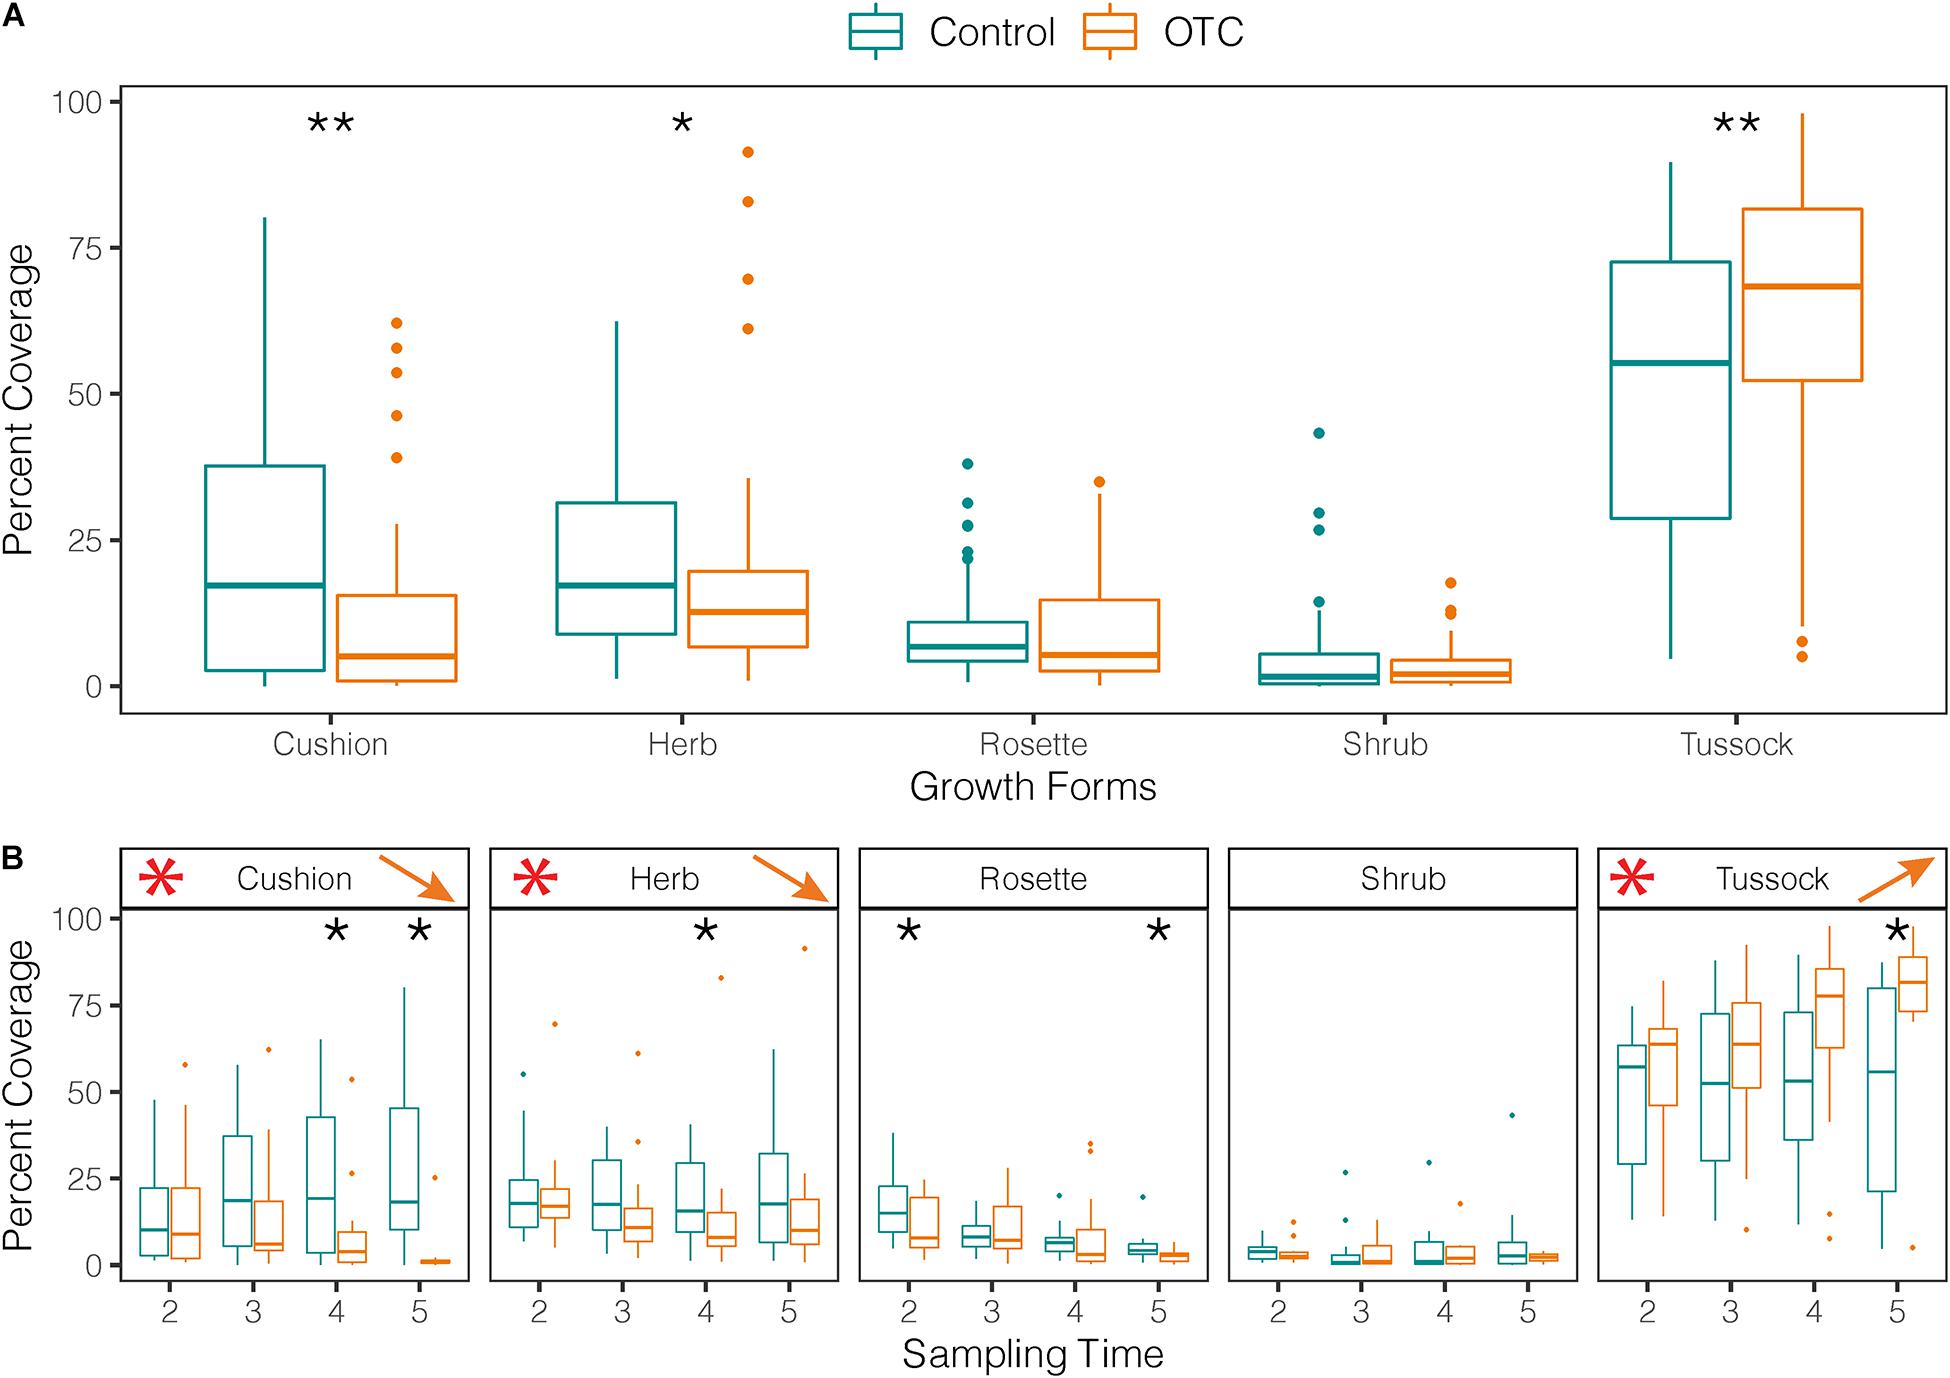
Figure 6. Impact of warming on categories of growth forms. (A) Vegetation cover per category of growth form measured in plant communities under warming (OTC) and control conditions (outside OTC) in 4 sampling times between 2014 and 2019. Black stars represent significant differences between OTC and control. (B) Vegetation cover by sampling time for each category of growth form. Black stars show significant differences between OTC and control for a given time. Red stars show results found in (A) for comparison and arrows the direction of change over time inside the OTCs (Time 2 = 2014, Time 3 = 2015/2016, Time 4 = 2017, and Time 5 = 2019).
Discussion
The Role of Temperature in Microclimatic Conditions
In our study, the OTCs changed the microthermal conditions, potentially leading to shifts in AGB, plant community composition, and growth form diversity. Generally, air temperature and soil temperatures had different responses to the OTCs, where air temperature on average increased and soil temperature on average decreased. Specifically, the thermal conditions changed by first, a general increase in daily and monthly air temperature with the highest increase in means occurring for night temperatures. Second, the dry season accentuated the differences in microclimatic conditions between control and OTC plots, for both air and soil temperatures, where soil temperature in OTCs was mainly lower than control, and air temperature in OTCs had its highest increase in temperature compared to controls. Third, extreme temperatures were attenuated, including reducing freezing events.
Daily (+0.16°C) and monthly (+0.24°C) mean air temperature increased but in a lower amount than what we hypothesized and less than observed in tundra and subtropical grassland environments. For subtropical grasslands, Buhrmann et al. (2016) reported an increase of 1.6 to 2.4°C in air temperature during the day in OTCs compared to controls and 0.0 to 0.6°C during the night across all four seasons. In our study, night temperatures in OTCs were significantly different from control and showed higher mean air temperatures by an average of +0.33°C (p < 0.001), which falls within the range of change in temperate regions. Our results show that in equatorial regions, larger changes occur for night temperatures than from daily temperatures, different from temperate and subtropical alpine areas. Additionally, lower values of temperature change than Lasso et al. (2021) in the Colombian páramos may result from differences in OTC design, such as the type of fiberglass used in their warming experiment.
Our study found smaller differences in the daily mean soil temperature between OTCs and control than in the mean air temperature. This result was similar to the results reported by Pancotto et al. (2020) in southern Patagonia. However, a meta-analysis of 32 experimental sites across four temperate biomes: tundra, low tundra, grassland, and forest found a broader range, of 0.3 to 6.0°C, for mean soil warming temperature increases (Rustad et al., 2001). The studies analyzed in that meta-analysis used different warming methods, not only OTCs, which, along with latitudinal differences, may contribute to the differences from our results. For example, in subtropical grasslands, the absolute maximum temperature in OTCs increased by 0.9 to 1.8°C while the absolute minimum was increased by 0.3 to 0.8°C (Buhrmann et al., 2016). Meanwhile, we obtained a mean maximum temperature increase of 0.55°C and an increase in mean minimum temperature of 0.4°C.
The OTCs stabilized soil temperatures by keeping the monthly minimums and maximums consistent throughout the year with maximum temperatures lower than those in control plots. This reduction in the soil thermal range may reduce plants’ ability to tolerate extreme events under normal conditions (Sierra-Almeida and Cavieres, 2010). Further, soil temperature attenuation also reduces the frequency and intensity of freezing events (Supplementary Table 3). In this study, the mean monthly soil minimum temperature for OTCs was above freezing. This attenuation could be caused by greater evapotranspiration during the day, which could generate a buffer that reduces heat transfer through convection during the night (Sierra-Almeida and Cavieres, 2010). Consequently, the thermal amplitude experienced by plants is reduced, which would alter their physiological response to extreme conditions (Sklenář et al., 2016).
The dry season analyses revealed an important pattern in the temperature trends observed in the OTCs, including the intensification of temperature and shifts in trends around the start and end of the dry season. In our results, at the beginning of the dry season (June), air temperatures in OTCs intensified, obtaining their maximum difference from controls in July by 0.7°C. During June and July, the OTC trapped higher amounts of UV radiation, causing this peak in temperature (Marion and Pidgeon, 1992). Additionally, monthly maximum air temperature in OTCs only fell below the control plots in January and February, during the wet season, where days have higher humidity, cloud cover, and lower radiation (Vuille et al., 2003; Letts and Mulligan, 2005). Studies in tundra found that passive warming treatments increased mean growing season air temperature by 1 to 3°C, a warming range predicted and observed for tundra regions (Walker et al., 2006). Therefore, variations in monthly precipitation and UV radiation over a year-long period are important in describing OTC temperature trends.
Relationship Between Biomass, Biodiversity, and Growth Forms
Over the study period, OTCs showed higher values of AGB but lower values of species and growth form diversity and evenness than control plots. This pattern seems to be linked to an increase in the vegetation cover of tussocks and a decrease of cushion and herb species in the OTCs, leading to a less diverse community. While AGB reduced in both control and OTCs over the study period, AGB was highest in exclusion plots followed by OTCs, and the lowest means of AGB were found in controls.
By the end of our 7-year experiment, OTCs had 27% more AGB than control plots, as we hypothesized, and which is consistent with other experiments in the alpine meadows of the Hedguan mountains (Yang et al., 2018) and Patagonia (Pancotto et al., 2020). However, other studies have reported no warming impact or decreases in AGB. For example, Fu et al. (2013) found that AGB significantly decreased with experimental warming at 4,313 m asl. This study used different methods than ours and had a much shorter experimental time of 1 year, potentially explaining the difference from our results. Although OTCs generally had more AGB than controls, we observed an overall decrease of AGB for both controls and OTCs. This contrasts with results reported by Calderón-Loor et al. (2020) in the same páramos of the Yanacocha Reserve for the period 2012–2014 in which AGB increased, despite showing similar values of AGB to ours for 2014. Finally, the higher amount of AGB in exclusion plots than OTCs shows that the OTCs did not entirely exclude herbivory by small mammals, as was also observed by Barrio et al. (2021). However, herbivory intensity is dependent on site and OTC design. In our study, given the visual evidence of herbivory in OTCs, more AGB in OTCs may be more likely related to the changes in thermal conditions rather than the potential exclusion effect of herbivores by the OTCs. However, further research on herbivory intensity related to OTCs in tropical alpine regions would help clarify this topic.
The higher AGB in OTCs (by 9%) in our study area is mainly related to increased vegetation cover of tussocks (e.g., C. intermedia), which increased by 16.5% by the end of the experiment and it is a pattern that has been observed in other studies as well. For example, in subtropical alpine grasslands, annual graminoid biomass production significantly increased by nearly 20% in OTCs (Buhrmann et al., 2016). Similarly, Na et al. (2011) found an increase in AGB inside OTCs after 2 years of warming in the Tibetan Plateau, where sedges were responsible for 90% of the total biomass gain. Lastly, in the páramos of Colombia, graminoid and shrub coverage increased inside OTCs in one out of the two study sites (Lasso et al., 2021).
In our study, an increase in tussocks in OTCs could be due to three reasons: (1) tussocks have specific adaptations that allow them to become dominant, (2) the drier environments created by OTCs favor tussocks, and (3) at this point, tussocks are favored but may be replaced later by shrubs and woody plants. First, tussock grasses have broad thermal niches (Cuesta et al., 2020) and are highly tolerant to freezing (Márquez et al., 2006; Rada et al., 2019). Second, they compete by being taller, shading out shade-intolerant species, which leads to local/plot extinctions (Wong, 1991), dispersing by wind (Tovar et al., 2020), and by being photosynthetically efficient (i.e., reduced leaf area index and higher leaf dry matter content (Leegood, 2002; Cuesta, unpublished data). Next, a secondary effect of the OTCs is that they create drier environments (e.g., Lasso et al., 2021), and tussocks are resistant to cold and resistant to drought (Monteiro et al., 2011; Rada et al., 2019). Therefore, tussock grasses seem suited to take advantage of conditions created by increased temperatures coupled with increased water limitation. Lastly, we hypothesized that both graminoid and shrub coverage would increase but only the increase in graminoid cover was significant. In their monitoring studies, Porro et al. (2019) and Hamid et al. (2020) found that the vegetation cover of shrubs and graminoids increased with warmer temperatures. However, in our study, we found that shrubs as a group did not increase, but that individual species, such as C. jussieui, showed an increase in cover. The magnitude of this trend was small and may depend on more prolonged warming exposure periods and higher warming temperatures. Previous studies on the tropical upper forest line suggest that woody plants cannot grow adequately at soil temperatures below 5 or 6°C (Hoch and Körner, 2003; Körner and Paulsen, 2004; Hoch and Korner, 2005; Wiley and Helliker, 2012). Therefore, in the long term, as the world continues to get warmer in the future, shrubs [e.g., Hypericum laricifolium Juss., Hesperomeles ferruginea (Pers.) Benth.] and trees (e.g., Polylepis pauta Hieron., Gynoxys acostae) might outcompete tussock grasses, and there is evidence for this in the paleo records (Flantua et al., 2019). Here our hypothesis was partially met, so given our results, tussock dominance could be a temporary state on the way to a forested landscape.
The increase in percent coverage of tussock species and some shrubs (e.g., C. intermedia, C. jussieui) in OTCs is related to the downward trend observed for diversity and evenness of species and growth form, as we hypothesized. This downward trend is consistent with observations made in a 14-year monitoring study in the Apennines (Porro et al., 2019). Furthermore, Walker et al. (2006) found that warming increased the cover of deciduous shrubs and graminoids and decreased species diversity and evenness. While our results for species evenness and diversity and growth form diversity were significant, species richness was not, yet the downward trend for species richness was similar to that found in previous studies in alpine/tundra regions (Klein et al., 2004; Yang et al., 2018). For example, after the fourth sampling time, five out of the 57 recorded species (e.g., A. geminiflorus, A. pedunculata) were no longer present inside the OTCs, and six more evidenced a progressive reduction in the warmed plots (mainly herbs and cushions). This result was contrary to that of Steinbauer et al. (2018), who found increased species richness in nine regions across Europe over 145 years, mostly related to temperature change. However, after 20 years of monitoring, Steinbauer et al. (2020) showed that previously recorded species richness increases in the Alps were slowing down due to the disappearance of species, specifically cold-adapted species. In our study, decreasing species richness was more in line with this trend. Yet, the slower rate of decrease compared to other OTC studies may be due to the OTCs raising the daily mean temperature less than the increased mean temperature in those studies.
Besides the increase in tussock percent cover, we also observed decreased cushion (e.g., Plantago sericea Ruiz & Pav.), herb (e.g., Geranium humboldtii Willd. ex Spreng.), and rosette cover in the OTCs. Cushion plants are stress-tolerant, which allows them to be a dominant growth form at the highest elevations, along with rosettes, which decreased in both control and OTC plots in our study (Sklenář et al., 2010; Anthelme et al., 2017; Rada et al., 2019). However, when subjected to increased temperatures, Pancotto et al. (2020) found that their study subject Astelia pumila (G. Forst.) R. Br., a cushion plant, decreased their photosynthetic efficiency. Thus, the increase in temperature could be a potential explanation for the decrease in cushion plant coverage in our site. The reduction in cushion plant cover, together with the overall decrease of rosettes, which in tropical alpine ecosystems are characteristic of high elevations (Sklenář and Balslev, 2007; Rada et al., 2019), in OTC and control plots over time, may suggest that a macro-scale process may be already occurring in the Yanacocha Reserve. One potential explanation for this pattern is that rosettes are already migrating upward. On the Antisana volcano, about 63 km southeast of our study site, Moret et al. (2019) compared Humboldt’s collections to a resurvey of the same collection route. This study reported upward shifts for three rosettes [W. nubigena, Valeriana alypifolia Kunth, and Senecio nivalis (Kunth) Cuatrec.] and one herb [Phlegmariurus crassus (Humb. & Bonpl. ex Willd.) B. Øllg.] where S. nivalis expanded upslope 216 to 266 m in 215 years.
Time is an essential variable in warming experiments. OTCs accelerate the rate to visualize change compared to prolonged comparative studies (Porro et al., 2019; Steinbauer et al., 2020; Anthelme et al., 2021), and our study found significant changes after 7 years of sampling. However, studies in non-tropical ecosystems found differences in a much shorter timeframe; for example, studies in tundra found changes in plant communities after two growing seasons (Walker et al., 2006). The distinct seasonality found in tundra and sub-tropical ecosystems, contrasting from the tropics, may make the tropics more resilient to temperature changes and may reveal the effects of climate warming over more time. Furthermore, those studies reported much higher temperature changes than what we obtained in our OTCs, which could also be contributing to the longer response times.
Conclusion and Future Research
Given the rapid rate of global temperature rise, it is crucial to understand its effect on ecosystems that support millions of people and are home to a diverse and unique group of life forms. In this study, the first long-term OTC study in a tropical alpine ecosystem, we experimentally increased the temperature of vegetation plots to assess the effects of warming on AGB and taxonomic and growth form diversity. While we hypothesized that air temperature would increase like other studies in similar regions, we obtained a smaller increase than expected. However, OTCs did modify the microclimatic conditions that plants were experiencing. Two limitations of this study in characterizing the microclimatic conditions and their relationship to tropical alpine vegetation are the lack of humidity data together with photosynthetically active radiation and the use of one study site. Having multiple experimental sites would allow for more robustness and the feasibility of upscaling our results into a regional context.
Shifts in thermal conditions caused by the OTCs altered AGB, taxonomic, and growth form diversity, confirming the importance of small-scale temperature on shaping plant community composition and vegetation physiognomy in alpine ecosystems. Within OTCs, we found a trend toward the dominance of one or a few species and growth forms, specifically tussock grasses, leading to a decrease in species and growth form diversity and evenness, specifically tussock grasses. The dominance of tussocks may be a transitional phase; in the long term, as warming continues to increase, shrubs may outcompete the tussocks.
We obtained two unexpected results from this study: (1) a decrease in total biomass in both control and OTCs, and (2) a decrease in rosette coverage in both OTCs and control plots. Further research is needed to elucidate the overall decrease in AGB in the Yanacocha Reserve under control and experimental conditions. Measuring necromass decomposition rates together with soil properties (moisture, respiration, and N mineralization rates), belowground biomass, and soil organic carbon will help improve our understanding of the mechanisms driving AGB changes over time. Additionally, AGB contributions by growth forms are needed to understand shifts in growth form dominance and their links to resource acquisition traits.
Unlike in shrub páramo or Andean forests, demographic patterns in the grass páramos—such as species mortality and recruitment rates—have not been studied yet. Furthermore, because many species have clonal reproduction, it is challenging to determine individuals and perform population dynamics studies in tropical alpine systems. In our study, analyses on population dynamics would further the results reported here by providing information on immigration from lower elevations and possible extinction processes.
Data Availability Statement
The raw data supporting the conclusions of this article will be made available by the authors, without undue reservation.
Author Contributions
FC, PM, and SD conceived the experiment. SD, FC, PM, and CT built the general structure of the datasets. SD, FC, and CT analyzed the data and wrote the manuscript. SD, FC, PM, RJ, ES, and EP collected field data. All co-authors commented on and/or approved the manuscript. All authors contributed to the article and approved the submitted version.
Funding
SD acknowledges financial support from the University of Texas Graduate Continuing Fellowship and the National Geographic Society (Grant No. EC-56298C-19). FC acknowledges funding from UDLA (Grant No. FGE.FCC.20.01). SD, FC, RJ, and EP received additional funding to complete this study from the EcoAndes Project conducted by CONDESAN and UN-Environment, funded by the Global Environmental Fund (GEF, http://www.thegef.org). Grant number: 4750 and The Swiss Agency for Development and Cooperation (SDC, www.eda.admin.ch/sdc) through the Andean Forest Program (Grant number 81028631).
Conflict of Interest
The authors declare that the research was conducted in the absence of any commercial or financial relationships that could be construed as a potential conflict of interest.
Publisher’s Note
All claims expressed in this article are solely those of the authors and do not necessarily represent those of their affiliated organizations, or those of the publisher, the editors and the reviewers. Any product that may be evaluated in this article, or claim that may be made by its manufacturer, is not guaranteed or endorsed by the publisher.
Acknowledgments
This study was carried out under the scientific research authorization from the Ministry of Environment N029-2019 IC-FLO-DNB/MA. We would like to express our gratitude to the Jocotoco Foundation owner and administrator of the Yanacocha private reserve where the long-term experimental study is implemented. We would like to acknowledge Andrea Terán-Valdéz for her invaluable help with field data collection. We extend our gratitude and acknowledgments to the Universidad de las Americas that financially supported this research through the research grant FGE.FCC.20.01.
Supplementary Material
The Supplementary Material for this article can be found online at: https://www.frontiersin.org/articles/10.3389/fevo.2021.673655/full#supplementary-material
References
Anthelme, F., Buendia, B., Mazoyer, C., and Dangles, O. (2012). Unexpected mechanisms sustain the stress gradient hypothesis in a tropical alpine environment. J. Veg. Sci. 23, 62–72. doi: 10.1111/j.1654-1103.2011.01333.x
Anthelme, F., Cauvy-Fraunié, S., Francou, B., Cáceres, B., and Dangles, O. (2021). Living at the edge: increasing stress for plants 2–13 years after the retreat of a tropical glacier [original research]. Front. Ecol. Evol. 9:584872. doi: 10.3389/fevo.2021.584872
Anthelme, F., Cavieres, L. A., and Dangles, O. (2014). Facilitation among plants in alpine environments in the face of climate change. Front. Plant Sci. 5:387. doi: 10.3389/fpls.2014.00387
Anthelme, F., Meneses, R. I., Valero, N. N. H., Pozo, P., and Dangles, O. (2017). Fine nurse variations explain discrepancies in the stress-interaction relationship in alpine regions. Oikos 126, 1173–1183. doi: 10.1111/oik.04248
Báez, S., Collins, S. L., Pockman, W. T., Johnson, J. E., and Small, E. E. (2013). Effects of experimental rainfall manipulations on Chihuahuan Desert grassland and Shrubland plant communities. Oecologia 172, 1117–1127. doi: 10.1007/s00442-012-2552-0
Barrio, I. C., Ehrich, D., Soininen, E. M., Ravolainen, V., Bueno, C. G., Gilg, O., et al. (2021). Developing common protocols to measure tundra herbivory across spatial scales. Arctic Sci. eFirst. 1–42. doi: 10.1139/as-2020-0020
Bates, D., Mächler, M., Bolker, B., and Walker, S. (2014). Fitting linear mixed-effects models using lme4. arXiv [preprint] arXiv:1406.5823, doi: 10.18637/jss.v067.i01
Buhrmann, R. D., Ramdhani, S., Pammenter, N. W., and Naidoo, S. (2016). Grasslands feeling the heat: the effects of elevated temperatures on a subtropical grassland. Bothalia Afr. Biodivers. Conserv. 46, 1–12. doi: 10.4102/abc.v46i2.2122
Buytaert, W., Cuesta-Camacho, F., and Tobón, C. (2011). Potential impacts of climate change on the environmental services of humid tropical alpine regions. Glob. Ecol. Biogeogr. 20, 19–33. doi: 10.1111/j.1466-8238.2010.00585.x
Calderón, M., Romero-Saltos, H., Cuesta, F., and Báez, S. (2013). Monitoreo de Contenidos y Flujos de Carbono en Gradientes Altitudinales Altoandinos, Protocolo 1. Quito: Condesan.
Calderón-Loor, M., Cuesta, F., Pinto, E., and Gosling, W. D. (2020). Carbon sequestration rates indicate ecosystem recovery following human disturbance in the equatorial Andes. PLoS One 15:e0230612. doi: 10.1371/journal.pone.0230612
Canty, A. R., and Ripley, B. D. (2021). Boot: Bootstrap R (S-Plus) Functions. In R package version 1.3-26.
Chao, A., Gotelli, N. J., Hsieh, T. C., Sander, E. L., Ma, K. H., Colwell, R. K., et al. (2014). Rarefaction and extrapolation with Hill numbers: a framework for sampling and estimation in species diversity studies. Ecol. Monogr. 84, 45–67. doi: 10.1890/13-0133.1
Cleef, A. M. (1978). Characteristics of neotropical paramo vegetation and its subantarctic relations. Erdwissenschaftliche Forschung 11, 365–390.
Cleef, A. M. (1981). The vegetation of the páramos of the Colombian Cordillera Oriental. Meded. Het Bot. Mus. Herbarium Rijksuniv. Utrecht 481:320.
Crowley, P. H. (1992). Resampling methods for computation-intensive data analysis in ecology and evolution. Annu. Rev. Ecol. Syst. 23, 405–447. doi: 10.1146/annurev.es.23.110192.002201
Cruz-Maldonado, N., Weemstra, M., Jiménez, L., Roumet, C., Angeles, G., Barois, I., et al. (2021). Aboveground-trait variations in 11 (sub)alpine plants along a 1000-m elevation gradient in tropical Mexico. Alp. Bot. doi: 10.1007/s00035-021-00260-z
Cuesta, F., Llambí, L. D., Huggel, C., Drenkhan, F., Gosling, W. D., Muriel, P., et al. (2019). New land in the Neotropics: a review of biotic community, ecosystem, and landscape transformations in the face of climate and glacier change. Reg. Environ. Change 19, 1623–1642. doi: 10.1007/s10113-019-01499-3
Cuesta, F., Muriel, P., Llambí, L. D., Halloy, S., Aguirre, N., Beck, S., et al. (2017). Latitudinal and altitudinal patterns of plant community diversity on mountain summits across the tropical Andes. Ecography 40, 1381–1394. doi: 10.1111/ecog.02567
Cuesta, F., Tovar, C., Llambí, L. D., Gosling, W. D., Halloy, S., Carilla, J., et al. (2020). Thermal niche traits of high alpine plant species and communities across the tropical Andes and their vulnerability to global warming. J. Biogeogr. 47, 408–420. doi: 10.1111/jbi.13759
Dixon, P. M. (1993). “The bootstrap and the jackknife: describing the precision of ecological indices,” in Design and Analysis of Ecological Experiments, eds S. M. Scheiner and J. Gurevitch (New York, NY: Chapman & Hall), 290–318.
Elmendorf, S. C., Henry, G. H. R., Hollister, R. D., Björk, R. G., Bjorkman, A. D., Callaghan, T. V., et al. (2012). Global assessment of experimental climate warming on tundra vegetation: heterogeneity over space and time. Ecol. Lett. 15, 164–175. doi: 10.1111/j.1461-0248.2011.01716.x
Fazlioglu, F., and Wan, J. S. H. (2021). Warming matters: alpine plant responses to experimental warming. Clim. Change 164:56. doi: 10.1007/s10584-021-02996-3
Flantua, S. G. A., O’Dea, A., Onstein, R. E., Giraldo, C., and Hooghiemstra, H. (2019). The flickering connectivity system of the north Andean páramos. J. Biogeogr. 46, 1808–1825. doi: 10.1111/jbi.13607
Fu, G., Zhang, X., Zhang, Y., Shi, P., Li, Y., Zhou, Y., et al. (2013). Experimental warming does not enhance gross primary production and aboveground biomass in the alpine meadow of Tibet. J. Appl. Remote Sens. 7:073505. doi: 10.1117/1.JRS.7.073505
Hamid, M., Khuroo, A. A., Malik, A. H., Ahmad, R., Singh, C. P., Dolezal, J., et al. (2020). Early evidence of shifts in Alpine summit vegetation: a case study from Kashmir Himalaya. Front. Plant Sci. 11:421. doi: 10.3389/fpls.2020.00421
Harte, J., and Shaw, R. (1995). Shifting dominance within a montane vegetation community: results of a climate-warming experiment. Science 267:876. doi: 10.1126/science.267.5199.876
Hoch, G., and Körner, C. (2003). The carbon charging of pines at the climatic treeline: a global comparison. Oecologia 135, 10–21. doi: 10.1007/s00442-002-1154-7
Hoch, G., and Korner, C. (2005). Growth, demography and carbon relations of Polylepis trees at the world’s highest treeline. Funct. Ecol. 19, 941–951. doi: 10.1111/j.1365-2435.2005.01040.x
Hughes, R. A., and Pilatasig, L. F. (2002). Cretaceous and Tertiary terrane accretion in the Cordillera Occidental of the Andes of Ecuador. Tectonophysics 345, 29–48. doi: 10.1016/S0040-1951(01)00205-0
Klein, J. A., Harte, J., and Zhao, X. Q. (2004). Experimental warming causes large and rapid species loss, dampened by simulated grazing, on the Tibetan Plateau. Ecol. Lett. 7, 1170–1179. doi: 10.1111/j.1461-0248.2004.00677.x
Klein, J. A., Harte, J., and Zhao, X.-Q. (2007). Experimental warming, not grazing, decreases rangeland quality on the Tibetan plateau. Ecol. Appl. 17, 541–557. doi: 10.1890/05-0685
Körner, C. (2003). Alpine Plant Life: Functional Plant Ecology of High Mountain Ecosystems; with 47 Tables. Berlin: Springer Science & Business Media.
Körner, C., and Paulsen, J. (2004). A world-wide study of high altitude treeline temperatures. J. Biogeogr. 31, 713–732. doi: 10.1111/j.1365-2699.2003.01043.x
Lasso, E., Matheus-Arbeláez, P., Gallery, R. E., Garzón-López, C., Cruz, M., and Leon-Garcia, I. (2021). Homeostatic response to three years of experimental warming suggests high intrinsic natural resistance in the Páramos to warming in the short term [original research]. Front. Ecol. Evol. 9:615006. doi: 10.3389/fevo.2021.615006
Leegood, R. C. (2002). C4 photosynthesis: principles of CO2 concentration and prospects for its introduction into C3 plants. J. Exp. Bot. 53, 581–590. doi: 10.1093/jexbot/53.369.581
Letts, M. G., and Mulligan, M. (2005). The impact of light quality and leaf wetness on photosynthesis in north-west Andean tropical montane cloud forest. J. Trop. Ecol. 21, 549–557. doi: 10.1017/S0266467405002488
Liu, J. J., Liu, D. T., Xu, K., Gao, L. M., Ge, X. J., Burgess, K. S., et al. (2018). Biodiversity explains maximum variation in productivity under experimental warming, nitrogen addition, and grazing in mountain grasslands. Ecol. Evol. 8, 10094–10112. doi: 10.1002/ece3.4483
Llerena-Zambrano, M., Ordoñez, J. C., Llambí, L. D., van der Sande, M., Pinto, E., Salazar, L., et al. (2021). Minimum temperature drives community leaf trait variation in secondary montane forests along a 3000-m elevation gradient in the tropical Andes. Plant Ecol. Divers. 1–17. doi: 10.1080/17550874.2021.1903604 [Epub ahead of print].
Marion, G. M., Henry, G. H. R., Freckman, D. W., Johnstone, J., Jones, G., Jones, M. H., et al. (1997). Open-top designs for manipulating field temperature in high-latitude ecosystems. Glob. Change Biol. 3, 20–32. doi: 10.1111/j.1365-2486.1997.gcb136.x
Marion, G. M., and Pidgeon, D. E. (1992). Passive Techniques for Manipulating Field Soil Temperatures. Fort Belvoir, VA: Defense Technical Information Center.
Márquez, E. J., Rada, F., and Fariñas, M. R. (2006). Freezing tolerance in grasses along an altitudinal gradient in the Venezuelan Andes. Oecologia 150, 393–397. doi: 10.1007/s00442-006-0556-3
Monteiro, J. A. F., Hiltbrunner, E., and Körner, C. (2011). Functional morphology and microclimate of Festuca orthophylla, the dominant tall tussock grass in the Andean Altiplano. Flora Morphol. Distribut. Funct. Ecol. Plants 206, 387–396. doi: 10.1016/j.flora.2011.01.001
Moret, P., Muriel, P., Jaramillo, R., and Dangles, O. (2019). Humboldt’s tableau physique revisited. Proc. Natl. Acad. Sci. U.S.A. 116, 12889–12894. doi: 10.1073/pnas.1904585116
Na, L., Genxu, W., Yan, Y., Yongheng, G., and Guangsheng, L. (2011). Plant production, and carbon and nitrogen source pools, are strongly intensified by experimental warming in alpine ecosystems in the Qinghai-Tibet Plateau. Soil Biol. Biochem. 43, 942–953. doi: 10.1016/j.soilbio.2011.01.009
Navarro-Serrano, F., López-Moreno, J. I., Domínguez-Castro, F., Alonso-González, E., Azorin-Molina, C., El-Kenawy, A., et al. (2020). Maximum and minimum air temperature lapse rates in the Andean region of Ecuador and Peru. Int. J. Climatol. 40, 6150–6168. doi: 10.1002/joc.6574
Oksanen, J., Blanchet, F. G., Friendly, M., Kindt, R., Legendre, P., McGlinn, D., et al. (2020). vegan: Community Ecology Package. R package version 2.5-6. 2019.
Opedal, ØH., Armbruster, W. S., and Graae, B. J. (2015). Linking small-scale topography with microclimate, plant species diversity and intra-specific trait variation in an alpine landscape. Plant Ecol. Divers. 8, 305–315. doi: 10.1080/17550874.2014.987330
Pancotto, V., Holl, D., Escobar, J., Castagnani, M. F., and Kutzbach, L. (2020). Cushion bog plant community responses to passive warming in southern Patagonia. Biogeosci. Discuss 18, 4817–4839. doi: 10.5194/bg-2020-440
Porro, F., Tomaselli, M., Abeli, T., Gandini, M., Gualmini, M., Orsenigo, S., et al. (2019). Could plant diversity metrics explain climate-driven vegetation changes on mountain summits of the GLORIA network? Biodivers. Conserv. 28, 3575–3596. doi: 10.1007/s10531-019-01837-1
Rada, F., Azócar, A., and García-Núñez, C. (2019). Plant functional diversity in tropical Andean páramos. Plant Ecol. Divers. 12, 539–553. doi: 10.1080/17550874.2019.1674396
Ramsay, P. M. (2001). “The ecology of Volcán Chiles: high-altitude ecosystems on the Ecuador-Colombia border,” in Páramo Vegetation Recovery in the First Two Years after a Fire on Volcán Chiles, ed. P. M. Ramsay (Ecuador: Pebble & Shell).
Ramsay, P. M., and Oxley, E. R. B. (1997). The growth form composition of plant communities in the ecuadorian páramos. Plant Ecol. 131, 173–192. doi: 10.1023/A:1009796224479
Ramsay, P. M., and Oxley, E. R. B. (2001). An assessment of aboveground net primary productivity in Andean grasslands of central Ecuador. Mount. Res. Dev. 21, 161–167.
Rugel, V. B. (2019). Propuesta de Plan de Manejo Turístico Para la Reserva Biológica Yanacocha Pontificia Universidad Católica del Ecuador]. Quito: Repositorio PUCE.
Rustad, L., Campbell, J., Marion, G., Norby, R., Mitchell, M., Hartley, A., et al. (2001). A meta-analysis of the response of soil respiration, net nitrogen mineralization, and aboveground plant growth to experimental ecosystem warming. Oecologia 126, 543–562. doi: 10.1007/s004420000544
Sarmiento, J. L. (1986). On the north and tropical Atlantic heat balance. J. Geophys. Res. 91:11677. doi: 10.1029/jc091ic10p11677
Sierra-Almeida, A., and Cavieres, L. A. (2010). Summer freezing resistance decreased in high-elevation plants exposed to experimental warming in the central Chilean Andes. Oecologia 163, 267–276. doi: 10.1007/s00442-010-1592-6
Sklenář, P., and Balslev, H. (2005). Superpáramo plant species diversity and phytogeography in Ecuador. Flora Morphol. Distrib. Funct. Ecol. Plants 200, 416–433. doi: 10.1016/j.flora.2004.12.006
Sklenář, P., and Balslev, H. (2007). Geographic flora elements in the Ecuadorian superpáramo. Flora Morphol. Distrib. Funct. Ecol. Plants 202, 50–61. doi: 10.1016/j.flora.2006.03.002
Sklenář, P., Bendix, J., and Balslev, H. (2008). Cloud frequency correlates to plant species composition in the high Andes of Ecuador. Basic Appl. Ecol. 9, 504–513. doi: 10.1016/j.baae.2007.09.007
Sklenář, P., Hedberg, I., and Cleef, A. M. (2014). Island biogeography of tropical alpine floras. J. Biogeogr. 41, 287–297. doi: 10.1111/jbi.12212
Sklenář, P., Kučerová, A., Macek, P., and Macková, J. (2010). Does plant height determine the freezing resistance in the páramo plants? Austral Ecol. 35, 929–934. doi: 10.1111/j.1442-9993.2009.02104.x
Sklenář, P., Kucerova, A., Mackova, J., and Macek, P. (2015). Temporal variation of climate in the high-elevation páramo of Antisana, Ecuador. Geogr. Fis. e Dinamica Q. 38, 67–78.
Sklenář, P., Kučerová, A., Macková, J., and Romoleroux, K. (2016). Temperature microclimates of plants in a tropical alpine environment: how much does growth form matter? Arct. Antarct. Alp. Res. 48, 61–78. doi: 10.1657/AAAR0014-084
Sklenář, P., and Ramsay, P. M. (2001). Diversity of zonal páramo plant communities in Ecuador. Divers. Distrib. 7, 113–124. doi: 10.1046/j.1472-4642.2001.00101.x
Smith, A. P., and Young, T. P. (1987). Tropical alpine plant ecology. Annu. Rev. Ecol. Syst. 18, 137–158.
Sokal, R. R., and Rohlf, J. F. (2012). Biometry : the Principles and Practice of Statistics in Biological Research, 4th Edn. New York, NY: W.H. Freeman.
Steinbauer, K., Lamprecht, A., Semenchuk, P., Winkler, M., and Pauli, H. (2020). Dieback and expansions: species-specific responses during 20 years of amplified warming in the high Alps. Alp. Bot. 130, 1–11. doi: 10.1007/s00035-019-00230-6
Steinbauer, M. J., Grytnes, J. A., Jurasinski, G., Kulonen, A., Lenoir, J., Pauli, H., et al. (2018). Accelerated increase in plant species richness on mountain summits is linked to warming. Nature 556, 231–234. doi: 10.1038/s41586-018-0005-6
Teunissen van Manen, M. L., Jansen, B., Cuesta, F., León-Yánez, S., and Gosling, W. D. (2020). From leaf to soil: n-alkane signal preservation, despite degradation along an environmental gradient in the tropical Andes. Biogeosciences 17, 5465–5487. doi: 10.5194/bg-17-5465-2020
Teunissen van Manen, M. L., Jansen, B., Cuesta, F., León−Yánez, S., and Gosling, W. D. (2019). Leaf wax n-alkane patterns of six tropical montane tree species show species-specific environmental response. Ecol. Evol. 9, 9120–9128. doi: 10.1002/ece3.5458
Tito, R., Vasconcelos, H. L., and Feeley, K. J. (2020). Mountain ecosystems as natural laboratories for climate change experiments. Front. For. Glob. Change 3:38. doi: 10.3389/ffgc.2020.00038
Tovar, C., Melcher, I., Kusumoto, B., Cuesta, F., Cleef, A., Meneses, R. I., et al. (2020). Plant dispersal strategies of high tropical alpine communities across the Andes. J. Ecol. 108, 1910–1922. doi: 10.1111/1365-2745.13416
Troll, C. (1959). Die Tropischen Gebirge: Ihre Dreidimensionale Klimatische und Pflanzengeographische Zonierung. Bonn: Bonner Geographische Abhandlungen.
Vuille, M., Bradley, R. S., and Keimig, F. (2000). Climate variability in the Andes of Ecuador and its relation to tropical Pacific and Atlantic sea surface temperature anomalies. J. Clim. 13, 2520–2535. doi: 10.1175/1520-04422000013<2520:CVITAO<2.0.CO;2
Vuille, M., Bradley, R. S., Werner, M., and Keimig, F. (2003). “20th century climate change in the tropical Andes: observations and model results,” in Climate Variability and Change in High Elevation Regions: Past, Present & Future, ed. H. F. Diaz (Dordrecht: Springer), 75–99.
Vuille, M., Carey, M., Huggel, C., Buytaert, W., Rabatel, A., Jacobsen, D., et al. (2018). Rapid decline of snow and ice in the tropical Andes – impacts, uncertainties and challenges ahead. Earth Sci. Rev. 176, 195–213. doi: 10.1016/j.earscirev.2017.09.019
Walker, M. D., Wahren, C. H., Hollister, R. D., Henry, G. H. R., Ahlquist, L. E., Alatalo, J. M., et al. (2006). Plant community responses to experimental warming across the tundra biome. Proc. Natl. Acad. Sci. U.S.A. 103, 1342–1346. doi: 10.1073/pnas.0503198103
Weberbauer, A. (1945). El Mundo Vegetal de los Andes Peruanos (The Plant World of the Peruvian Andes). Lima: Ministerio de Agricultura (Ministry of Agriculture), 776.
Wiley, E., and Helliker, B. (2012). A re−evaluation of carbon storage in trees lends greater support for carbon limitation to growth. New Phytol. 195, 285–289. doi: 10.1111/j.1469-8137.2012.04180.x
Wong, C. (1991). “Shade tolerance of tropical forages: a review,” in Forages for Plantation Crops, Vol. 32, eds H. M. Shelton and W. W. Stur (Canberra: ACIAR Proceedings), 64–69.
WRB, I. W. G. (2015). World Reference Base for Soil Resources 2014, Update 2015 International Soil Classification System for Naming Soils and Creating Legends for Soil Maps. In (Vol. World Soil Resources Reports. Rome: FAO.
Keywords: climatic conditions, field experiments, mountain ecosystems, temperature, functional trait, Andes, biomass
Citation: Duchicela SA, Cuesta F, Tovar C, Muriel P, Jaramillo R, Salazar E and Pinto E (2021) Microclimatic Warming Leads to a Decrease in Species and Growth Form Diversity: Insights From a Tropical Alpine Grassland. Front. Ecol. Evol. 9:673655. doi: 10.3389/fevo.2021.673655
Received: 28 February 2021; Accepted: 06 September 2021;
Published: 30 September 2021.
Edited by:
David Sánchez Pescador, Rey Juan Carlos University, SpainReviewed by:
Fabien Anthelme, Institut de Recherche pour le Développement, FranceAdrián Escudero, Rey Juan Carlos University, Spain
Copyright © 2021 Duchicela, Cuesta, Tovar, Muriel, Jaramillo, Salazar and Pinto. This is an open-access article distributed under the terms of the Creative Commons Attribution License (CC BY). The use, distribution or reproduction in other forums is permitted, provided the original author(s) and the copyright owner(s) are credited and that the original publication in this journal is cited, in accordance with accepted academic practice. No use, distribution or reproduction is permitted which does not comply with these terms.
*Correspondence: Francisco Cuesta, ZnJhbmNpc2NvLmN1ZXN0YUB1ZGxhLmVkdS5lYw==
†These authors have contributed equally to this work