 Bikram Pandey1,2*
 Kaiwen Pan1*
 Mohammed A. Dakhil3
 Ziyan Liao1,2
 Arbindra Timilsina4
 Manita Khanal5
 Lin Zhang1
- 1CAS Key Laboratory of Mountain Ecological Restoration and Bio-resource Utilization and Ecological Restoration Biodiversity Conservation Key Laboratory of Sichuan Province, Chengdu Institute of Biology, Chinese Academy of Sciences, Chengdu, China
- 2University of Chinese Academy of Sciences, Beijing, China
- 3Botany and Microbiology Department, Faculty of Science, Helwan University, Cairo, Egypt
- 4Key Laboratory of Agricultural Water Resources, Hebei Key Laboratory of Soil Ecology, Center for Agricultural Resources Research, Institute of Genetics and Developmental Biology, Chinese Academy of Sciences, Shijiazhuang, China
- 5Institute of Forestry, Tribhuvan University, Pokhara, Nepal
The species richness–climate relationship is a significant concept in determining the richness patterns and predicting the cause of its distribution. The distribution range of species and climatic variables along elevation have been used in evaluating the elevational diversity gradients (EDG). However, the species richness of gymnosperms along elevation and its driving factors in large geographic areas are still unknown. Here, we aimed at evaluating the EDG of gymnosperms in the ecoregions of China. We divided the geographical region of China into 34 ecoregions and determine the richness pattern of gymnosperm taxa along elevation gradients. We demonstrated the richness patterns of the 237-gymnosperm (219 threatened, 112 endemic, 189 trees, and 48 shrubs) taxa, roughly distributed between 0 and 5,300 m (above sea level) in China. As possible determinants of richness patterns, annual mean temperature (TEMP), annual precipitation (PPT), potential evapotranspiration (PET), net primary productivity (SNPP), aridity index (AI), temperature seasonality (TS), and precipitation seasonality (PS) are the major predictor variables driving the EDG in plants. We used the species interpolation method to determine the species richness at each elevation band. To evaluate the richness pattern of gymnosperms in an ecoregion, generalized additive modeling and structural equation modeling were performed. The ecoregions in the southern part of China are rich in gymnosperm species, where three distinct richness patterns—(i) hump-shaped, (ii) monotonic increase, and (iii) monotonic decline—were noticed in China. All climatic variables have a significant effect on the richness pattern of gymnosperms; however, TEMP, SNPP, TS, and PS explained the highest deviance in diversity-rich ecoregions of China. Our results suggests that the highest number of gymnosperms species was found in the southwestern and Taiwan regions of China distributed at the 1,600- and 2,800-m elevation bands. These regions could be under severe stress in the near future due to expected changes in precipitation pattern and increase of temperature due to climate change. Thus, our study provided evidence of the species–climate relationship that can support the understanding of future conservation planning of gymnosperms.
Introduction
Species are not randomly distributed on the earth’s surface; instead, they form a distinct distribution pattern (Lomolino, 2001). Comprehending species richness patterns is crucial to studying the global climate change phenomenon and to predicting its biological impacts on vegetation. The distributions of plants along elevation were extensively used to determine the richness pattern and to formulate the future conservation planning (Kluge et al., 2017; Paudel et al., 2018; Vetaas et al., 2019). Therefore, elevational diversity gradients (EDG) of species richness have received intense attention in recent years (Lomolino, 2001; McCain, 2004). The species richness pattern along the elevational gradients and the mechanism that defines this richness pattern have been the focus of community ecologists. One of the most interesting features is that species richness follows common patterns in the distribution along the elevations (i.e., the EDG pattern) (Rahbek, 1995; McCain, 2004). Available studies suggested different patterns of EDG that can be summarized into four patterns of species richness—(i) decrease in species with increasing elevation, (ii) increase in species with increasing elevation, (iii) highest number of species at mid-elevation, forming a unimodal pattern, and (iv) less number of species at mid-elevation, creating a “U”-shaped pattern. Most researches have explained a significant role of EDG in defining the diversity patterns of plants (Rahbek, 1995; Lomolino, 2001; Bhattarai and Vetaas, 2003; Bhattarai et al., 2004; Wang et al., 2007; Gao et al., 2017; Kluge et al., 2017; Gao and Liu, 2018; Subedi et al., 2019; Pandey et al., 2020b). Lomolino (2001) reviewed and summarized the studies linking the elevational distribution of species richness, and identified the further need for comparing the richness patterns and the factors that determine EDG. Lomolino (2001) also prioritized understanding the richness of different conservation groups (e.g., threatened and endemic) and life forms (e.g., tree, shrub, herbs, etc.) in varied climatic and vegetation-rich ecological regions (hereafter ecoregion).
In an ecoregion, elevation and environmental gradients are important as their changes cause the variations in diversity and distribution of species. An increasing number of studies have documented that the properties of the plant community vary concerning abiotic factors along elevation gradients such as temperature, availability of water, productivity, evapotranspiration, and seasonality (Rahbek, 1995; Rosenzweig, 1995; Bhattarai and Vetaas, 2003; Hawkins et al., 2003; Körner, 2003; Currie et al., 2004; Gao and Liu, 2018). On the other hand, the geographical area is also a crucial factor influencing the diversity at elevational gradients. In general, the large geographic area could support more species and vice versa (Rosenzweig, 1995; Körner, 2003). Therefore, to explain the species richness patterns in plants, several hypotheses have been proposed, which concern the primary productivity (Bhattarai and Vetaas, 2003; Vetaas et al., 2019), temperature (Hawkins et al., 2003; Vetaas et al., 2019), availability of water (rainfall/precipitation) (Currie and Paquin, 1987; Hawkins et al., 2003; Kluge et al., 2017), potential evapotranspiration (Bhattarai et al., 2004; Vetaas and Ferrer-Castán, 2008; Geng et al., 2019), and seasonality (Gao and Liu, 2018; Pandey et al., 2020a).
Temperature and water availability have a direct relationship with the pattern of species richness by accelerating the metabolic activities in plants (Pausas and Austin, 2001; Currie et al., 2004). Water availability and temperature have a different response to the species diversity; however, their combined effect determines the synergic mechanisms of plant species richness (Vetaas and Grytnes, 2002; Gao and Liu, 2018; Pandey et al., 2020b). Previous studies showed the positive quadratic (mid-elevation peak) relationship between species diversity and temperature and water availability along elevation gradients (Bhattarai and Vetaas, 2003; Kluge et al., 2017; Subedi et al., 2019; Pandey et al., 2020b). However, the correlation between species richness, temperature, and water availability varies from region to region. On the other hand, potential evapotranspiration (PET) has been reported to be the best determinant of the species richness pattern of plant species (O’Brien, 1993). Intermediate levels of PET may be optimal for biological activity. Plant growth forms (tree and shrub) have different response elevation patterns of species diversity and PET. Similarly, the aridity index (AI) is the degree of water deficiency available at a given area. Projections of global warming suggest an increase of aridity in continental areas, due to a warming atmosphere. AI provides a good proxy of the complex nature of aridity change over time (Greve et al., 2019). On the other hand, climatic seasonality increases the level of tolerance in plant species and favors the wide spread of organisms. There are studies that support the use of temperature seasonality (TS) and precipitation seasonality (PS) in explaining the richness pattern of plant species, including gymnosperms (Gao and Liu, 2018; Pandey et al., 2020a). Finally, net primary productivity (NPP) is directly linked to biochemical oxidation processes (Rahbek et al., 2007; Vetaas et al., 2019). Species richness is related to proxies of NPP and generates more individuals by increasing chances of coexistence. It assumes that the distribution of plants depends on productivity, and the species richness is positively correlated (Rahbek et al., 2007; Vetaas et al., 2019). Moreover, Yang et al. (2017) found a decline in species diversity at high temperature and less precipitation in low-latitude subtropical mountains of China, while at the higher-latitude mountainous regions of China, water availability was a significant variable at low elevation but temperature at a higher elevation (Sang, 2009). Therefore, studying the dynamic relationship between species richness–temperature, water, PET, and NPP is essential in understanding the richness pattern of plant species along the elevation gradients in China’s ecoregion.
China is one of the biodiversity hotspots of plant species on the earth, which can be proven by the presence of more than 25,000 species of flowering and non-flowering plants, including gymnosperms (Wu and Raven, 1999). There are 248 taxa of gymnosperms distributed in the ecoregions of China (Wu and Raven, 1999; Fang et al., 2011; Tang, 2015; You et al., 2017; Pandey et al., 2020a), where more than 80% are threatened, and around 50% are endemic species (Ying et al., 2004; Pandey et al., 2020a), demonstrating the hotspot of gymnosperm diversity. In this study, more attention was given to threatened and endemic gymnosperms because of their conservation priorities and geographical limitation, respectively (Vetaas and Grytnes, 2002; Ying et al., 2004; Kubota et al., 2015; Paudel et al., 2018). An ecoregion features similar climatic affinities and vegetation types and richness in the distribution of endemic species, but due to increasing human activities and climate change phenomena in these regions, concern regarding the conversation has gained importance (Olson and Dinerstein, 2002). Although there are studies related to the distribution of threatened species, little attention was given to understanding the biogeographical processes in the distribution of threatened species, especially the gymnosperms (Kubota et al., 2015; Paudel et al., 2018). On the other hand, endemic species are geographic range specific and are given more attention; however, little is known about the elevational pattern of endemic gymnosperms’ distribution (Kubota et al., 2015). Moreover, southwest China and Taiwan are abundant in the diversity of gymnosperms (Pandey et al., 2020a). These regions are characterized by the presence of the mountain with an elevation range of more than 4,000 m. On the other hand, extreme and harsh climatic conditions in the North, Tibetan plateau, and Inner-Mongolian regions might be the limiting factor for the distribution of gymnosperms (Pandey et al., 2020a). Therefore, the ecoregions of China are suitable for the study on the EDG of gymnosperm species. Gymnosperms are not only the main components of the ecosystem, but studying their distribution patterns would provide better understanding to the high degree of diversity within the ecoregions of China.
It is noteworthy that there are studies determining the EDG of plant species in China. Most of these studies were conducted in the mountainous region of China (Meng et al., 2012; Dorji et al., 2014; Chai and Wang, 2016; Yang et al., 2017; Geng et al., 2019); however, no previous studies have prioritized to evaluate the species richness of gymnosperms in the larger geographic area (e.g., ecoregions). A previous study explaining the species richness pattern of sandy beach based on the ecoregions was very informative (Bertuzzo et al., 2016); therefore, studying the importance of elevation on the distribution of gymnosperms along the ecoregions of China is the priority of this study. Although there are studies that determine the richness pattern of gymnosperms in the Himalayan regions (Subedi et al., 2019; Pandey et al., 2020b), a comprehensive study of the elevational distribution pattern of gymnosperms in the world’s diverse ecoregions is yet to be explored. To the best of our knowledge, this study is the first and most detailed investigation of the elevational richness pattern of gymnosperms species in China.
Therefore, our objectives were to (i) identify the ecoregions that harbor the highest species diversity of endemic and threatened gymnosperms, (ii) determine the effect of environment affinities that regulate the species richness patterns of endemic or threatened gymnosperms at different growth form (trees and shrubs), and (iii) identify the best area for future research on the gymnosperms at the biogeographic level.
Materials and Methods
Study Area
Our study area comprises the ecoregions of China, classified by Olson et al. (2001). An ecoregion is an area with a recurring pattern of ecosystems characterized by similar vegetation, landform, soil, and climate; it may or may not include the human activity (Olson and Dinerstein, 2002). Ecoregions may originate from various physical (elevation, plate tectonics, and topographic variation) and climatic variation (temperature, precipitation, and seasonal range) barriers. China is divided into two biogeographic realms (Palearctic and Indo-Malay) and 12 ecoregions (Olson and Dinerstein, 2002). The country covers a vast area and characterized by varied climatic and topography conditions. Therefore, to examine the effect of EDG on gymnosperm species richness patterns along the ecoregions of China, we used 12 subsampled ecoregions into 34 sub-ecoregions (used the term ecoregion in this study) which represent similar vegetation and forest types (Olson and Dinerstein, 2002; Figure 1; Supplementary Table 1). China is characterized by diverse terrestrial ecoregions, including tropical to temperate to alpine climate (Hou, 1983). These ecoregions feature tropical and subtropical moist broadleaf forests, temperate broadleaved and coniferous mixed forests, temperate coniferous forests, temperate broadleaved and mixed forests, and montane grassland and shrublands (Hou, 1983). Each ecoregion is characterized by the rich diversity and endemic species of gymnosperms (Wu and Raven, 1999) and has a distinct variation in elevation.
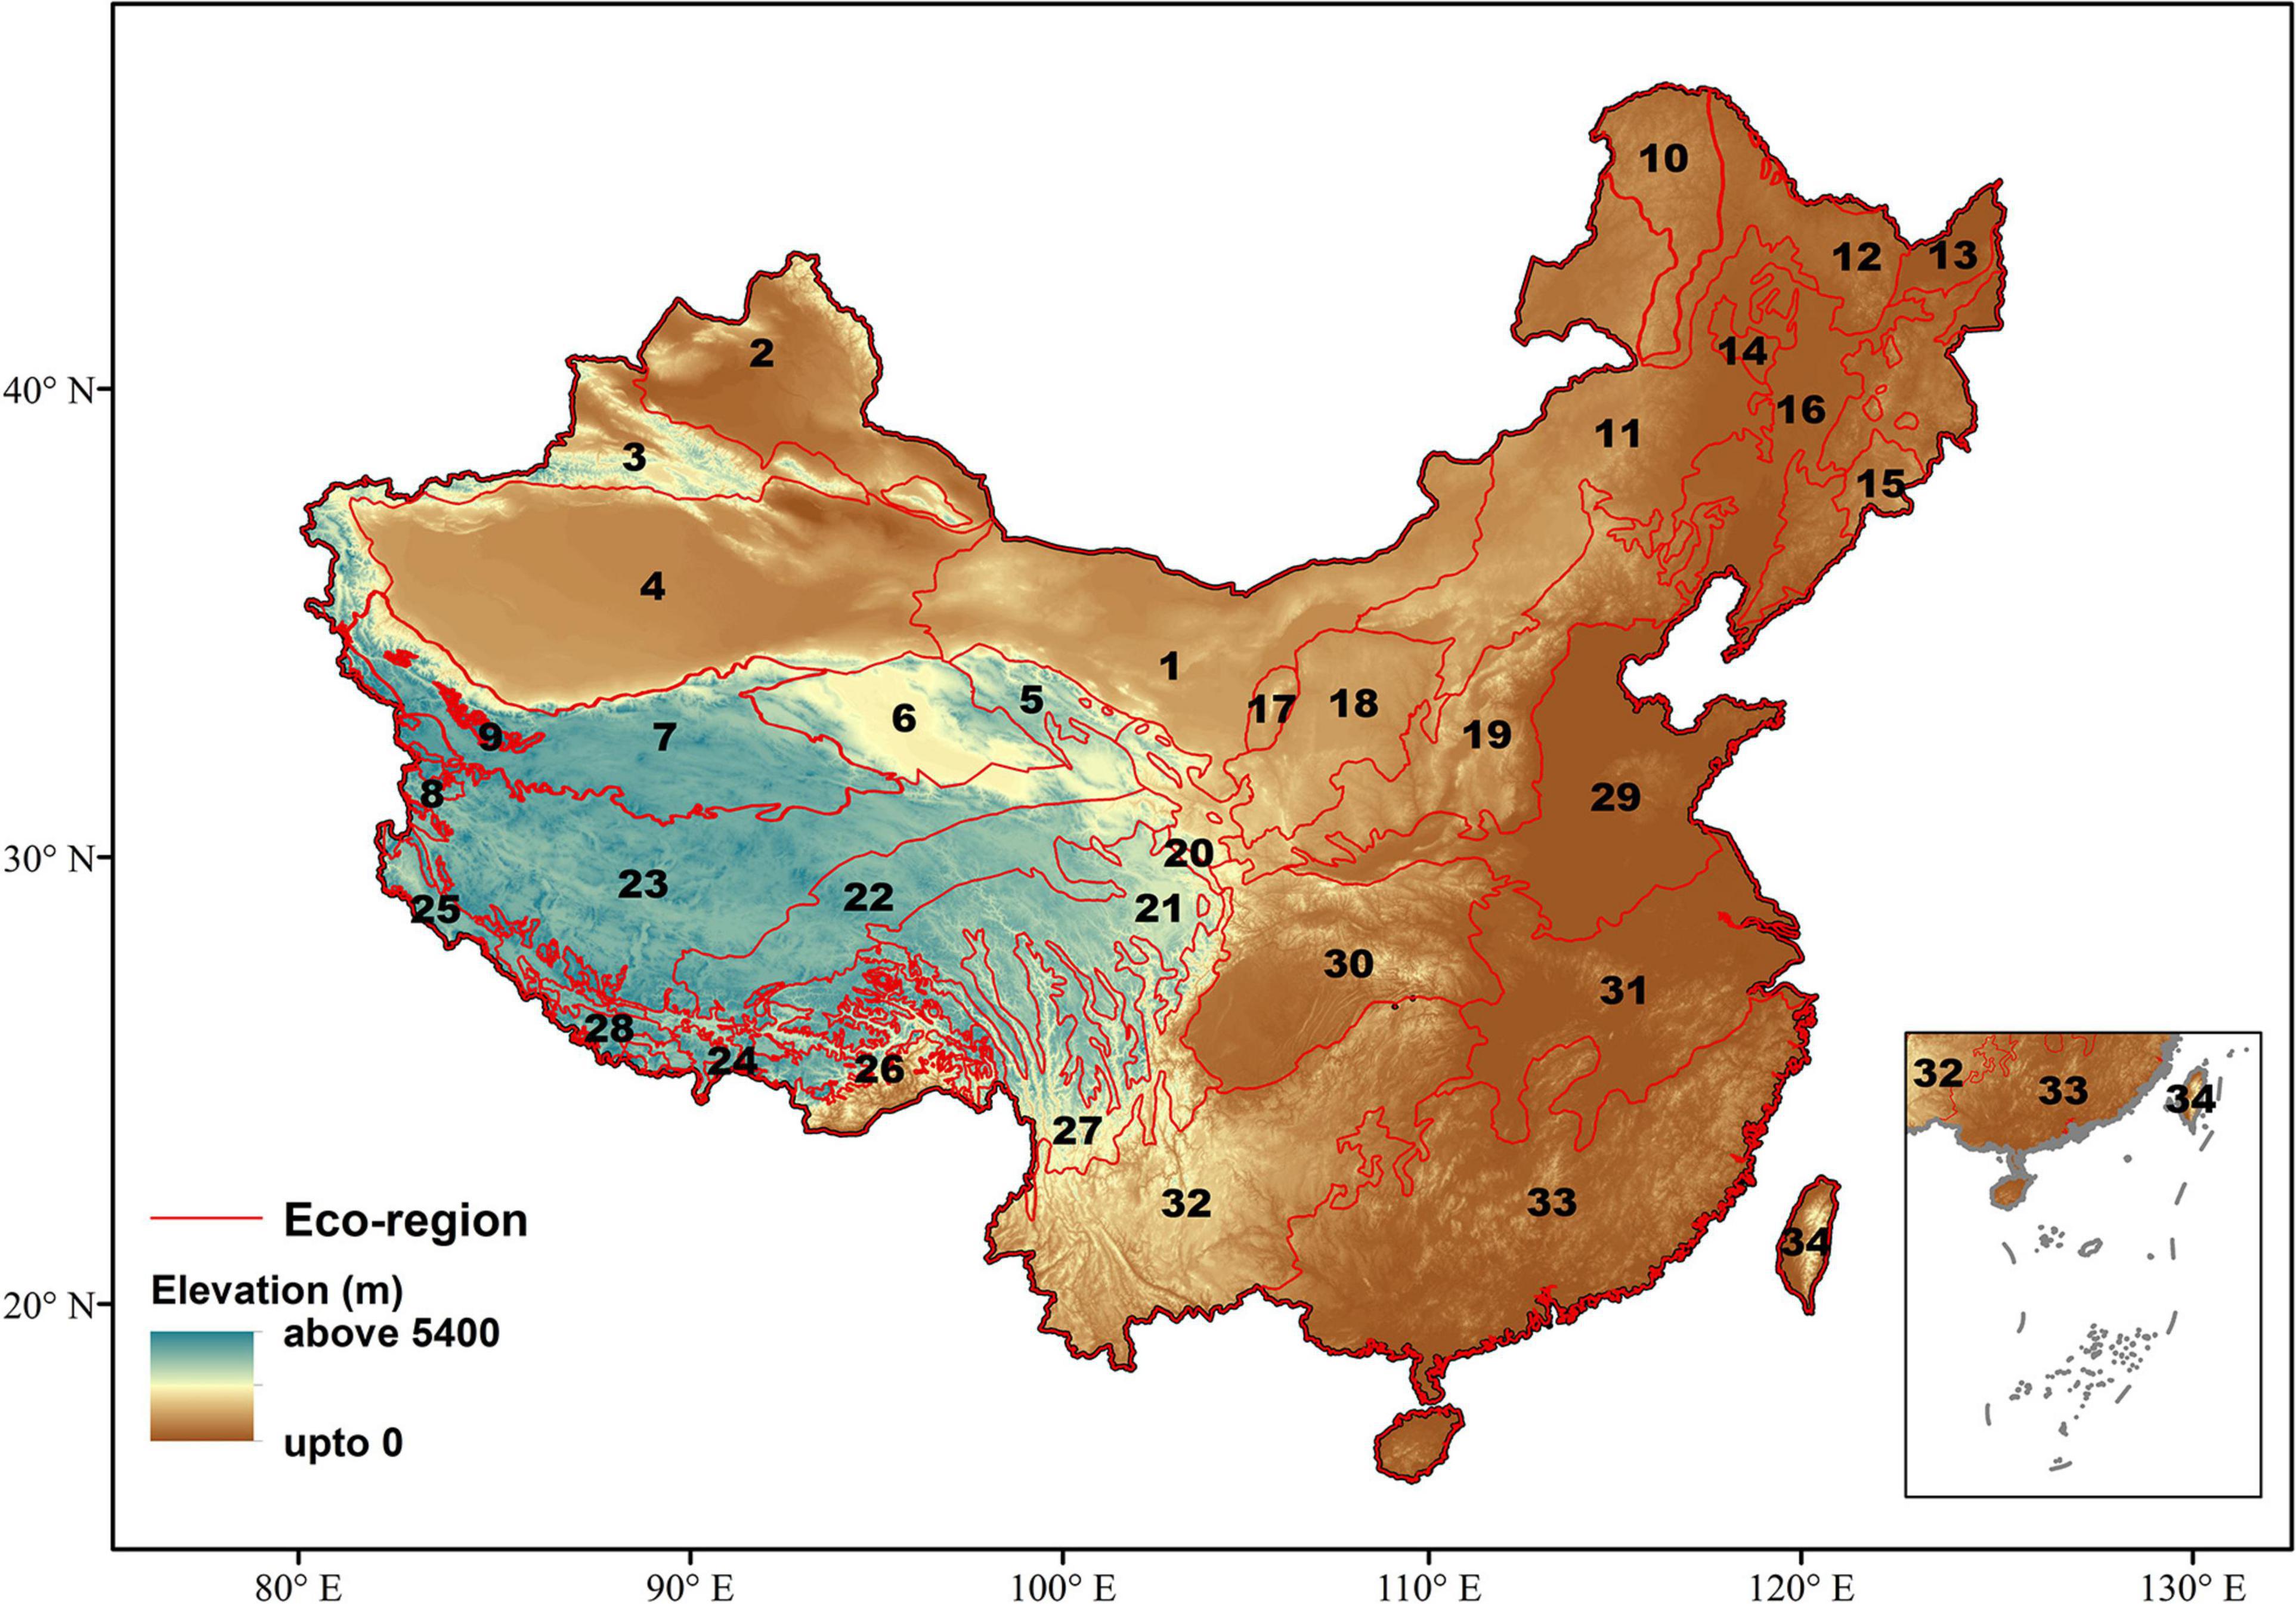
Figure 1. Ecoregion of China and its elevation differentiation. The numbers in the map indicate the number of ecoregions used as a reference in this study. The differentiation of ecoregions is based on Olson and Dinerstein (2002). 1, Eastern Gobi desert; 2, Junggar basin; 3, Tian Shan Mountain; 4, Tarim basin; 5, Qilian Mountains; 6, Qaidam basin; 7, North Tibetan Plateau-Kunlun Mountains; 8, Karakoram-West Tibetan plateau; 9, Rock and Ice; 10, East Siberian; 11, Mongolian–Manchurian; 12, East–Manchurian; 13, Suiphun-Khanka; 14, Nenjiang river basin; 15, Changbai mountains; 16, Northeast China plain; 17, Helanshan; 18, Ordos plateau; 19, Central China-Loess plateau; 20, Qilian Mountains; 21, Southeast Tibet; 22, Tibetan plateau; 23, Central Tibetan plateau; 24, Yarlung Tsangpo; 25, Northwestern Himalayan; 26, Eastern Himalayan; 27, Qionglai mountain; 28, Eastern Himalayan; 29, Huang-He plain; 30, Qin Ling Mountains; 31, Changjiang plain; 32, Guizhou plateau; 33, South China; 34, Taiwan.
Species Data
The numbers of gymnosperm species in each ecoregion were documented primarily based on Wu and Raven (1999). We used Wu and Raven (1999); Ying et al. (2004), Jiang et al. (2010); Fang et al. (2011), and Tang (2015) to collect the elevational range distribution of gymnosperms, which was analyzed based on the procedure mentioned in Vetaas and Grytnes (2002) and Bhattarai et al. (2004). We followed the taxonomy of Flora of China (Wu and Raven, 1999) and validate the name using “Catalogue of life”.1 There were 248 taxa of gymnosperm species, while 11 species lack elevational data and were not included in this study. Therefore, our study comprises 237 species of gymnosperms that were differentiated into five response variables, namely, all, threatened, endemic, tree, and shrub species. In total, we assigned 237 species as all species, threatened species (n = 219, 92.4% of total species), endemic species (n = 112, 47.25% of total species), trees (n = 189, 79.74% of total species), and shrubs (n = 48, 20.25% of total species). All species are the native species of gymnosperms reported within the floristic region of China. Threatened species are taxonomically diverse species and of high conservation values. Gymnosperms are threatened plant species, where 40% of these species are at high risk of extinction (Wu and Raven, 1999; Ying et al., 2004; Jiang et al., 2010). We used a list of globally threatened species that occur in China from the IUCN Red List of Threatened Species.2 The IUCN Red List is the most comprehensive database of the global conservation status of plants and animals. Endemic species are confined to specific geographical regions and have distribution restrictions. They have a range of contractions and are more frequently found in specific locations of origin. We followed Wu and Raven (1999) and Ying et al. (2004) to extract the information of endemic species. We divided the species of gymnosperms based on the life form. We extracted the life from tree and shrub following Wu and Raven (1999). Six species of Gnetum were vine; therefore, we merged the information of vine and shrub.
Differentiation of Elevation Gradients
To determine the species richness of gymnosperms along each elevation gradient, we divided the geographical region of China based on ecoregion, and the elevation gradients in each ecoregion were reclassified. Previous studies have suggested the differentiation of elevation at a 100-m elevation band, and following Vetaas and Grytnes (2002), we divided the elevation range of each ecoregion into a 100-m elevation band. Based on our preliminary findings, the elevational range distribution of gymnosperms in China ranged between 0 and 5,300 m above sea level (a.s.l). Therefore, we divided the elevation between 0 and 5,300 m into 54 zones of 100 vertical meters each (however, each ecoregion has differences in elevation range). First, we generated a base elevational grid map of the ecoregions of China using Digital Elevation Model (DEM) downloaded from SRTM 90 digital elevation data.3 We reclassified the DEM of each ecoregion into 100-m elevation bands and extracted the total geographic area of each elevation band using ArcGIS (v10.3.1) (ESRI Inc., Redlands, CA, United States).
Environmental Variables
Species richness depends on temperature, humidity, and primary productivity-related climatic variables. Therefore, in this study, to quantify the effect of environmental constraints on species richness along elevation gradients, we used seven environmental variables—temperature, precipitation, PET, NPP, AI, and climatic seasonality. We included mean annual temperature (TEMP,°C/year), mean annual precipitation (PPT, mm/year), PET (mm/year), NPP, AI, TS (°C/year), and PS (mm/year) as predictor variables in this study. TEMP, PPT, TS, and PS were extracted from CHELSA 1.2 (Karger et al., 2017)4 available with mean annual values between year 1979 and 2013. CHELSA data was downloaded at 30 arc-second resolution or approximate 1-km resolution on the side at the equator. CHELSA gives a more realistic climate pattern, especially in mountainous areas, than models based on climate station interpolation alone. PET and AI were downloaded from CGIAR Consortium for Spatial Information (CGIAR-CSI; Antonio and Robert, 2019)5 at 0.5-km resolution on the side of the equator. The data is available with average values between the 1970 and 2000 time periods. Most theoretical studies use NPP as the driving variable, but recent studies use alternative capture of productivity. NPP assembles the net amount of solar energy available to the plant to convert into organic matter through photosynthesis. NPP represents the primary food source of the ecosystem and is measured in units of elemental carbon. NPP was downloaded from the EOSDIS project (Imhoff and Bounoua, 2006)6 downloaded at approximately 900 arc-second resolution or 28 km on a side at the equator available between year 1982 and 1998. Following Rahbek et al. (2007), we calculated productivity integrated over the available area of 100-m elevational bands; therefore, summarized NPP (SNPP) was calculated as the product of area and NPP (SNPP = Area × NPP). For analysis, we used SNPP as a surrogate of NPP. The area coverage of each ecoregion is listed in Supplementary Table 1. The data for all seven environmental variables were extracted from the global dataset in ArcGIS software and processed to yield representative values of each variable at each 100-m elevation band.
Statistical Analysis
Three-step procedures were followed to evaluate the species richness patterns of gymnosperms along elevation gradients in China—(i) determine the species richness of gymnosperms along each ecoregion following the estimation method, (ii) select the best ecoregion based on elevational range and species richness similarities following hierarchical classification, and (iii) select the best variable associated with the species richness patterns of gymnosperms along elevation gradients based on accuracy measure.
First, we used the interpolation technique to estimate species richness of different gymnosperm groups at each elevational band in the respective ecoregions (McCain, 2004). The interpolation method is widely used in overcoming problems of undersampling because it assumes that a species is present between its upper and lower elevation limits (Bhattarai and Vetaas, 2003; Vetaas and Ferrer-Castán, 2008; Kluge et al., 2017; Gao and Liu, 2018). Since each elevation band has a different surface area, we therefore divided the number of species by the area of each band representing the species richness that was used for subsequent analyses. We assessed the elevational pattern of species richness for each studied gymnosperm group (all species, threatened, endemic, tree, and shrub species) by polynomial regression. The best-fit model was selected based on high R2 values (coefficient of determination). The land area coverage of each elevation band varied from one another and in ecoregion. Previous studies have shown that the variation in land area cover is significant in determining the richness patterns in any region (Rosenzweig, 1995). The mountains are in conical shape, where the surface area decreases with increase in elevation. The variation in surface area also influences the species richness. Moreover, the area at each elevation also provides a reasonable size for the gene pool (Körner, 2003). Therefore, to avoid bias due to area, following Gao and Liu (2018), the species richness in each elevation band was divided by the area of respective intervals prior to analyses.
Secondly, to understand the composition of variation of gymnosperm species richness along elevation gradients in the ecoregions of China, we analyzed the floristic similarities between ecoregions based on hierarchical classification using dendrogram clustering (Gauch and Whittaker, 1981). The analysis helps to group similar ecoregions based on predictor and response variables using Euclidean distance values. The ecoregions having similar climatic conditions and species resemblance share the same clade in a group, and hence identical factors will be responsible for explaining the species richness patterns. Further, we selected one ecoregion from each group based on the highest species richness and most extended elevation gradients among the group (Supplementary Figure 1). Based on the preliminary result, Eco 12 (East-Manchurian region), Eco 19 (Central China-Loess plateau), Eco 20 (Qilian mountain region), Eco 22 (Tibetan plateau), Eco 27 (Hengduan–Qionglai mountain region), Eco 33 (South China region), and Eco 34 (Taiwan) were selected for further analysis to determine the species richness patterns of gymnosperms. This analysis was performed in IBM SPSS Statistics software (V 21.0).
Third, a univariate generalized additive model (GAM) was used to formally determine the explained deviance of each environmental variable on gymnosperm species richness (Vetaas and Grytnes, 2002; Bhattarai et al., 2004). GAM was used because it is a semi-parametric approach that permits data to determine the shape of the response curve by applying smooth spline, allowing the exploration of shapes of species response curves to environmental gradients (Hastie and Tibshirani, 1990). Therefore, this statistical model was fitted in better agreement with ecological data and has been extensively used in determining the species-climate relationship along elevation (Vetaas and Grytnes, 2002; Bhattarai and Vetaas, 2003; Bhattarai et al., 2004; Vetaas and Ferrer-Castán, 2008; Paudel et al., 2018). Additionally, we performed multivariate GAM to evaluate the best-supported model following the variable selection approach. The best model was selected based on the least Akaike’s information criterion (AIC) value and the highest percentage of deviance explained. Additionally, we used path analyses to evaluate the potential causal relationship between species richness and environmental variables. Structural equation modeling (SEM) uses regression and path analyses for the significance of the overall model structure that is suitable to evaluate the species–climate relationship (Grace and Pugesek, 1997; Grace, 2006). As all predictor variables potentially mediate the species richness pattern, we tested the effect of individual variables and all the variables together on species richness of gymnosperms (Grace and Pugesek, 1997; Grace, 2006). Moreover, SEM is also applicable to examine the performance of GAM (Panda et al., 2017). SEM models were derived for species richness of all studied response variables and plotted them in figures. Colors were assigned to distinguish between predictor and response variables, positive/negative response of predictor variable to the response variable. GAMs were performed in “mgcv” while SEM with “lavaan” library in R v4.0.1 (R Development Core Team, 2017).
Results
Gymnosperms’ Distribution Along Elevation Gradients
We recorded 237 taxa of gymnosperms in China distributed between 0 and 5,300 m showing two distinct peaks of species richness along the elevation. All species richness formed a hump-shaped pattern (R2 = 0.942, p < 0.005), and the highest species numbers were recorded at 1,600 m (n = 111) and 2,800 m (n = 104) (Figure 2A). There were 219 species (92.4%) of threatened gymnosperms distributed between 0 and 5,100 m a.s.l. Threatened species distribution was distinctly unimodal (R2 = 0.88, p < 0.005), where the highest number of species was found at the 1,800-m (n = 105) and 2,800-m (n = 94) elevation bands (Figure 2A). Endemic species accounts for 47.25% (112) of the total gymnosperms of China and formed a unimodal distribution pattern (R2 = 0.942, p < 0.005). They were distributed between 0 and 5,100 m a.s.l., where the highest species were recorded at 1,800 m (n = 51) and 2,700 m (n = 56) (Figure 2A). Based on life form, 189 tree species of gymnosperms (79.74% of total species) were distributed between 0 and 4,900 m, peaked at 1,800 m (n = 89) elevation band (R2 = 0.88, p < 0.005) (Figure 2A). On the other hand, 48 species of a shrub (20.25% of total species) were distributed between 0 and 5,300 m. Initially, shrub richness increases from 0 to 1,600 m a.s.l. and then forms a plateau between 1,600 and 3,600 m a.s.l., above which the number of shrub species declined (R2 = 0.893, p < 0.005) (Figure 2A). With increasing elevation, gymnosperm species showed variation in the proportion of species composition (Figure 2B). The ratio of threatened and tree species for all species of gymnosperm decreases with increasing elevation. On the other hand, the proportion of endemic species showed a gradual increase up to 4,500 m a.s.l. and an abrupt decrease, while the proportion of shrub showed an increasing trend (Figure 2B).
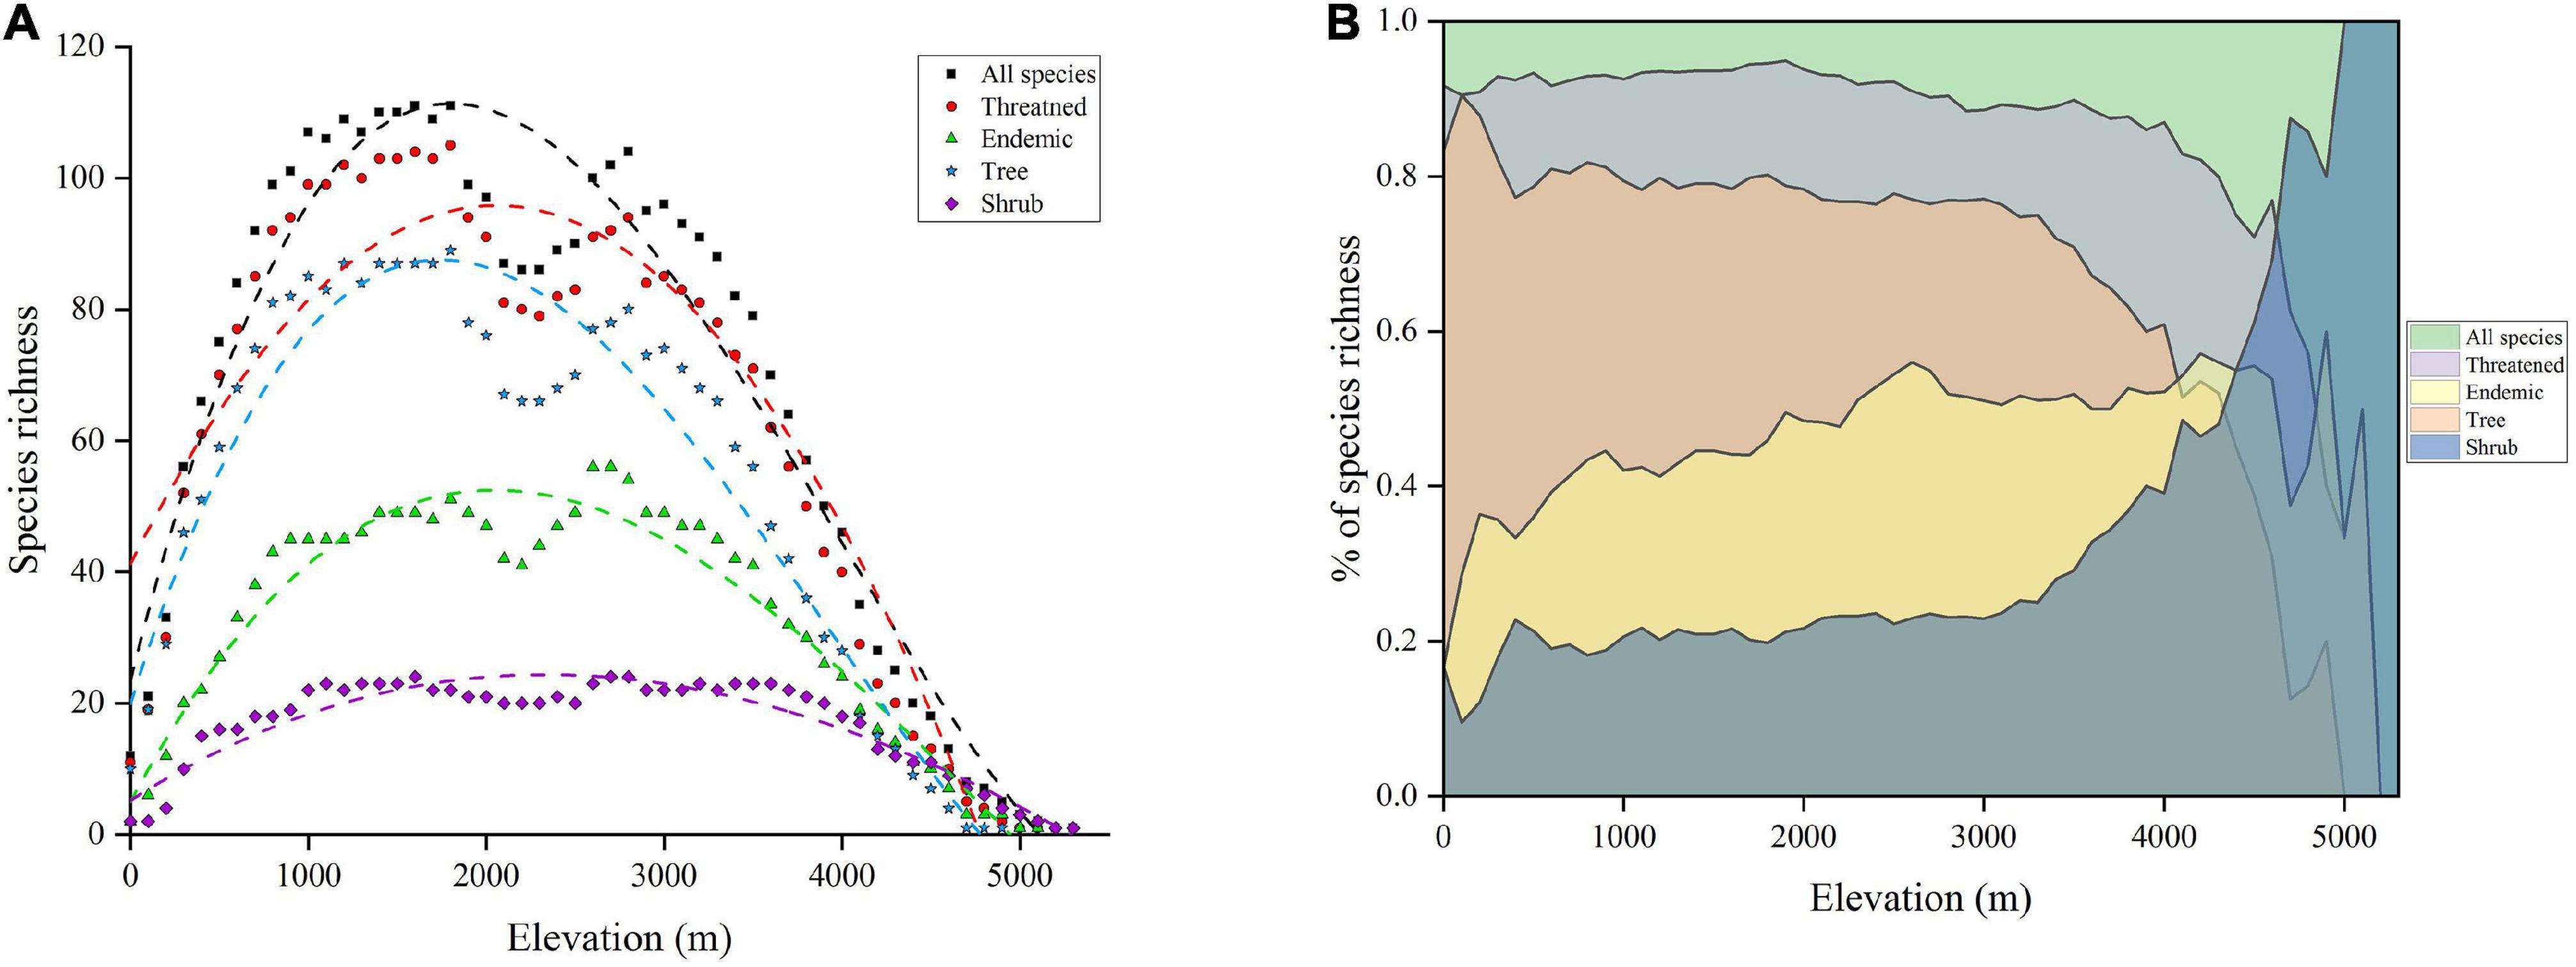
Figure 2. (A) Elevational pattern of species richness of gymnosperms in China. The dash lines indicate the best fit model of polynomial regression. (B) The proportion of different subgroups concerning total gymnosperm species.
Distribution of Gymnosperms Along Ecoregions
It is apparent from Figure 3 and Supplementary Table 1 that the ecoregion in the south of China is undoubtedly rich in the distribution of gymnosperms along elevation gradients. The southwestern regions, in particular, have the highest species richness and elevation gradients as well. The highest number of all species (n = 113), endemic (n = 65), tree (n = 105), and shrub (n = 65) were reported from Eco 27, whereas Eco 32 accounts for the highest number of threatened species (n = 89).
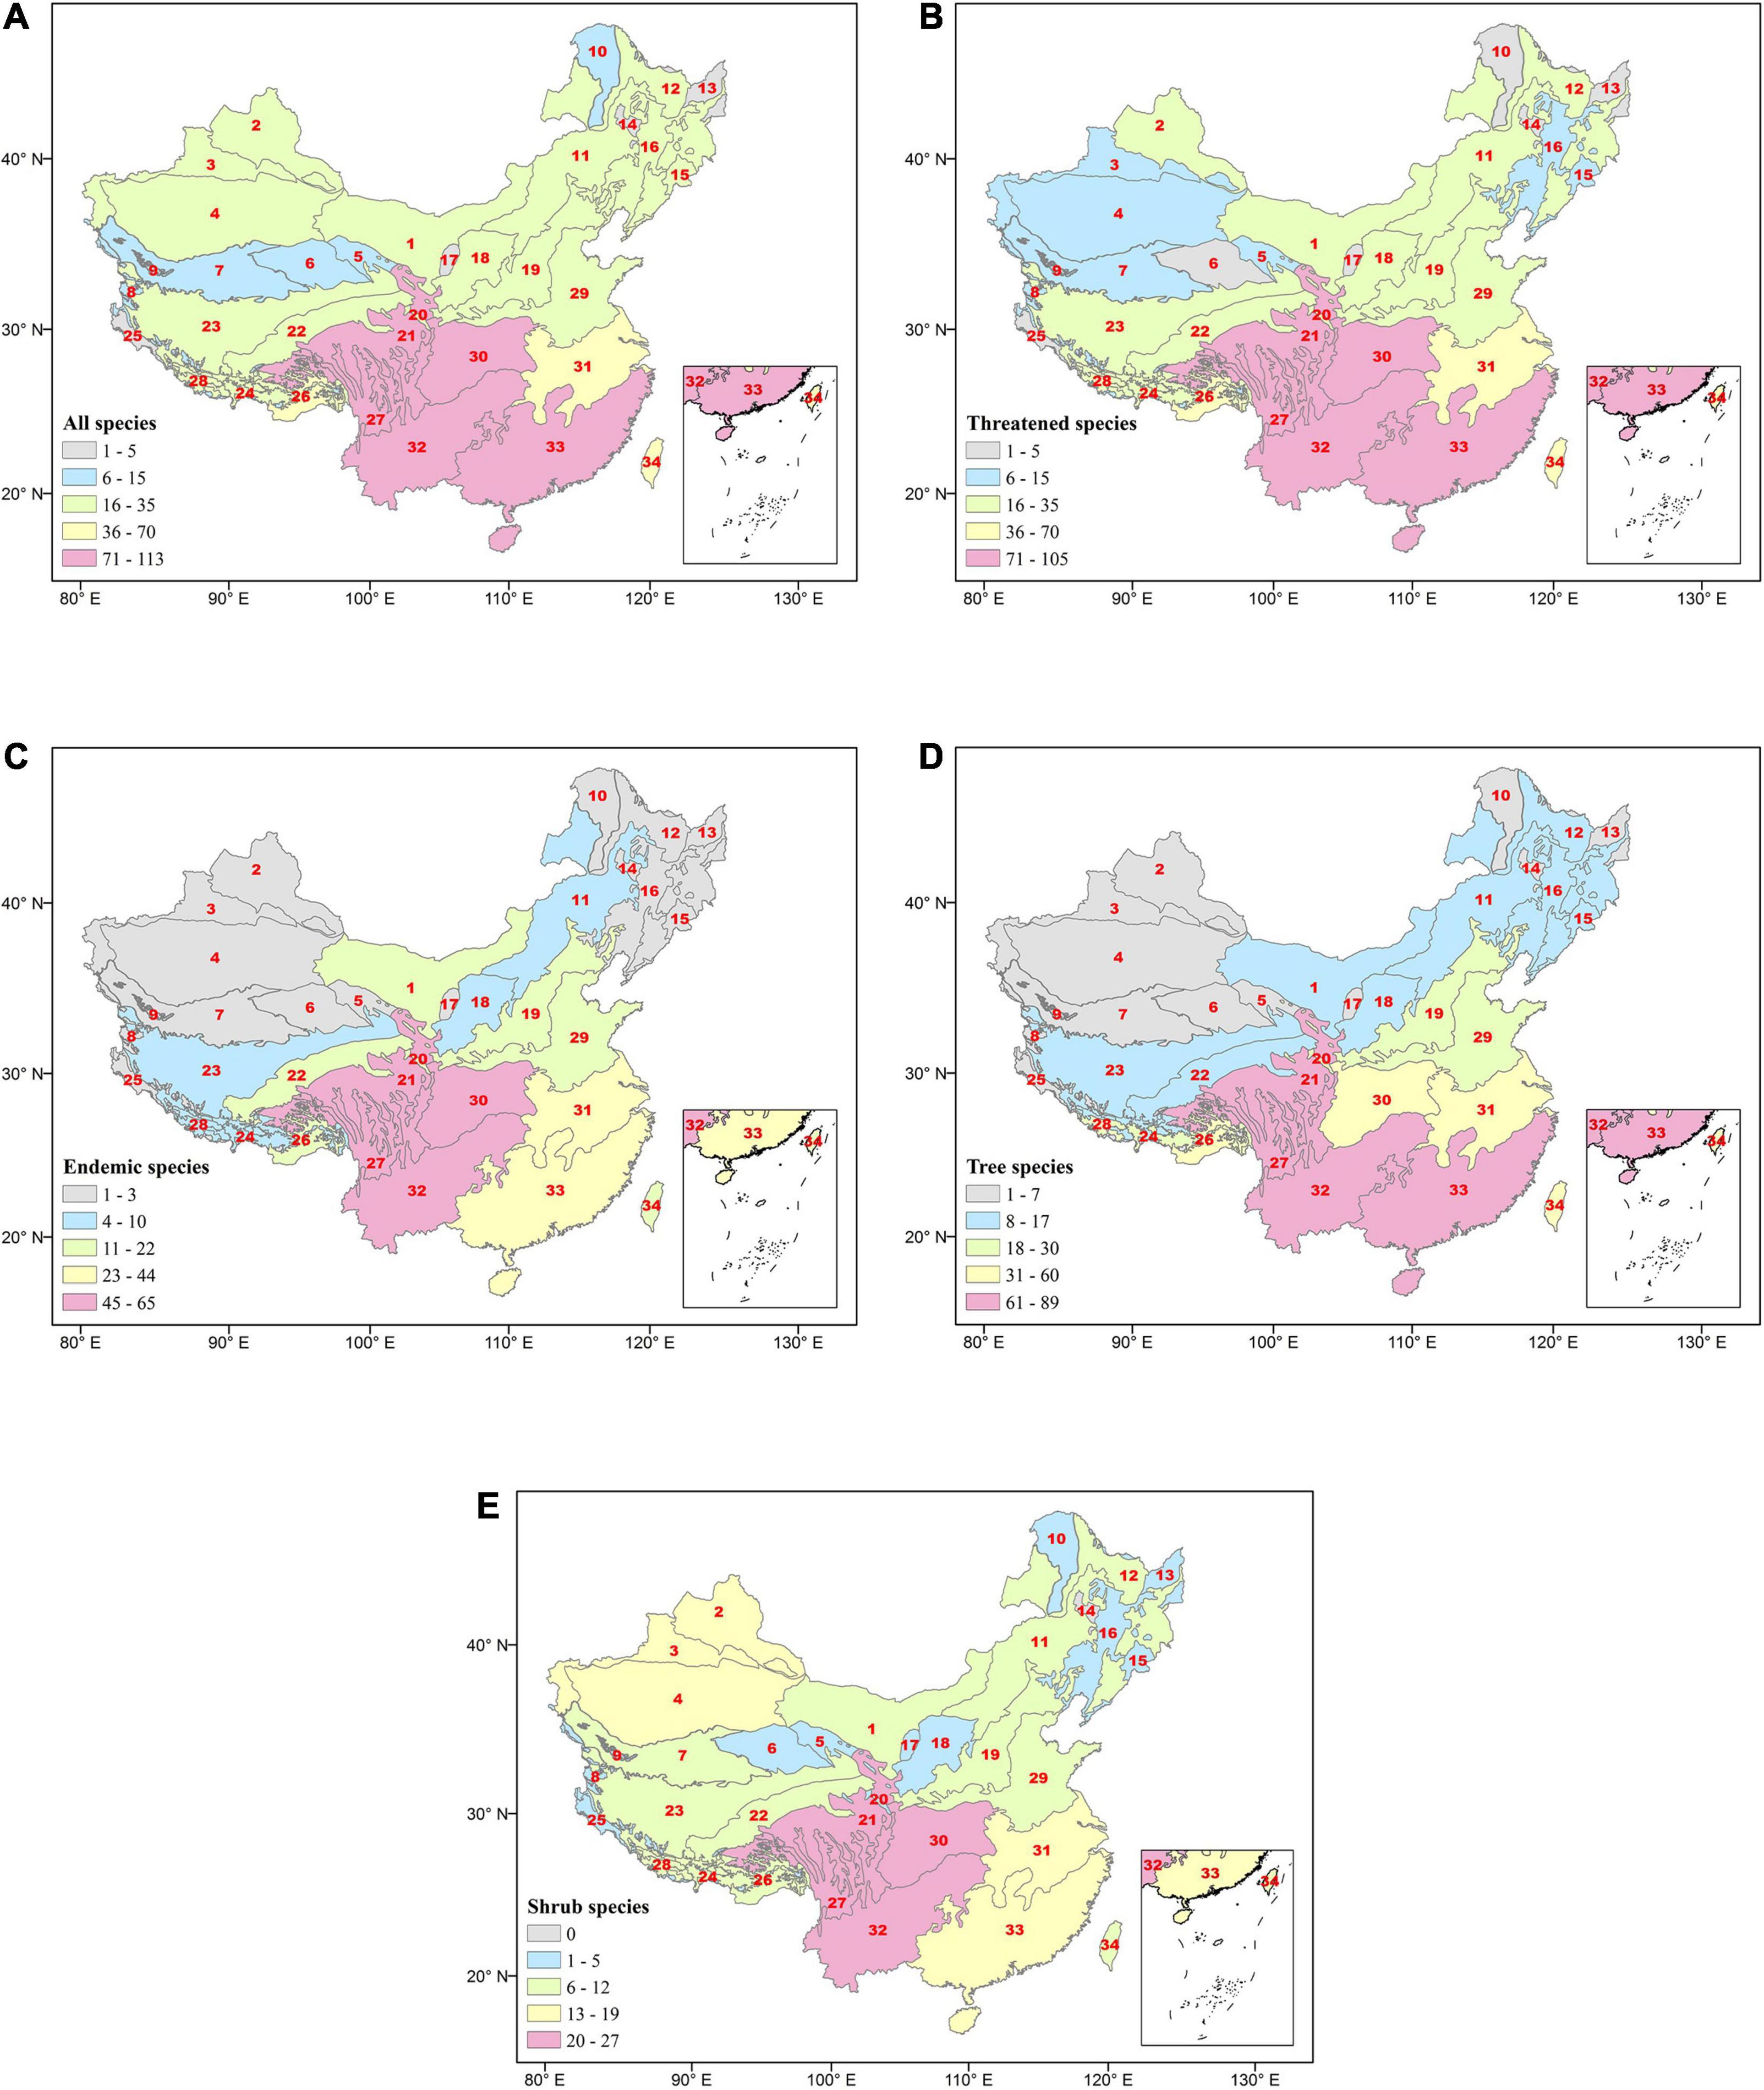
Figure 3. Species distribution of gymnosperms along ecoregions—(A) all species, (B) threatened, (C) endemic, (D) tree, and (E) shrub species. The numbers in the red color indicate the ecoregion designation number referred to Figure 1.
A monotonic increase in species richness was noticed in Eco 12 (Figure 4A) and Eco 19 (Figure 4B), whereas Eco 20 (Figure 4C) and Eco 22 (Figure 4D) showed a monotonic decrease in richness pattern. On the other hand, in Eco 27 (Figure 4E), Eco 33 (Figure 4F), and Eco 34 (Figure 4G), distinct unimodal distribution patterns of species richness were reported. The elevation ranges of Eco 12, 19, 20, 22, 27, 33, and 34 were 0–1,700, 0–3,100, 1,400–4,900, 1,800–above 5,300, 300–above 5,300, 0–2,600, and 0–4,000 m.a.s.l., respectively (Figure 4 and Supplementary Table 1). A total of 19, 32, 26, 23, 113, 87, and 47 species of gymnosperms were recorded in Eco 12, 19, 20, 22, 27, 33, and 34, respectively (Supplementary Table 1). Numbers of threatened, endemic, tree, and shrub species also differ according to the ecoregions (Supplementary Table 1). It is noteworthy that only one endemic species was reported from Eco 12 and of 26 gymnosperm species in Eco 20, 25 species are listed in threatened categories of the IUCN Red List. The species richness peak varies according to ecoregion (Figure 4). The distribution of all species was high at 700 m in Eco 12 (n = 16), 1,600 m in Eco 19 (n = 25), 2,600 m in Eco 20 (n = 23), 2,600 m in Eco 22 (n = 21), 2,700 m in Eco 27 (n = 70), 1,000 m in Eco 33 (n = 62), and 1,000 m in Eco 34 (n = 31) (Figure 4). Similar trends of richness peaks were noticed in other studied response variables as well (Figure 4).
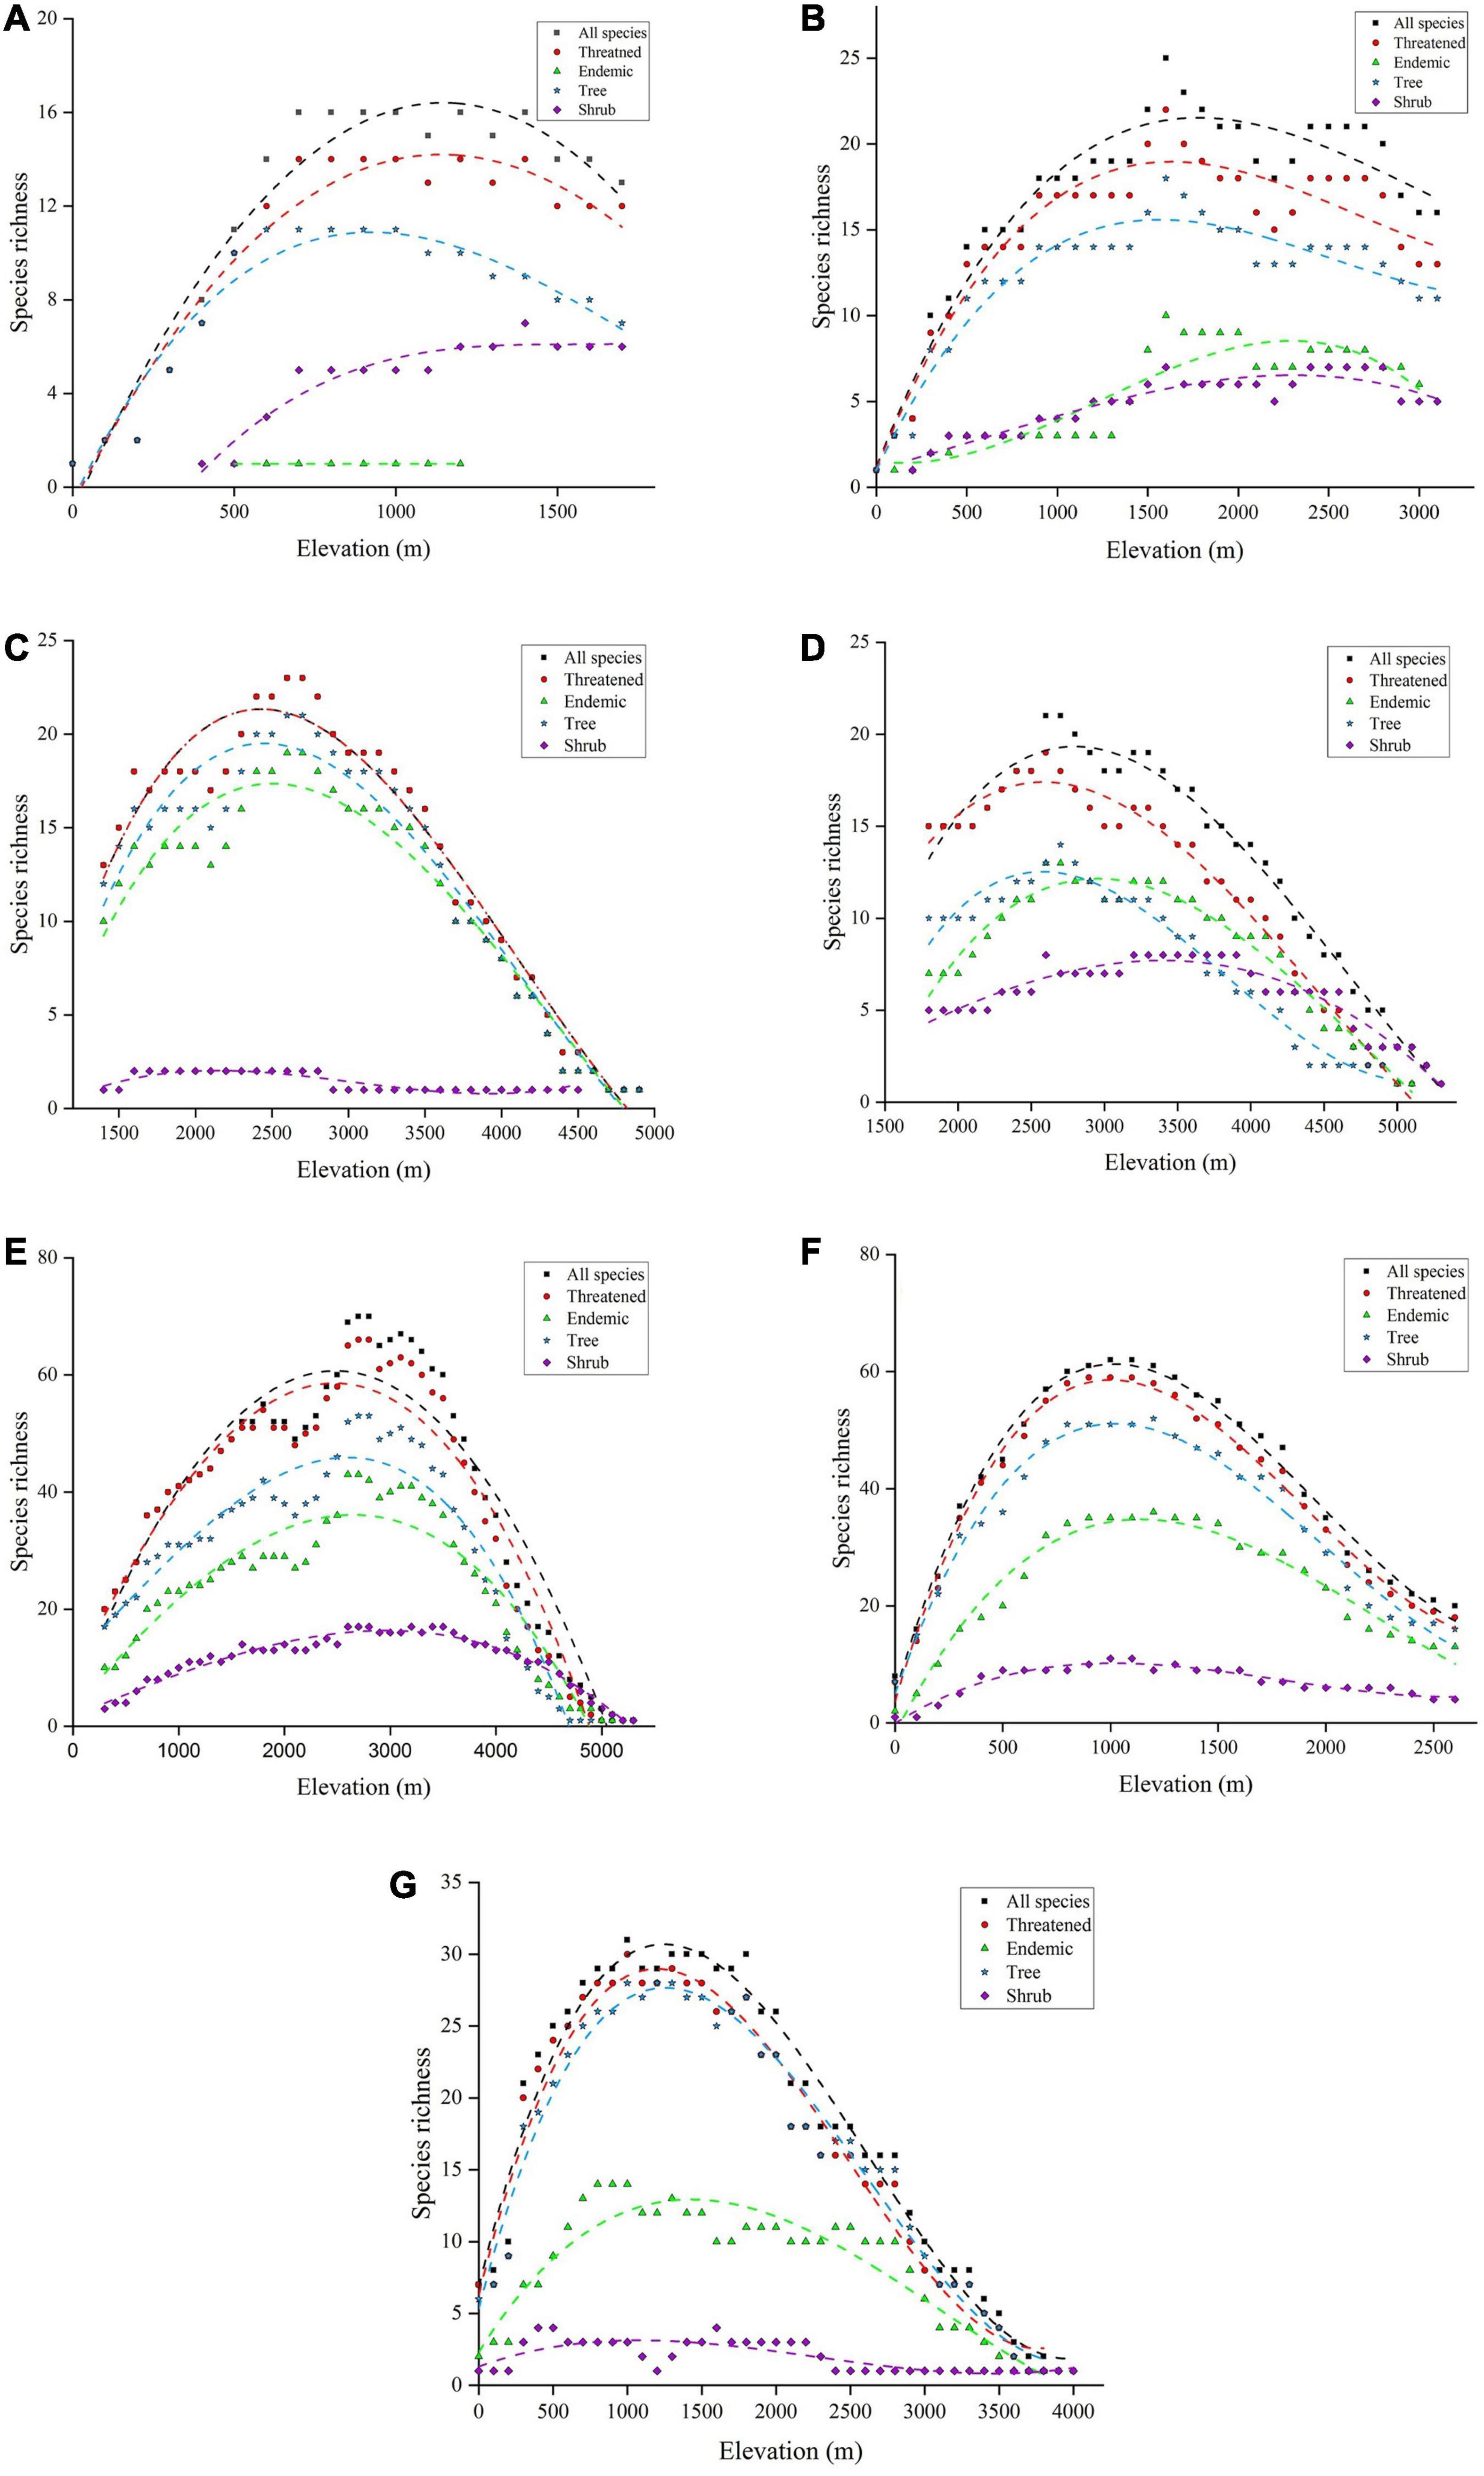
Figure 4. Gymnosperm distribution patterns along elevation gradients in ecoregions of China—(A) Eco 12 (East–Manchurian region), (B) Eco 19 (Central China–Loess plateau), (C) Eco 20 (Qilian mountain region), (D) Eco 22 (Tibetan Plateau), (E) Eco 27 (Hengduan–Qionglai mountain region), (F) Eco 33 (South China region), and (G) Eco 34 (Taiwan).
Relationship Between Gymnosperms Richness and the Environmental Variables
Bivariate GAM analyses between gymnosperm richness (all species, threatened, endemic, tree, and shrub species) and seven environmental factors are shown in Table 1. The results showed a significant relationship between species richness and environmental variables in all ecoregions (Table 2 and Figure 5). TS significantly explained the highest deviance in richness pattern of gymnosperms in the East-Manchurian region (Eco 12) (Table 1). PS and TEMP have profound effects on the richness pattern of gymnosperms in the Central China–Loess plateau (Eco 19). On the other hand, TS and PS significantly explained the highest deviance in richness pattern of gymnosperms in Tibetan Plateau (Eco 22), Qilian mountain region (Eco 20), and South China region (Eco 33). Similarly, the effect of TS on threatened and tree species of gymnosperms in the Hengduan–Qionglai mountain region (Eco 27) was high. SNPP explained the highest deviance in richness pattern of gymnosperms in Taiwan (Eco 34) of China (Table 1). Similarly, multivariate GAM explained 65.2–83.5%, 68.6–88.5%, 76.3–89.1%, 65.1–93.2%, 56.2–89.3%, 63.5–76.0%, and 58.2–78.7% deviance in richness pattern of gymnosperms in Eco 12, 19, 20, 22, 27, 33, and 34, respectively (Table 2). Additionally, SEM results showed that environmental variables significantly explained 69–77%, 69–83%, 77–90%, 73–88%, 84–87%, 70–77%, and 42–69% variations in species richness of gymnosperms in Eco 12, 19, 20, 22, 27, 33, and 34 of China, respectively (Figure 5).
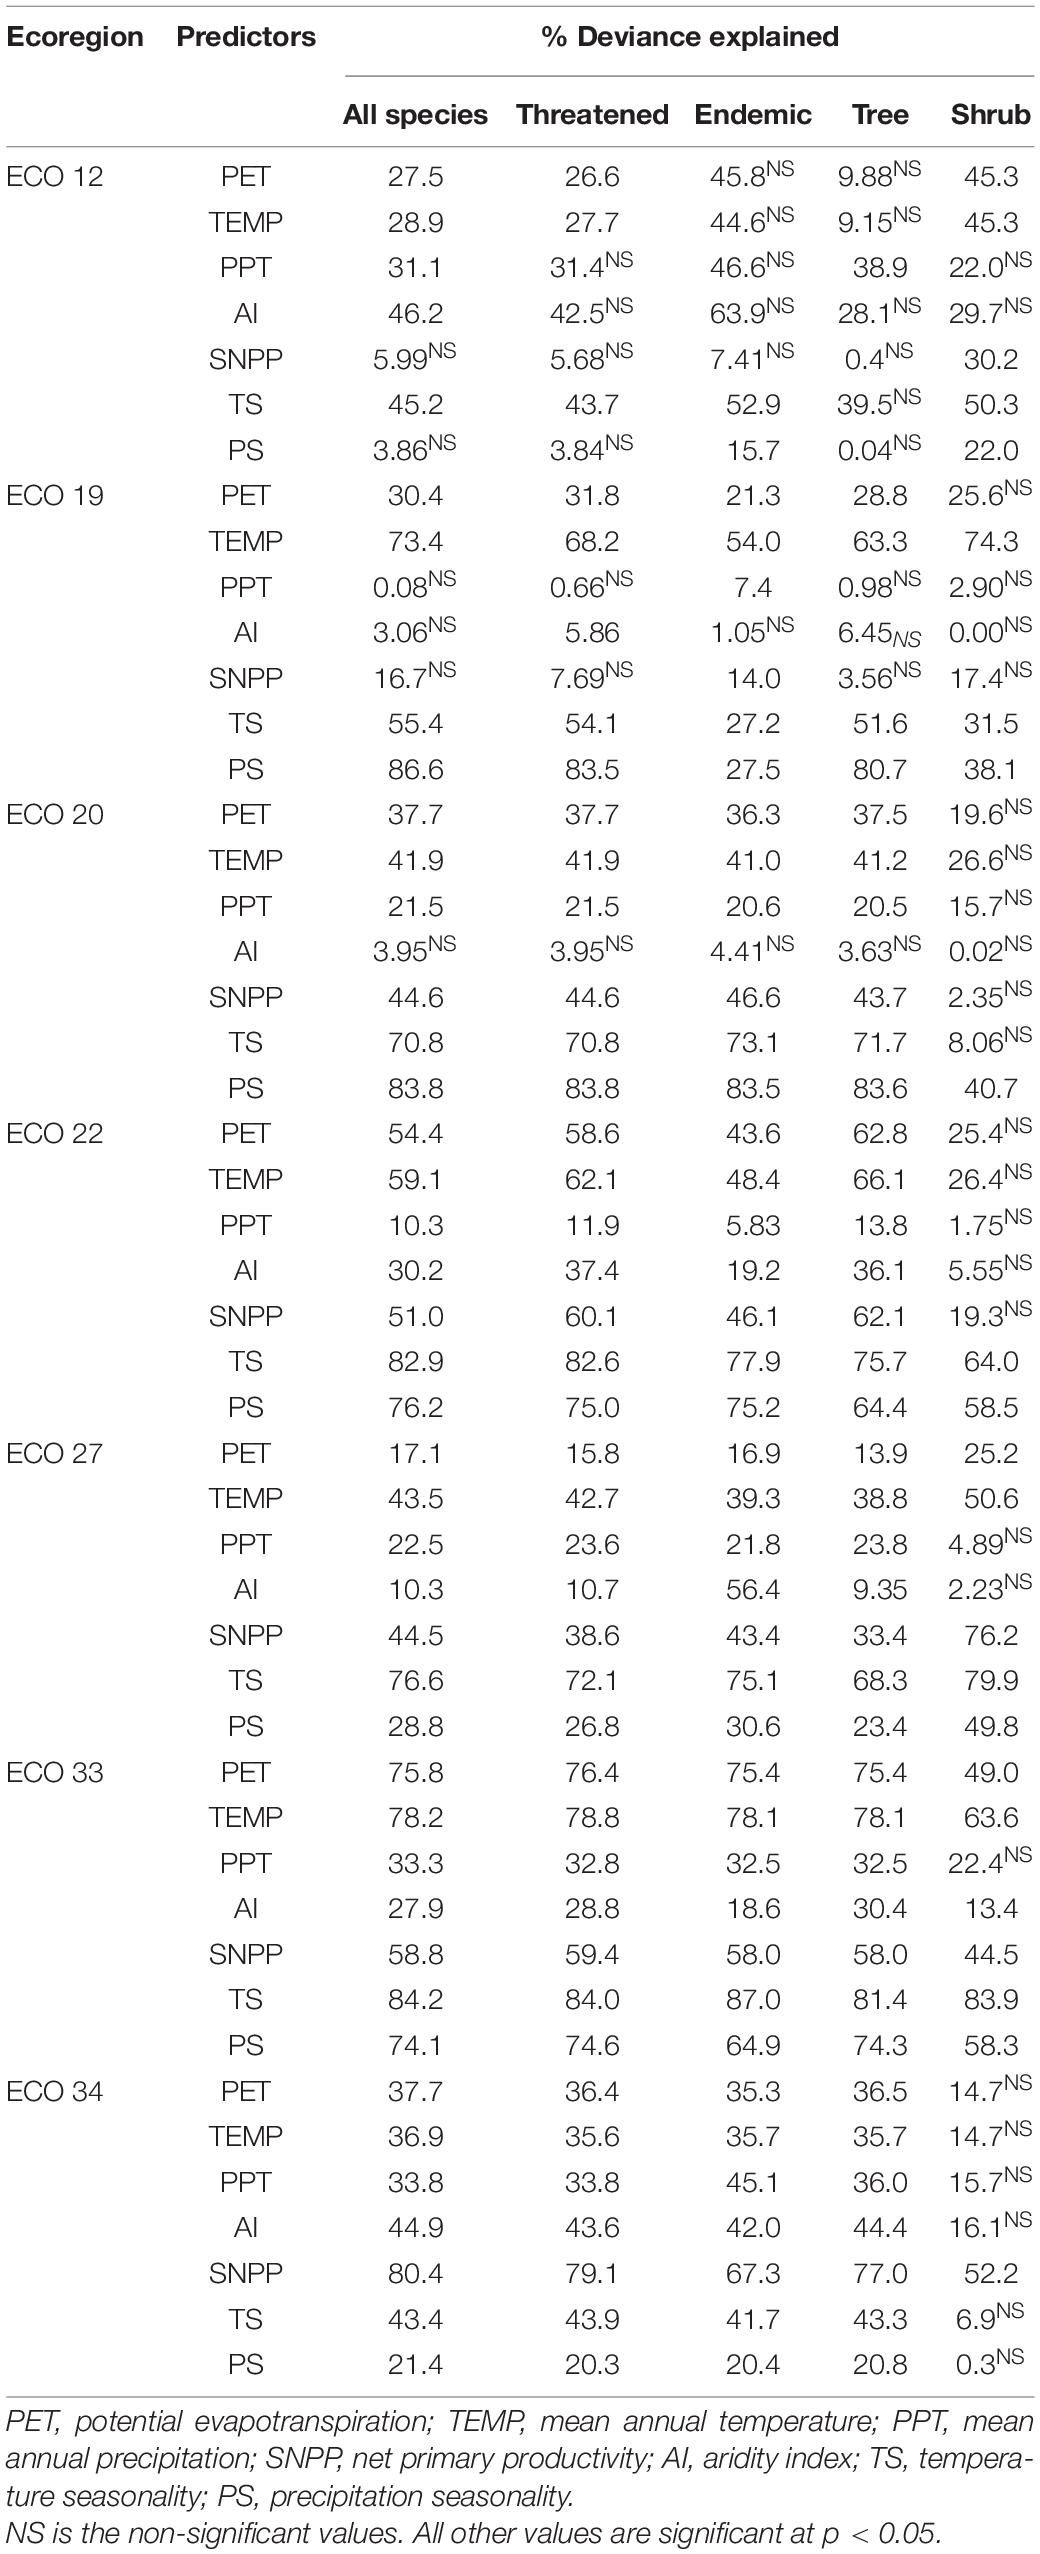
Table 1. Percentage of deviance explained by individual predictors for the species richness patterns of all gymnosperm species, threatened, endemic, tree, and shrub in ecoregions of China evaluated by the generalized additive model (GAM).
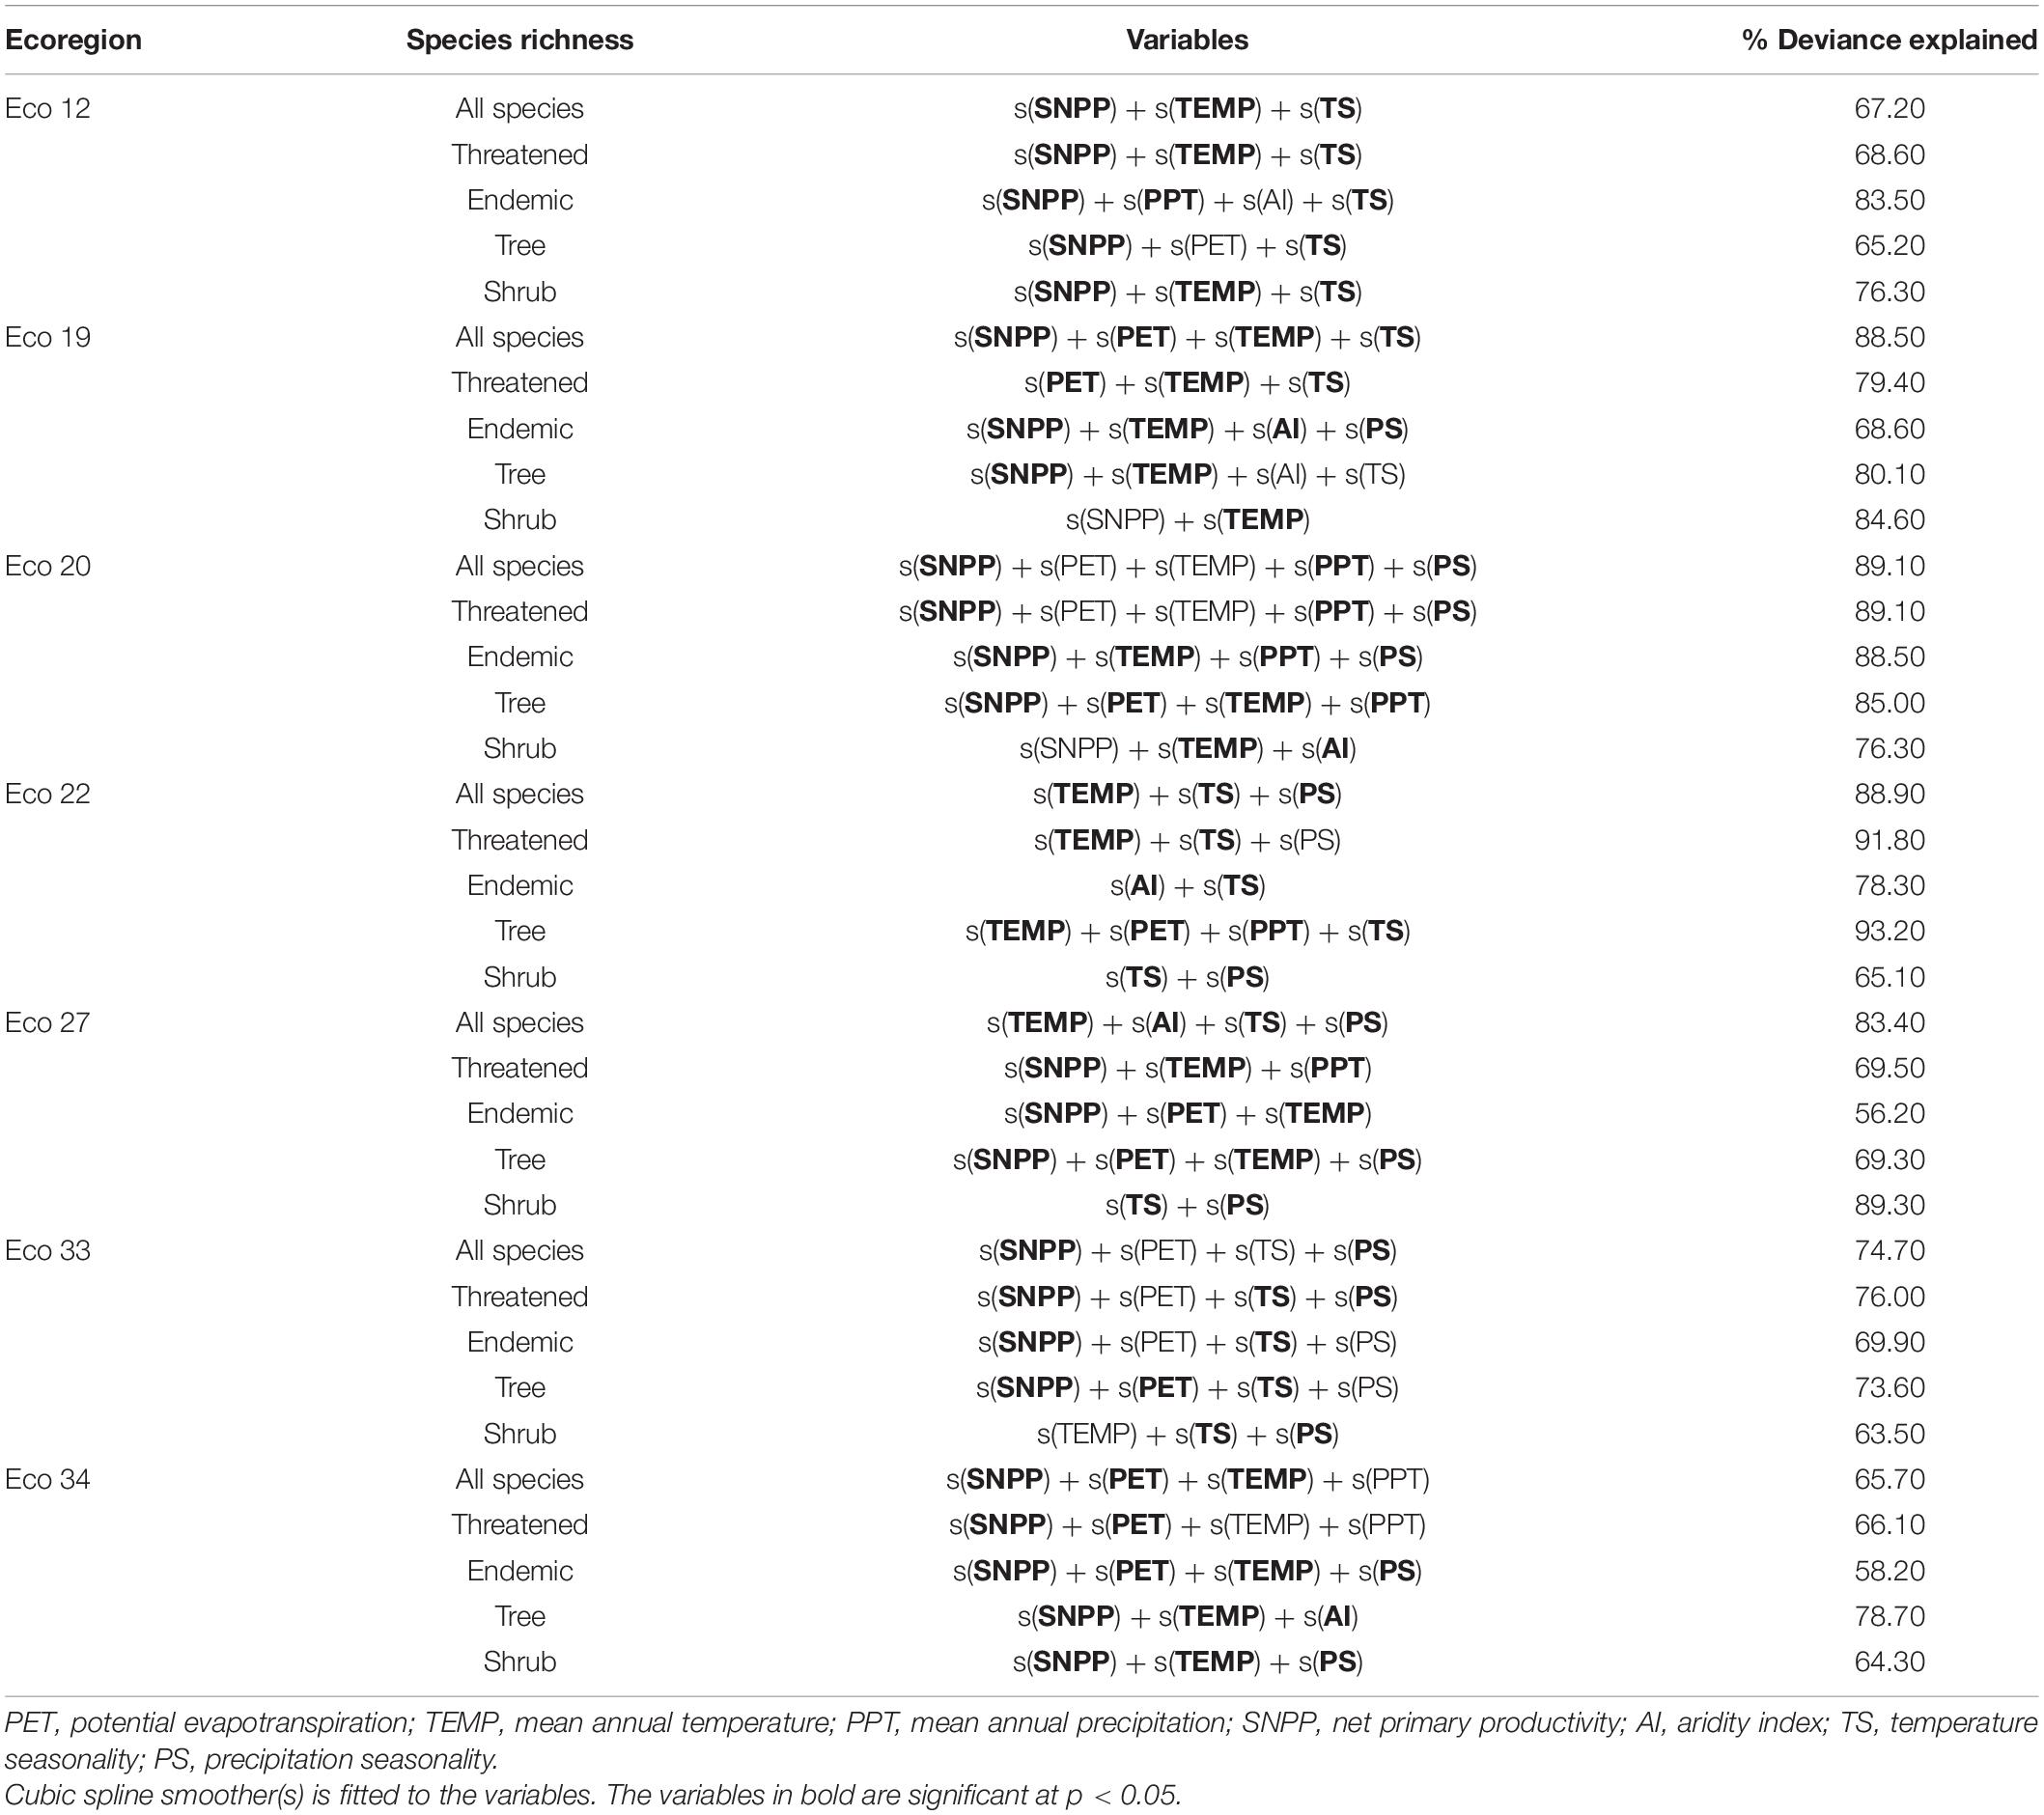
Table 2. Percentage of deviance explained by the multivariate generalized additive model (GAM) and the best model that determine the richness patterns of gymnosperms in an ecoregion of China.
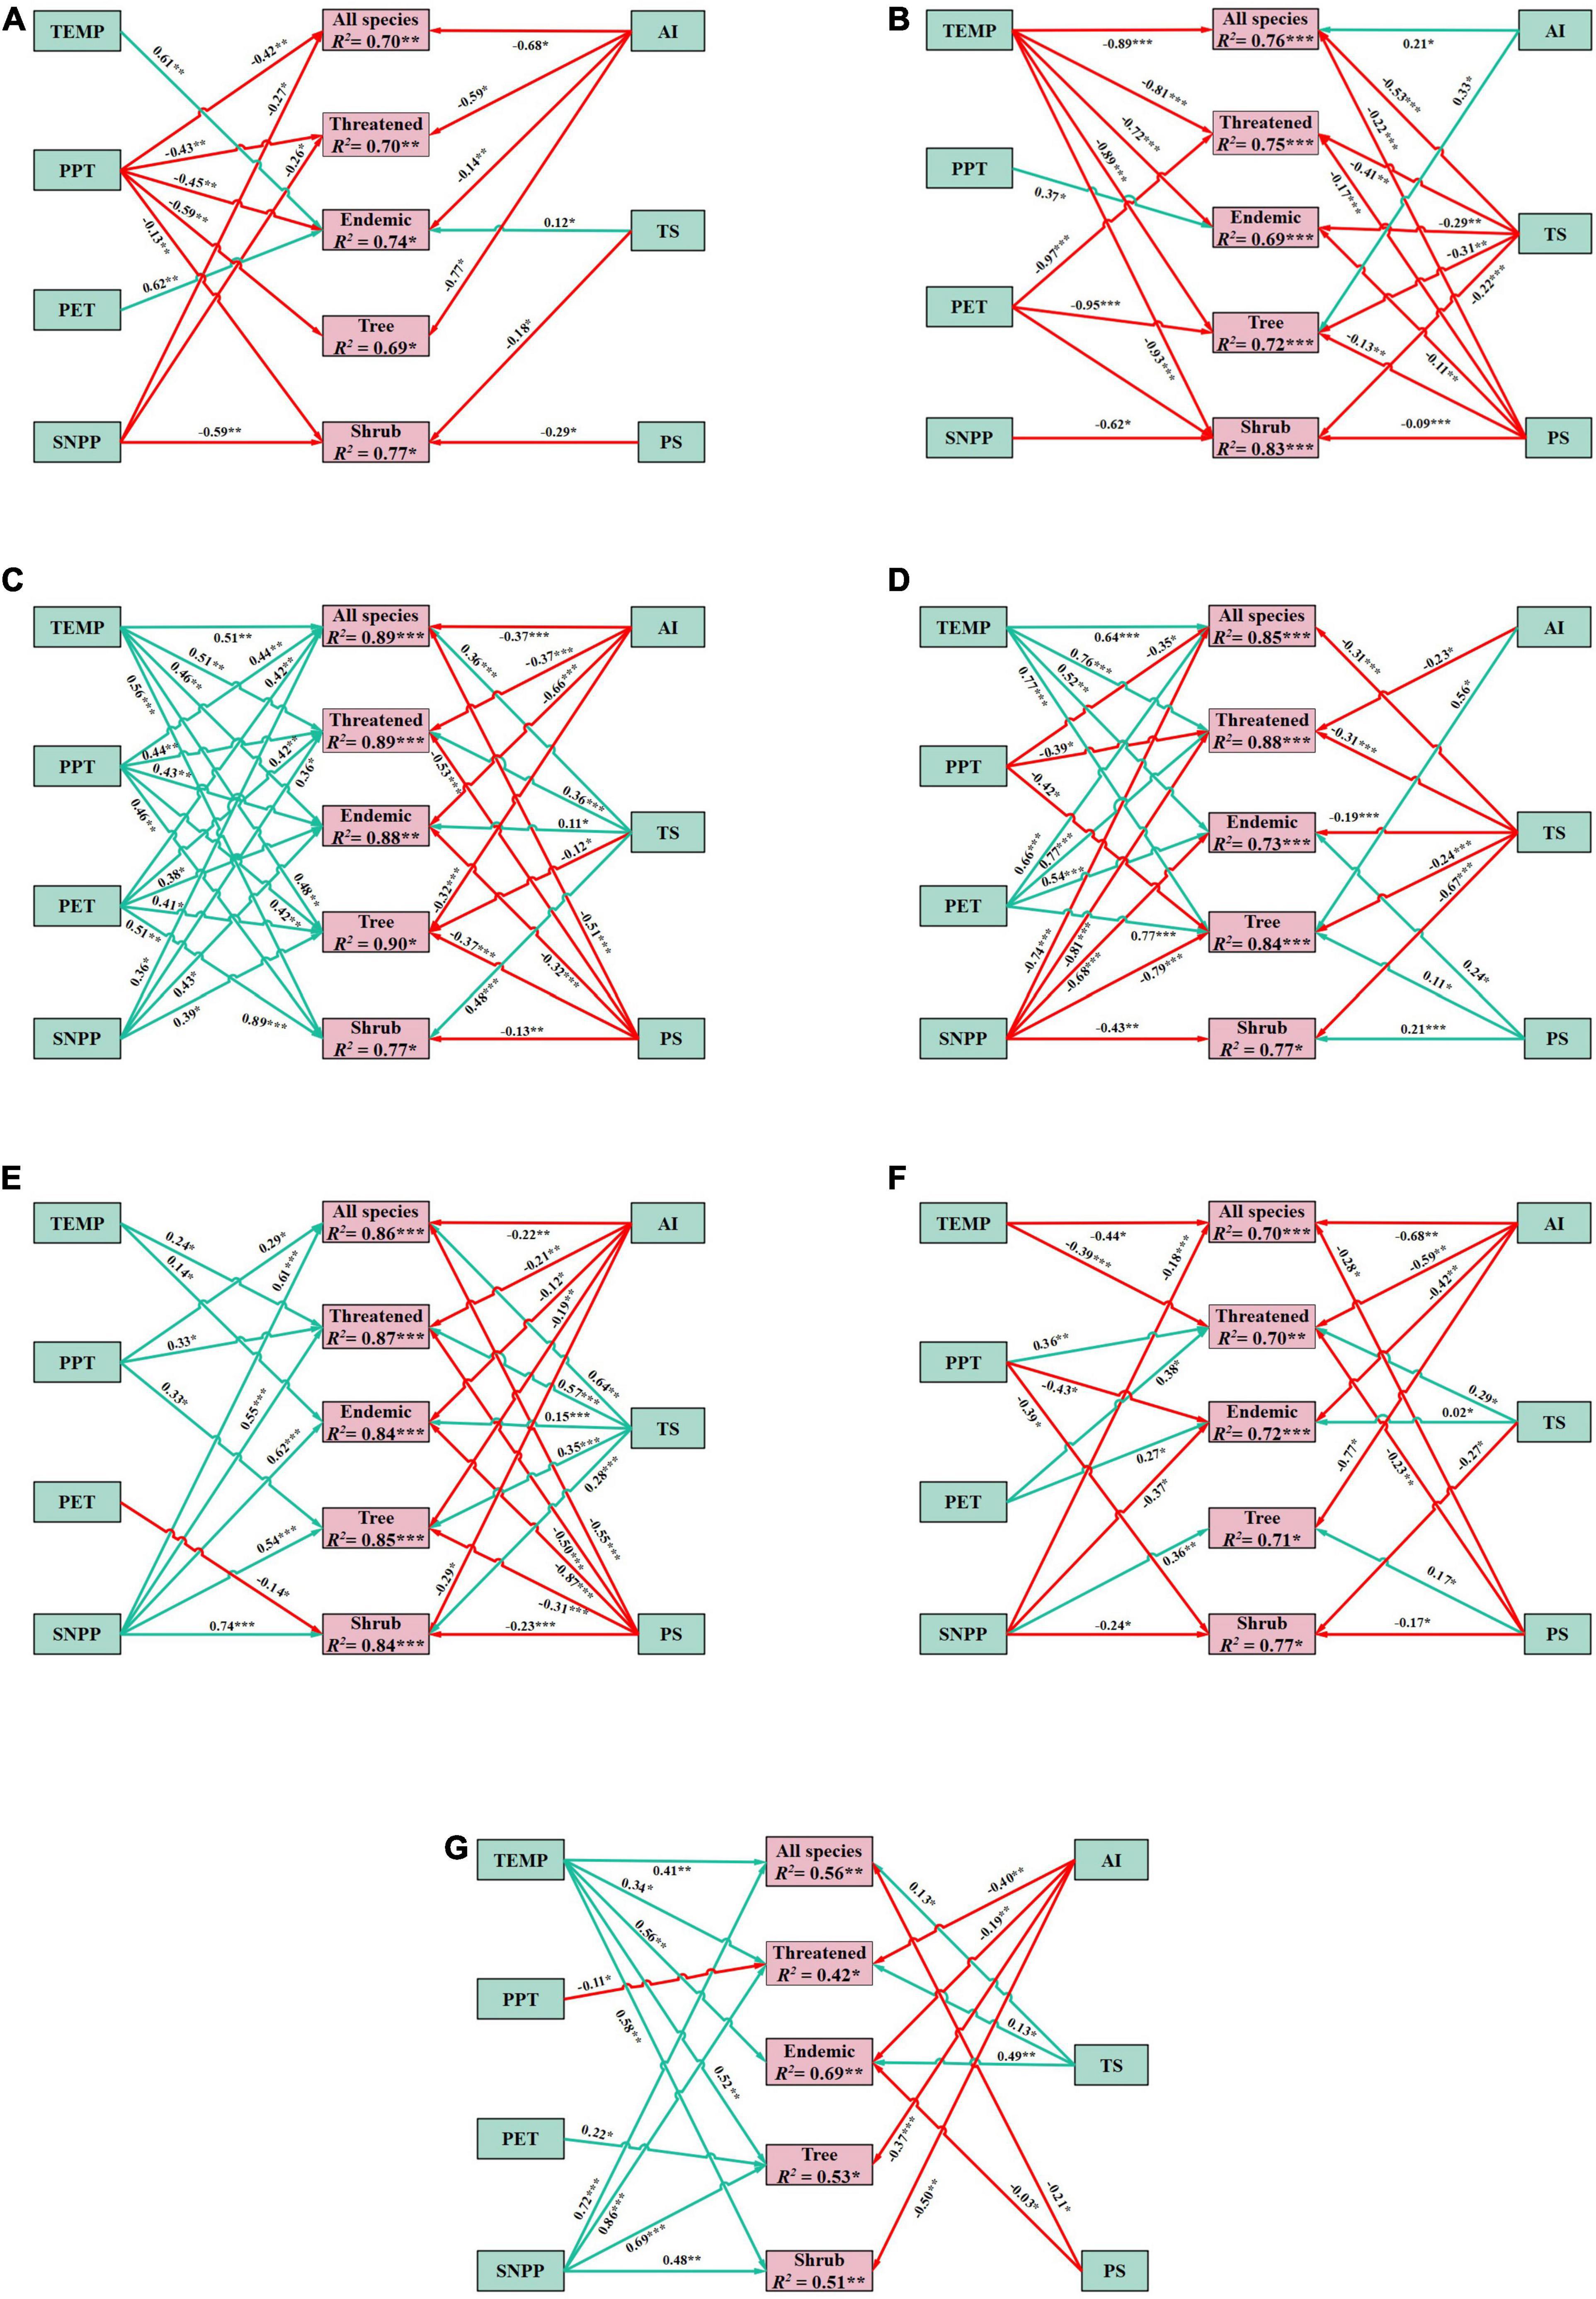
Figure 5. Structural equation model (SEM) examining the influence of potential evapotranspiration (PET), mean annual temperature (TEMP), annual precipitation (PPT), net primary productivity (SNPP), aridity index (AI), temperature seasonality (TS), and precipitation seasonality (PS) on species richness of gymnosperms in ecoregions of China—(A) Eco 12, (B) Eco 19, (C) Eco 20, (D) Eco 22, (E) Eco 27, (F) Eco 33, and (G) Eco 34. The colors of the arrow represent positive (green) and negative (red) relationship; the number in the arrow denotes the standardized partial regression coefficients. Only significant variables were used in the figure. Significance: *p < 0.05; **p < 0.005; ***p < 0.001.
Discussion
Species Richness Pattern
Distribution of Gymnosperms Along Elevation Gradients
The patterns of all studied forms of gymnosperm species richness in response to elevation gradients in China were consistent, showing a unimodal distribution pattern. However, the different forms (threatened, endemic, trees, and shrub species) of gymnosperm species showed discernible richness across elevational bands (Figure 2A). A common phenomenon in the distribution of plant species along elevation gradients is the hump-shaped pattern. Analogous to our findings, similar richness patterns of plant distribution were reported in the previous studies conducted in the mountainous regions of China and the world (Rahbek, 1995; Vetaas and Grytnes, 2002; Bhattarai and Vetaas, 2003; Bhattarai et al., 2004; Vetaas and Ferrer-Castán, 2008; Sang, 2009; Meng et al., 2012; Dorji et al., 2014; Kluge et al., 2017; Liu et al., 2017; Liu and El-Kassaby, 2018; Geng et al., 2019; Subedi et al., 2019; Vetaas et al., 2019; Pandey et al., 2020b). The study showed two peaks of gymnosperm richness at 1,600 and 2,800 m a.s.l. for all studied groups (Figure 2A). This pattern is unique and has not been reported before. The possible explanation might be (i) the biotic homogenization at the specific elevation ranges between 1,600 and 2,800 m a.s.l. because of propagation of exotic and opportunist species and (ii) possible distribution of other plant species at the specific elevation range might inhibit the distribution of gymnosperms. Our study found that the highest richness of threatened gymnosperms was noticed at 1,800 m and increased at a mid-elevation gradient. Our findings were different from the previous research conducted in the Himalayan region. The distribution of threatened plants was high at the low elevational band showing monotonic decline with increasing elevation (Paudel et al., 2018). It is noteworthy that high endemic species were found between 2,700- and 2,800-m elevation bands and formed a unimodal distribution pattern. Similar patterns were observed in the Himalayan region (Vetaas and Grytnes, 2002). However, the peak in endemic species was noticed between 3,500 and 4,500 m a.s.l. (Vetaas and Grytnes, 2002). Percentage compositions of tree and shrub species to all species of gymnosperms showed an opposite trend. The proportion of tree species decreases with increasing elevation, while that of shrub species rises. Studies that test elevational patterns of different life forms (tree and shrubs) also found divergent trends between the life forms (Vetaas and Grytnes, 2002; Bhattarai and Vetaas, 2003).
Distribution of Gymnosperms Along Ecoregions
Three distinct patterns of gymnosperm richness along elevational gradients in ecoregions were noticed: linear increase (Eco 12 and 19), linear decrease (Eco 20 and 22), and unimodal distribution pattern (Eco 27, 33, and 34). The pattern of species richness is also determined by the range of elevation in each ecoregion (Vetaas and Grytnes, 2002). The ranges of distribution of Eco 12 and 19 were from 0 to 1,700 m and from 0 to 3,100 m, respectively, implying a limited range distribution, therefore forming a linear pattern. On the other hand, the lowest range distributions of Eco 20 and 22 are 1,400 and 1,800 m, respectively, and extend to the tree line, indicating the absence of low range species distribution. However, the longest elevational range of Eco 27, 33, and 34 provided a suitable habitat for species distribution and helped in the formation of the most common pattern of species richness in the mountainous regions of China. In general, our results were consistent with previous studies that the southwestern and Taiwan regions of China are rich in the distribution of plant species at various degrees (Vetaas and Grytnes, 2002; Meng et al., 2012; Gao et al., 2017; Liu et al., 2017; Shrestha et al., 2017; Geng et al., 2019; Liao et al., 2020; Pandey et al., 2020a). Our study also showed that the East Manchurian region (Eco12), Central China – Loess plateau (Eco 19), Qilian mountain region (Eco 20), Tibetan plateau (Eco 22), Hengduan – Qionglai mountain region (Eco 27), South China region (Eco 33), and Taiwan (Eco 34) are important areas of gymnosperms distribution in China. Eco 12 comprises of Heilongjiang province in the extreme northeast, whereas Beijing, Hebei, part of Shanxi and Shaanxi province, in the central region are in Eco 19. On the other hand, Eco 20, 22 and 27 covers Gansu, Sichuan, Chongqing Municipality and Tibet Autonomous Region in the southwest region. Eco 33 comprises a part of Zhejiang, Jiangxi, Fujian, Guangxi, Guangdong, Hainan, Hong Kong, and Macao in the southern region while, Eco 34 includes the entire Taiwan region of China.
The southwestern region is highly significant in terms of plant species diversity featuring a high number of species and a high level of endemism (Wu and Raven, 1999; Ying et al., 2004; Li et al., 2009). This area includes important mountainous regions, the Tibetan Plateau, the Hengduan Mountains, and the Qinling Daba Mountains which are considered the cradle of plant diversity, including gymnosperms (Li and Feng, 2015; Liao et al., 2020; Pandey et al., 2020a). The rich diversity of plant species in the mountainous region has previously been studied testing EDG (Wang et al., 2007; Zhang et al., 2009; Dorji et al., 2014; Liu et al., 2014; Chai and Wang, 2016; Yang et al., 2017; Liu and El-Kassaby, 2018). The diversified topography, hydrothermal conditions, subtropical climatic conditions, and elevation differentiation in the ecoregion of southern China might support the diversity of gymnosperms. Qinling is China’s geographical north–south boundary mountains, the east–west trend across Central China, with the highest elevation of 3,771.2 m. The Daba Mountains strike northwest–southeast, with the highest elevation of 3,053 m. The complex topography of mountains, valleys, and canyons has formed various climates and habitats, making the southern mountainous region the center of gymnosperm species diversity (Li et al., 2009). On the other hand, more than 200 peaks in Taiwan Island with an elevation of more than 3,000 m (You et al., 2017) have resulted in a variety of hydrothermal conditions along elevation gradients are a suitable site to study the EDG of gymnosperms richness.
Moreover, Eco 27 is rich in the diversity of gymnosperms in an ecoregion at the elevation of 2,700 m. It is noteworthy that this region included the Hengduan Mountains region. The Hengduan Mountains served as a center of distribution and speciation of alpine species, including gymnosperms (Zhang et al., 2009). Our findings are similar to previous studies conducted in the adjoining Himalayan region, especially in Nepal (Bhattarai and Vetaas, 2003; Paudel et al., 2018; Subedi et al., 2019; Pandey et al., 2020b). Previous studies in the Himalayan region have shown that the highest diversity of gymnosperms is found at the elevation above 3,000 m, forming a unimodal distribution pattern (Subedi et al., 2019; Pandey et al., 2020b). The topographic variation, change in temperature and precipitation, and abundant energy in the Hengduan Mountains region might favor the distribution and diversification of gymnosperms (Vetaas and Grytnes, 2002; Vetaas et al., 2019). On the other hand, the area is also rich in the diversity of endemic gymnosperm taxa. High elevation differentiation, isolated habitat, and younger evolutionary history are such factors that cause endemism (Zhang et al., 2009). On the other hand, the tree species are more consistently distributed than a shrub, meaning that the climatic resistance of tree is higher than the shrub (Sang, 2009).
In particular, the northern regions have low mean annual temperature and precipitation; therefore, unfavorable climatic conditions of the north act as limiting factors in the distribution of gymnosperms. The diversity of living organisms peaks at the tropics and gradually declines toward the pole (Kerkhoff et al., 2014). The current study provide sample evidence to support the “tropical conservatism hypothesis” (Wiens and Graham, 2005). It is very difficult to elaborate on the tropical conservatism hypothesis without the evolutionary, biogeographic, diversification, dispersal, and local coexistence process (Kerkhoff et al., 2014). However, in general, the ecoregions in the southern region of China are essential sites for the conservation of all subgroups of gymnosperm species.
Determinants of Species Richness Along the Elevation
The drivers of EDG of gymnosperms in ecoregions of China can be explained by seven main environmental variables temperature, precipitation, PET, NPP, AI, TS, and PS. These abiotic variables showed significant variation along the elevation and determine the distribution of species at different locations and elevations. Therefore, elevational patterns may vary among ecoregions, and no single diversity pattern is predictable.
Effect of Temperature Constrain
Following the species–temperature relationship (Currie et al., 2004), a strong effect of temperature was found on the richness pattern of all predictor sets of gymnosperm species in ecoregions of China. Pronounced positive responses were noticed in Eco 20, 22, 27, 33, and 34 (Figure 5). Previous studies have also reported similar findings with several mechanisms invoked (Hawkins et al., 2003; McCain and Grytnes, 2010; Classen et al., 2015; Gao et al., 2017; Liu and El-Kassaby, 2018). The temperature decreases along with the elevation and species richness also decline (Bhattarai and Vetaas, 2003; McCain and Grytnes, 2010; Pandey et al., 2020b), where temperature decreases by an average of 0.6°C at each 100-m elevation increase (Körner, 2003). The ambient temperature is a primary determinant of productivity and determines the number of resources available to the plant for the production of energy (McCain and Grytnes, 2010; Vetaas et al., 2019). The species decline at higher elevation can also be linked to the “environmental stress hypothesis” (Bijlsma and Loeschcke, 2005). The optimum temperature decreases with elevation, and therefore, few species can adapt in harsh climatic conditions (Bijlsma and Loeschcke, 2005; Gao and Liu, 2018; Pandey et al., 2020b). On the other hand, the richness pattern of gymnosperms is negatively associated with TEMP in Eco 19 and 33 (Figure 5). The TEMP of Eco 12 ranges between −1.4 and 5.2°C, while Eco 19 ranges between 4.7 and 14.4°C. The possible reason that resulted in contradictory findings might be because the species found in this region have a long-range distribution and are mostly confined at lower elevational bands (0–3,100 m) (Bhattarai and Vetaas, 2003; Classen et al., 2015). The significant positive relationship between temperature and elevation in threatened and endemic species indicates that with the temperature change, these species are more likely to face extinction (Sanderson et al., 2002). A species can be threatened because of anthropogenic activities (Xu et al., 2019, 2020); however, raising temperature cannot be overlooked because, in the past two decades, human activities are mainly responsible for climate change (Olson and Dinerstein, 2002; Paudel et al., 2018; Xu et al., 2019). Previous studies have also confirmed that increasing temperature causes the range shift and extinction in montane species (Körner, 2003); therefore, the gymnosperms in the southern region of China will be highly affected.
Precipitation and Gymnosperms Species Richness
Mean annual precipitation is used as a surrogate of water availability to plants. An area with abundant water might favor the highest species diversity by accelerating the growth of plants (Pausas and Austin, 2001; Hawkins et al., 2003). Similar findings were reported in our study (Lomolino, 2001; Körner, 2003; Dorji et al., 2014). The ecoregions with high precipitation (Eco 20, 22, and 27) show significant and highly expressed variables in determining the species richness of all subgroups of gymnosperms, while the regions with low precipitation (Eco 12 and 19) show no significant effects in richness pattern (Table 1). The positive relationship between species richness and precipitation is common, and similar trends were observed in other plant species—palm (Eiserhardt et al., 2011), Rhododendron (Shrestha et al., 2017), and mangroves (Osland et al., 2017). Recent studies have adopted the implicitly available water related to analyses of EDG along the mountainous regions (McCain, 2006; Dorji et al., 2014; Liu et al., 2014; Li and Feng, 2015). Availability of water played a significant role in the diversity of plant species and determining the hump-shaped distribution pattern of species richness (Bhattarai and Vetaas, 2003; Bhattarai et al., 2004; Li and Feng, 2015; Kluge et al., 2017), including gymnosperms (Subedi et al., 2019; Pandey et al., 2020b). A dynamic relationship exists between available energy and water, where energy regulates the diversity of plants at low elevation while available water is responsible for species distribution at a higher elevation (Vetaas and Grytnes, 2002; Kluge et al., 2017). Analogous to our results, Feng et al. (2016) found that the richness patterns of endemic plant species were highly expressed by current precipitation. Although organisms have evolved to survive all conditions of environmental tolerance, as the endemic species have a narrow range of distribution and locality specificity, the water demand will not be consistent among different endemic species. Some gymnosperms of North America and taxa of Gesneriaceae of China have high moisture demand, while some can be resistant to drought (Feng et al., 2016; Liu et al., 2017; Liu and El-Kassaby, 2018). Previous studies (O’Brien, 1993; Hawkins et al., 2003; Osland et al., 2017), also advocate a positive quadratic (hump-shaped) relationship between species richness and precipitation. This trend is common in ecological studies because the relationship trends between species and ecological variables tend to be stable after reaching a climax since other environmental variables act as limiting factors. The increasing water deficit toward higher elevation under a global warming scenario might cause an unpredicted downward shift in species diversity (Crimmins et al., 2011).
Linking Species Richness to PET and AI
Potential evapotranspiration is used as a surrogate variable of net atmospheric energy balance available to the primary producers (Currie, 1991). PET combines the effects of temperature, water, and solar radiation to estimate the net atmospheric energy balance (Antonio and Robert, 2019). Although we found that PET was a significant variable and highly expressed in the richness pattern of all subgroups of gymnosperms in Eco 22 and 33, the significantrelationships between species richness and PET were also noticed in other ecoregions. We hypothesized a positive relationship between species richness patterns and PET. The result is more consistent with the “species-energy theory” of Currie (1991) and Wright (1983) and the “water-energy dynamic model” of O’Brien (2006), supporting that richness has a strong and positive relationship with PET. However, in this study, significant positive and negative trends were distinctively noticed between richness patterns and PET (Figure 5). Vetaas and Ferrer-Castán (2008) and Pausas and Austin (2001) found that species richness is negatively related to PET when the region experiences water deficit. Eco 12 and 19 receive low rainfall, and the climatic features are mostly dry and arid; therefore, they may have a negative influence on richness patterns. On the other hand, significant hump-shaped patterns were noticed in the distribution of plant species where PET was a highly significant factor in the variation of woody species richness (Bhattarai and Vetaas, 2003; Xu et al., 2016). The plant uses solar energy for the ecological process providing the availability of water and vice versa. Therefore, the hump-shaped distribution pattern in our study might also be a result of the dynamic relationship between the components of PET (i.e., temperature, water, and solar radiation). In this study, AI was the least explained variable in Eco 20, 27, and 33 while it was the secondary variable in other regions (Table 1). This finding was also supported by Liu et al. (2019); Panda et al. (2017) and Dakhil et al. (2021). AI used in this study was derived as a ratio of precipitation and PET. AI shows a direct effect on the plant growth and photosynthesis. It might result that the south and southwestern regions of China experience high precipitation and PET throughout the year; therefore, the area experiences least dryness due to aridity.
Response of NPP on Species Richness
Net primary productivity has positive effects on the diversity of species. It is more closely related to the “more individual hypothesis” (Clarke and Gaston, 2006; Vetaas et al., 2019). This hypothesis explains that NPP will generate more individuals that promote high richness by increasing the probabilities of coexistence (Clarke and Gaston, 2006). NPP was extensively used to study the richness pattern of animals (Qian et al., 2007; Keil and Jetz, 2014). Recently, NPP was used to explain the richness pattern of plants (Thuiller et al., 2006; Kreft and Jetz, 2007; Vetaas et al., 2019). It is based on the first law of thermodynamics and directly linked to the biochemical oxidation process in plants (Vetaas et al., 2019). Non-significant negative relationships were noticed between species richness and NPP in Eco 12 and 19 (Table 1). Previous studies have found no significant NPP effect on plant species richness (Peters et al., 2016). Interestingly, high deviance in the richness pattern of gymnosperms is expressed by NPP (Table 1). It was found that species richness of all subgroups of gymnosperms was positively related to NPP in all ecoregions, except Eco 12 and 19. This finding was consistent with previous documentation patterns (Thuiller et al., 2006; Kreft and Jetz, 2007; Vetaas et al., 2019). NPP helps increase population size and hence reduce interspecific competition (Thuiller et al., 2006). Accordingly, the amount of available resources in a habitat is important for maintaining population size. Therefore, the ecoregions with rich NPP will also result in high species diversity.
Climatic Seasonality and Species Richness
Climatic seasonality (both TS and PS) showed a significant effect on the richness pattern of gymnosperms in ecoregions of China. In contrast to the findings as reported by Pandey et al. (2020a), our study showed that the mountainous region of China (Eco 22, 27, and 33) favors gymnosperm richness because of the seasonal variation in temperature and precipitation. Shrestha et al. (2017) also explained that climatic seasonality was an important variable in controlling the richness pattern of Rhododendron species in China. The seasonal variation in the tropical and subtropical mountainous regions of China is uniform (Shrestha et al., 2017). Moreover, Panda et al. (2017); Gao and Liu (2018), and Pandey et al. (2020a) all reported a significant role of climatic seasonality for the range in shift of plants at high elevations mostly on the mountains of the Himalaya. Less variation in climate provides profound environmental stability, meaning less energy is required by the organisms to regulate metabolic functions (Gao and Liu, 2018). This creates a physiological barrier between species growing in low land and at higher elevation, which helps in the accumulation of more species along elevation gradients.
Conclusion
This is the first study to evaluate the elevational distribution pattern of gymnosperm richness in China, a biological hotspot of the world. Based on our investigations, we presented a significant relationship between gymnosperm species richness and environmental correlates along elevation gradients in the ecoregion of China. Moreover, we demonstrated that the highest diversity of all richness groups of gymnosperms was found in the subtropical ecoregion (i.e., southern China). Three types of richness patterns were distinctively noticed in China—(i) hump-shaped, (ii) linear increase, and (iii) monotonic decrease—along elevation gradients. All the richness groups of gymnosperms have different elevational patterns, while the environmental variables highly expressed the richness patterns. The environmental limitation inhibits the distribution of gymnosperms in the northern ecoregions of China, while the favorable subtropical environment encourages the richness of gymnosperms in the southern ecoregions. We conclude that Hengduan–Qionglai Mountains, South China, and Taiwan are the richest in the diversity of gymnosperms along elevation gradients. These ecoregions also support a high number of threatened and endemic species, and therefore, implementation of future suitable conservation strategies is needed. Also, we recommend researchers to include the ecoregions or biomes and sub-ecoregions in their spatial modeling studies at regional or global scales, because the drivers showed a high variation in their relationship or contribution to the variation of species richness pattern from sub-ecoregion to another and also at growth form levels (trees or shrubs). Further research is needed on gymnosperms to assess the dynamics of species richness under climate change scenarios at biome and sub-ecoregion levels. This would provide greater insights into conservation planning of biodiversity at community and ecosystem levels.
Data Availability Statement
The original contributions presented in the study are included in the article/Supplementary Material, further inquiries can be directed to the corresponding authors.
Author Contributions
BP and KP contributed to conception and design of the study. BP, AT, and MK organized the database. BP, MD, and LZ performed the statistical analysis. BP wrote the first draft of the manuscript. All authors contributed to manuscript revision and read and approved the submitted version.
Funding
This research was supported by the National Key Research and Development Program of China (Grant Number: 2016YFC0502101) and Second Tibetan Plateau Scientific Expedition and Research Program (STEP, Grant Number: 2019QZKK0303).
Conflict of Interest
The authors declare that the research was conducted in the absence of any commercial or financial relationships that could be construed as a potential conflict of interest.
Acknowledgments
We are thankful to Ole R. Vetaas (University of Bergen, Norway) for his valuable suggestions. We also thank the editor and the two reviewers for their constructive comments which greatly improved this study.
Supplementary Material
The Supplementary Material for this article can be found online at: https://www.frontiersin.org/articles/10.3389/fevo.2021.679439/full#supplementary-material
Supplementary Figure 1 | Dendrogram of hierarchical analysis based on gymnosperms species richness and environmental variables along elevation gradients in each ecoregion of China. The separation of ecoregions is based on euclidean values of similarities. The red color box indicates the group of similar ecoregions.
Supplementary Table 1 | The ecoregions of China with the geographic code assigned in this study, names of eco-regions, and the characteristics forest types each region. The elevation range represents the lower and higher elevation bands of respective ecoregions expressed in meter (above sea level). Area is the total surface coverage of terrestrial land expressed in sq. km. Species richness is the number of species present in each ecoregions.
Footnotes
- ^ www.catalogueoflife.org/col, accessed between September 2019 and March 2020
- ^ http://www.iucnredlist.org, accessed between September 2019 and March 2020
- ^ http://srtm.csi.cgiar.org/
- ^ http://chelsa-climate.org/bioclim/
- ^ https://cgiarcsi.community/2019/01/24/global-aridity-index-and-potential-evapotranspiration-climate-database-v2/
- ^ http://sedac.ciesin.columbia.edu/data/set/hanpp-net-primary-productivity
References
Antonio, T., and Robert, Z. (2019). Global aridity index and potential evapotranspiration (ET0) climate database v2. doi: 10.6084/m9.figshare.7504448.v3
Bertuzzo, E., Carrara, F., Mari, L., Altermatt, F., Rodriguez-Iturbe, I., and Rinaldo, A. (2016). Geomorphic controls on elevational gradients of species richness. Proc. Natl. Acad. Sci. U.S.A. 113, 1737–1742. doi: 10.1073/pnas.1518922113
Bhattarai, K. R., and Vetaas, O. R. (2003). Variation in plant species richness of different life forms along a subtropical elevation gradient in the Himalayas, East Nepal. Glob. Ecol. Biogeogr. 12, 327–340. doi: 10.1046/j.1466-822X.2003.00044.x
Bhattarai, K. R., Vetaas, O. R., and Grytnes, J. A. (2004). Fern species richness along a central Himalayan elevational gradient, Nepal. J. Biogeogr. 31, 389–400. doi: 10.1046/j.0305-0270.2003.01013.x
Bijlsma, R., and Loeschcke, V. (2005). Environmental stress, adaptation and evolution: an overview. J. Evolution. Biol. 18, 744–749. doi: 10.1111/j.1420-9101.2005.00962.x
Chai, Z., and Wang, D. (2016). Environmental influences on the successful regeneration of pine-oak mixed forests in the Qinling Mountains, China. Scand. J. Forestry Res. 31, 368–381. doi: 10.1080/02827581.2015.1062912
Clarke, A., and Gaston, K. J. (2006). Climate, energy and diversity. Proc. R. Soc. B Biol. Sci. 273, 2257–2266.
Classen, A., Peters, M. K., Kindeketa, W. J., Appelhans, T., Eardley, C., Gikungu, M., et al. (2015). Temperature versus resource constraints: which factors determine bee diversity on Mount Kilimanjaro, Tanzania: bee species richness on Mt Kilimanjaro. Glob. Ecol. Biogeogr. 24, 642–652. doi: 10.1111/geb.12286
Crimmins, S. M., Dobrowski, S. Z., Greenberg, J. A., Abatzoglou, J. T., and Mynsberge, A. R. (2011). Changes in climatic water balance drive downhill shifts in plant species’ optimum elevations. Science 331, 324–327. doi: 10.1126/science.1199040
Currie, D. J. (1991). Energy and large-scale patterns of animal- and plant- species richness. Am. Nat. 137, 27–49. doi: 10.1086/285144
Currie, D. J., Mittelbach, G. G., Cornell, H. V., Field, R., Guégan, J. F., Hawkins, B. A., et al. (2004). Predictions and tests of climate-based hypotheses of broad-scale variation in taxonomic richness. Ecol. Lett. 7, 1121–1134. doi: 10.1111/j.1461-0248.2004.00671.x
Currie, D. J., and Paquin, V. (1987). Large-scale biogeographical patterns of species richness of trees. Nature 329, 326. doi: 10.1038/329326a0
Dakhil, M. A., Li, J., Pandey, B., Pan, K., Liao, Z., Olatunji, O. A., et al. (2021). Richness patterns of endemic and threatened conifers in south-west China: topographic-soil fertility explanation. Environ. Res. Lett. 16:034017. doi: 10.1088/1748-9326/abda6e
Dorji, T., Moe, S. R., Klein, J. A., and Totland, O. (2014). Plant species richness, evenness, and composition along environmental gradients in an alpine meadow grazing ecosystem in Central Tibet, China. Arct. Antarct. Alp. Res. 46, 308–326.
Eiserhardt, W. L., Svenning, J.-C., Kissling, W. D., and Balslev, H. (2011). Geographical ecology of the palms (Arecaceae): determinants of diversity and distributions across spatial scales. Ann. Bot. 108, 1391–1416. doi: 10.1093/aob/mcr146
Fang, J., Wang, Z., and Tang, Z. (2011). Atlas of Woody Plants in China: Distribution and Climate. Berlin: Springer Science & Business Media.
Feng, G., Mao, L., Sandel, B., Swenson, N. G., and Svenning, J. C. (2016). High plant endemism in China is partially linked to reduced glacial-interglacial climate change. J. Biogeogr. 43, 145–154. doi: 10.1111/jbi.12613
Gao, J., and Liu, Y. (2018). Climate stability is more important than water–energy variables in shaping the elevational variation in species richness. Ecol. Evol. 8, 6872–6879. doi: 10.1002/ece3.4202
Gao, J., Zhang, X., Luo, Z., Lan, J., and Liu, Y. (2017). Elevational diversity gradients across seed plant taxonomic levels in the Lancang River Nature Reserve: role of temperature, water and the mid-domain effect. J. Forestry Res. 29, 1121–1127. doi: 10.1007/s11676-017-0509-1
Gauch, H. G., and Whittaker, R. H. (1981). Hierarchical classification of community data. J. Ecol. 69, 537–557. doi: 10.2307/2259682
Geng, S., Shi, P., Song, M., Zong, N., Zu, J., and Zhu, W. (2019). Diversity of vegetation composition enhances ecosystem stability along elevational gradients in the Taihang Mountains, China. Ecol. Indic. 104, 594–603. doi: 10.1016/j.ecolind.2019.05.038
Grace, J. B. (2006). Structural Equation Modeling and Natural Systems. Cambridge: Cambridge University Press.
Grace, J. B., and Pugesek, B. H. (1997). A structural equation model of plant species richness and its application to a coastal wetland. Am. Nat. 149, 436–460. doi: 10.1086/285999
Greve, P., Roderick, M., Ukkola, A., and Wada, Y. (2019). The aridity index under global warming. Environ. Sci. Lett. 14:124006. doi: 10.1088/1748-9326/ab5046
Hastie, T. J., and Tibshirani, R. J. (1990). Generalized Addiative Model. Boca Raton, USA: Chapman & Hall/CRC.
Hawkins, B. A., Field, R., Cornell, H. V., Currie, D. J., Guégan, J.-F., Kaufman, D. M., et al. (2003). Energy, water, and broad-scale geographic patterns of species richness. Ecology 84, 3105–3117. doi: 10.1890/03-8006
Hou, H. (1983). Vegetation of China with reference to its geographical distribution. Ann. Mo. Bot. Gard. 70, 509–549. doi: 10.2307/2992085
Imhoff, M. L., and Bounoua, L. (2006). Exploring global patterns of net primary production carbon supply and demand using satellite observations and statistical data. J. Geophys. Res. Atmos. 111:D22S12 doi: 10.1029/2006JD007377
Jiang, X., Cheng, Y., and Yin, Y. (2010). Atlas of Gymnosperms Woods of China. Beijing: Science Press.
Karger, D. N., Conrad, O., Bohner, J., Kawohl, T., Kreft, H., Soriaauza, R. W., et al. (2017). Climatologies at high resolution for the earth’s land surface areas. Sci. Data. 4, 170122–170122. doi: 10.1038/sdata.2017.122
Keil, P., and Jetz, W. (2014). Downscaling the environmental associations and spatial patterns of species richness. Ecol. Appl. 24, 823–831. doi: 10.1890/13-0805.1
Kerkhoff, A. J., Moriarty, P. E., and Weiser, M. D. (2014). The latitudinal species richness gradient in New World woody angiosperms is consistent with the tropical conservatism hypothesis. Proc. Natl. Acad. Sci. U.S.A. 111, 8125–8130. doi: 10.1073/pnas.1308932111
Kluge, J., Worm, S., Lange, S., Long, D., Böhner, J., Yangzom, R., et al. (2017). Elevational seed plants richness patterns in Bhutan, Eastern Himalaya. J. Biogeogr. 44, 1711–1722. doi: 10.1111/jbi.12955
Körner, C. (2003). Alpine Plant Life: Functional Plant Ecology of High Mountain Ecosystems. Heidelberg: Springer Science & Business Media.
Kreft, H., and Jetz, W. (2007). Global patterns and determinants of vascular plant diversity. Proc. Natl. Acad. Sci. U.S.A. 104, 5925–5930. doi: 10.1073/pnas.0608361104
Kubota, Y., Shiono, T., and Kusumoto, B. (2015). Role of climate and geohistorical factors in driving plant richness patterns and endemicity on the east Asian continental islands. Ecography 38, 639–648. doi: 10.1111/ecog.00981
Li, G., Shen, Z., Ying, T., and Fang, J. (2009). The spatial pattern of species richness and diversity centers of gymnosperm in China. Biodivers. Sci. 17, 272–279. doi: 10.3724/SP.J.1003.2009.08327
Li, M., and Feng, J. (2015). Biogeographical interpretation of elevational patterns of genus diversity of seed plants in Nepal. PLoS One 10:e0140992. doi: 10.1371/journal.pone.0140992
Liao, Z., Zhang, L., Nobis, M. P., Wu, X., Pan, K., Wang, K., et al. (2020). Climate change jointly with migration ability affect future range shifts of dominant fir species in Southwest China. Divers. Distrib. 26, 352–367. doi: 10.1111/ddi.13018
Liu, B., Sun, J., Liu, M., Zeng, T., and Zhu, J. (2019). The aridity index governs the variation of vegetation characteristics in alpine grassland. Northern Tibet Plateau 7:e7272. doi: 10.7717/peerj.7272
Liu, J., Yunhong, T., and Slik, J. W. F. (2014). Topography related habitat associations of tree species traits, composition and diversity in a Chinese tropical forest. For. Ecol. Manag. 330, 75–81. doi: 10.1016/j.foreco.2014.06.045
Liu, Y., and El-Kassaby, Y. A. (2018). Evapotranspiration and favorable growing degree-days are key to tree height growth and ecosystem functioning: meta-analyses of Pacific Northwest historical data. Sci. Rep. 8:8228. doi: 10.1038/s41598-018-26681-1
Liu, Y., Shen, Z., Wang, Q., Su, X., Zhang, W., Shrestha, N., et al. (2017). Determinants of richness patterns differ between rare and common species: implications for Gesneriaceae conservation in China. Divers. Distrib. 23, 235–246. doi: 10.1111/ddi.12523
Lomolino, M. V. (2001). Elevation gradients of species-density: historical and prospective views. Glob. Ecol. Biogeogr. 10, 3–13. doi: 10.1046/j.1466-822x.2001.00229.x
McCain, C. M. (2004). The mid-domain effect applied to elevational gradients: species richness of small mammals in Costa Rica. J. Biogeogr. 31, 19–31. doi: 10.1046/j.0305-0270.2003.00992.x
McCain, C. M. (2006). Could temperature and water availability drive elevational species richness patterns? A global case study for bats. Glob. Ecol. Biogeogr. 16, 1–13. doi: 10.1111/j.1466-8238.2006.00263.x
McCain, C. M., and Grytnes, J.-A. (2010). “Elevational gradients in species richness”, in Encyclopedia of Life Sciences (eLS). Chichester: John Wiley & Sons, Ltd. doi: 10.1002/9780470015902.a0022548
Meng, D., Zhang, J., and Li, M. (2012). Diversity of woodland communities and plant species along an altitudinal gradient in the Guancen Mountains, China. Sci. World J. 2012, 398765–398765. doi: 10.1100/2012/398765
O’Brien, E. M. (1993). Climatic gradients in woody plant species richness: towards an explanation based on an analysis of southern Africa’s woody flora. J. Biogeogr. 20, 181–198. doi: 10.2307/2845670
O’Brien, E. M. (2006). Biological relativity to water–energy dynamics. J. Biogeogr. 33, 1868–1888. doi: 10.1111/j.1365-2699.2006.01534.x
Olson, D. M., and Dinerstein, E. (2002). The global 200 : priority ecoregions for global conservation. Ann. Mo. Bot. Gard. 89, 199–224. doi: 10.2307/3298564
Olson, D. M., Dinerstein, E., Wikramanayake, E. D., Burgess, N. D., Powell, G. V. N., Underwood, E. C., et al. (2001). Terrestrial ecoregions of the World: a new map of life on Earth: a new global map of terrestrial ecoregions provides an innovative tool for conserving biodiversity. BioScience 51, 933–938.
Osland, M. J., Feher, L. C., Griffith, K. T., Cavanaugh, K. C., Enwright, N. M., Day, R. H., et al. (2017). Climatic controls on the global distribution, abundance, and species richness of mangrove forests. Ecol. Monogr. 87, 341–359. doi: 10.1002/ecm.1248
Panda, R. M., Behera, M. D., Roy, P. S., and Biradar, C. (2017). Energy determines broad pattern of plant distribution in Western Himalaya. Ecol. Evol. 7, 10850–10860. doi: 10.1002/ece3.3569
Pandey, B., Khatiwada, J. R., Zhang, L., Pan, K., Dakhil, M. A., Xiong, Q., et al. (2020a). Energy–water and seasonal variations in climate underlie the spatial distribution patterns of gymnosperm species richness in China. Ecol. Evol. 10, 9474–9485. doi: 10.1002/ece3.6639
Pandey, B., Nepal, N., Tripathi, S., Pan, K., Dakhil, M. A., Timilsina, A., et al. (2020b). Distribution pattern of gymnosperms’ richness in Nepal: effect of environmental constrains along elevational gradients. Plants 9:625. doi: 10.3390/plants9050625
Paudel, P. K., Sipos, J., and Brodie, J. F. (2018). Threatened species richness along a Himalayan elevational gradient: quantifying the influences of human population density, range size, and geometric constraints. BMC Ecol. 18:6. doi: 10.1186/s12898-018-0162-3
Pausas, J. G., and Austin, M. P. (2001). Patterns of plant species richness in relation to different environments: an appraisal. J. Veg. Sci. 12, 153–166. doi: 10.2307/3236601
Peters, M. K., Hemp, A., Appelhans, T., Behler, C., Classen, A., Detsch, F., Ensslin, A., Ferger, S. W., Frederiken, S. B., and Gebert, F. (2016). Predictors of elevational biodiversity gradients change from single taxa to the multi-taxa community level. Nat. Comm. 7:13736. doi: 10.1038/ncomms13736
Qian, H., Wang, X., Wang, S., and Li, Y. (2007). Environmental determinants of amphibian and reptile species richness in China. Ecography 30, 471–482. doi: 10.1111/j.0906-7590.2007.05025.x
Rahbek, C. (1995). The elevational gradient of species richness: a uniform pattern? Ecography 18, 200–205. doi: 10.1111/j.1600-0587.1995.tb00341.x
Rahbek, C., Gotelli, N. J., Colwell, R. K., Entsminger, G. L., Fernando, T., Rangel, L. V. B., et al. (2007). Predicting continental-scale patterns of bird species richness with spatially explicit models. Proc. R. Soc. B-Biol. Sci. 274, 165–174. doi: 10.1098/rspb.2006.3700
R Development Core Team (2017). R: A language and environment for statistical computing. Available online at: https://www.R-proje ct.org/
Rosenzweig, M. L. (1995). Species Diversity in Space and Time. Cambridge: Cambridge University Press.
Sanderson, E. W., Jaiteh, M., Levy, M. A., Redford, K. H., Wannebo, A. V., and Woolmer, G. (2002). The human footprint and the last of the wild. BioScience 52, 891–904.
Sang, W. (2009). Plant diversity patterns and their relationships with soil and climatic factors along an altitudinal gradient in the middle Tianshan Mountain area, Xinjiang, China. Ecol. Res. 24, 303–314. doi: 10.1007/s11284-008-0507-z
Shrestha, N., Su, X., Xu, X., and Wang, Z. (2017). The drivers of high Rhododendron diversity in south-west China: does seasonality matter? J. Biogeogr. 45, 438–447. doi: 10.1111/jbi.13136
Subedi, S. C., Bhattarai, K. R., Perez, T. M., and Sah, J. P. (2019). Gymnosperm species richness patterns along the elevational gradient and its comparison with other plant taxonomic groups in the Himalayas. Front. Biogeogr. 12:e44232. doi: 10.21425/f5fbg44232
Tang, C. Q. (2015). The Subtropical Vegetation of Southwestern China: Plant Distribution, Diversity and Ecology. Berlin: Springer Science & Business Media.
Thuiller, W., Midgley, G. F., Rouget, M., and Cowling, R. M. (2006). Predicting patterns of plant species richness in megadiverse South Africa. Ecography 29, 733–744.
Vetaas, O. R., and Ferrer-Castán, D. (2008). Patterns of woody plant species richness in the Iberian Peninsula: environmental range and spatial scale. J. Biogeogr. 35, 1863–1878. doi: 10.1111/j.1365-2699.2008.01931.x
Vetaas, O. R., and Grytnes, J. A. (2002). Distribution of vascular plant species richness and endemic richness along the Himalayan elevation gradient in Nepal. Glob. Ecol. Biogeogr. 11, 291–301. doi: 10.1046/j.1466-822X.2002.00297.x
Vetaas, O. R., Paudel, K. P., and Christensen, M. (2019). Principal factors controlling biodiversity along an elevation gradient: water, energy and their interaction. J. Biogeogr. 46, 1652–1663. doi: 10.1111/jbi.13564
Wang, Z., Tang, Z., and Fang, J. (2007). Altitudinal patterns of seed plant richness in the Gaoligong Mountains, south-east Tibet, China. Divers. Distrib. 13, 845–854. doi: 10.1111/j.1472-4642.2007.00335.x
Wiens, J. J., and Graham, C. H. (2005). Niche conservatism: integrating evolution, ecology, and conservation biology. Annu. Rev. Ecol. Evol. Sci. 36, 519–539.
Wright, D. H. (1983). Species-energy theory: An extension of species-area theory. Oikos 41, 496–506. doi: 10.2307/3544109
Wu, Z., and Raven, P. (1999). Flora of China (Cycadaceae through Fagaceae), Vol. 4. Beijing: Science Press and Missouri Botanical Garden Press.
Xu, H., Cao, M., Wu, Y., Cai, L., Cao, Y., Wu, J., et al. (2016). Disentangling the determinants of species richness of vascular plants and mammals from national to regional scales. Sci. Rep. 6, 21988–21988. doi: 10.1038/srep21988
Xu, M., Li, X., Liu, M., Shi, Y., Zhou, H., Zhang, B., et al. (2020). Spatial variation patterns of plant herbaceous community response to warming along latitudinal and altitudinal gradients in mountainous forests of the Loess Plateau, China. Environ. Exp. Bot. 172:103983. doi: 10.1016/j.envexpbot.2020.103983
Xu, W., Svenning, J.-C., Chen, G., Zhang, M., Huang, J., Chen, B. J. W., et al. (2019). Human activities have opposing effects on distributions of narrow-ranged and widespread plant species in China. Proc. Natl. Acad. Sci. U.S.A. 116, 26674–26681. doi: 10.1073/pnas.1911851116
Yang, Y., Chen, J., Schob, C., and Sun, H. (2017). Size-Mediated Interaction between a Cushion Species and Other Non-cushion Species at High Elevations of the Hengduan Mountains, SW China. Front. Plant. Sci. 8:465. doi: 10.3389/fpls.2017.00465
Ying, J., Chen, M., and Zhang, H. (2004). Atlas of the Gymnosperms of China. Beijing, China: China Science and Technology Press.
You, Z., Chen, S., Chen, Z., Ye, B., Lin, K., and You, S. (2017). Analysis of Fujian and Taiwan gymnosperm flora and geographical distribution. J. Foret. Env. 37, 317–321.
Keywords: endemic, net primary productivity, Hengduan-Qionglai Mountain, structural equation modeling, threatened
Citation: Pandey B, Pan K, Dakhil MA, Liao Z, Timilsina A, Khanal M and Zhang L (2021) Contrasting Gymnosperm Diversity Across an Elevation Gradient in the Ecoregion of China: The Role of Temperature and Productivity. Front. Ecol. Evol. 9:679439. doi: 10.3389/fevo.2021.679439
Received: 11 March 2021; Accepted: 17 May 2021;
Published: 29 June 2021.
Edited by:
Daniel de Paiva Silva, Goiano Federal Institute (IFGOIANO), BrazilReviewed by:
Cuauhtémoc Sáenz-Romero, Michoacana University of San Nicolás de Hidalgo, MexicoJohn Grace, University of Edinburgh, United Kingdom
Copyright © 2021 Pandey, Pan, Dakhil, Liao, Timilsina, Khanal and Zhang. This is an open-access article distributed under the terms of the Creative Commons Attribution License (CC BY). The use, distribution or reproduction in other forums is permitted, provided the original author(s) and the copyright owner(s) are credited and that the original publication in this journal is cited, in accordance with accepted academic practice. No use, distribution or reproduction is permitted which does not comply with these terms.
*Correspondence: Bikram Pandey, YmlrcmFtX3BhbmRleTRAeWFob28uY29t; Kaiwen Pan, cGFua3dAY2liLmFjLmNu