 Xiaotong Song
 Wenzhuo Fang
 Xiulian Chi3
 Xiaoming Shao
 Qinggang Wang
- 1Department of Ecology and Ecological Engineering, College of Resources and Environmental Sciences, and Key Laboratory of Biodiversity and Organic Farming of Beijing City, China Agricultural University, Beijing, China
- 2Ministry of Education, Key Laboratory for Biodiversity Science and Ecological Engineering, Department of Ecology and Evolutionary Biology, School of Life Sciences, Fudan University, Shanghai, China
- 3State Key Laboratory Breeding Base of Dao-di Herbs, National Resource Center for Chinese Materia Medica, China Academy of Chinese Medical Sciences, Beijing, China
How contemporary environment interacts with macroevolutionary processes to generate the geographic pattern of bryophyte species is still unresolved. China is very rich in bryophytes, with more than 3,000 bryophytes covering 70% of the families in the world. In this study, we assessed the effects of the contemporary environment (average temperature of the coldest season TCQ, precipitation of the warmest season PWQ, and elevational range) and the recent diversification rates (estimated as mean species number per genus, MSG) on the geographical pattern of species richness for bryophytes and two groups (i.e., liverworts and mosses) in China. We compiled the provincial level distribution of bryophyte species and estimated the geographic pattern of the recent diversification rate by MSG for species in China. Univariate, multivariate regressions and path model analyses were used to assess the relationships between species richness, MSG, and their potential environmental drivers. Species richness of all bryophytes and liverworts significantly increased with the increase of MSG, either in regressions or path analyses, indicating that provinces with high bryophyte richness were mainly inhabited by species (especially liverworts) from lineages with particularly high MSG. In contrast, the species richness of mosses was insignificantly decreased with MSG in univariate regression or insignificantly increased with MSG in path analysis. Both species richness and MSG of all bryophytes and liverworts increased with the increase in energy and water availability. In contrast, for mosses, the species richness significantly increased with the increase of energy and water availability, while MSG decreased with the increase of energy and water availability. The MSG of liverworts increase with the increase of elevational range but the MSG of mosses decrease with the increase of elevational range. Our study suggests that the humid tropical and subtropical mountains in China are not only diversity hotspots for bryophytes, but also cradles for high recent diversification of liverworts, and refuges for mosses to hold many monotypic and oligotypic genera.
Introduction
The huge spatialvariation in species richness and mechanisms underlying it have always been a hot topic of concern to ecologists and biogeographers (Rosenzweig, 1995). The contemporary environmental factors such as energy, water availability and habitat heterogeneity have been regarded as potential drivers of species richness pattern (Allen et al., 2002; Currie et al., 2004; Stein et al., 2014; Rana et al., 2019). However, the species richness of a region is ultimately determined by the evolutionary processes of speciation, dispersal and extinction (Mittelbach et al., 2007). The positive species richness-energy/water/habitat heterogeneity relationships must reflect evolutionary history (Rana et al., 2019). For example, regions with high energy and water availability have high primary productivity to expand the population size of animals and plants, and thus contains more genetic diversity to increase the rate of speciation (Hubbell, 2001; Allen et al., 2006; Clarke and Gaston, 2006). Habitat heterogeneity also can increase species richness by promoting the speciation rate and reducing species extinction (Turner, 2004; Fjeldsa et al., 2012; Hughes and Atchison, 2015).
Recently, the diversification rate hypothesis explaining species diversity patterns in terms of evolutionary processes has received renewed attention from researchers (Svenning et al., 2008; Condamine et al., 2012; Kozak and Wiens, 2016; Cai et al., 2020). According to the diversification rate hypothesis, species-rich areas have a high rate of net diversification owing to their higher speciation rates and/or lower extinction rates (Fischer, 1960). The high richness in low latitudes would result from the high diversification rate in warm and wet climates and/or in tropical and subtropical mountains due to fast molecular evolution or strengthened reproductive isolation (Steinbauer et al., 2016; Xing and Ree, 2017; Dagallier et al., 2020). Therefore, the diversification rate hypothesis would predict a positive species richness-diversification rate relationship, and positive diversification rate-climate or habitat heterogeneity relationships.
In contrast of the diversification rate hypothesis, the time-for-speciation hypothesis believes that species richness reflects the available time for diversification, and tropical regions have more species because they are occupied for a longer time, which provide more time for speciation (Fischer, 1960; Rohde, 1992; Dynesius and Jansson, 2000). According to the time for speciation hypothesis, old relic clades with low net diversification (high extinction and/or low speciation) rate mainly occupy in long-inhabited species-rich regions (Mittelbach et al., 2007), which causes that mean net diversification rates are not high in species-rich region. Therefore, the time for speciation would expect a positive or no relationship between species richness and net diversification rate, and negative relationships between diversification rate and climate or habitat heterogeneity. Previous studies have tested the effects of diversification rate hypothesis and/or time-for-speciation hypothesis on animals (e.g., amphibians, Stephens and Wiens, 2003; birds, Hawkins et al., 2005; marine bivalves, Jablonski et al., 2006; salamanders, Kozak and Wiens, 2016) and vascular plants (e.g., Arecaceae, Svenning et al., 2008; Rhododendron, Shrestha et al., 2018; Zygophyllaceae, Wang et al., 2018). However, few studies have evaluated how contemporary environments interacted with evolutionary processes to generate the geographic pattern of bryophyte species (Laenen et al., 2018).
Bryophytes, including about 20,000 species of hornworts, liverworts and mosses, are the second largest group of higher plants after angiosperms (Patiño and Vanderpoorten, 2018). They are widely distributed in terrestrial ecosystems (St Martin and Mallik, 2017). As the earliest land plants, the survival, growth and reproduction of bryophytes have strong dependence on water availibity, but they have considerable cold tolerance (Proctor et al., 2007; Vitt et al., 2014; Perera-Castro et al., 2020). Compared with hornworts and liverworts, mosses have better drought and cold tolerance, and many of them can occur in dry and/or cold climates (e.g., Bryum pseudotriquetrum and Sanionia uncinate, Cannone et al., 2017). It has been suggested that the low species richness of extant bryophyte might have resulted from mass extinction event, but their recent diversification rate since mid-Mesozoic were high (Laenen et al., 2014).
China is one of the countries with the richest species of bryophytes, with more than 3000 species of bryophytes covering 70% of the families in the world (Chen et al., 2015; Qian and Chen, 2016). The vast land area of mainland China has created enormous regional differences in climate and habitat. In this study, we complied the province level distribution of extant bryophyte species, and attempted to assess the effects of the contemporary environment (temperature, precipitation and habitat heterogeneity) and recent diversification rates (estimated as the mean species number per genus, MSG) on the geographical pattern of species richness for bryophytes and two groups (i.e., liverworts and mosses) in China. We also examined the associations between environmental factors and MSG.
Data and Methods
Data
To estimate the province-level species richness pattern of bryophytes, we combined each municipality except Chongqing which has a very large area with one of its neighboring provinces. Specifically, we combined Beijing and Tianjin with Hebei Province, Shanghai with Zhejiang Province, and Hong Kong and Macau with Guangdong Province. On the final map, China was divided into 29 province-level geographic units (“province” hereafter) (see Supplementary Figure 1).
We compiled the distribution data of bryophytes in China from the online database of Catalog of Life China (CoLChina, http://www.sp2000.org.cn/CoLChina) and recent literatures (see Supplementary Data). We standardized nomenclature of species according to CoLChina. Finally, this study included a total of 3184 bryophytes in 601 genera and 157 families. Those bryophytes included 26 Hornworts in 8 genera and 3 families, 1102 liverworts in 155 genera and 63 families, and 2056 mosses in 438 genera and 91 families. Because of the small number of hornworts species, we incorporated them into liverworts for subsequent analyses. To eliminate the effect of area on species richness assessment, we calculated the area-correlated species richness as species number of a province being divided by the log-transformed area of that province (“species richness” hereafter). Up to now, the dated phylogeny of bryophytes only covered limited species and genera (Laenen et al., 2014, 2018; Liu et al., 2019). To represent the net diversification rate within genera, we used the species number per genus following previous study (Svenning et al., 2008). The geographic pattern of diversification rate was estimated by MSG for the species occurring in each province.
Environmental variables included the average temperature of the coldest season (TCQ), the precipitation of the warmest season (PWQ), and the elevational range in each province. TCQ represented environmental energy and emphasized cold tolerance effects (Wang et al., 2011), PWQ represented water availability in growing season which is important for bryophytes as suggested by previous studies (Qian and Chen, 2016), and ER was frequently used to represent habitat heterogeneity. ER weakly correlates with TCQ and PWQ (r = −0.40 and −0.42), and TCQ moderate correlates with PWQ (r = 0.76, Supplementary Table 2). The data for TCQ and PWQ with a spatial resolution of ca 1 × 1 km2 were downloaded from the Worldclim dataset1 (Hijmans et al., 2005). We calculated each climate variable in each province as the average of all 1 × 1 km2 grids in that province. We calculated elevational range as the difference between the minimum and maximum elevations of a province using the GTOPO30 dataset of the US Geographical Survey. To improve the normality, we log-transformed the elevational range data.
Statistical Analyses
The square root-transformed species richness and MSG for all bryophytes, liverworts or mosses within provinces were approximately normally distributed with skewness and kurtosis <|1.0|. Therefore, we conducted general linear models (GLM) to test the influence of MSG on species richness pattern of all bryophytes, liverworts or mosses. To handle the effects of spatial autocorrelation in significance testing, we conducted a modified t-test to test the significance of the GLMs (Clifford et al., 1989). The test corrects the correlation coefficient between response variable and predictor, and estimates the effective sample size that allows for the spatial structure by introducing estimated covariance matrices for distance classes (Dutilleul et al., 1993). The modified t-test was done using “modified.ttest” function in R package of SpatialPack (Osorio et al., 2020).
To evaluate the effects of three individual environmental variables (i.e., TCQ, PWQ, and elevational range) on geographical patterns in species richness and MSG for all bryophytes, liverworts or mosses, we ran GLMs using modified t-tests for significance testing. In addition, we built regression models with all possible combinations of three environmental predictors done model ranking based on the Bayesian Information Criterion (BIC), and conducted model averaging. We extracted predictor’s importance values which were computed as the sum of the weights of models containing the corresponding predictors. Those analyses were done using “dredge” and “model.avg” functions in R package of MuMIn (Bartoń, 2020).
To further compare the effects of TCQ, PWQ, elevational range, and MSG on geographical pattern of species richness, we constructed a path model by assuming that MSG influence species richness directly, while TCQ, PWQ, and elevational range can influence species richness directly and also indirectly via its effects on MSG. To handle the effects of spatial autocorrelation, the significances of the path coefficients were tested using a bootstrap resampling method. We constructed the path models and done 199 times bootstrapping using the “sem” function in lavaan package of R (Rosseel et al., 2021).
Results
Geographic Pattern of Species Richness
The average species richness of bryophytes varied greatly among the 29 provinces in China ranged from 11 to 137, with an average of 55 species (Supplementary Table 1). The species richness was markedly higher in southern China than in northern China (Figure 1A). The average species richness of all bryophytes per province in southern China (17 provinces with latitude lower than 35°) and northern China are 68 (±28) and 37 (±14), respectively. The greatest richness was found in the southwest and southeast provinces (Figure 1A), such as Yunnan, Xizang, Taiwan, Fujian. By contrast, the species richness was very low in the Qinghai, Shanxi, Ningxia and Henan. The patterns of species richness of liverworts and mosses were generally similar to those of all bryophytes (Figures 1B,C). The average species richness of liverworts and mosses among provinces are 15 (±12) and 39 (±16). The Pearson correlation coefficients between bryophyte richness and liverwort or moss richness are 0.95 and 0.98, respectively. The Pearson correlation coefficients between liverwort richness and moss richness is 0.87.
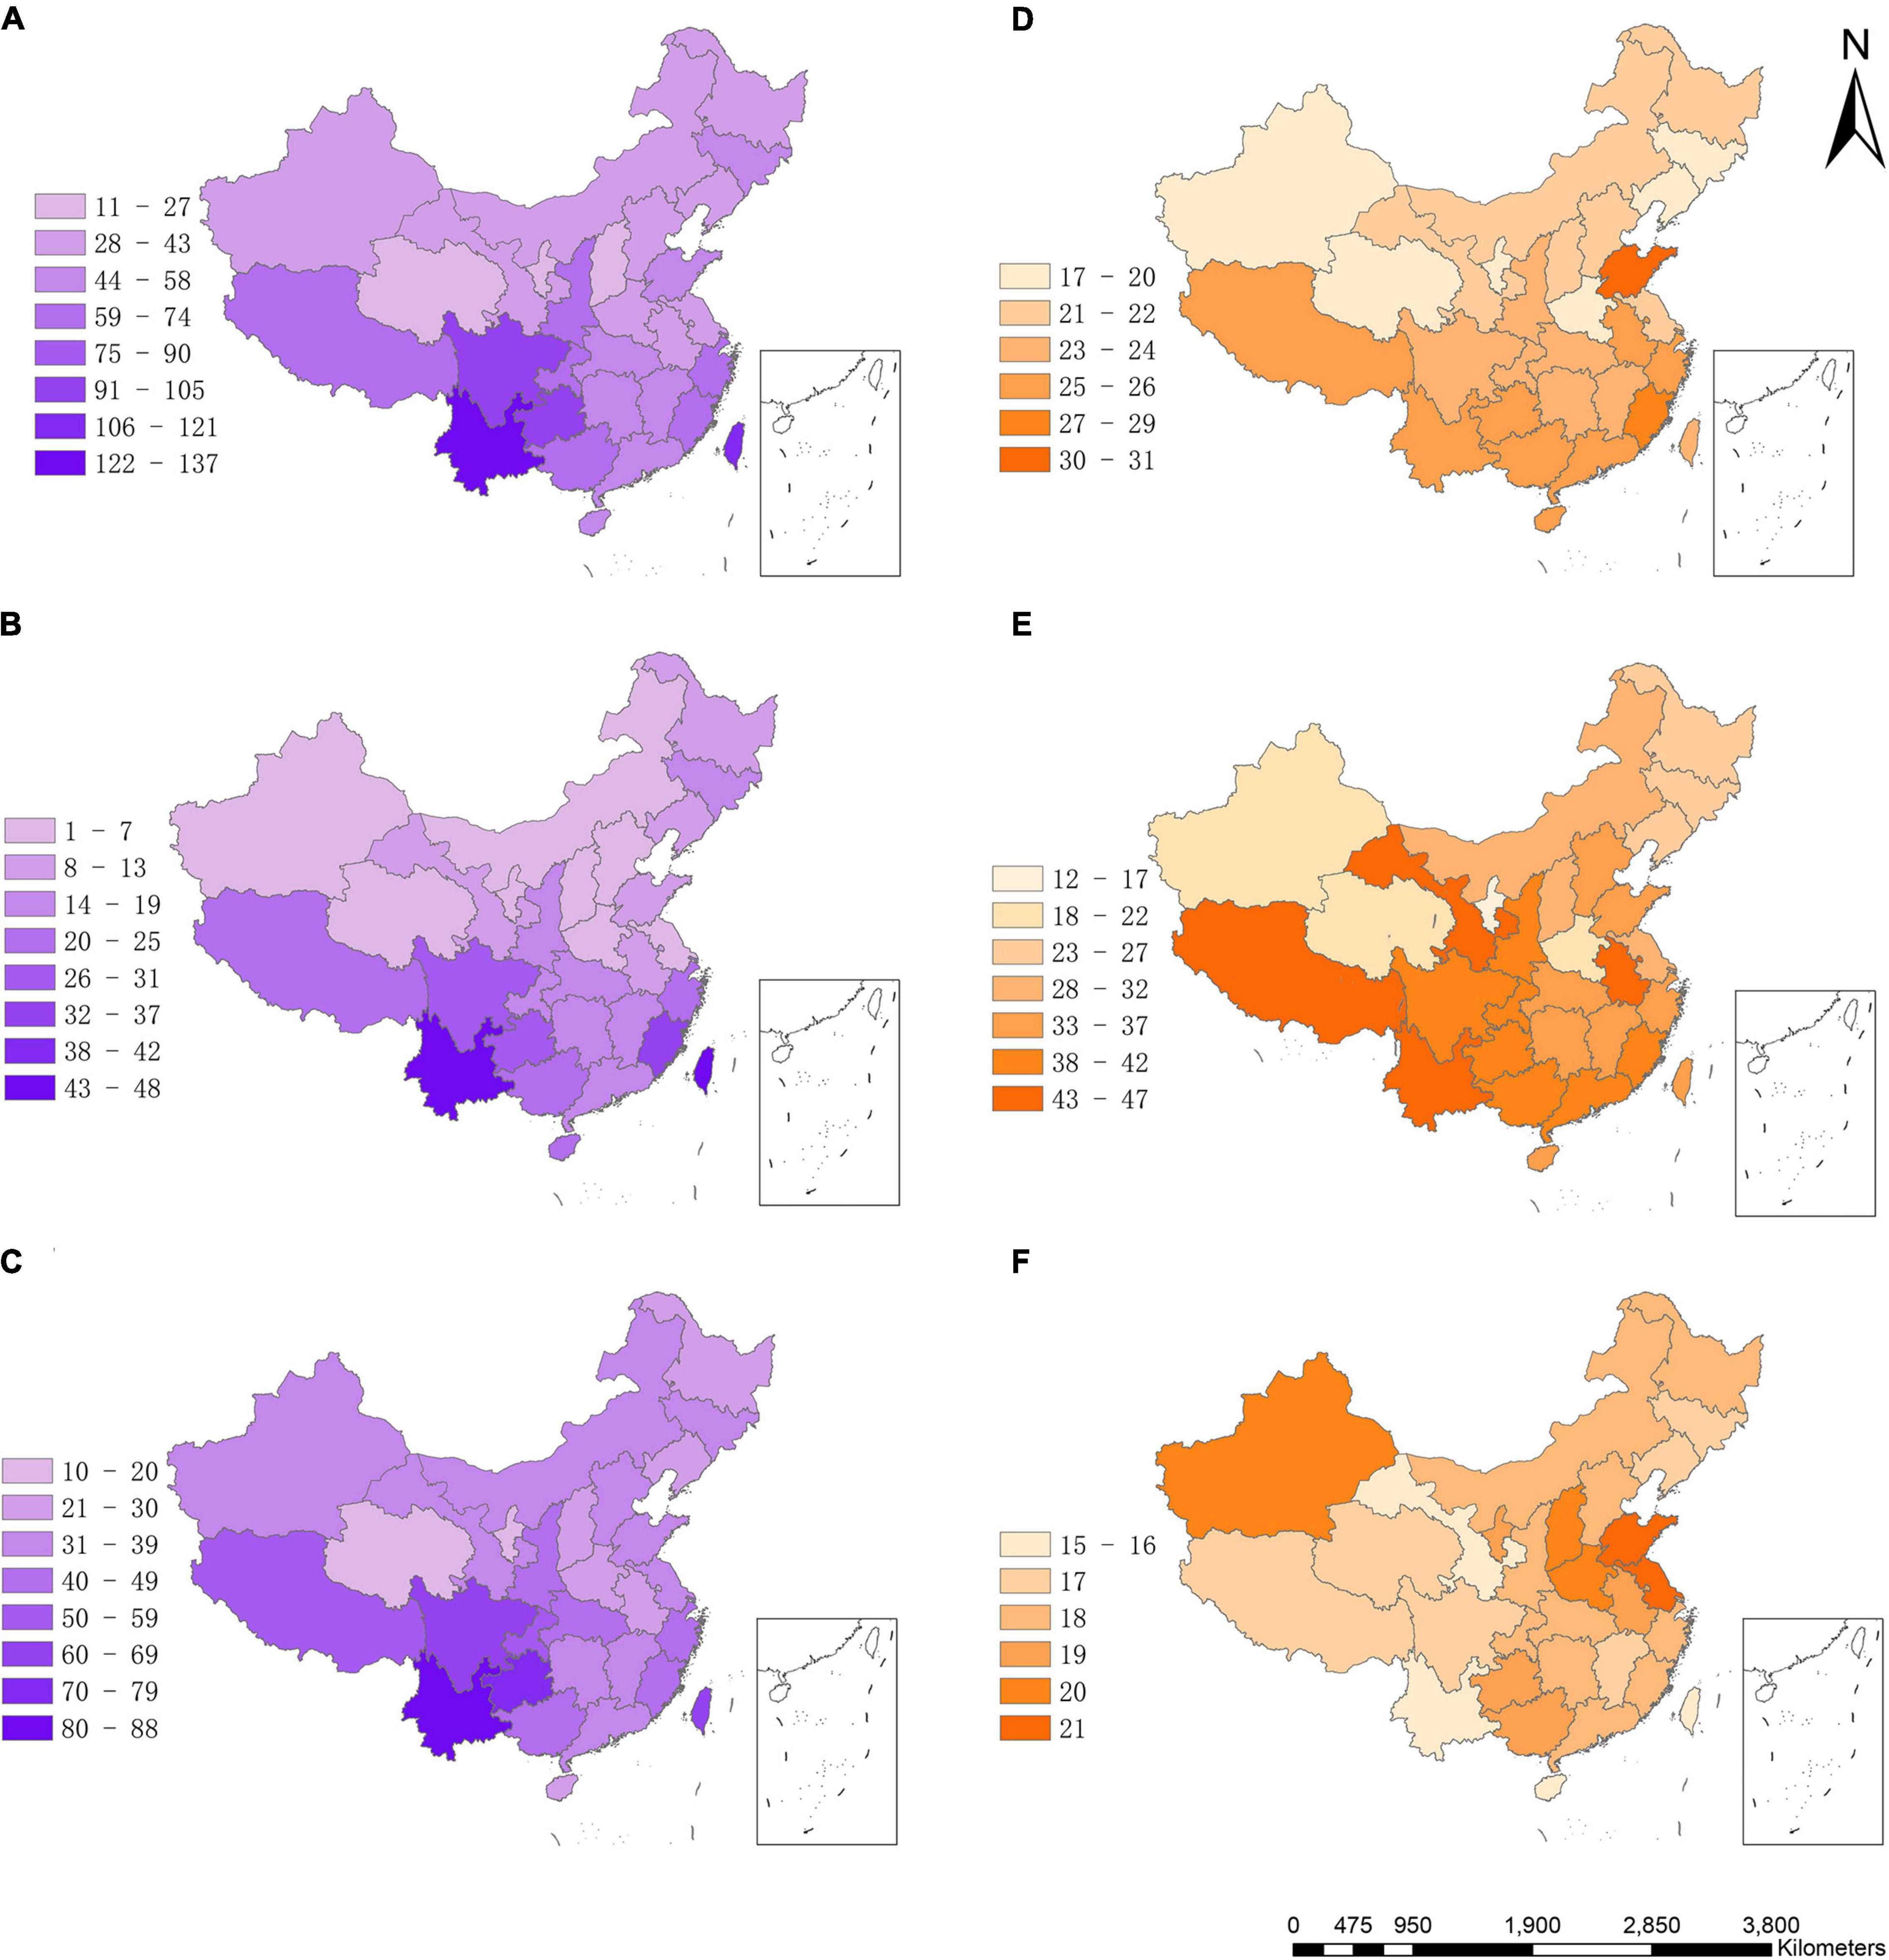
Figure 1. Geographic pattern of species richness and species differentiation rate of bryophytes in China. (A) Species richness of all bryophytes, (B) species richness of liverworts, (C) species richness of mosses, (D) diversification rates of all bryophytes, (E) diversification rates of liverworts, (F) diversification rates. Species richness = number of species/ln area.
Effects of MSG on Species Richness Pattern
The geographic pattern of MSG for all bryophytes was roughly coincided with its species richness pattern (Figure 1D). MSG for liverworts and mosses showed very different geographic patterns (Figures 1E,F). Species richness of all bryophytes significantly increased with the increase of MSG, either in univariate GLM analysis (R2 = 0.40, p < 0.0001, Figure 2A) or path analysis (path coefficient = 0.43, p < 0.05, Figure 3A), indicating that provinces with high species richness of all bryophytes were dominated by species from lineages with particularly high MSG. Consistent with bryophytes, the species richness of liverworts was significantly increased with MSG (univariate GLM analysis R2 = 0.47, p < 0.0001, Figure 2B; path coefficient = 0.37, p < 0.001, Figure 3B). However, the species richness of mosses was insignificantly decreased MSG in univariate GLM analysis (R2 = 0.11, p = 0.14; Figure 2C) or insignificantly increased with MSG in path analysis (path coefficient = 0.13, p > 0.05, Figure 3C).
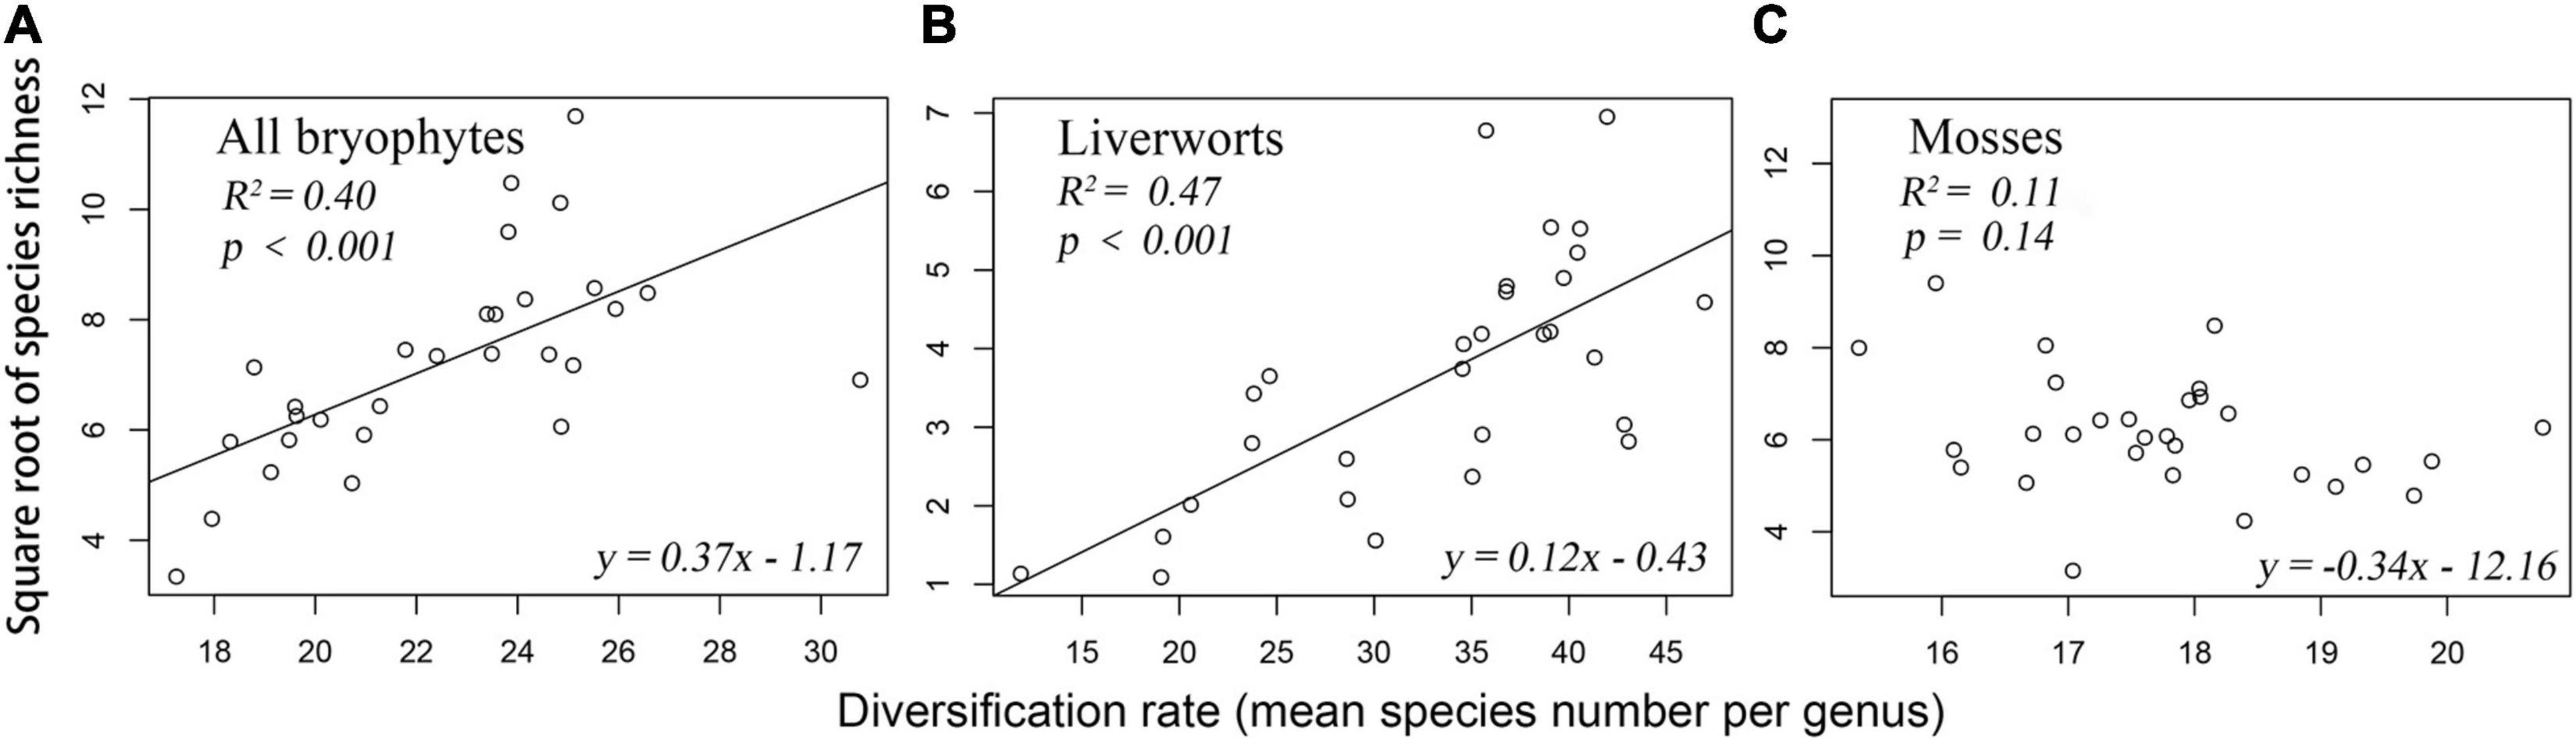
Figure 2. Relationship between species richness and diversification rates of bryophyte. (A) All bryophytes (B) Liverworts (C) Mosses.
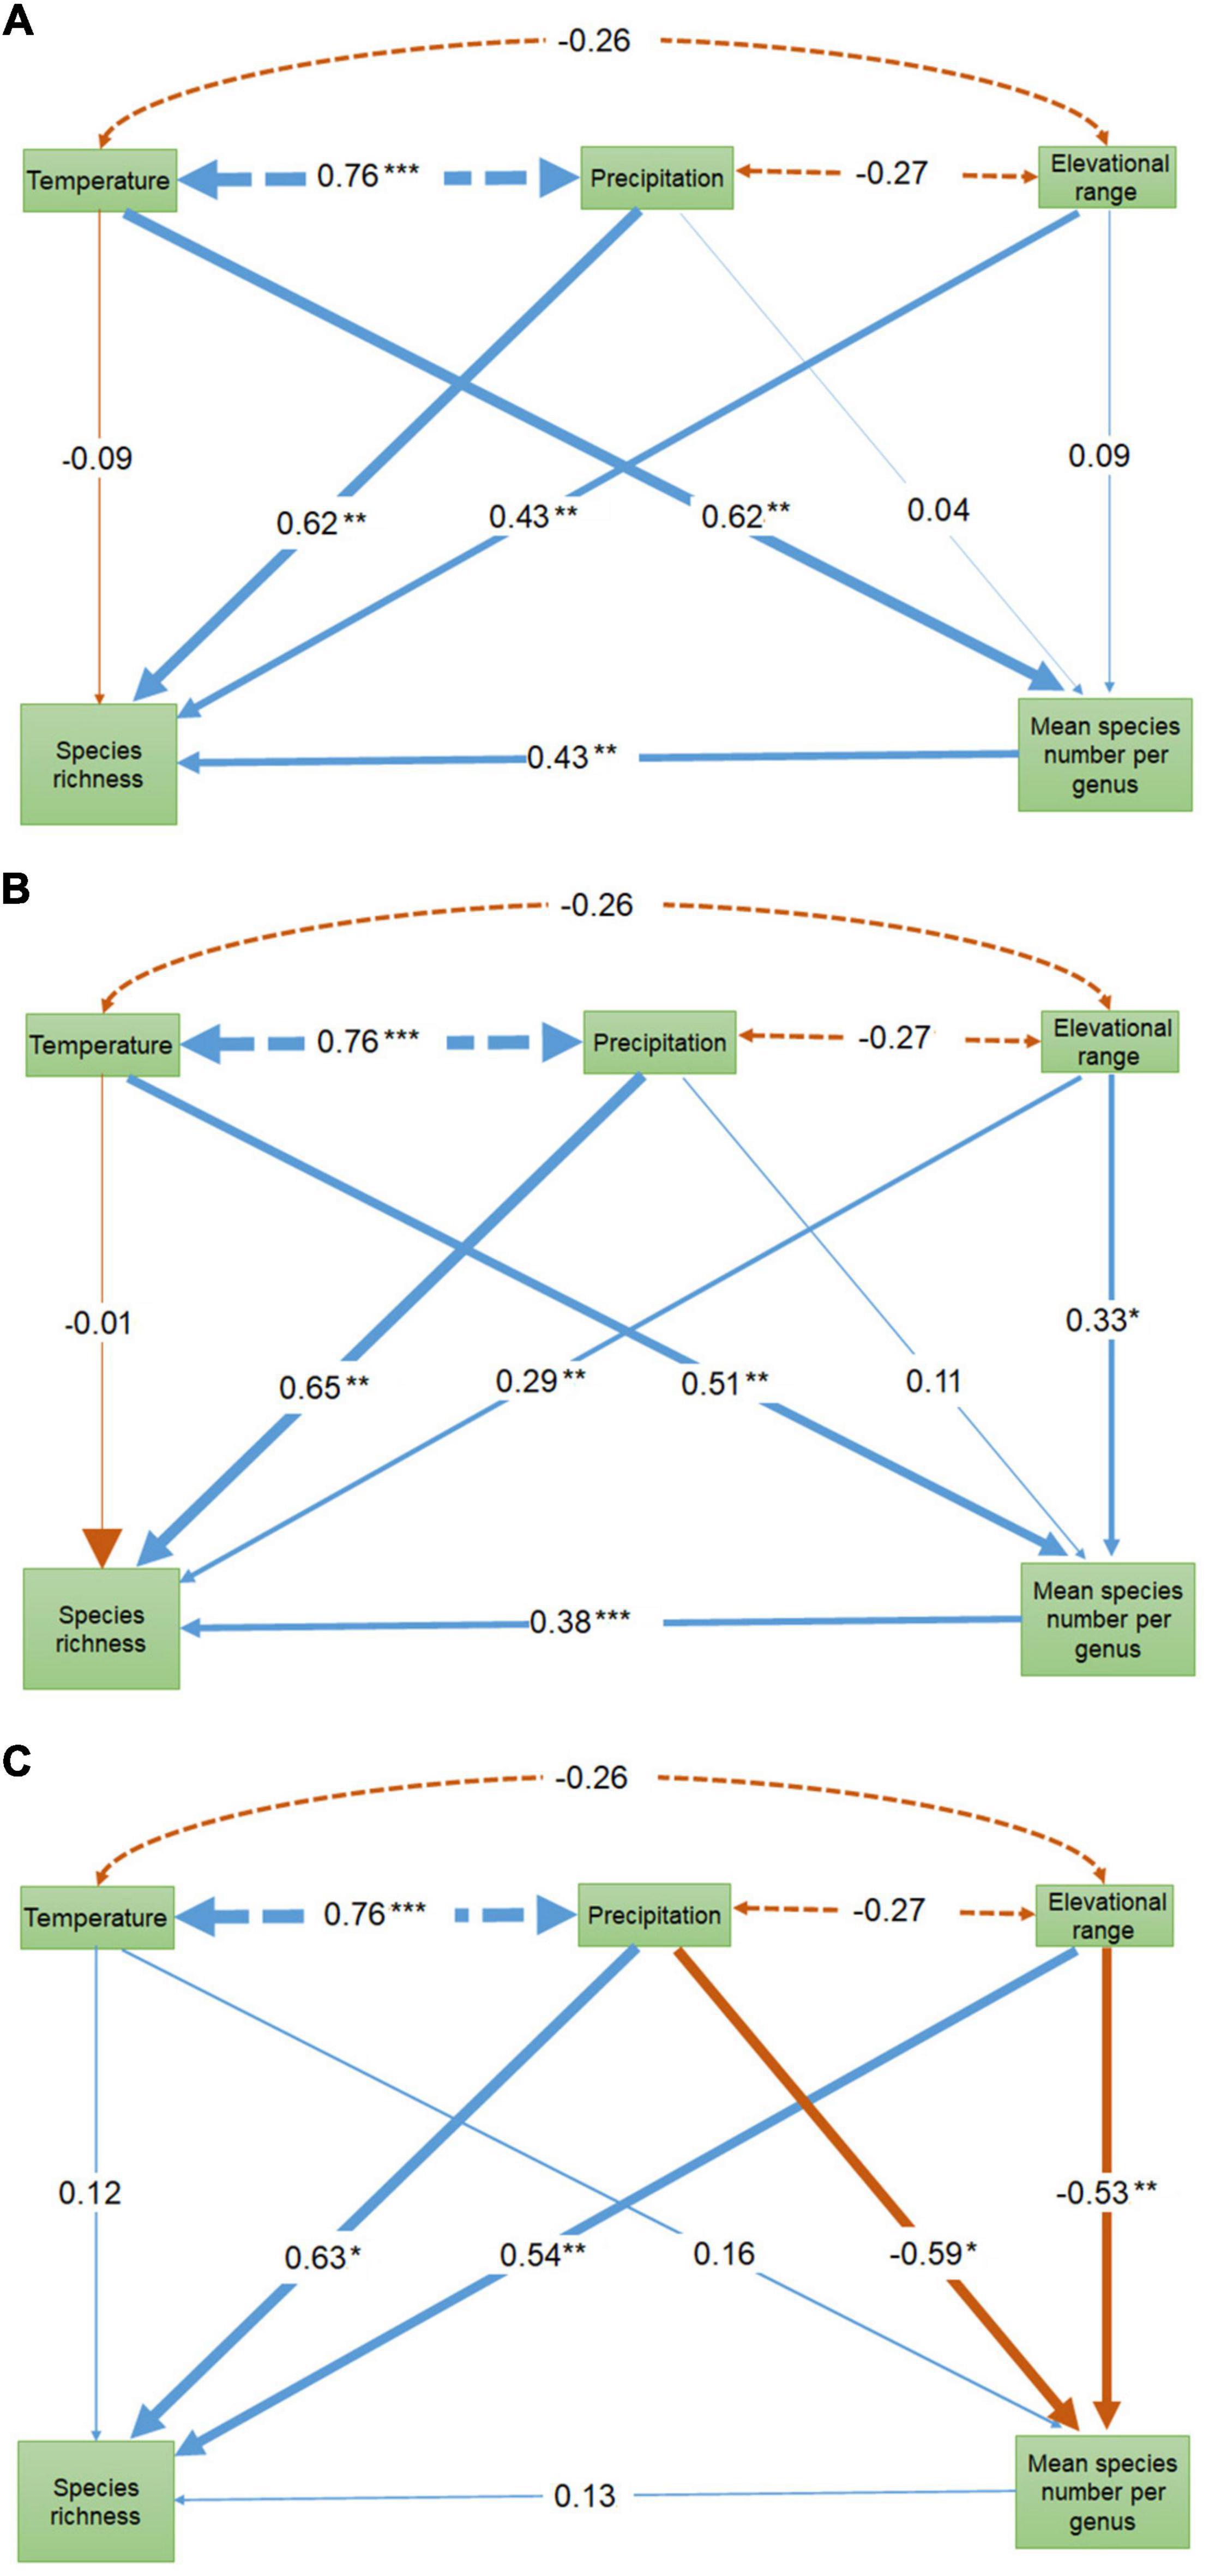
Figure 3. Path diagram showing the interaction among the geographical patterns of temperature, precipitation, elevational range, mean number of species per genus and species richness. The values on the arrows are standardized path coefficients. Blue arrows indicate positive relationships and red values negative relationships. The line thickness of arrows represents the strength of the relationships. The dashed arrows show the Pearson correlation between temperature, precipitation and elevational range. Temperature and precipitation were estimated as the average temperature of the coldest season and the precipitation of the warmest season, respectively. *indicates p < 0.1, **p < 0.05, ***p < 0.001. (A) All bryophytes (B) Liverworts (C) Mosses.
Effects of Climatic Factor on Species Richness Pattern and MSG
For all bryophytes, both species richness and MSG significantly increased with the increase in energy and water availability (p < 0.05; Supplementary Figure 2), indicating that both species richness and MSG were higher in warm and wet environment. These relationships were generally consistent with the predictions from the diversification rate hypothesis. The results for liverworts and mosses were quite different. Generally consistent with results for all bryophytes, both species richness and MSG of liverworts increased with the increase in energy and water availability except (Supplementary Figure 2). In contrast, for mosses, the species richness significantly increased with the increase of energy and water availability, while MSG insignificantly decreased with the increase of energy and water availability (Supplementary Figure 2). There was a high number of moss genus containing one single species in southern China (Supplementary Figure 3). Genus containing single species of mosses significantly increased with the increase of the PWQ (R2 = 0.17, p = 0.04) and elevational range (R2 = 0.29, p = 0.003), and insignificantly increased with the increase of the average temperature of TCQ (R2 = 0.03, p = 0.40). These results for mosses were inconsistent with the prediction of diversification rate hypothesis.
Multiple regressions and model average analyses showed that PWQ and elevational range had the highest effects on species richness of bryophytes, liverworts or mosses (Table 1). TCQ was the primary determinant of the MSG of all bryophytes and liverworts. The PWQ and elevational range were important predictors for MSG of mosses (Table 1). Both univariate and multiple regressions showed that explanatory powers of environmental variables on the species richness of mosses were lower than those of liverworts.
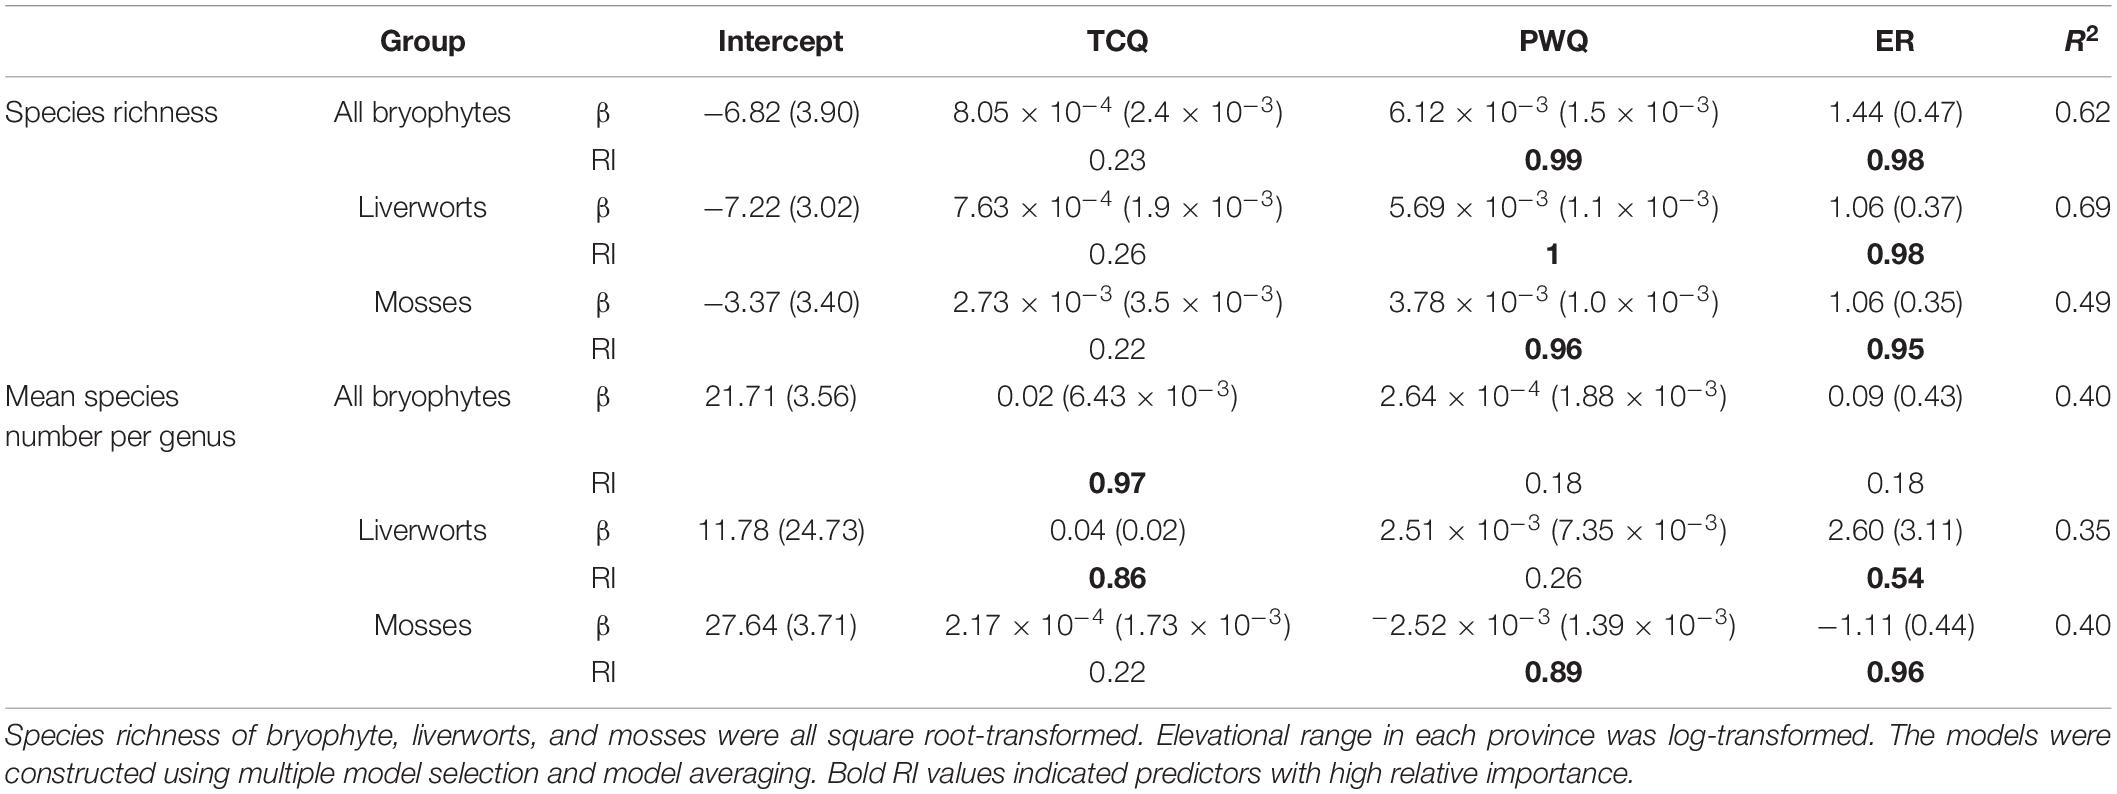
Table 1. Multiple regression between species richness and diversification rate of all bryophytes, liverworts and mosses at province level (response variables) and the average temperature of the coldest season (TCQ), the precipitation of the warmest season (PWQ), and the elevational range (ER) showing the estimated coefficients (ß), standard error, relative importance (RI) and R2.
Effects of Elevational Range on Species Richness Pattern and MSG
Univariate GLM analyses showed insignificant effects and low explanatory powers of elevational range both on species richness pattern and MSG for all bryophytes, liverworts or mosses (R2 < 0.1, p > 0.05), except MSG for mosses (R2 = 0.18, p = 0.02) (Supplementary Figure 2). When considering the other explanatory variables in multiple regressions, elevational range showed high relative importance on species richness pattern of all bryophytes, liverworts or mosses (importance value 0.95–0.98, Table 1). Path analyses showed that species richness significantly increased with the increase of elevational range on (path coefficients = 0.29–0.54, p < 0.1, Figure 3). Path analyses also showed that significant positive relationship between MSG and elevational range for liverworts (path coefficients = 0.33, p < 0.1), and significantly negative relationship between MSG and elevational range for mosses (path coefficients = −0.53, p < 0.05, Figure 3).
Discussion
The Support for the Diversification Rate Hypothesis Differed Between Liverworts and Mosses
The species richness of all bryophytes in China showed a clear latitudinal gradient (i.e., higher species richness in low latitudes than in high latitudes). Similar trend also was also reported for woody plants in China and eastern Asia by previous studies (Wang et al., 2011; Su et al., 2020). In addition, we found that the geographical patterns of liverworts and mosses are quite similar. However, the evolutionary mechanisms underlying those patterns seem to be different. We found a positive relationship between the species richness pattern and MSG, a measure of recent net diversification, per province for all bryophytes and liverworts. This finding indicates that the regions with high species richness are mainly inhabited by bryophytes (especially liverworts) with high recent net diversification rate, and therefore is generally consistent with the diversification rate hypothesis. Similar positive relationship between species richness pattern and net diversification rate have also been reported for other plant groups (e.g., Arecaceae in the New World, Svenning et al., 2008; global Rhododendron, Shrestha et al., 2018; global Zygophyllaceae, Wang et al., 2018). We also found that MSG of all bryophytes tended to be high in warm and wet regions at low latitude. The high MSG in warm and wet climate may reflect the greater ecological success of bryophytes, especially liverworts in tropical climate, or increase of individual number in tropical climate which favor low extinction rate and high speciation rate (Hubbell, 2001; Svenning et al., 2008). In addition, this trend may result from the high recent speciation rates due to faster molecular evolution and increased biotic interaction in tropical climates (Mittelbach et al., 2007; Goldie et al., 2010). This is consistent with previous findings of Laenen et al. (2018), that tropical genera of liverworts have higher diversification rates and younger ages than temperate liverworts.
In contrast of the results of liverworts and all bryophytes, we found an insignificantly relationship between species richness pattern and MSG of mosses (Figures 2C, 3C), suggesting that the high moss species richness in southern China is not likely the outcome of the recent high diversification. Furthermore, we found negative relationships between MSG of mosses and water availability and elevational range. First, the slightly high MSG in northern China may reflect that many lineages of mosses such as Grimmia, Syntrichia, and Tortula with fairly strong desiccation tolerance are well adapted to dry climate (Vitt et al., 2014). Some taxa have enhanced their drought tolerance with a suite of adaptive structures, such as leaf hair points and papillae which facilitate water retention and dew formation (Tao and Zhang, 2012; Vitt et al., 2014; Wu et al., 2014). In addition, a series of physiological mechanisms such as high content of non-reducing sugars and effective antioxidant allowing them to survive after rapid desiccation (Proctor et al., 2007). Those adaptabilities to dry climate of mosses may help them decrease the extinction rates and/or increase speciation rate in northern China. Second, those results for mosses are consistent with the prediction of time-for-speciation hypothesis. Humid mountainous areas of southern China may retain many ancient relict mosses with low diversification rates, therefore decreased the diversification rate there. We found that many mountainous provinces with a humid climate such as Yunnan, Sichuan, Xizang, Guizhou, Fujian, Taiwan have a large number of monotypic moss genera (Supplementary Figure 3). Future studies are required to reveal whether those monotypic genera are old as expected by time-for-speciation hypothesis.
A More Important Role of Water Availability Than Temperature
The univariate GLM, multiple regression and path analyses consistently showed that water availability related variable PWQ was the more important than energy-related variable TCQ in affecting the species richness of all bryophytes, liverworts or mosses. These findings consistent with previous studies on bryophytes conducted in Macaronesian Island (Aranda et al., 2014) and in China (Qian and Chen, 2016). Bryophytes are early landplants, and water availability is the primary limiting factor for the survival, growth and reproduction (Vitt et al., 2014; Sakakibara, 2016). First, as the poikilohydric plant, bryophyte have no vascular tissues to transport waters. Therefore, the water content of bryophyte is directly regulated by ambient humidity, and most species rely on atmospheric precipitation to absorb water (Patiño and Vanderpoorten, 2018). Although bryophytes have evolved a certain degree of dehydration tolerance, long-term lack of water will cause them to dry and dormant and unable to perform normal physiological activities (Proctor et al., 2007). Second, the dispersal of bryophytes is primarily driven by spores, and the process of sexual reproduction and spore germination must depend on water (Proctor et al., 2007; Aranda et al., 2014).
In this study, we found a relative low importance of TCQ in regulating species richness pattern of bryophytes, which is in contrast with the previous finding that TCQ is the strongest predictors on species richness pattern of woody species in China (Wang et al., 2011). Those results probably reflected that bryophytes (especially mosses) have considerable cold tolerance compared with woody plants. Most mosses can grow at low temperature, and they still have net photosynthetic capacity even at relatively low temperatures (Patiño and Vanderpoorten, 2018). At the same time, the increase of the concentration of intracellular solute (such as soluble sugar) in cells of mosses decreased the intracellular freezing point (Nagao et al., 2006), which helps to prevent the formation of internal crystals and avoid the destruction of cell structure by freezing. These all increase the ability of mosses to tolerate low temperatures even in glacier. Liverworts showed stronger richness-water availability relationship and richness-energy relationship than mosses, which were consistent with the results of the previous studies (Aranda et al., 2014; Qian and Chen, 2016). This probably reflected that mosses generally have stronger cold and dry tolerance than liverworts.
The Importance of Habitat Heterogeneity
Multiple regressions and path analyses showed that elevational range is also an important contributor to the geographic pattern of bryophyte species richness, suggesting that provinces with high habitat heterogeneity hold more bryophytes. Firstly, mountains have strengthened the geographical isolation within species, therefore promoted the speciation rate (Tang et al., 2006; Xing and Ree, 2017). That is, mountains are “cradles” of biodiversity. In this study, we found that elevational range have a positive influence on the geographic pattern of MSG of liverworts, suggesting that habitat heterogeneity in mountains facilitated the recent speciation of liverworts. Secondly, mountainous areas serve as biological refuges, reducing the extinction of species. Bryophytes are very sensitive to environmental changes (Gignac, 2001). Mountain areas with diverse habitats may preserve many ancient and relict species of mosses, resulting in a lower MSG. This also explains why MSG of mosses and elevational range show a significant negative correlation (Supplementary Figure 2). Finally, path analysis also showed a significant direct effect of elevational ranges on species richness. This probably reflected that regions with high elevational range provided the diversified local climates, vegetation types and soil conditions (Stein et al., 2014), therefore creating more ecological niches for coexistence of more bryophytes. In addition, the effect may also involve the other evolutionary processes induced by habitat heterogeneity which are not considered in this analysis.
Conclusion
In this study, we found that the geographical pattern of liverwort richness in China is significantly associated with the high recent diversification rate (estimated by MSG) in warm, wet and humid mountain areas. In contrast, for mosses, the geographical pattern of species richness in China is not well-explained by the MSG patterns, and the MSG are low in humid mountains where monotypic and oligotypic genera are abundant. Our study suggests the humid tropical and subtropical mountains in China as not only diversity hotspots for bryophytes, but also cradles for high recent diversification of liverworts, and refuges for mosses to hold many monotypic and oligotypic genera. Our study provided important information on ecological and evolutionary causes of geographical pattern of bryophyte richness. However, the conclusions drawn in our study call for further tests especially using evolutionary information (e.g., evolutionary rates and evolutionary age) obtained from dated phylogeny of bryophytes in the future.
Data Availability Statement
The original contributions presented in the study are included in the article/Supplementary Material, further inquiries can be directed to the corresponding author/s.
Author Contributions
QW conceived and designed the study. WF, QW, XSo, and XC compiled the data. QW and XSo analyzed the data and led the writing. All authors contributed to the writing and agreed to be accountable for all aspects of the work.
Funding
This work was supported by the National Key Research and Development Program of China (2019YFC0507501), Research on Theories and Methods of Evaluating the Outflow Risk of Important Wild Plant Genetic Resources (19-02), the National Natural Science Foundation of China (81603236 and 41771054), and the Fundamental Research Funds for the Central Public Welfare Research Institutes (ZZ13-YQ-087).
Conflict of Interest
The authors declare that the research was conducted in the absence of any commercial or financial relationships that could be construed as a potential conflict of interest.
Acknowledgments
We thank all bryologists in China who shared the data for this study.
Supplementary Material
The Supplementary Material for this article can be found online at: https://www.frontiersin.org/articles/10.3389/fevo.2021.680318/full#supplementary-material
Footnotes
References
Allen, A. P., Brown, J. H., and Gillooly, J. F. (2002). Global biodiversity, biochemical kinetics, and the energetic-equivalence rule. Science 297, 1545–1548. doi: 10.1126/science.1072380
Allen, A. P., Gillooly, J. F., Savage, V. M., and Brown, J. H. (2006). Kinetic effects of temperature on rates of genetic divergence and speciation. Proc. Natl. Acad. Sci. U.S.A. 103, 9130–9135. doi: 10.1073/pnas.0603587103
Aranda, S. C., Gabriel, R., Borges, P. A., Santos, A. M., de Azevedo, E. B., Patiño, J., et al. (2014). Geographical, temporal and environmental determinants of bryophyte species richness in the Macaronesian Islands. PLoS One 9:e101786. doi: 10.1371/journal.pone.0101786
Bartoń, K. (2020). MuMIn: Multi-Model Inference. Available online at: https://CRAN.R-project.org/package=MuMIn. (accessed January 15, 2021)
Cai, T., Shao, S., Kennedy, J. D., Alström, P., Moyle, R. G., Qu, Y., et al. (2020). The role of evolutionary time, diversification rates and dispersal in determining the global diversity of a large radiation of passerine birds. J. Biogeogr. 47, 1612–1625. doi: 10.1111/jbi.13823
Cannone, N., Corinti, T., Malfasi, F., Gerola, P., Vianelli, A., Vanetti, I., et al. (2017). Moss survival through in situ cryptobiosis after six centuries of glacier burial. Sci. Rep. 7, 1–7. doi: 10.1038/s41598-017-04848-6
Chen, S. B., Slik, F., Gao, J., Mao, L. F., Bi, M. J., Shen, M. W., et al. (2015). Latitudinal diversity gradients in bryophytes and woody plants: Roles of temperature and water availability. J. Syst. Evol. 53, 535–545. doi: 10.1111/jse.12158
Clarke, A., and Gaston, K. J. (2006). Climate, energy and diversity. Proc. R. Soc. B 273, 2257–2266. doi: 10.1098/rspb.2006.3545
Clifford, P., Richardson, S., and Hemon, D. (1989). Assessing the significance of the correlation between two spatial processes. Biometrics 45, 123–134. doi: 10.2307/2532039
Condamine, F. L., Sperling, F. A. H., Wahlberg, N., Rasplus, J. Y., and Kergoat, G. J. (2012). What causes latitudinal gradients in species diversity? Evolutionary processes and ecological constraints on swallowtail biodiversity. Ecol. Lett. 15, 267–277. doi: 10.1111/j.1461-0248.2011.01737.x
Currie, D. J., Mittelbach, G. G., Cornell, H. V., Field, R., Guegan, J. F., Hawkins, B. A., et al. (2004). Predictions and tests of climate-based hypotheses of broad-scale variation in taxonomic richness. Ecol. Lett. 7, 1121–1134. doi: 10.1111/j.1461-0248.2004.00671.x
Dagallier, L. P. M., Janssens, S. B., Dauby, G., Blach−Overgaard, A., Mackinder, B. A., Droissart, V., et al. (2020). Cradles and museums of generic plant diversity across tropical Africa. New Phytol. 225, 2196–2213. doi: 10.1111/nph.16293
Dutilleul, P., Clifford, P., Hemon, D., and Richardson, S. (1993). Modifying the t-test for assessing the correlation between two spatial processes. Biometreics 49, 305–314. doi: 10.2307/2532625
Dynesius, M., and Jansson, R. (2000). Evolutionary consequences of changes in species’ geographical distributions driven by Milankovitch climate oscillations. Proc. Natl. Acad. Sci. U.S.A. 97, 9115–9120. doi: 10.1073/pnas.97.16.9115
Fischer, A. G. (1960). Latitudinal Variations In Organic Diversity. Evolution 14, 64–81. doi: 10.2307/2405923
Fjeldsa, J., Bowie, R. C. K., and Rahbek, C. (2012). The role of mountain ranges in the diversification of birds. Annu. Rev. Ecol. Evol. Syst. 43, 249–265. doi: 10.1146/annurev-ecolsys-102710-145113
Gignac, L. D. (2001). Bryophytes as indicators of climate change. Bryologist 104, 410–420. doi: 10.1639/0007-27452001104[0410:BAIOCC]2.0.CO;2
Goldie, X., Gillman, L., Crisp, M., and Wright, S. (2010). Evolutionary speed limited by water in arid Australia. Proc. R. Soc. B 277, 2645–2653. doi: 10.1098/rspb.2010.0439
Hawkins, B. A., Diniz-Filho, J. A. F., and Soeller, S. A. (2005). Water links the historical and contemporary components of the Australian bird diversity gradient. J. Biogeogr. 32, 1035–1042. doi: 10.1111/j.1365-2699.2004.01238.x
Hijmans, R. J., Cameron, S. E., Parra, J. L., Jones, P. G., and Jarvis, A. (2005). Very high resolution interpolated climate surfaces for global land areas. Int. J. Climatol. 25, 1965–1978. doi: 10.1002/joc.1276
Hubbell, S. P. (2001). The unified neutral theory of biodiversity and biogeography. Princeton: Princeton University Press.
Hughes, C. E., and Atchison, G. W. (2015). The ubiquity of alpine plant radiations: from the Andes to the Hengduan Mountains. New Phytol. 207, 275–282. doi: 10.1111/nph.13230
Jablonski, D., Roy, K., and Valentine, J. W. (2006). Out of the tropics: evolutionary dynamics of the latitudinal diversity gradient. Science 314, 102–106. doi: 10.1126/science.1130880
Kozak, K., and Wiens, J. (2016). Testing the relationships between diversification, species richness, and trait evolution. Syst. Bot. 65, 975–988.
Laenen, B., Patino, J., Hagborg, A., Desamore, A., Wang, J., Shaw, A. J., et al. (2018). Evolutionary origin of the latitudinal diversity gradient in liverworts. Mol. Phylogenet. Evol. 127, 606–612. doi: 10.1016/j.ympev.2018.06.007
Laenen, B., Shaw, B., Schneider, H., Goffinet, B., Paradis, E., Desamore, A., et al. (2014). Extant diversity of bryophytes emerged from successive post-Mesozoic diversification bursts. Nat. Commun. 5:5134. doi: 10.1038/ncomms6134
Liu, Y., Johnson, M. G., Cox, C. J., Medina, R., Devos, N., Vanderpoorten, A., et al. (2019). Resolution of the ordinal phylogeny of mosses using targeted exons from organellar and nuclear genomes. Nat. Commun. 10, 1–11. doi: 10.1038/s41467-019-09454-w
Mittelbach, G. G., Schemske, D. W., Cornell, H. V., Allen, A. P., Brown, J. M., Bush, M. B., et al. (2007). Evolution and the latitudinal diversity gradient: speciation, extinction and biogeography. Ecol. Lett. 10, 315–331. doi: 10.1111/j.1461-0248.2007.01020.x
Nagao, M., Oku, K., Minami, A., Mizuno, K., Sakurai, M., Arakawa, K., et al. (2006). Accumulation of theanderose in association with development of freezing tolerance in the moss Physcomitrella patens. Phytochemistry 67, 702–709. doi: 10.1016/j.phytochem.2006.01.031
Osorio, F., Vallejos, R., Cuevas, F., and Mancilla, D. (2020). SpatialPack: Tools for assessment the association between two spatial processes. Available online at: https://CRAN.R-project.org/package=SpatialPack. (accessed January 15, 2021)
Patiño, J., and Vanderpoorten, A. (2018). Bryophyte biogeography. Crit. Rev. Plant Sci. 37, 175–209. doi: 10.1080/07352689.2018.1482444
Perera-Castro, A. V., Flexas, J., González-Rodríguez, ÁM., and Fernández-Marín, B. (2020). Photosynthesis on the edge: photoinhibition, desiccation and freezing tolerance of Antarctic bryophytes. Photosynth. Res. 2020, 1–19. doi: 10.1007/s11120-020-00785-0
Proctor, M., Oliver, M., Wood, A., Alpert, P., Stark, L., Cleavitt, N. L., et al. (2007). Desiccation-tolerance in bryophytes: a review. Bryologist 110, 595–621. doi: 10.1639/0007-27452007110[595:DIBAR]2.0.CO;2
Qian, H., and Chen, S. B. (2016). Reinvestigation on species richness and environmental correlates of bryophytes at a regional scale in China. J. Plant Ecol. 9, 734–741. doi: 10.1093/jpe/rtw001
Rana, S. K., Price, T. D., and Qian, H. (2019). Plant species richness across the Himalaya driven by evolutionary history and current climate. Ecosphere 10:e02945. doi: 10.1002/ecs2.2945
Rohde, K. (1992). Latitudinal gradients in species diversity: the search for the primary cause. Oikos 1992, 514–527. doi: 10.2307/3545569
Rosenzweig, M. L. (1995). Species diversity in space and time. Cambridge, MA: Cambridge University Press.
Rosseel, Y., Jorgensen, T., Rockwood, N., Oberski, D., Byrnes, J., Vanbrabant, L., et al. (2021). lavaan: Latent variable analysis. Available online at: https://CRAN.R-project.org/package=lavaan. (accessed January 15, 2021)
Sakakibara, K. (2016). Technological innovations give rise to a new era of plant evolutionary developmental biology. Adv. Bot. Res. 78, 3–35. doi: 10.1016/bs.abr.2016.01.001
Shrestha, N., Wang, Z. H., Su, X. Y., Xu, X. T., Lyu, L. S., Liu, Y. P., et al. (2018). Global patterns of Rhododendron diversity: The role of evolutionary time and diversification rates. Glob. Ecol. Biogeogr. 27, 913–924. doi: 10.1111/geb.12750
St Martin, P., and Mallik, A. U. (2017). The status of non-vascular plants in trait-based ecosystem function studies. Perspect. Plant Ecol. Evol. Syst. 27, 1–8. doi: 10.1016/j.ppees.2017.04.002
Stein, A., Gerstner, K., and Kreft, H. (2014). Environmental heterogeneity as a universal driver of species richness across taxa, biomes and spatial scales. Ecol. Lett. 17, 866–880. doi: 10.1111/ele.12277
Steinbauer, M. J., Field, R., Grytnes, J. A., Trigas, P., Ah−Peng, C., Attorre, F., et al. (2016). Topography−driven isolation, speciation and a global increase of endemism with elevation. Glob. Ecol. Biogeogr. 25, 1097–1107. doi: 10.1111/geb.12469
Stephens, P. R., and Wiens, J. J. (2003). Explaining species richness from continents to communities: the time-for-speciation effect in emydid turtles. Am. Nat. 161, 112–128. doi: 10.1086/345091
Su, X., Shrestha, N., Xu, X., Sandanov, D., Wang, Q., Wang, S., et al. (2020). Phylogenetic conservatism and biogeographic affinity influence woody plant species richness–climate relationships in eastern Eurasia. Ecography 43, 1027–1040. doi: 10.1111/ecog.04839
Svenning, J. C., Borchsenius, F., Bjorholm, S., and Balslev, H. (2008). High tropical net diversification drives the New World latitudinal gradient in palm (Arecaceae) species richness. J. Biogeogr. 35, 394–406. doi: 10.1111/j.1365-2699.2007.01841.x
Tang, Z. Y., Wang, Z. H., Zheng, C. Y., and Fang, J. Y. (2006). Biodiversity in China’s mountains. Front. Ecol. Environ. 4:347–352. doi: 10.1890/1540-92952006004[0347:BICM]2.0.CO;2
Tao, Y., and Zhang, Y. M. (2012). Effects of leaf hair points of a desert moss on water retention and dew formation: implications for desiccation tolerance. J. Plant Res. 125, 351–360. doi: 10.1007/s10265-011-0449-3
Turner, J. R. G. (2004). Explaining the global biodiversity gradient: energy, area, history and natural selection. Basic Appl. Ecol. 5, 435–448. doi: 10.1016/j.baae.2004.08.004
Vitt, D., Crandall-Stotler, B., and Wood, A. (2014). “Bryophytes: survival in a dry world through tolerance and avoidance,” in Plant Ecology and Evolution in Harsh Environments, eds N. Rajakaruna, R. Boyd, and T. Harris (New York, NY: Nova Publishers), 267–295.
Wang, Z., Fang, J., Tang, Z., and Lin, X. (2011). Patterns, determinants and models of woody plant diversity in China. Proc. R. Soc. B 278, 2122–2132. doi: 10.1098/rspb.2010.1897
Wang, Q., Wu, S., Su, X., Zhang, L., Xu, X., Lyu, L., et al. (2018). Niche conservatism and elevated diversification shape species diversity in drylands: evidence from Zygophyllaceae. Proc. R. Soc. B 285:1742. doi: 10.1098/rspb.2018.1742
Wu, N., Zhang, Y. M., Downing, A., Aanderud, Z. T., Tao, Y., and Williams, S. (2014). Rapid adjustment of leaf angle explains how the desert moss, Syntrichia caninervis, copes with multiple resource limitations during rehydration. Funct. Plant Biol. 1, 168–177. doi: 10.1071/FP13054
Keywords: liverworts, mosses, net diversification rate hypothesis, mountains, climate
Citation: Song X, Fang W, Chi X, Shao X and Wang Q (2021) Geographic Pattern of Bryophyte Species Richness in China: The Influence of Environment and Evolutionary History. Front. Ecol. Evol. 9:680318. doi: 10.3389/fevo.2021.680318
Received: 14 March 2021; Accepted: 19 May 2021;
Published: 15 June 2021.
Edited by:
Xiaoting Xu, Sichuan University, ChinaReviewed by:
Gang Feng, Inner Mongolia University, ChinaJihong Huang, Research Institute of Forest Ecology, Environment and Protection, Chinese Academy of Forestry, China
Copyright © 2021 Song, Fang, Chi, Shao and Wang. This is an open-access article distributed under the terms of the Creative Commons Attribution License (CC BY). The use, distribution or reproduction in other forums is permitted, provided the original author(s) and the copyright owner(s) are credited and that the original publication in this journal is cited, in accordance with accepted academic practice. No use, distribution or reproduction is permitted which does not comply with these terms.
*Correspondence: Qinggang Wang, d2FuZ3FnQGNhdS5lZHUuY24=