 Zhengxue Zhao1
 Lin Yang1Jiankun Long2Zhimin Chang2Zhengxiang Zhou1Yan Zhi1Liangjing Yang1Hongxing Li1Yongjin Sui1Nian Gong1Xiaoya Wang1Xiangsheng Chen1*
- 1Provincial Special Key Laboratory for Development and Utilization of Insect Resources of Guizhou, Guizhou Key Laboratory for Agricultural Pest Management of Mountainous Region, Institute of Entomology, Guizhou University, Guiyang, China
- 2College of Animal Science, Guizhou University, Guiyang, China
Studies on endemism are always of high interest in biogeography and contribute to better understanding of the evolution of species and making conservation plans. The present study aimed to investigate the endemism patterns of planthoppers in China by delimiting centers of endemism and areas of endemism. We collected 6,907 spatial distribution records for 860 endemic planthopper species from various resources. Centers of endemism were identified using weighted endemism values at 1° grid size. Parsimony analysis of endemicity and endemicity analysis were employed to detect areas of endemism at 1°, 1.5°, and 2° grid sizes. Six centers of endemism located in mountainous areas were identified: Taiwan Island, Hainan Island, eastern Yungui Plateau, Wuyi Mountains, western Qinling Mountains, and western Yunnan. We also delimited six areas of endemism, which were generally consistent with centers of endemism. Our findings demonstrated that mountainous areas have an essential role in facilitating the high level of endemism and formation of areas of endemism in planthoppers through the combined effects of complex topography, a long-term stable environment, and geological events. Dispersal ability and distribution of host plants also have important effects on the patterns of planthoppers’ endemism.
Introduction
The geographical distribution of endemic species (i.e., restriction of a species to a particular area) represents the highest degree of historical and ecological imprint of all biological entities (Casazza et al., 2008). Moreover, endemic areas have been generally recognized as priority areas for biodiversity conservation plans (Myers et al., 2000; Lamoreux et al., 2006; Huang et al., 2010, 2016; Gomes-da-Silva et al., 2017; Zhao et al., 2020a). Therefore, studies related to patterns of endemism have always been a central topic of biogeography and biodiversity conservation (Laffan and Crisp, 2003; Orme et al., 2005; Posadas et al., 2006; Sandel et al., 2011; Huang et al., 2012; Feng et al., 2016; Li et al., 2017).
Studies on the spatial patterns of endemics often delimit the main distribution areas, and these areas are frequently described as centers of endemism (CoEs) and areas of endemism (AoEs). Although the drivers causing formation of CoEs and AoEs may show similar ecological or historical legacies (Hurdu et al., 2016), they differ because the two concepts are based on different identification methods and assumptions (Linder, 2001a). CoEs are areas including higher endemic richness or endemism than its surroundings (Crisp et al., 2001; Linder, 2001b). AoEs represent areas delimited by the congruent distribution of at least two endemic taxa (spatial homology) (Platnick, 1991; Morrone, 1994; Szumik et al., 2002). AoEs are extremely important because they can be used to design biogeographic regionalization schemes (Morrone, 2014a), to investigate organism-climate dynamics (Gámez et al., 2017), and as a priority target for conservation plans (Huang et al., 2010; Noroozi et al., 2018). Numerous biogeographers and evolutionary biologists have shown interest in evaluating the causes for the presence of CoEs and AoEs (Nelson and Platnick, 1981; Anderson, 1994; López-Pujol et al., 2011; Yuan et al., 2014; Noroozi et al., 2018).
Mountainous areas host a remarkable proportion of Earth’s biodiversity, with several species completely restricted to these areas, although these areas only account for 16.5–27% of the land area (Fjeldså et al., 2012). Half of the high biodiversity areas identified so far are mountainous areas (Kohler and Maselli, 2009). The large biodiversity in mountainous areas is associated with their dual role as “species museums” (places of especially long-term persistence) and “species cradles” (places of especially rapid speciation). Therefore, high biodiversity in mountainous areas reflects two mechanisms: enhanced speciation rates and lineage persistence (Rahbek et al., 2019). Mountain biodiversity is characterized by deep-time evolution and ecological processes, which reflect a history worth protecting (Rahbek et al., 2019).
The planthoppers, members of superfamily Fulgoroidea (Insecta: Hemiptera), are a dominant group of herbivorous insects, consisting of 13,844 species in 33 families worldwide (Bourgoin, 2021). Planthoppers are obligatory phytophagous and mainly feed on the phloem tissue of woody or herbaceous plants (Wilson, 2005). Thus, host plants might have highly impacted their distribution. The majority of species in planthoppers lack the ability to disperse over long distances, resulting in a small distribution range. This property makes it a unique and excellent model for studying biogeography (Liang, 1998). China is one of the countries that is the richest in planthoppers, with over 1,300 described species. Unfortunately, although previous studies have investigated species richness patterns in planthoppers (Zhao et al., 2020b), the understanding of patterns of endemism in China remains in its infancy. Thus, to fully understand endemism patterns of Chinese planthoppers, there is a need to compile distributional data for all endemic planthoppers species. Research on spatial patterns of endemism not only contributes to understanding the evolution of planthoppers but also for identification of priority areas of planthopper biodiversity conservation.
The aim of the present study was to propose biogeographical patterns of planthopper endemism in China using the spatial distribution data for endemic species. We focused on the following research areas: (1) identifying the CoEs and delimiting AoEs; and (2) whether or not the CoEs and AoEs in this study are located in mountainous areas, as found in previous studies (e.g., Wang et al., 2017; Noroozi et al., 2018, 2019).
Materials and Methods
Species Distribution Data
The 6,907 spatial distribution records for 860 endemic planthoppers species (only recorded in China) were collected from the literature, books, MD/Ph.D. theses, zoological records, China Knowledge Resource Integrated Database, and museum specimens (Zoological Museum, Institute of Zoology, Chinese Academy of Sciences; Institute of Entomology, Guizhou University; the insect collection of China Agricultural University, Hebei University, Nankai University and Dali University; Entomological Museum, Northwestern A & F University; Shanghai Institute of Entomology, Chinese Academy of Sciences; Tianjin Museum of Natural History; Taiwan Agricultural Research Institute). Distribution sites at the city, county, or township levels were obtained from the original source. The distribution sites containing the latitude and longitude information were used directly, and distribution sites without the latitude and longitude information were expressed by the latitude and longitude of the corresponding administrative center.
Assessing Sampling Bias and Mapping Endemism Patterns
The inventory completeness for the study region was accessed using the species accumulation curve from the incidence-based bootstrap estimators (Zhao et al., 2020b). The presence (1) or absence (0) matrix for each endemic species in each 1° grid (∼100 × 100 km) was constructed and was analyzed using EstimateS 9.1 with 100 randomizations (Colwell, 2013). To assess the completeness of the richness of each 1° grid, we fitted a linear regression using the square-root transformed number of records and number of richness per grid. Spatial autocorrelation may inflate the rate of type I error (Diniz-Filho et al., 2003), so the P-value for linear regression was reported using geographically effective degrees of freedom (Dutilleul et al., 1993), evaluated using Spatial Analysis in Macroecology 4.0 (Rangel et al., 2010). The patterns of endemism were visualized by calculating the weighted endemism values of each 1° grid. This process was conducted using Biodiverse 2.1 (Laffan et al., 2010). We defined the center of endemism, based on the criterion proposed by Crisp et al. (2001) and Linder (2001b).
Identifying Areas of Endemism
Parsimony analysis of endemicity (PAE) and endemicity analysis (EA) were used to identify AoEs. The performance of the two approaches was compared using the two criteria proposed by Escalante et al. (2009), namely the number of AoEs they delimit and the number of endemic species supporting them. Three grid sizes were used in two approaches: 1° × 1°, 1.5° × 1.5°, and 2° × 2°.
To perform PAE, we constructed presence (1) or absence (0) matrix based on the presence of each endemic species in each grid. A hypothetical outgroup “Root” with all zeros was added to the matrix to root the resulting tree (Morrone, 1994, 2014b). All matrices were performed in TNT v1.1 (Goloboff et al., 2008). New Technology algorithms were based on maximum trees with 1,000 and used sectorial search and tree fusing, with 10 initial addseqs. We obtained a strict consensus tree for each analysis. The relative support for each branch was estimated using bootstrap analysis with 1,000 replicates (Felsenstein, 1985). Branches with bootstrap values ≥ 50% were selected as candidates for AoEs. Finally, AoEs (clades of grids), containing at least two species restricted by these areas, were delimited and mapped.
EA was conducted using NDM/VNDM v 3.1 (Goloboff, 2016) under three grid sizes. This method is used to identify AoEs using an optimality criterion, which explicitly considers the spatial location of the species in a given area (Szumik et al., 2002). The parameters used here were performed by saving temporary sets within 0.99 of the current score; sets containing at least two endemic species and scores above 3.0 were saved. The search was repeated 10 times, keeping overlapping subsets when 60% of their defining species were unique. From the sets obtained, we chose species with a minimum score of 0.5. The strict rule was used to calculate the consensus areas at a cut-off of 40% similarity in species. To obtain the final AoEs, the consensus areas among the different grid sizes were overlapped (do Prado et al., 2015; Gao et al., 2018; Du et al., 2020).
Results
The species accumulation curve using bootstrap estimators obtained the “true” species number, namely 1,006 (Figure 1), and the data completeness degree is 85.4%. Furthermore, the ratio of observed species richness to those predicted by linear regression models for each grid cell was >78.8% (Figure 2). These results show that planthoppers were adequately sampled.
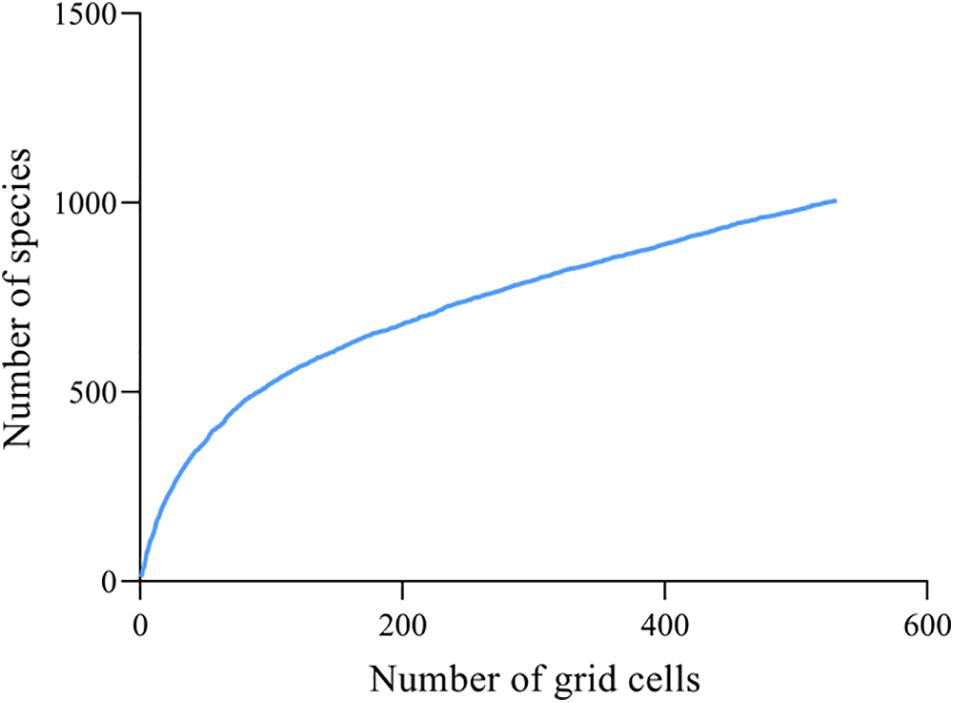
Figure 1. Species accumulation curves for planthoppers in China.
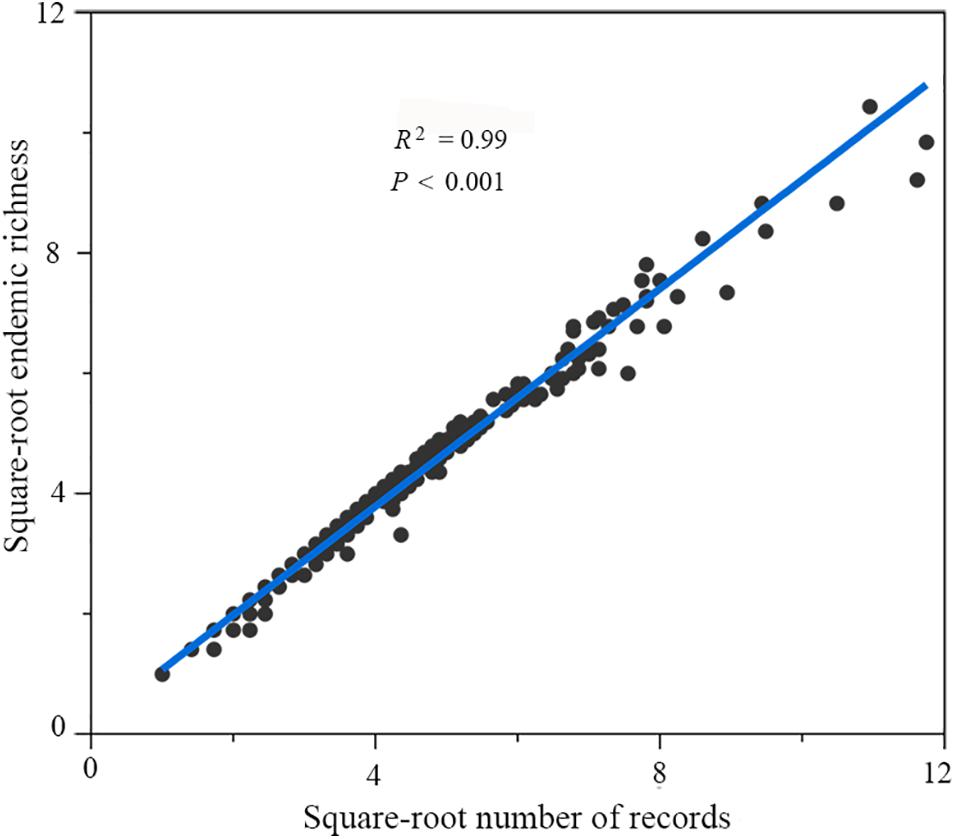
Figure 2. Linear regression (y = 0.905x + 0.173) for number of records and endemic richness in 1° grid. The observed richness in the grids below the regression line is >78.8% of the predicted richness.
Six CoEs were identified (Figure 3), located in Taiwan Island, Hainan Island, eastern Yungui Plateau, Wuyi Mountains, western Qinling Mountains, and western Yunnan. A total of three AoEs were identified using three grid sizes through PAE analysis (Figure 4). These areas are supported by single or multiple grid sizes. Taiwan Island and Hainan Island was detected under all three grid sizes. Western Qinling Mountain was detected to be AoEs only at 2°grid size. The AoEs under each grid size and the species supporting them were identified (Supplementary Table 1).
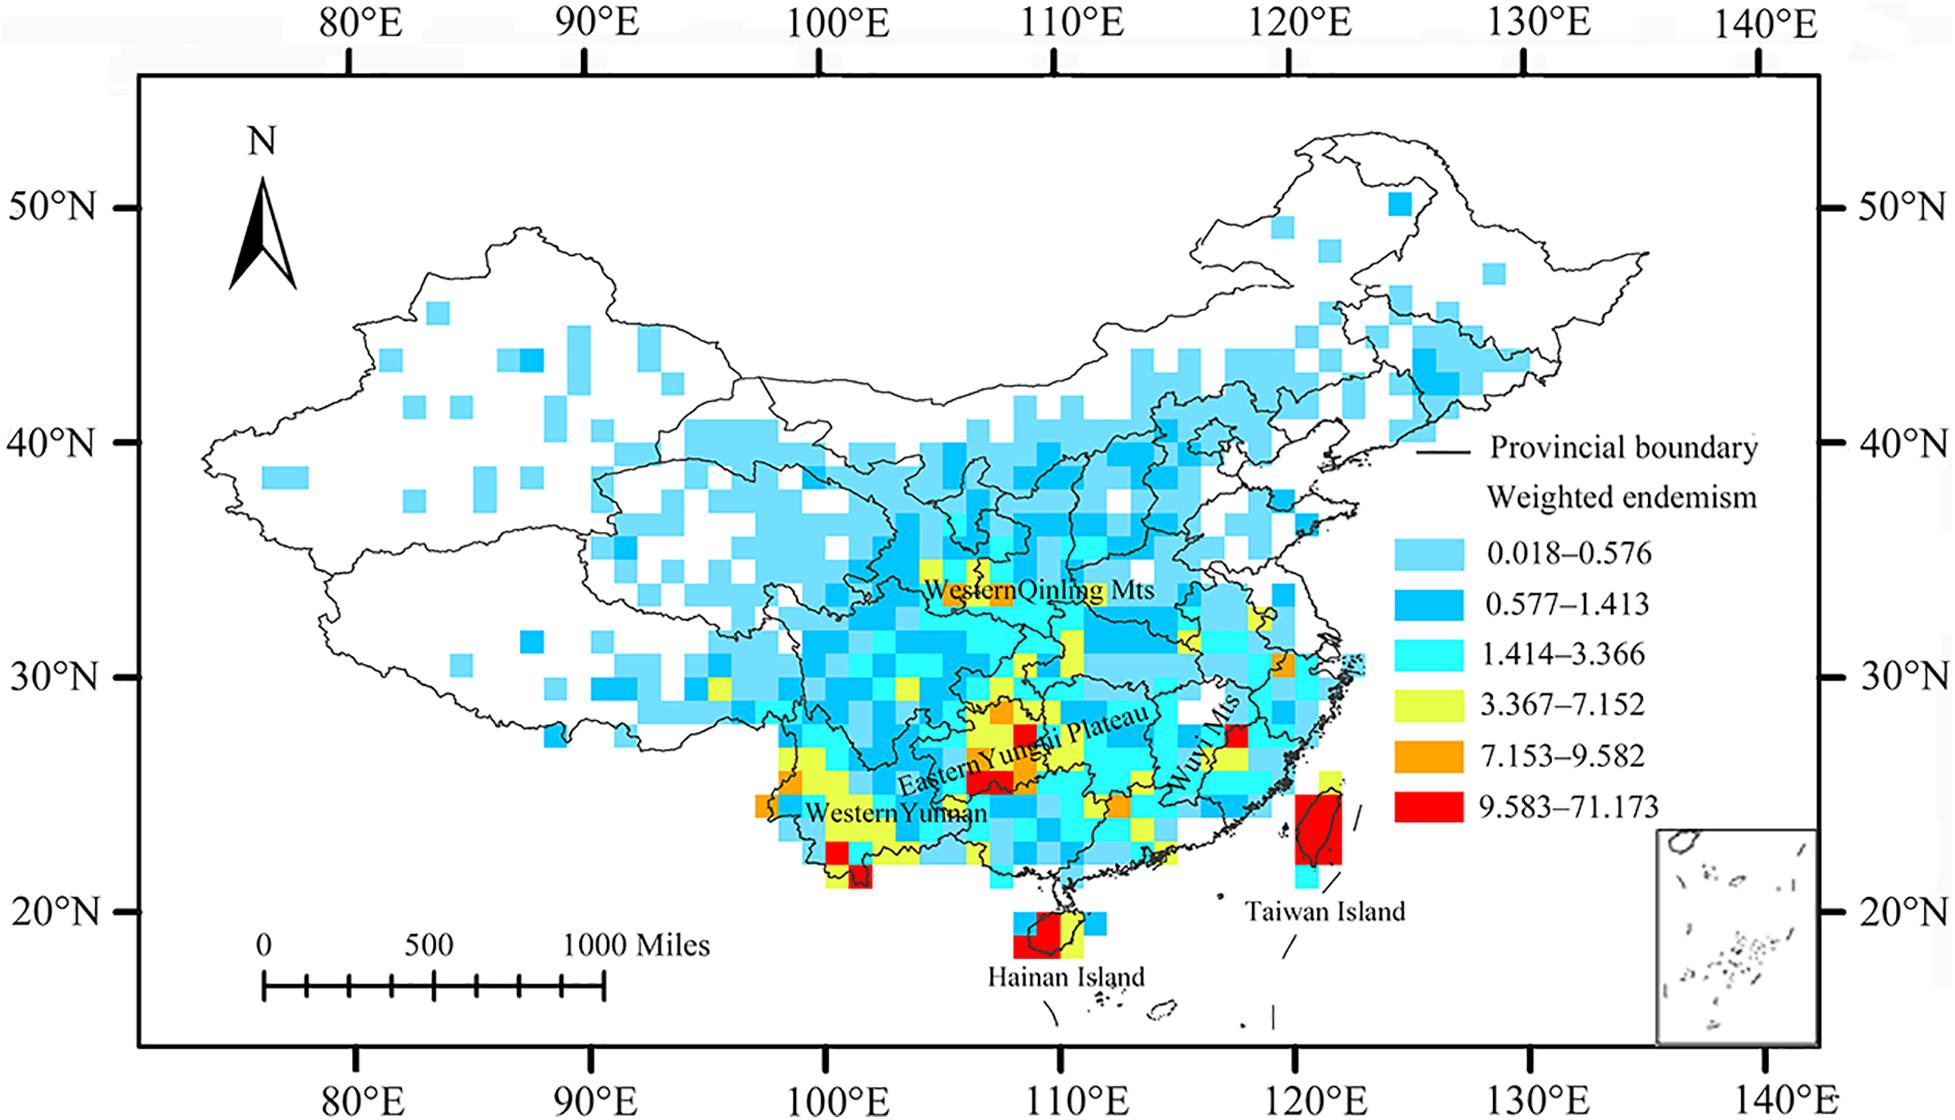
Figure 3. Weighted endemism richness patterns of planthoppers in 1° grid in China.
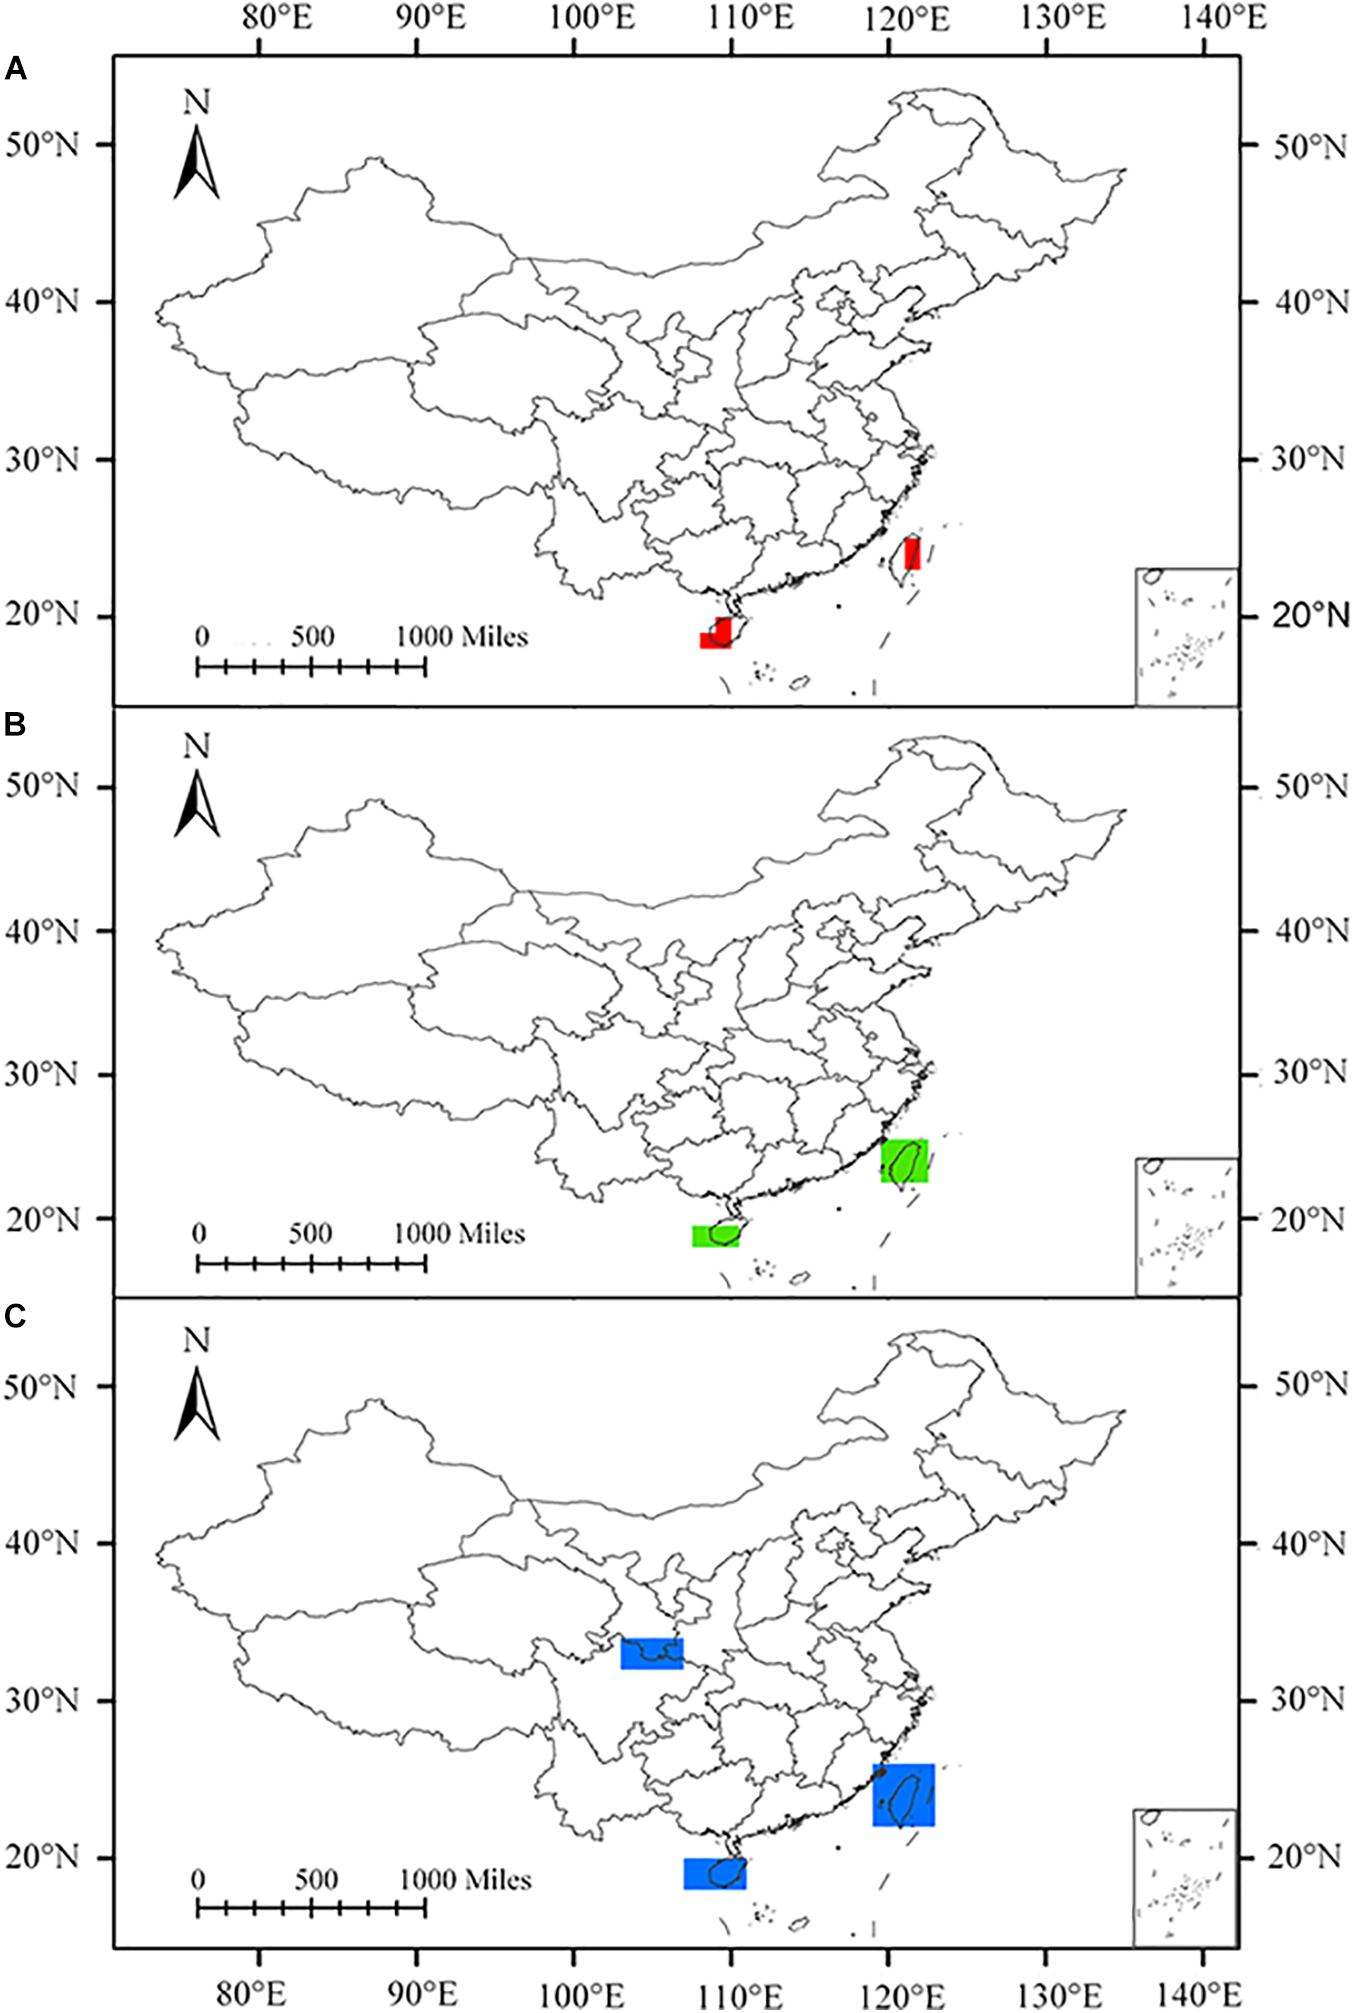
Figure 4. Areas of endemism (AoEs) obtained from planthoppers by parsimony analysis of endemicity (PAE) using three grids in China. (A) 1° grid, (B) 1.5° grid, and (C) 2° grid.
The consensus areas and supported endemic species obtained by EA in each grid size are summarized in Supplementary Material. Analysis using 1°, 1.5°, and 2° grid sizes yielded 4, 10, and 9 consensus areas, respectively. Through an overlapping pattern of the consensus areas in different grid sizes, five AoEs were identified (Figure 5).
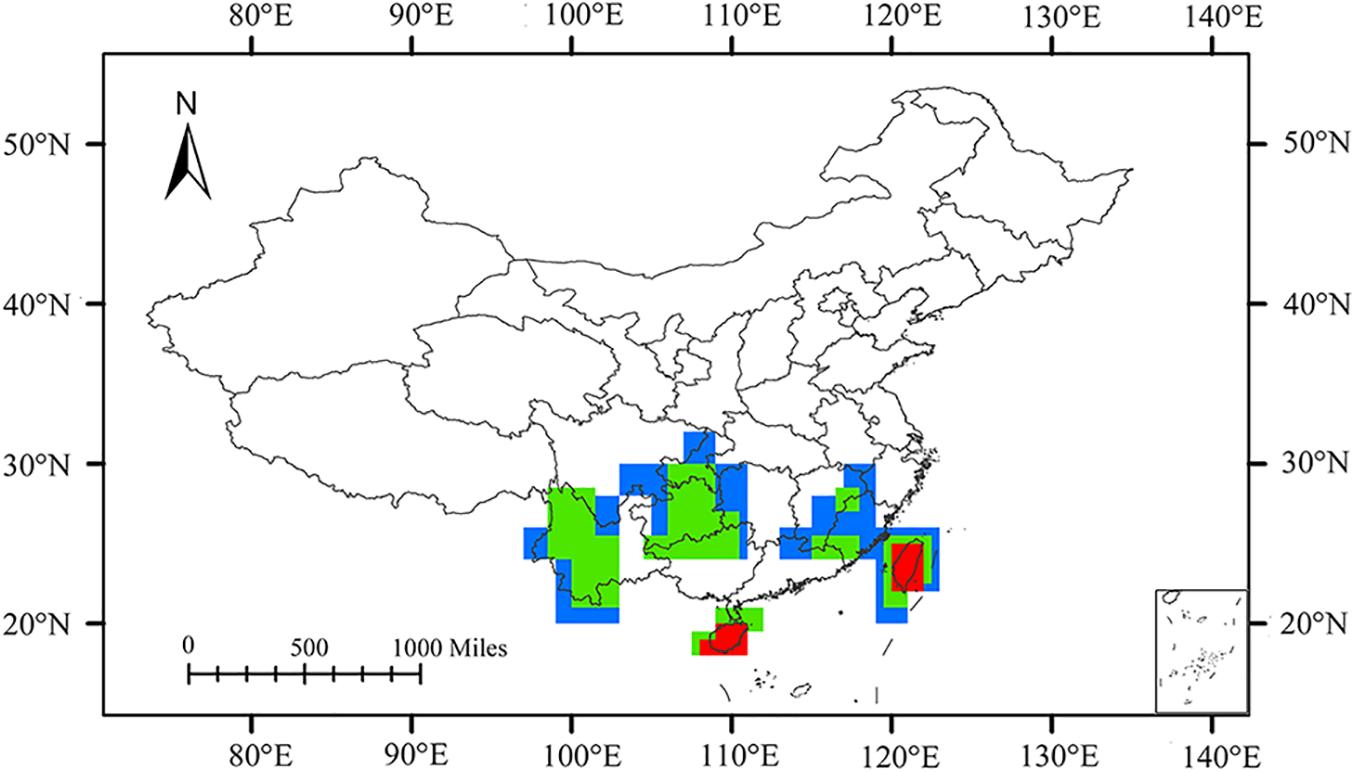
Figure 5. Overlap of the consensus areas of endemism (AoEs) delimited for planthoppers by endemicity analysis (EA) employing 1° (red), 1.5° (green), and 2° (blue) grids in China.
Taiwan Island was delimited under all three grid sizes, containing the consensus areas 2, 3, 4, 11, 14, 18, and 23 (Supplementary Figures 1–3). Consensus areas 2, 3, and 4 in the 1° grid size, with the corresponding 35, 12, and 6 species, were found. Consensus areas 11 and 14 were detected in the 1.5° grid size and contained 36 and 9 species, respectively. Consensus areas 18 and 23 were singled out in the 2° grid size and included 38 and 9 species. Two species, Kuvera taiwana and Cixius hopponis, support consensus areas 2, 3, 11, 14, 18, and 23 (Supplementary Table 2). Cixius wui supports consensus areas 2, 3, 14, 18, and 23. Four consensus areas with the greatest endemicity values appeared in this area, including consensus areas 2, 3, 11, and 18, with scores of 24.08333, 8.65, 26.4, and 26.3, respectively. Hainan Island was detected to be an AoE in 1° and 1.5° grid sizes and has the highest value (score = 8.4), except Taiwan Island. Consensus area 1 was present in 1° grid size and contained 11 species. Consensus area 9 was detected in 1.5° grid size and was supported by 10 species. These two consensus areas were simultaneously supported by Deferunda trimaculata, Deferunda acuminate, Deferunda striat, Epora biprolata, Gnezdilovius pseudotesselatus, Gnezdilovius multipunctatus, Neogergithoides tubercularis, and Sarimodes clavatus (Supplementary Table 2).
Western Yunnan, covered by the Ailao, Wuliang, and southern Hengduan Mountains, included consensus areas 6, 7, 10, and 13 in 1.5° grid size and consensus area 15, 19, 21, and 22 in 2° grid size (Supplementary Figures 2, 3). Mongoliana sinuate, Paracatonidia webbeda, Thabena lanpingensis, and Vekunta triprotrusa provide support of consensus area 15, 21, and 22. Eastern Yungui Plateau (roughly contains the Dalou, Wuling, and Miaoling) was detected in 1.5° and 2° grid sizes (Supplementary Figures 2, 3), containing consensus areas 5 and 8 in 1.5° grid size, consensus areas 16 and 17 in 2° grid size. Three species, Fusiissus frontomaculatus, Gergithoides caudospinosus, and Usana fissure, define consensus areas 5, 8, and 17. Wuyi Mountains comprised consensus area 12 in 1.5° grid size and consensus area 20 in 2° grid size. Errada dimidiate, Fortunia belostoma, Neoalcathous wuyishanana, and Ricanula fujianensi support these two consensus areas. Geisha bifurcata and Neokodaiana minensis also support consensus area 20.
Discussion
Causes of High Endemism and AoEs
In this study, we found that all CoEs and AoEs were located in mountainous areas, consistent with the findings in previous studies for insects, such as leafhoppers, scale insects, and aphids (Yuan et al., 2014; Wang et al., 2017; Gao et al., 2018), birds (Lei et al., 2003; Huang et al., 2010), mammals (Tang et al., 2006), and plants (Huang et al., 2012; Noroozi et al., 2019). The topographic complexity, long-term stable environment, and geological events experienced in mountainous areas are generally considered to be the main driving forces for the high level of endemism and formation of AoEs in these areas (Tribsch, 2004; López-Pujol et al., 2011; Wang et al., 2017; Gao et al., 2018; Noroozi et al., 2018, 2019).
With increasing topographic complexity, the amount of habitat diversity is expected to increase, promoting available niche space, and thereby increasing ecological speciation via adaptation to different niches (Rundle and Nosil, 2005; Hendry et al., 2007) and the coexistence of species (Tews et al., 2004; Hortal et al., 2009). Furthermore, topographical complexity can act as a barrier to gene-flow among diverging populations, resulting in supporting reproductive isolation, increasing differentiation, and speciation (Gillespie and Roderick, 2014), and ultimately high endemism. Mountainous areas have long-term climate stability, which is conducive to the persistence of relict lineages, specialization, speciation of small-ranged species, and reduction of extinction probability (Fjeldså and Lovett, 1997; Dynesius and Jansson, 2000; Jansson, 2003; López-Pujol et al., 2011), thus further increasing diversification.
High level of endemism in mountainous areas is also significantly related to the geological events they have experienced. Orogenic processes promote the emergence of new lineages and radiation of species due to the repeated formation, connectivity, and disappearance of habitats within mountain ranges (Rahbek et al., 2019). We found that Taiwan Island and Hainan Island had the first and second highest weighted endemism values and endemicity scores, respectively. Taiwan Island and Hainan Island are China’s largest and second largest islands, respectively, with typical mountain habitats affected by tropical/subtropical climates. The highest mountain in Taiwan is Mt. Yunshan (3,997 m), which is also the highest mountain in southeastern China. The highest mountain of Hainan Island is Mt. Wuzhishan. Taiwan Island and Hainan Island are isolated from the mainland, generating limited interchange between the islands and the mainland (Yuan et al., 2014). Furthermore, volcanoes often erupted on Hainan Island during the Pleistocene (Wang, 1985), causing populations to be isolated on the local and over decadal timescales, thereby increasing the development of different gene pools and the appearance of new genetic combinations (Gillespie and Roderick, 2014). These events were beneficial for promoting the emergence of novel lineages and a high degree of endemism in the two islands. The levels of endemicity in Taiwan Island are significantly higher than Hainan Island, probably because it is farther away from the mainland and had formed and separated earlier.
Planthoppers are very weak flyers and move by short-distance jumping (Liang, 1998). Therefore, planthoppers lack a strong ability to disperse. This characteristic may allow them to remain in places of speciation and glacial refuges, particularly when these places have high altitudes and complex terrain, and thus build high endemic species numbers and AoEs over time. The vast majority of various planthoppers feed on woody or herbaceous plants (Wilson, 2005), such as Poaceae, Cyperaceae, Rosaceae, Oleaceae, and Polygonaceae (Ding, 2006; Chen et al., 2014). Host plants, apart from being a food source, are also used by some planthoppers for mating, oviposition, protection in winter, and avoiding their natural enemies (Wilson et al., 1994). Many planthoppers have high degrees of specialization with respect to host plants (Wilson et al., 1994; Liang, 1998). The family Delphacidae, which has the largest number of species among planthoppers, mainly feeds on a small number of host plants species (concentrated to Poaceae and Cyperaceae), and some even feed only on a single host plant species (Wilson et al., 1994; Ding, 2006). Most of the species in the family Caliscelidae feed on bamboo and a few on other plants (Chen et al., 2014). In China, we found that the diversity centers of many host plants are consistent with the CoEs/AoEs identified in the present study. For example, high bamboo diversity is mainly concentrated in southern Yunnan and Wuyi Mountains (Xu et al., 2019). There is high species richness of Rosaceae in northern Yunnan and the Qinling Mountains (Zou et al., 2019). This consistency shows that the distribution pattern of planthoppers is highly associated with the diversity patterns of host plants.
The Effects of Grid Size and Approach on Results
PAE and EA use grids as basic operating units in delimiting AoEs; therefore, the grid size affects the results in a deterministic manner. Grid size can affect the number, dispersion, and range of the localities. Smaller grid sizes will produce narrower AoEs, allowing a small number of endemic species to be included, whereas larger grid sizes identify wider AoEs and accommodate more endemic species (Casagranda et al., 2009; do Prado et al., 2015; DaSilva et al., 2015).
We found the greater number of AoEs and supported endemic species were identified by EA at larger grid cell (1.5° and 2°), as was PAE (2°). EA produced five and four AoEs in 1.5° and 2° grids and PAE delimited three AoEs in 2° grids. Combining different grid sizes is necessary to define the AoEs. Using several grid sizes facilitates the discovery of different AoEs in regions with topographical complexity (Elías and Aagesen, 2016), such as western Yunnan, and eastern Yungui Plateau is only delimited by at 1.5° and 2° grids. AoEs that recovered under different grid sizes were more robustly and clearly supported by data (Aagesen et al., 2009, 2012; Szumik et al., 2012). Additionally, the use of several grids sizes was slightly different in location, area, and boundary of the resulting AoEs, and minimized the effects of sampling biases (DaSilva et al., 2015). The use of grids brings has some drawbacks, such as the inability to identify AoEs smaller than grid sizes and difficulty in representing the fuzzy edges of the AoEs. Geographical Interpolation of Endemism (GIE) (Oliveira et al., 2015), an approach independent of grids, can be valuably used in future work to obtain more detailed information about the AoEs of planthoppers. The performance of PAE and EA has been widely discussed using real or hypothetical distributions (e.g., Moline and Linder, 2006; Carine et al., 2009; Casagranda et al., 2012; Escalante, 2015). However, there is no consensus on which approach is most suitable and their exploration should be continued (Escalante, 2015). Using a total of three grids, we found that EA identified more AoEs than PAE. The observed difference is because species that support the AoEs in PAE require higher and stricter sympatry, resulting in a small number of AoEs. Furthermore, western Qinling Mountains delimited by the PAE are not identified in the EA. In this way, combining the two methods may provide a more comprehensive knowledge of AoEs.
Conclusion
The spatial structure of planthoppers’ endemism in China was analyzed by identifying CoEs and AoEs. We found that the CoEs and AoEs identified fell in the mountainous areas, mainly due to their complex topography, stable eco-climatic conditions, and related geological events that promote long-term persistence, speciation, and species accumulation. Furthermore, we found that the dispersal ability of planthoppers and diversity pattern of host plants also are responsible for high planthoppers endemism in the mountainous areas. Future studies can add temporal information based on phylogenetic information from endemic species to better interpret AoEs.
Data availability statement
The original data of this study are available from the corresponding author upon reasonable request.
Author contributions
ZZha analyzed the data and wrote the article. LNY, JL, ZC, ZZho, YZ, LAY, HL, YS, NG, and XW collected the data. XC revised the article. All authors contributed significantly to the drafts and gave final approval for publication.
Funding
This research was funded by the National Natural Science Foundation of China (Nos. 31472033 and 31601886), the Science and Technology Support Program of Guizhou Province (No. 20201Y129), the Program of Excellent Innovation Talents, Guizhou Province, China (No. [2015]4021), the Program of Scientific Research Foundation for Introduced Talent of Guizhou University (No. Guidarenjihezi [2017]18), the Science and Technology Program of Guizhou Province (No. Qiankehejichu [2018]1031), Academic New Cultivation and Innovation Exploration Special Project of Guizhou University in 2018 (No. Qiankehe and Platform for talents [2018]5781-29), and the Science and Technology Program of Guizhou Province (No. Qiankehejichu [2018]1031).
Conflict of Interest
The authors declare that the research was conducted in the absence of any commercial or financial relationships that could be construed as a potential conflict of interest.
Publisher’s Note
All claims expressed in this article are solely those of the authors and do not necessarily represent those of their affiliated organizations, or those of the publisher, the editors and the reviewers. Any product that may be evaluated in this article, or claim that may be made by its manufacturer, is not guaranteed or endorsed by the publisher.
Acknowledgments
We thank Xiaolei Huang, Chao Gao, and Yang Li for their help in PAE. We are also very grateful to all collectors for collecting specimens.
Supplementary Material
The Supplementary Material for this article can be found online at: https://www.frontiersin.org/articles/10.3389/fevo.2021.683722/full#supplementary-material
References
Aagesen, L., Bena, M. J., Nomdedeu, S., Panizza, A., López, R. P., and Zuloaga, F. O. (2012). Areas of endemism in the southern central Andes. Darwiniana 50, 218–251.
Aagesen, L., Szumik, C. A., Zuloaga, F. O., and Morrone, O. (2009). Quantitative biogeography in the South America highlands-recognizing the Altoandina, Puna and Prepuna through the study of Poaceae. Cladistics 25, 295–310. doi: 10.1111/j.1096-0031.2009.00248.x
Bourgoin, T. (2021). FLOW (Fulgoromorpha Lists on The Web): A World Knowledge Base Dedicated To Fulgoromorpha. Version 8. Available online at: http://hemiptera-databases. org/flow/ (accessed on February 26, 2021)
Carine, M. A., Humphries, C. J., Guma, I. R., Reyesbetancort, J. A., and Guerra, A. S. (2009). Areas and algorithms: evaluating numerical approaches for the delimitation of areas of endemism in the Canary Islands archipelago. J. Biogeogr. 36, 593–611. doi: 10.1111/j.1365-2699.2008.02016.x
Casagranda, M. D., Taher, L., and Szumik, C. A. (2009). Endemismo a diferentes escalas espaciales: un ejemplo con Carabidae (Coleoptera: Insecta) de América del Sur austral. Rev. Chil. Hist. Nat. 82, 17–42.
Casagranda, M. D., Taher, L., and Szumik, C. A. (2012). Endemicity analysis, parsimony and biotic elements: a formal comparison using hypothetical distributions. Cladistics 28, 645–654. doi: 10.1111/j.1096-0031.2012.00410.x
Casazza, G., Zappa, E., Mariotti, M., Medail, F., and Minuto, L. (2008). Ecological and historical factors affecting distribution pattern and richness of endemic plant species: the case of the Maritime and Ligurian Alps hotspot. Divers. Distrib. 14, 47–58. doi: 10.1111/j.1472-4642.2007.00412.x
Chen, X. S., Zhang, Z. G., and Chang, Z. M. (2014). Issidae and Caliscelidae (Hemiptera: Fulgoroidea) from China. Guiyang: Guizhou Science and Technology Publishing House.
Colwell, R. K. (2013). EstimateS: Statistical Estimation of Species Richness and Shared Species from Samples. Storrs, Connecticut. Available online at: http://purl.oclc.org/estimates (accessed on August 16, 2020)
Crisp, M. D., Laffan, S. W., Linder, H. P., and Monro, A. (2001). Endemism in the Australian flora. J. Biogeogr. 28, 183–198. doi: 10.1046/j.1365-2699.2001.00524.x
DaSilva, M. B., Pintodarocha, R., and Desouza, A. (2015). A protocol for the delimitation of areas of endemism and the historical regionalization of the Brazilian Atlantic Rain Forest using harvestmen distribution data. Cladistics 31, 692–705. doi: 10.1111/cla.12121
Diniz-Filho, J. A. F., Bini, L. M., and Hawkins, B. A. (2003). Spatial autocorrelation and red herrings in geographical ecology. Global Ecol. Biogeogr. 12, 53–64. doi: 10.1046/j.1466-822x.2003.00322.x
do Prado, J. R., Brennand, P. G., Godoy, L. P., Libardi, G. S., De Abreujunior, E. F., Roth, P. R., et al. (2015). Species richness and areas of endemism of oryzomyine rodents (Cricetidae. Sigmodontinae) in South America: an NDM/VNDM approach. J. Biogeogr. 42, 540–551. doi: 10.1111/jbi.12424
Du, C. C., Chen, J., Jiang, L. Y., and Qiao, G. X. (2020). High correlation of species diversity patterns between specialist herbivorous insects and their specific hosts. J. Biogeogr. 47, 1232–1245. doi: 10.1111/jbi.13816
Dutilleul, P., Clifford, P., Richardson, S., and Hemon, D. (1993). Modifying the t test for assessing the correlation between two spatial processes. Biometrics 49, 305–314. doi: 10.2307/2532625
Dynesius, M., and Jansson, R. (2000). Evolutionary consequences of changes in species’ geographical distributions driven by Milankovitch climate oscillations. P. Natl. Acad. Sci. U. S. A. 97, 9115–9120. doi: 10.1073/pnas.97.16.9115
Elías, G. D., and Aagesen, L. (2016). Areas of vascular plants endemism in the Monte desert (Argentina). Phytotaxa 266, 161–182. doi: 10.11646/phytotaxa.266.3.1
Escalante, T. (2015). Parsimony analysis of endemicity and analysis of endemicity: A fair comparison. Syst. Biodivers. 13, 413–418. doi: 10.1080/14772000.2015.1046966
Escalante, T., Szumik, C. A., and Morrone, J. J. (2009). Areas of endemism of Mexican mammals: Reanalysis applying the optimality criterion. Biol. J. Linn. Soc. 98, 468–478. doi: 10.1111/j.1095-8312.2009.01293.x
Felsenstein, J. (1985). Confidence limits on phylogenies: an approach using the bootstrap. Evolution 39, 783–791. doi: 10.2307/2408678
Feng, G., Mao, L. F., Sandel, B., Swenson, N. G., and Svenning, J. C. (2016). High plant endemism in China is partially linked to reduced glacial-interglacial climate change. J. Biogeogr. 43, 145–154. doi: 10.1111/jbi.12613
Fjeldså, J., and Lovett, J. C. (1997). Geographical patterns of old and young species in African forest biota: the significance of specific montane areas as evolutionary centres. Biodivers. Conserv. 6, 325–346.
Fjeldså, J., Bowie, R. C., and Rahbek, C. (2012). The role of mountain ranges in the diversification of birds. Annu. Rev. Ecol. Evol. S. 43, 249–265. doi: 10.1146/annurev-ecolsys-102710-145113
Gámez, N., Nihei, S. S., Scheinvar, E., and Morrone, J. J. (2017). A temporally dynamic approach for cladistic biogeography and the processes underlying the biogeographic patterns of North American deserts. J. Zoolog. Syst. Evol. Res. 55, 11–18. doi: 10.1111/jzs.12142
Gao, C., Chen, J., Li, Y., Jiang, L. Y., and Qiao, G. X. (2018). Congruent patterns between species richness and areas of endemism of the Greenideinae aphids (Hemiptera: Aphididae) revealed by global-scale data. Zool. J. Linn. Soc-Lond. 83, 791–807. doi: 10.1093/zoolinnean/zlx092
Gillespie, R. G., and Roderick, G. K. (2014). Evolution: geology and climate drive diversification. Nature 509, 297–298. doi: 10.1038/509297a
Goloboff, P. (2016). NDM and VNDM: programs for the identification of areas of endemism, version. 3.1. Program and documentation. Available online at: www.lillo.org.ar/ phylogeny (accessed on June 8, 2019)
Goloboff, P. A., Farris, J. S., and Nixon, K. C. (2008). TNT, a free program for phylogenetic analysis. Cladistics 24, 774–786. doi: 10.1111/j.1096-0031.2008.00217.x
Gomes-da-Silva, J., Amorim, A. M., and Forzza, R. C. (2017). Distribution of the xeric clade species of pitcairnioideae (Bromeliaceae) in south America: a perspective based on areas of endemism. J. Biogeogr. 44, 1994–2006. doi: 10.1111/jbi.12990
Hendry, A. P., Nosil, P., and Rieseberg, L. H. (2007). The speed of ecological speciation. Funct. Ecol. 21, 455–464. doi: 10.1111/j.1365-2435.2007.01240.x
Hortal, J., Triantis, K. A., Meiri, S., Thebault, E., and Sfenthourakis, S. (2009). Island species richness increases with habitat diversity. Am. Nat. 174, 205–217.
Huang, J. H., Chen, B., Liu, C. R., Lai, J. S., Zhang, J. L., and Ma, K. P. (2012). Identifying hotspots of endemic woody seed plant diversity in China. Divers. Distrib. 18, 673–688. doi: 10.1111/j.1472-4642.2011.00845.x
Huang, J. H., Huang, J. H., Lu, X. H., and Ma, K. P. (2016). Diversity distribution patterns of Chinese endemic seed plant species and their implications for conservation planning. Sci. Rep. 6:33913.
Huang, X. L., Qiao, G. X., and Lei, F. M. (2010). Use of parsimony analysis to identify areas of endemism of Chinese birds: implications for conservation and biogeography. Int. J. Mol. Sci. 11, 2097–2108. doi: 10.3390/ijms11052097
Hurdu, B., Escalante, T., Puşcaş, M., Novikoff, A. V., Bartha, L., and Zimmermann, N. E. (2016). Exploring the different facets of plant endemism in the South−Eastern Carpathians: a manifold approach for the determination of biotic elements, centres and areas of endemism. Biol. J. Linn. Soc. 119, 649–672. doi: 10.1111/bij.12902
Jansson, R. (2003). Global patterns in endemism explained by past climatic change. P. Roy. Soc. B Biol. Sci. 270, 583–590. doi: 10.1098/rspb.2002.2283
Kohler, T., and Maselli, D. (Eds). (2009). Mountains and Climate Change. From Understanding to Action. Bern: Geographica Bernensia.
Laffan, S. W., and Crisp, M. D. (2003). Assessing endemism at multiple spatial scales, with an example from the Australian vascular flora. J. Biogeogr. 30, 511–520. doi: 10.1046/j.1365-2699.2003.00875.x
Laffan, S. W., Lubarsky, E., and Rosauer, D. F. (2010). Biodiverse, a tool for the spatial analysis of biological and related diversity. Ecography 33, 643–647. doi: 10.1111/j.1600-0587.2010.06237.x
Lamoreux, J. F., Morrison, J. C., Ricketts, T. H., Olson, D. M., Dinerstein, E., McKnight, M. W., et al. (2006). Global tests of biodiversity concordance and the importance of endemism. Nature 440, 212–214. doi: 10.1038/nature04291
Lei, F. M., Qu, Y. H., Lu, J. L., Liu, Y., and Yin, Z. H. (2003). Conservation on diversity and distribution patterns of endemic birds in China. Biodivers. Conserv. 12, 239–254.
Li, Y., Chen, J., Jiang, L. Y., and Qiao, G. X. (2017). Islands conserve high species richness and areas of endemism of Hormaphidinae aphids. Curr. ZooL. 63, 623–632. doi: 10.1093/cz/zox004
Liang, A. P. (1998). Cladistic biogeography of Cercopoidea and Fulgoroidea (Insecta: Homoptera) in China and adjacent regions. Acta Zootaxon. Sin. 23, 132–167.
Linder, H. P. (2001a). On areas of endemism, with an example from the African Restionaceae. Syst. Biol. 50, 892–912. doi: 10.1080/106351501753462867
Linder, H. P. (2001b). Plant diversity and endemism in sub−Saharan tropical Africa. J. Biogeogr. 28, 169–182. doi: 10.1046/j.1365-2699.2001.00527.x
López-Pujol, J., Zhang, F. M., Sun, H. Q., Ying, T. S., and Ge, S. (2011). Centres of plant endemism in China: places for survival or for speciation? J. Biogeogr. 38, 1267–1280. doi: 10.1111/j.1365-2699.2011.02504.x
Moline, P. M., and Linder, H. P. (2006). Original article: input data, analytical methods and biogeography of Elegia (Restionaceae). J. Biogeogr. 33, 47–62. doi: 10.1111/j.1365-2699.2005.01369.x
Morrone, J. J. (1994). Society of systematic biologists on the identification of areas of endemism. Syst. Biol. 43, 438–441. doi: 10.2307/2413679
Morrone, J. J. (2014a). Biogeographical regionalisation of the Neotropical Region. Zootaxa 3782, 001–110.
Morrone, J. J. (2014b). Parsimony analysis of endemicity (PAE) revisited. J. Biogeogr. 41, 842–854. doi: 10.1111/jbi.12251
Myers, N., Mittermeier, R. A., Mittermeier, C. G., da Fonseca, G. A. B., and Kent, J. (2000). Biodiversity hotspots for conservation priorities. Nature 403, 853–858. doi: 10.1038/35002501
Nelson, G., and Platnick, N. (1981). Systematics and Biogeography. New York: Columbia University Press.
Noroozi, J., Talebi, A., Doostmohammadi, M., Rumpf, S. B., Linder, H. P., and Schneeweiss, G. M. (2018). Hotspots within a global biodiversity hotspot-areas of endemism are associated with high mountain ranges. Sci. Rep. 8:10345.
Noroozi, J., Zare, G., Sherafati, M., Mahmoodi, M., Moser, D., Asgarpour, Z., et al. (2019). Patterns of endemism in Turkey, the meeting point of three global biodiversity hotspots, based on three diverse families of vascular plants. Front. Ecol. Evol. 7:159. doi: 10.3389/fevo.2019.00159
Oliveira, U., Brescovit, A. D., and Santos, A. J. (2015). Delimiting Areas of Endemism through Kernel Interpolation. PLoS One 10:e0116673. doi: 10.1371/journal.pone.0116673
Orme, C. D., Davies, R. G., Burgess, M., Eigenbrod, F., Pickup, N., Olson, V. A., et al. (2005). Global hotspots of species richness are not congruent with endemism or threat. Nature 436, 1016–1019. doi: 10.1038/nature03850
Posadas, P., Crisci, J., and Katinas, L. (2006). Historical biogeography: a review of its basic concepts and critical issues. J. Arid. Environ. 66, 389–403. doi: 10.1016/j.jaridenv.2006.01.004
Rahbek, C., Borregaard, M. K., Antonelli, A., Colwell, R. K., Holt, B. G., Noguesbravo, D., et al. (2019). Building mountain biodiversity: Geological and evolutionary processes. Science 365, 1114–1119. doi: 10.1126/science.aax0151
Rangel, T. F., Diniz-Filho, J. A. F., and Bini, L. M. (2010). SAM: A comprehensive application for spatial analysis in macroecology. Ecography 33, 46–50. doi: 10.1111/j.1600-0587.2009.06299.x
Rundle, H. D., and Nosil, P. (2005). Ecological speciation. Ecol. Lett. 8, 336–352. doi: 10.1111/j.1461-0248.2004.00715.x
Sandel, B., Arge, L., Dalsgaard, B., Davies, R. G., Gaston, K. J., Sutherland, W. J., et al. (2011). The influence of Late Quaternary climate change velocity on species endemism. Science 334, 660–664. doi: 10.1126/science.1210173
Szumik, C. A., Aagesen, L., Casagranda, D., Arzamendia, V., Baldo, D., Claps, L. E., et al. (2012). Detecting areas of endemism with a taxonomically diverse data set: plants, mammals, reptiles, amphibians, birds, and insects from Argentina. Cladistics 28, 317–329. doi: 10.1111/j.1096-0031.2011.00385.x
Szumik, C. A., Cuezzo, F., Goloboff, P. A., and Chalup, A. E. (2002). An optimality criterion to determine areas of endemism. Syst. Biol. 51, 806–816. doi: 10.1080/10635150290102483
Tang, Z. Y., Wang, Z. H., Zheng, C. Y., and Fang, J. Y. (2006). Biodiversity in China’s mountains. Front. Ecol. Environ. 4:347–352. doi: 10.1890/1540-92952006004[0347:BICM]2.0.CO;2
Tews, J., Brose, U., Grimm, V., Tielborger, K., Wichmann, M. C., Schwager, M., et al. (2004). Animal species diversity driven by habitat heterogeneity/diversity: the importance of keystone structures. J. Biogeogr. 31, 79–92. doi: 10.1046/j.0305-0270.2003.00994.x
Tribsch, A. (2004). Areas of endemism of vascular plants in the Eastern Alps in relation to Pleistocene glaciation. J. Biogeogr. 31, 747–760. doi: 10.1111/j.1365-2699.2004.01065.x
Wang, F., Jiang, C. Z., Liu, J. Z., and Wei, J. F. (2017). Areas of endemism for scale insects in China. J. Asia-Pac. Entomol. 20, 1170–1174. doi: 10.1016/j.aspen.2017.08.024
Wilson, S. W. (2005). Keys to the families of Fulgoromorpha with emphasis on planthoppers of potential economic importance in the southeastern United States (Hemiptera: Auchenorrhyncha). Fla. Entomol. 88, 464–481. doi: 10.1653/0015-4040(2005)88[464:kttfof]2.0.co;2
Wilson, S. W., Mitter, C., Denno, R. F., and Wilson, M. R. (1994). “Planthoppers: Their Ecology and Management,” in Evolutionary patterns of host plant use by delphacid planthoppers and their relatives, eds R. F. Denno and T. J. Perfect (New York: Chapman and Hall), 7–45.
Xu, Y., Shen, Z. H., Ying, L. X., Zang, R. G., and Jiang, Y. X. (2019). Effects of current climate, paleo-climate, and habitat heterogeneity in determining biogeographical patterns of evergreen broad-leaved woody plants in China. J. Geogr. Sci. 29, 1142–1158. doi: 10.1007/s11442-019-1650-x
Yuan, S., Huang, M., Wang, X. S., Ji, L. Q., and Zhang, Y. L. (2014). Centers of endemism and diversity patterns for Typhlocybine leafhoppers (Hemiptera: Cicadellidae: Typhlocybinae) in China. Insect Sci. 21, 523–526. doi: 10.1111/1744-7917.12040
Zhao, Z. X., Jin, B. C., Zhou, Z. X., Yan, L., Long, J. K., and Chen, X. S. (2020a). Determinants of Delphacidae richness and endemism in China. Ecol. Entomol. 45, 1396–1407. doi: 10.1111/een.12924
Zhao, Z. X., Yang, L., Long, J. K., Chang, Z. M., Zhou, Z. X., Zhi, Y., et al. (2020b). Testing seven hypotheses to determine what explains the current planthopper (Fulgoridae) geographical and species richness patterns in China. Insects 11:892. doi: 10.3390/insects11120892
Keywords: areas of endemism, biogeography, centers of endemism, mountainous areas, planthoppers
Citation: Zhao Z, Yang L, Long J, Chang Z, Zhou Z, Zhi Y, Yang L, Li H, Sui Y, Gong N, Wang X and Chen X (2021) Endemism Patterns of Planthoppers (Fulgoroidea) in China. Front. Ecol. Evol. 9:683722. doi: 10.3389/fevo.2021.683722
Received: 22 March 2021; Accepted: 24 June 2021;
Published: 23 July 2021.
Edited by:
Gengping Zhu, Tianjin Normal University, ChinaCopyright © 2021 Zhao, Yang, Long, Chang, Zhou, Zhi, Yang, Li, Sui, Gong, Wang and Chen. This is an open-access article distributed under the terms of the Creative Commons Attribution License (CC BY). The use, distribution or reproduction in other forums is permitted, provided the original author(s) and the copyright owner(s) are credited and that the original publication in this journal is cited, in accordance with accepted academic practice. No use, distribution or reproduction is permitted which does not comply with these terms.
*Correspondence: Xiangsheng Chen, Y2hlbnhzMzIxOEAxNjMuY29t