 Sakina Elshibli
 Helena Korpelainen
- Department of Agricultural Sciences, Viikki Plant Science Centre, University of Helsinki, Helsinki, Finland
Medemia argun is a wild, dioecious palm, adapted to the harsh arid environment of the Nubian Desert in Sudan and southern Egypt. There is a concern about its conservation status, since little is known about its distribution, abundance, and genetic variation. M. argun grows on the floodplains of seasonal rivers (wadis). The continuing loss of suitable habitats in the Nubian Desert is threatening the survival of this species. We analyzed the genetic diversity, population genetic structure, and occurrence of M. argun populations to foster the development of conservation strategies for M. argun. Genotyping-by-sequencing (GBS) analyses were performed using a whole-genome profiling service. We found an overall low genetic diversity and moderate genetic structuring based on 40 single-nucleotide polymorphisms (SNPs) and 9,866 SilicoDArT markers. The expected heterozygosity of the total population (HT) equaled 0.036 and 0.127, and genetic differentiation among populations/groups (FST) was 0.052 and 0.092, based on SNP and SilicoDArT markers, respectively. Bayesian clustering analyses defined five genetic clusters that did not display any ancestral gene flow among each other. Based on SilicoDArT markers, the results of the analysis of molecular variance (AMOVA) confirmed the previously observed genetic differentiation among generation groups (23%; p < 0.01). Pairwise FST values indicated a genetic gap between old and young individuals. The observed low genetic diversity and its loss among generation groups, even under the detected high gene flow, show genetically vulnerable M. argun populations in the Nubian Desert in Sudan. To enrich and maintain genetic variability in these populations, conservation plans are required, including collection of seed material from genetically diverse populations and development of ex situ gene banks.
Introduction
The open-habitat palm (Medemia argun) is a dioecious species native to Sudan (Broun and Massey, 1929; Andrews, 1956) and adapted to harsh arid environments. Currently, its distribution is limited to the Nubian Desert of Sudan (Figure 1A), where the palm grows on the floodplains of seasonal rivers (wadis), including southern Egyptian oases (Ibrahim and Baker, 2009;
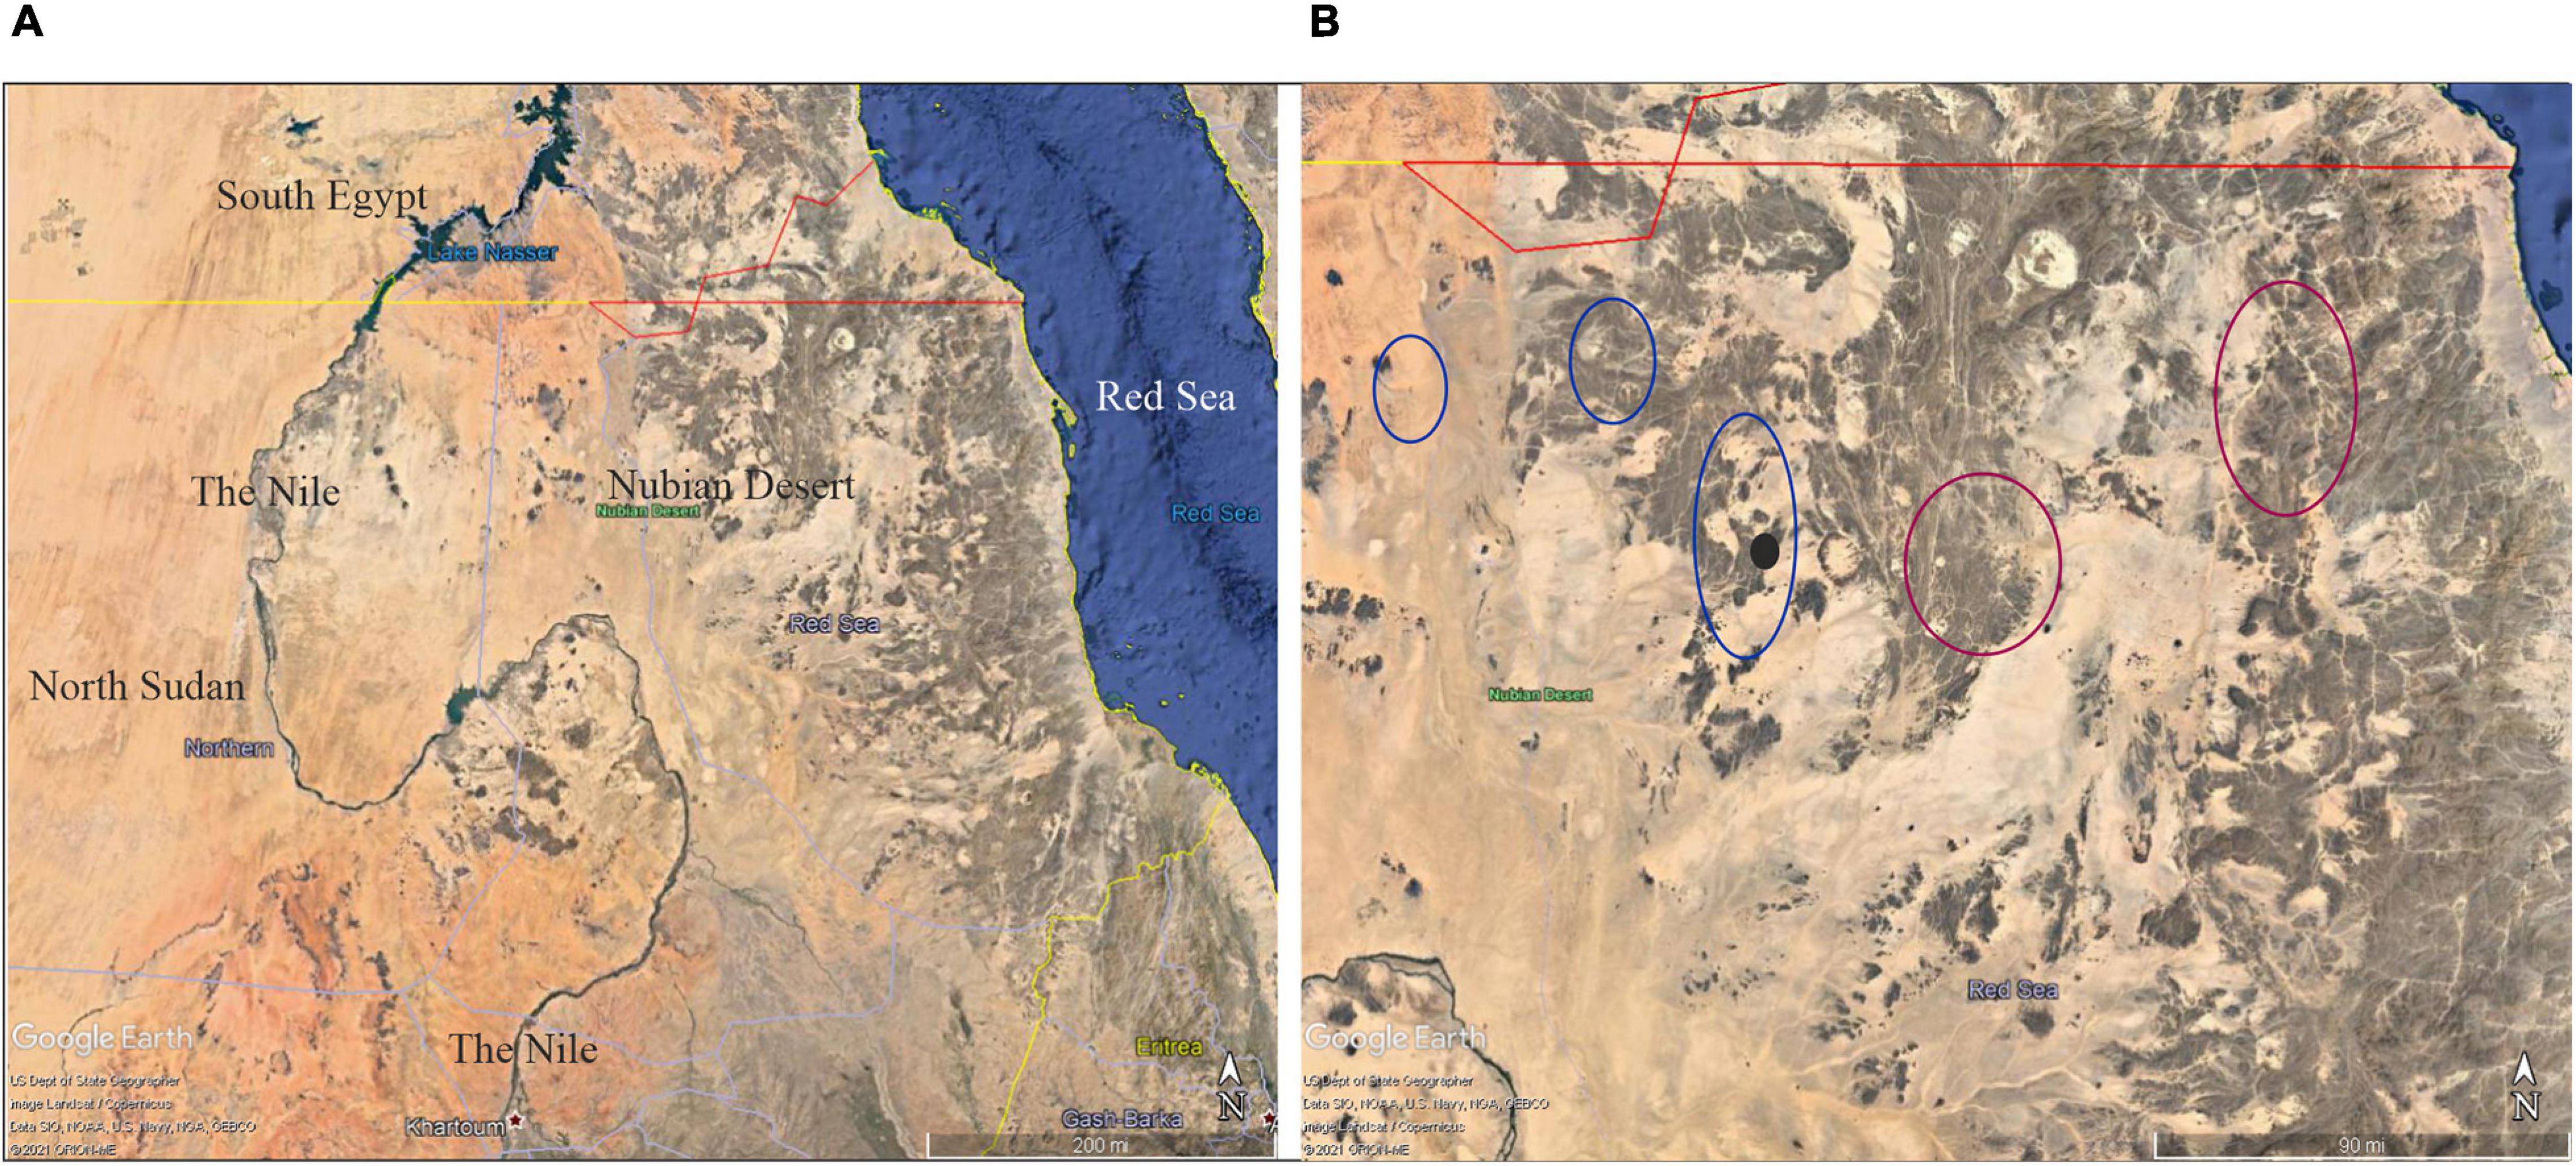
Figure 1. (A) Google Earth view (15°00′–24°00′N, 38°00′–39°00′E) of the geographic location of the Nubian Desert in Sudan. (B) Sketched distribution of M. argun in the Nubian Desert in Sudan: blue circles indicate the main locations reviewed and updated by Cosiaux et al. (2020) using Google Maps; purple circles indicate previously unreported locations described by local travelers; the black circle indicates the location of the population sampled in this study.
Elshibli and Korpelainen, 2018). Little is known on the distribution, abundance, and genetic variation of M. argun, which has previously been listed by the International Union for Conservation of Nature’s (IUCN) Red List as a critically endangered (IUCN, 1998), and very recently as a vulnerable species. The latter assessment was proposed by Cosiaux et al. (2020) based on the number of individuals deduced from satellite imagery (Google Earth and Bing Maps; Figure 1B). Based on these satellite images, Cosiaux et al. (2020) counted all visible individuals and estimated that the total number of M. argun palms in Sudan is 7,370 compared to the previous estimate of about 1,000 (Gibbons and Spanner, 1999). The occurrence of 31 scattered M. argun individuals in southern Egypt (Ibrahim and Baker, 2009) represents a marginal population. In Sudan, M. argun has been reported to exist only in the Nubian Desert (Ali and Idris, 2016).
The Nubian Desert is located in the eastern region of the Sahara Desert, covering an area of about 400,000 km2 in northeastern Sudan and northern Eritrea between the Nile and the Red Sea (Figure 1A). Here, the average annual rainfall is around 75 mm, which indicates extreme and threatening drought conditions for plant and animal life (Florenzano et al., 2016). This region is arid and has rocky mountains and sand dunes, and hundreds of valleys with annual rivers (wadis) that dry up before reaching the Nile. Hence, the Nubian Desert is a remote and rugged area.
The Nubian Desert is the main habitat of M. argun. However, until the 1990s, M. argun palms were rarely seen and even considered to be extinct (Gibbons and Spanner, 1996). Gold mining has been done in northern Sudan since the times of the Kingdoms of Kush and Meroe in Nubia (∼700 BC; Klemm and Klemm, 2013), but present-day gold mining has increased by both companies and locals (Salih, 1999; Maliński, 2017), with negative effects on M. argun populations. In addition, the Nubian Desert is facing increasing aridity due to climate change (Blach-Overgaard et al., 2015). All these factors pose further threats to the extant range of M. argun and may possibly lead to increasingly fragmented habitats and populations. Concrete knowledge of the genetic resources, genetic differentiation, and population dynamics of M. argun is a prerequisite for reliable conservation planning and protection measures. This information can be obtained through assessing genetic diversity and population genetic structure to define the impacts of habitat fragmentation and loss on population fragmentation, fitness and adaptability, as well as to plan sound conservation and management strategies (Ellstrand and Elam, 1993; Frankham et al., 2002).
To our knowledge, the only DNA-based population genetic study conducted on M. argun (Elshibli and Korpelainen, 2018) involved the development and use of chloroplast microsatellite markers (cpSSR). Although a limited number of cpSSR markers were used, the results showed the incidence of genetic erosion among M. argun generations but raised questions about the level of genetic diversity, differentiation, and gene flow based on information of the nuclear genome. Elshibli and Korpelainen (2018) suggested analyzing seed dispersal within the network of temporal flood waters, since this factor affects the survival and genetic structure of M. argun in Sudan. Mountain ranges shaping the valleys and watercourses in the Nubian Desert may be the only natural barriers of gene flow. Accordingly, our hypothesis is that the isolated, fragmented populations are genetically distinct with unique alleles.
In angiosperms, chloroplast genomes are maternally inherited and, hence, chloroplast DNA markers are effective tools to estimate the contribution of seeds or pollen to gene flow, influencing the population genetic structure of subsequent generations (Ennos, 1994; Petit et al., 2005; Nistelberger et al., 2015). In addition, different types of DNA markers showing different rates of evolutionary changes and modes of genomic inheritance (i.e., uniparental and biparental) have been used to reveal historical relationships and the evolution of plant species (Jansen et al., 2007). Genotyping-by-sequencing analyses (GBS) are a widely applied approach, facilitating the discovery of a large set of genome-wide markers [single-nucleotide polymorphisms (SNPs) and SilicoDArT markers]; they have been increasingly adapted to a wide range of applications in plant genetics and genomics (Andrews et al., 2016; Korinsak et al., 2019; Hall et al., 2020; Nadeem et al., 2021).
The first objective of this study was to investigate the level of genetic diversity and population genetic structure of M. argun in the Nubian Desert of Sudan based on the nuclear genome using SNP and SilicoDArT markers. Our second aim was to compare the amount and pattern of genetic variability between SNP and SilicoDArT markers, and the previously used cpSSR markers (Elshibli and Korpelainen, 2018), for the same plant material. The third objective was to estimate the contribution of seeds and pollen to gene flow in the studied populations.
Materials and Methods
Plant Material and Collection Sites
In November 2014, we conducted a field expedition looking for M. argun palms to sample them within the area described by Gibbons and Spanner (1996), although there was no previous data on the exact locations. Due to the harsh nature of the Nubian Desert, and to avoid getting lost, we hired two guides, who were local trade travelers aware of continuous, dense M. argun populations. Within a 2-day drive, we reached two sites of M. argun palms scattered along a diverging valley, part of the Wadi Gabgaba tributary system. The distance to reach the two sites was 7 km, while based on coordinates, the distance from site 1 (20°48′6.7″N, 34°25′29″E) to site 2 (20°49′2.3″N, 34°23′28″E) equaled 3.65 km. Figure 2 shows Google Earth-based views of the two collection sites and the distribution pattern of M. argun individuals. The two sites were characterized by a very dry environment, creeping sand dunes, and few shrubs, as well as abundance of bitter cucumber (Citrullus colocynthis). The two sites were separated by a series of mountains. Leaf samples were collected from 51 M. argun individuals from the two sites and visually categorized into three age classes (young, middle-age, and old palms). Age class categories were considered as representing different generations. The three age classes were distinct groups among all sampled M. argun palms: the trunk height of all old palms was above 5 m, middle-age palms between 3 and 4 m, and young palms < 1 m (Figure 3). Supplementary Table 1 shows the list of 51 samples, each with an identity code, assigned to site 1 or 2 and to the age category young, middle-age, and old. The collected samples included 19 young, 26 middle-age, and six old trees. Site 1 samples included 19 individuals with all three age class categories, and site 2 samples included 32 individuals representing young and middle-age class categories.
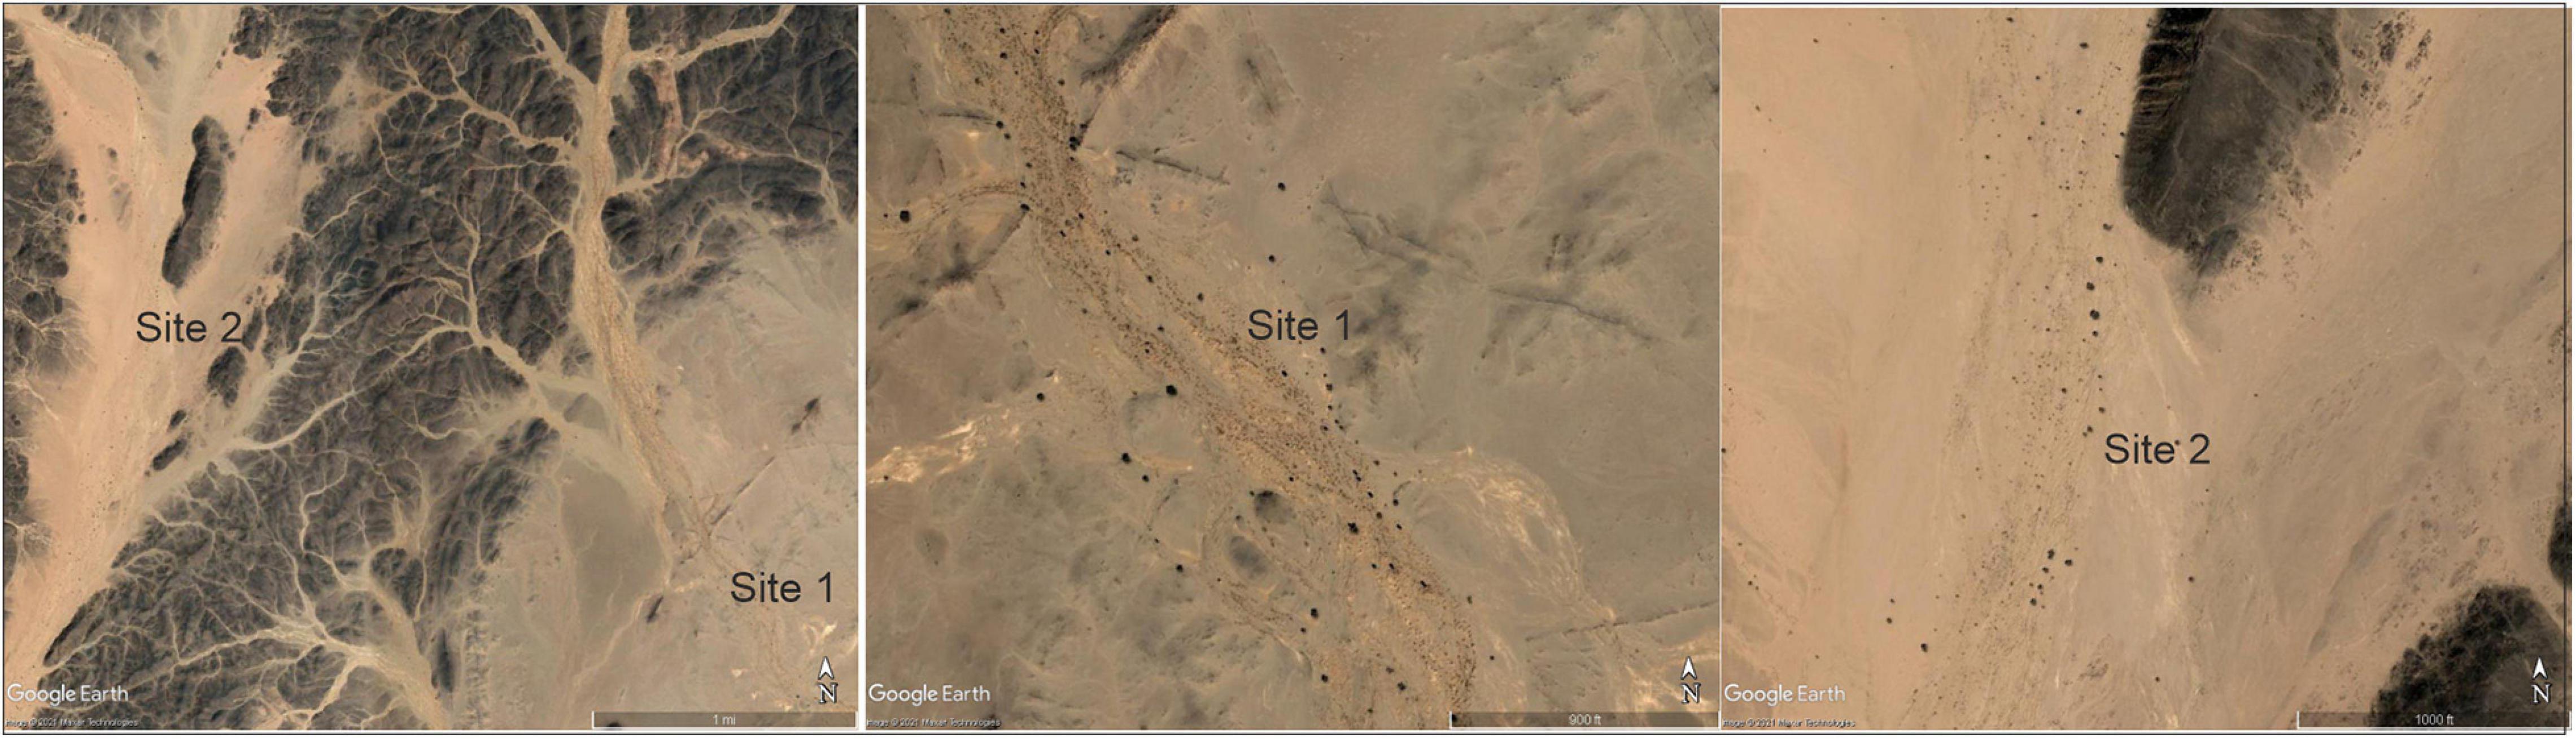
Figure 2. Google Earth views of the collection site 1 (20°48′6.7″N, 34°25′29″E) and site 2 (20°49′2.3″N, 34°23′28″E) showing mountain ranges and the pattern of the distribution of M. argun individuals. The black small dots are M. argun palms.
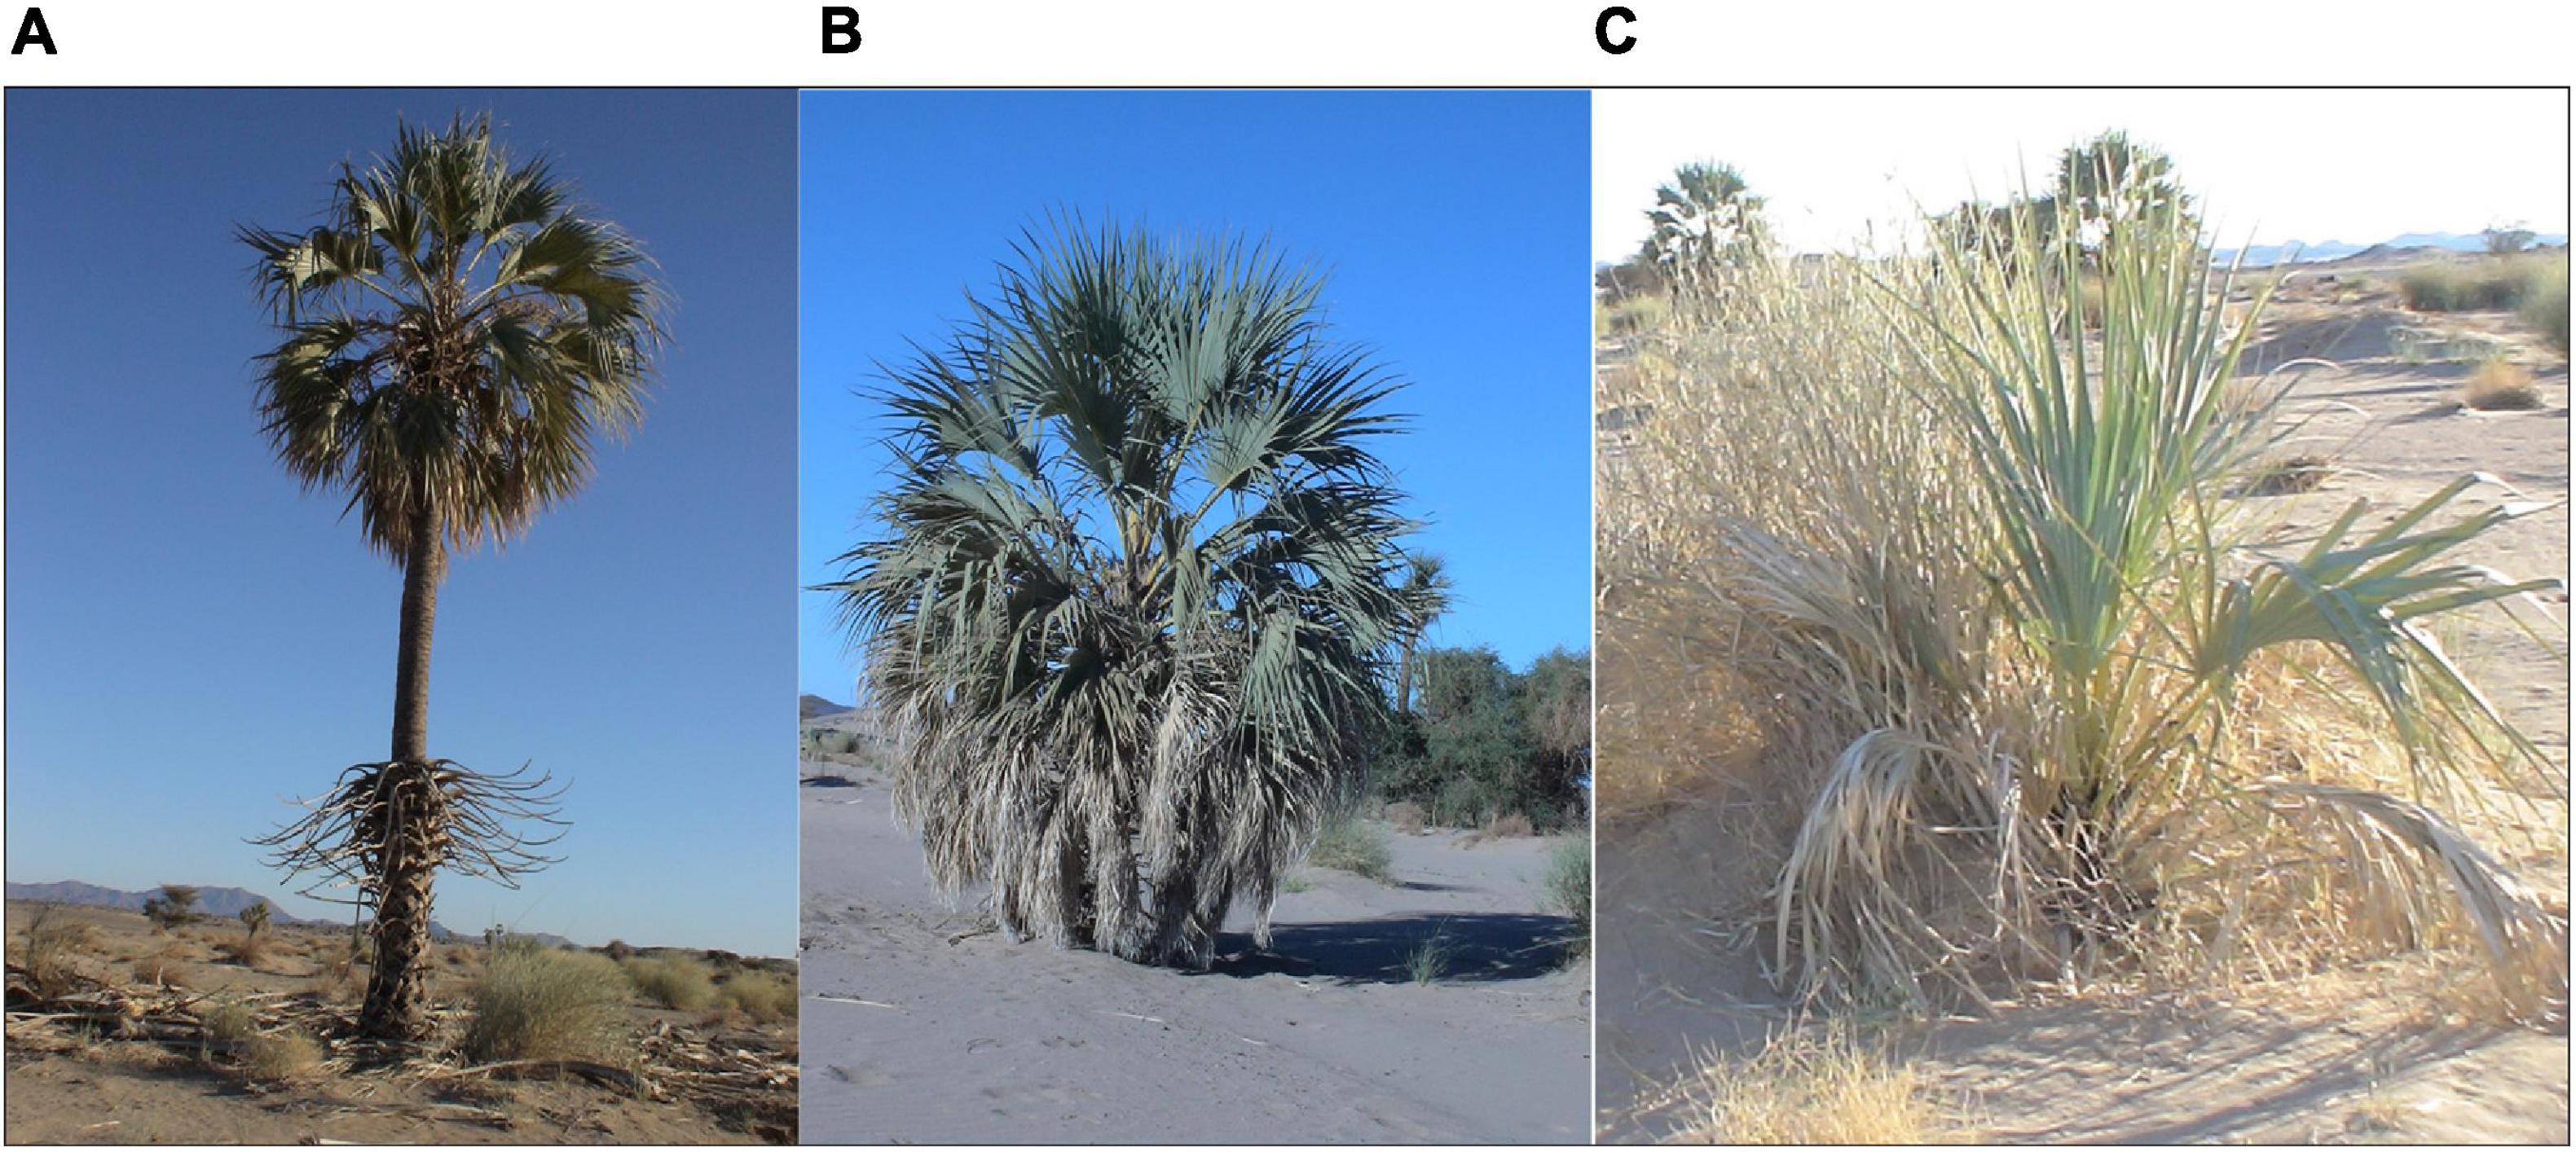
Figure 3. Examples of the age classes: (A) old, (B) middle-age, and (C) young.
DNA Preparation
The DNA utilized in this study corresponds to the same sampled material used in Elshibli and Korpelainen (2018). Total genomic DNA was extracted from dry leaves using the E.Z.N.A.TM SP Plant Mini Kit (Omega Bio-Tek, Norcross, GA, United States) following the manufacturer’s instructions. The DNA quality was checked using a NanoDrop Spectrophotometer (Thermo Fisher ScientificTM, Waltham, MA, United States) and further confirmed on 0.8% agarose gels. DNA samples were adjusted to a concentration of 50 ng/μl; 20 μl of each DNA sample was placed into a fully skirted 96-well PCR plate, packed, and shipped for genotyping.
Genotyping at the DArTseq Platform and Data Filtering
GBS were conducted using a whole-genome profiling service provided by Diversity Arrays Technology Pty Ltd. (Canberra, ACT, Australia). Diversity Arrays Technology (DArT) is one of the methodological concepts that generate multi-locus genome-wide markers and has a wide range of applications, including marker discovery, genotyping, and genetic diversity characterization (Jaccoud et al., 2001; Kilian et al., 2012). The DArTseq technology combines the DArT complexity reduction method and next-generation sequencing approaches (Sansaloni et al., 2011; Kilian et al., 2012). Complexity reduction was applied to select a defined fraction of genomic fragments in M. argun samples, named “representations,” which were then pooled to create a “gene pool representation” and used for cloning and library construction.
Several enzyme combinations were tested for complexity reduction and the discovery of genomic fragments. DNA samples were exposed to digestion–ligation reactions using restriction enzymes, namely, Pstl in combination with Sphl, with the addition of barcoded adaptors corresponding to the overhangs of the two restriction enzymes. Two microliters of the digestion/ligation reaction were amplified with primers required for Illumina DNA sequencing. The PstI–SphI mixed fragments were amplified using the following PCR program: denaturation at 94°C for 1 min followed by 30 cycles of denaturation at 94°C for 20 s, annealing at 58°C for 30 s, elongation at 72°C for 45 s, and a final extension at 72°C for 7 min.
Amplicons from each sample of the 96-well plate were pooled and exposed to c-Bot (Illumina) bridge PCR and then sequenced using Illumina HiSeq 2500 for 77 cycles. The in-house marker-calling algorithm DArTsoft14 was used to extract two types of markers, SilicoDArT and SNP, as well as metadata for final marker selection and statistical analyses. Two samples (OS1-2 and MS1-7; Supplementary Table 1) failed due to a poor DNA quality.
Initially, we obtained 348 SNPs and 28,184 binary SilicoDArT markers. The qualities of both types of markers were determined by a set of parameters, including reproducibility and call rate percentages, while other parameters were based on the type of marker. SNP markers were first filtered for all secondary and monomorphic loci. In addition, SNP data were filtered for call rate at the threshold of 0.95; the threshold of reproducibility was set at 0.99. All SNP loci were checked for significant (alpha = 0.001) departures from the Hardy–Weinberg equilibrium (HWE; Bonferroni corrected), but all of them were found to follow HWE. SilicoDArT markers were filtered for monomorphic loci, and call rate was set at the threshold of 0.95, while the minimum value of reproducibility was 0.99. Filtered data were used for subsequent diversity and genetic structuring analyses. Data filtering was performed using the R 4.0.2 (R Core Team, 2020) package DARTR (Gruber et al., 2018).
Data Analyses
Genetic Diversity
Data filtering retained 40 SNP and 9,866 SilicoDArT markers for 49 M. argun individuals. Frequency distributions of polymorphism information content (PIC) values were computed for both marker types. For the whole set of M. argun samples and for both SNP and silicoDArT data, various genetic diversity indices were computed using the package DARTR. Diversity indices included the average expected heterozygosity of the subpopulations/groups (HS), the expected heterozygosity of the total population (HT), the corrected HT (HTP), and the total genetic diversity among populations DST and corrected DST (DSTP). In addition, the fixation index (FST) and corrected FST (FSTP) as well as the inbreeding coefficient (FIS) were computed (Nei, 1987).
Relatedness and Population Structure
Principal coordinate analyses (PCoA) were applied to investigate genetic relationships among individuals from different sites and generation groups using the package DARTR. For both SNP and SilicoDArT markers, Euclidean distance matrices were generated based on allele frequencies, and the corresponding unrooted neighbor-joining trees were constructed using the package DARTR. Based on Euclidean distance matrices, we tested the relationship between SilicoDArT and SNP markers, as determined by a Mantel test (Mantel, 1967) using 999 permutations.
Analyses of molecular variance (AMOVA; Excoffier et al., 1992) were conducted to determine, in a hierarchical manner, the contributions of among- and within-group variation to the total genetic variation of M. argun samples using GenAlEx 6.5 (Peakall and Smouse, 2012). The significance of the variance components was evaluated using 999 permutations. Pair-wise genetic differentiation among groups of different generations and sites was estimated as pairwise FST values following Weir and Cockerham (1984) and using the package DARTR. In addition, the amount of gene flow (Nm) between gene pools was calculated based on FST estimates, Nm = [(1/FST) − 1]/4.
To find the best-fitting grouping of M. argun individuals, we used Bayesian methods implemented by the software BAPS 6.0 (Tang et al., 2009; Corander et al., 2013). Admixture analysis based on mixture clustering of individuals was chosen to estimate the K value that best explains the distribution of individual samples into different genetic clusters. The upper bound to the number of clusters was set to 20, and the input number of iterations was 50. A UPGMA tree (unweighted pair group method with arithmetic mean) was constructed based on the Kullback–Leibler divergence matrix as an output of mixture clustering of individuals. Based on the admixture results, we used the plot gene flow function of the BAPS software to estimate and plot the network of clusters.
Pollen and Seed Contributions to Gene Flow
We estimated the relative levels of gene flow contributions from seed and pollen migration by comparing nuclear DNA (SNP/SilicoDArT markers) differentiation detected in this study with chloroplast DNA differentiation previously analyzed by us (Elshibli and Korpelainen, 2018) for the same set of M. argun samples. Gene flow (Nm) based on cpSSR markers was calculated following McCauley (1995) as Nm = (1/FSTc − 1)/2, where FSTc is the population differentiation based on cpDNA. Gene flow (Nm) based on nuclear DNA was estimated according to Wright (1951) as Nm = (1/FST − 1)/4 (Ennos, 1994). The ratio of pollen to seed flow was calculated according to Ennos (1994), but see Freeland et al. (2012), with the following equation assuming that the chloroplast inheritance is strictly maternal:
FST(b) is the population differentiation calculated for biparentally inherited loci, i.e., SNP and SilicoDArT markers in this study. FST(m) is the population differentiation calculated for maternally inherited cpDNA loci, i.e., cpSSR markers based on Elshibli and Korpelainen (2018).
Estimates of FST for cpDNA (cpSSR) were replaced by PhiPT values estimated for each group of generations and collection sites and were calculated using GenAlEx version 6.503 (Peakall and Smouse, 2006, 2012) for haploid microsatellites (see Elshibli and Korpelainen, 2018). For nuclear DNA, SNP, and SilicoDArT markers, we also used PhiPT values calculated with GenAlEx 6.5 (Peakall and Smouse, 2012) to make the comparisons between different markers more feasible. PhiPT values have been used to calculate gene flow (Nm) by GenAlEx 6.5 (Peakall and Smouse, 2012) as Nm = [(1/PhiPT − 1]/4.
Results
A total of 40 SNP and 9,866 SilicoDArT markers obtained for 49 individuals were used to examine the amount and pattern of genetic variation in M. argun, representing two collection sites and three generation groups. The mean value of polymorphic information contents (PIC) was lower for SNP markers than for SilicoDArT markers and equaled 0.05 for SNPs and 0.15 for SilicoDArT markers. For SNP markers, values of 0.05 were most frequent, while values of 0.1 and 0.15 were least frequent; for SilicoDArT markers, values of less than 0.05 and of 0.15 were most frequent, while values of 0.4–0.5 were least frequent (Figure 4).
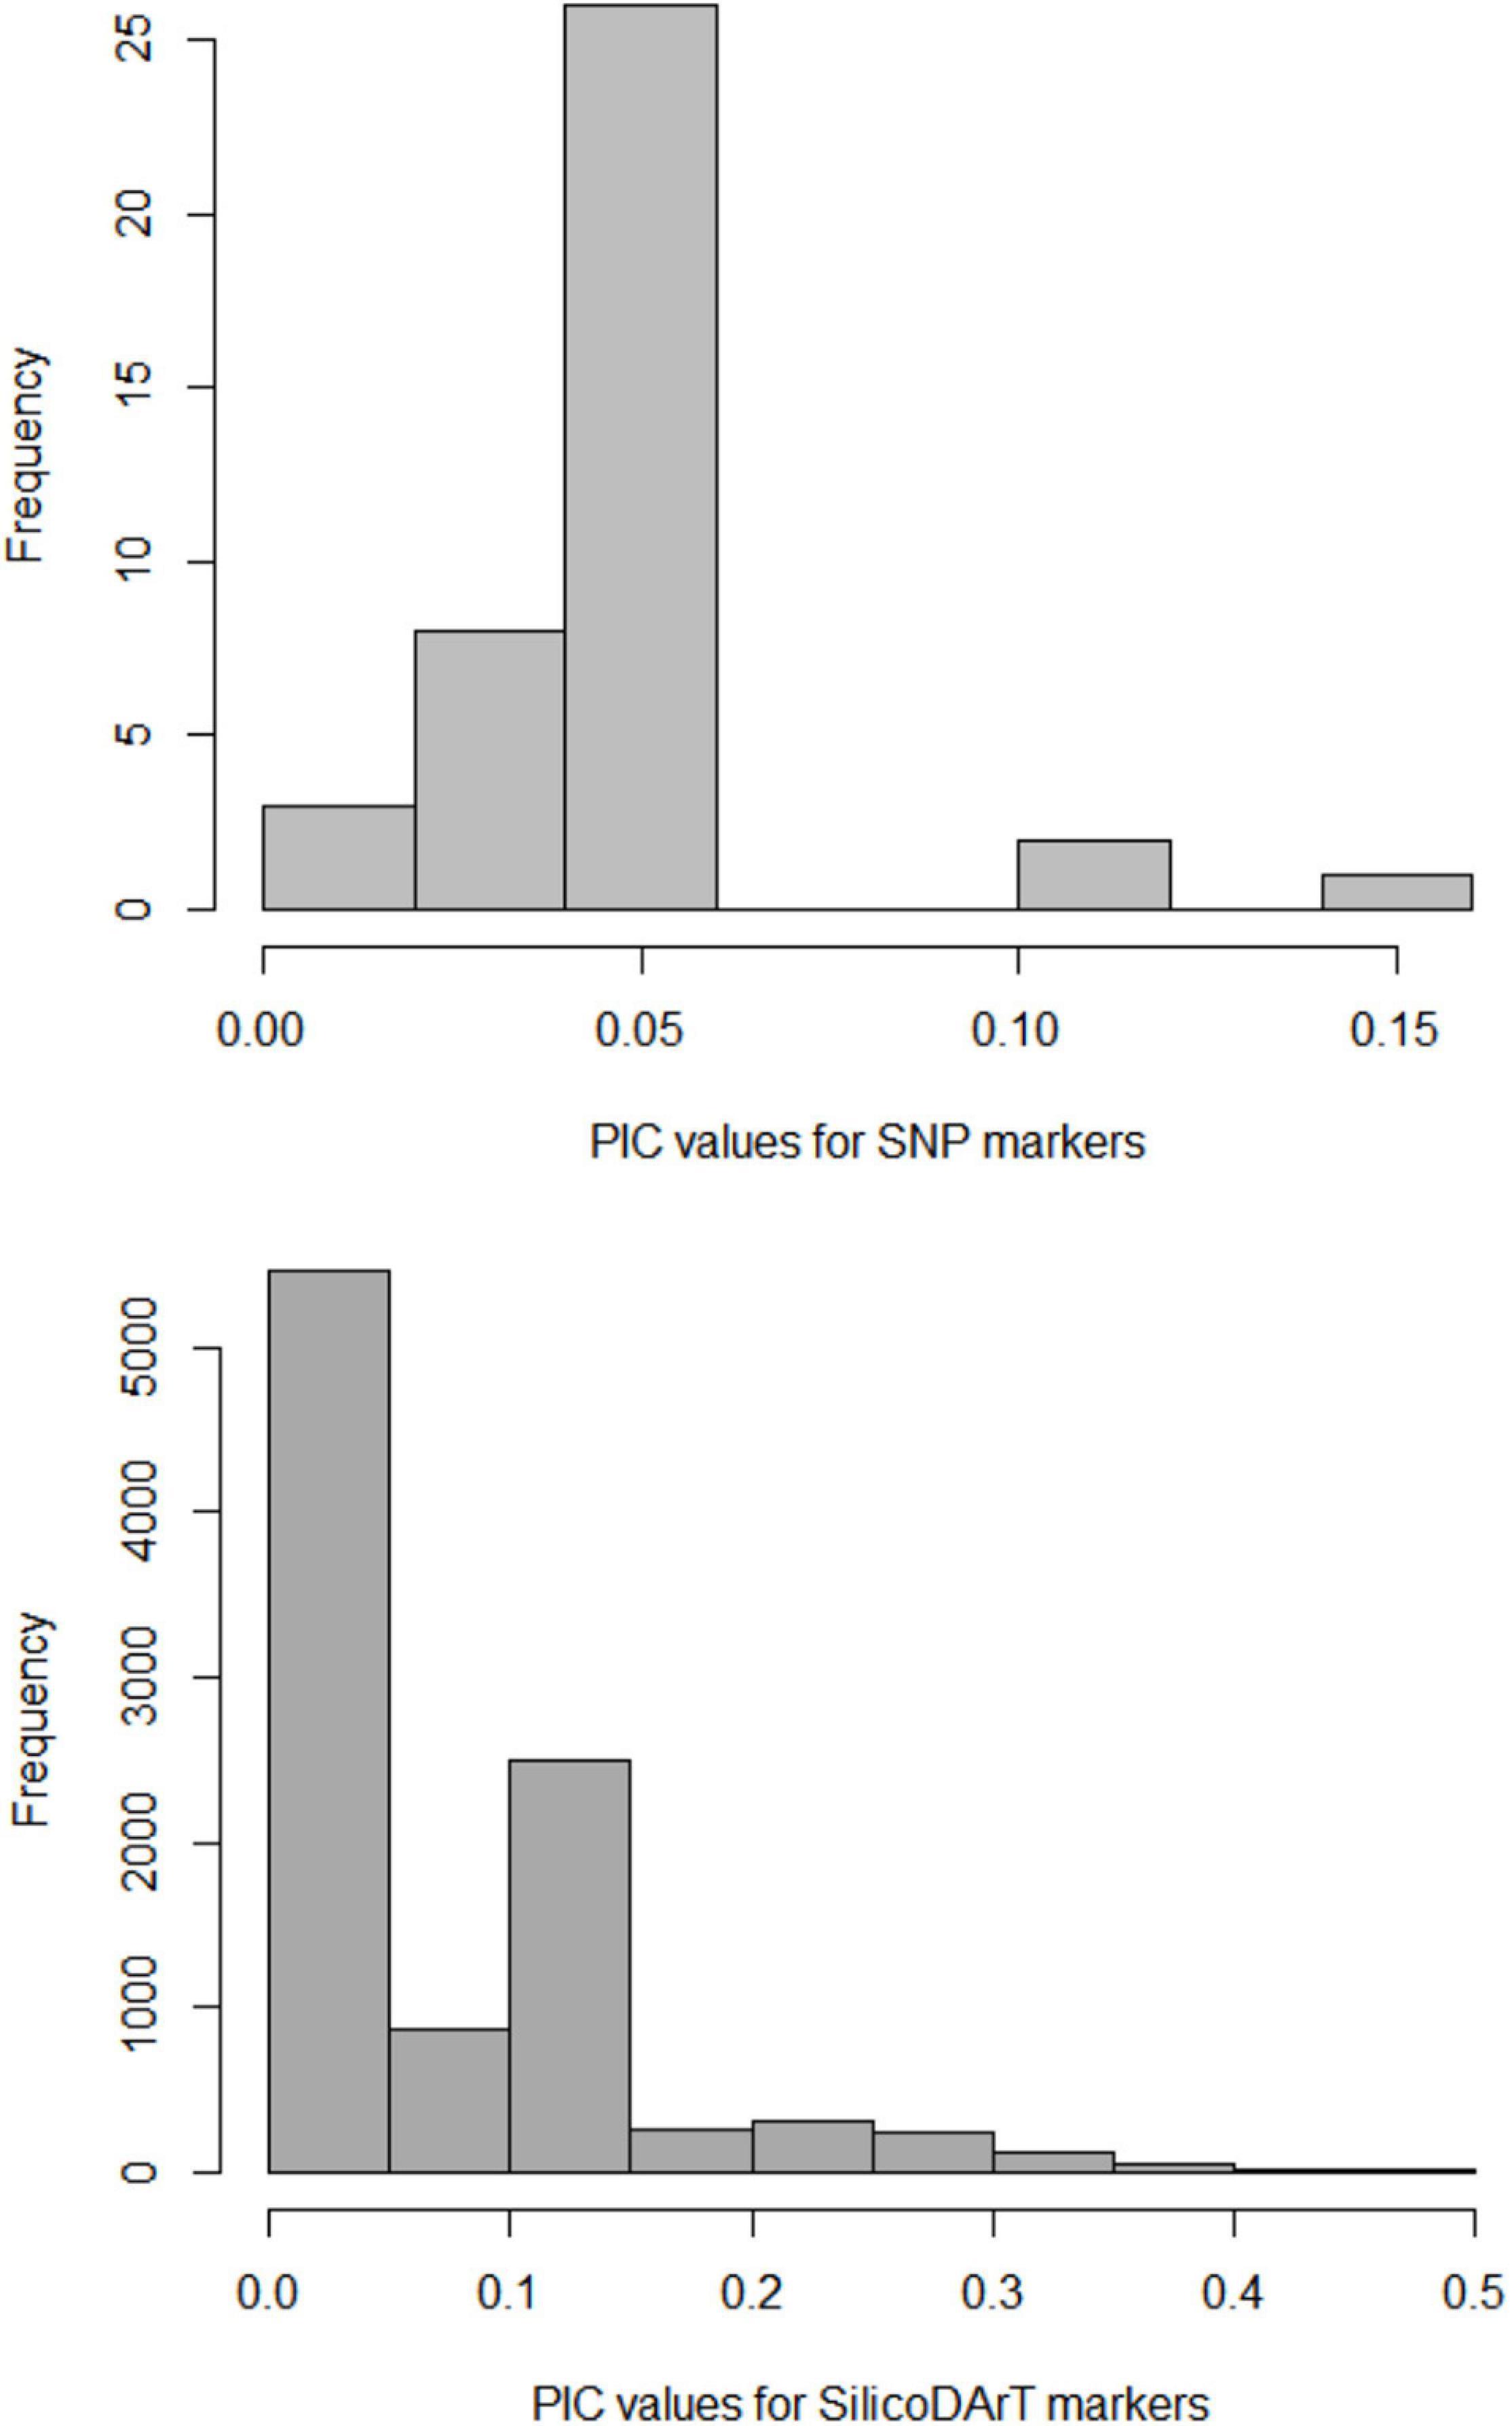
Figure 4. Frequency distribution of polymorphic information contents (PIC) values for SNP and SilicoDArT markers.
Genetic Diversity
The SNP markers showed a lower total genetic diversity, and a lower genetic diversity and genetic differentiation among groups compared to SilicoDArt markers. The HT, DST, and FST values were 0.036 (HTP = 0.037), 0.002 (DSTP = 0.003), and 0.052 (FSTP = 0.076) for SNPs, respectively, and 0.127 (HTP = 0.133), 0.012 (DSTP = 0.018), and 0.092 (FSTP = 0.133) for SilicoDArt markers, respectively. The average expected heterozygosity of the subpopulations/groups (Hs) was 0.034 for SNP data and 0.115 for SilicoDArT markers. The mean observed heterozygosity (HO) was 0.035 for SNP markers and 0.176 for SilicoDArT markers.
Relatedness and Population Structure
The PCoA conducted for the M. argun population showed that the total amount of genetic variation explained by the first three principal coordinates was 49.8% (22.3, 15.5, and 12% for each coordinate, respectively) for SNP markers and 72% (37.3, 20.5, and 14.2%, respectively) for SilicoDArT markers. Based on SNP markers, there was no specific distribution pattern among M. argun individuals in relation to generation groups (Figure 5A1) or collection sites (Figure 5A2). However, based on SilicoDArT markers, there was notable substructuring of individuals among generation groups (Figure 5B1) and slight substructuring among collection sites (Figure 5B2).
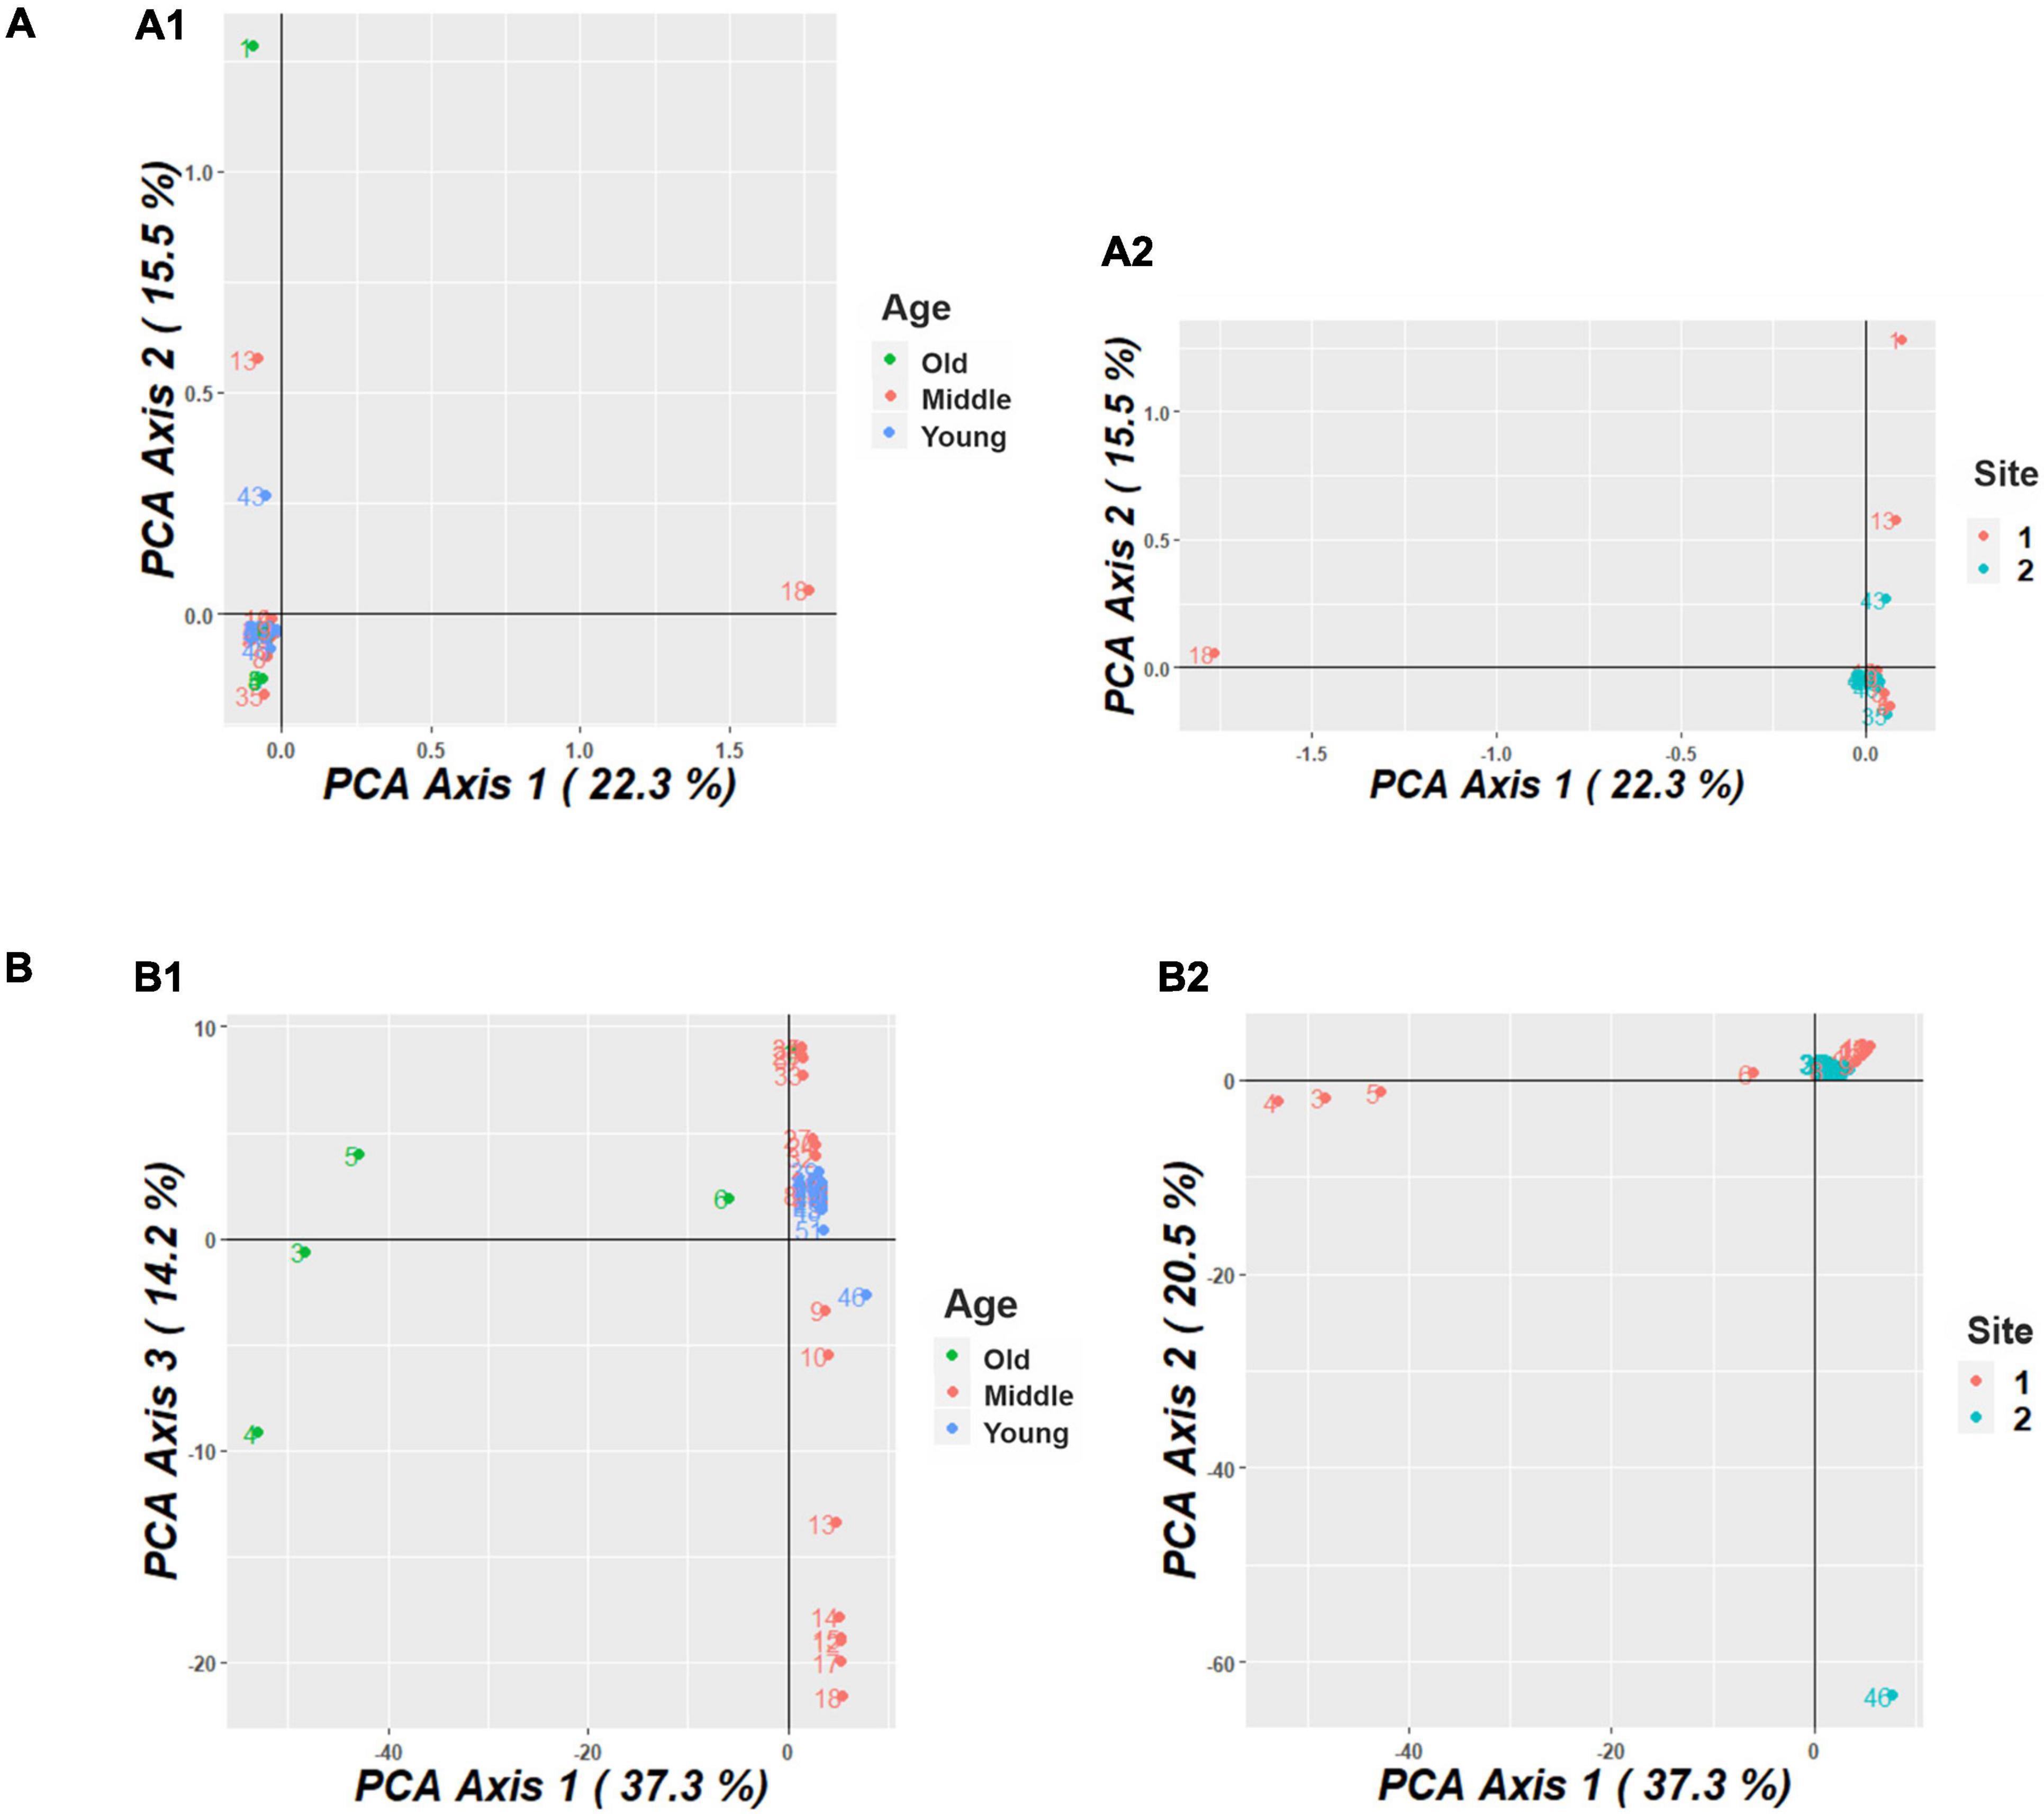
Figure 5. (A) Principal coordinate analysis (PCoA) plot, based on SNP markers, showing the distribution of M. argun samples from (A1) three generations (old, middle-age, and young) and (A2) two collection sites in Sudan. (B) Principal coordinate analysis (PCoA) plot, based on SilicoDArT markers, showing the distribution of M. argun samples from (B1) three generations and (B2) two collection sites.
Based on SilicoDArT markers (Figure 5B1), the old individuals (numbers 3–6) appeared to be distributed distantly along PCo1, while young individuals were grouped at the intersection of PCo1 and 3. The middle-age individuals were distributed along PCo3 showing some substructuring pattern. Yet, there is some degree of overlapping among individuals representing different generation groups. Overlapping individuals include mostly young ones, but also the old individual number 6 and a subgroup of middle-age palms located on the upper side near the intersection of PCo1 and 3.
The cluster displayed by the neighbor-joining (NJ) cluster analysis (Figure 6) confirmed the patterns displayed by PCoA for both types of markers. No specific pattern was observed for SNP markers (Figure 6A). The clearer clustering based on SilicoDArT markers grouped M. argun genotypes into five clusters (Figure 6B). Cluster 1 (at the bottom) included two middle-age palms collected from site 2, while Cluster 2 included a group of middle-age palms collected from site 2 and one old palm from site 1. All genotypes within Cluster 3 are middle-age palms from site 1, Cluster 4 included four old palms from site 1 and one young individual from site 2, and Cluster 5 is a mixture of middle-age palms from sites 1 and 2 and most young palms from site 2. All individuals in Cluster 5 (at the top) show no definite grouping. A positive correlation was found (r = 0.396, p < 0.01) between SNP- and SilicoDArT-based Euclidean distance matrices, as determined by the Mantel test.
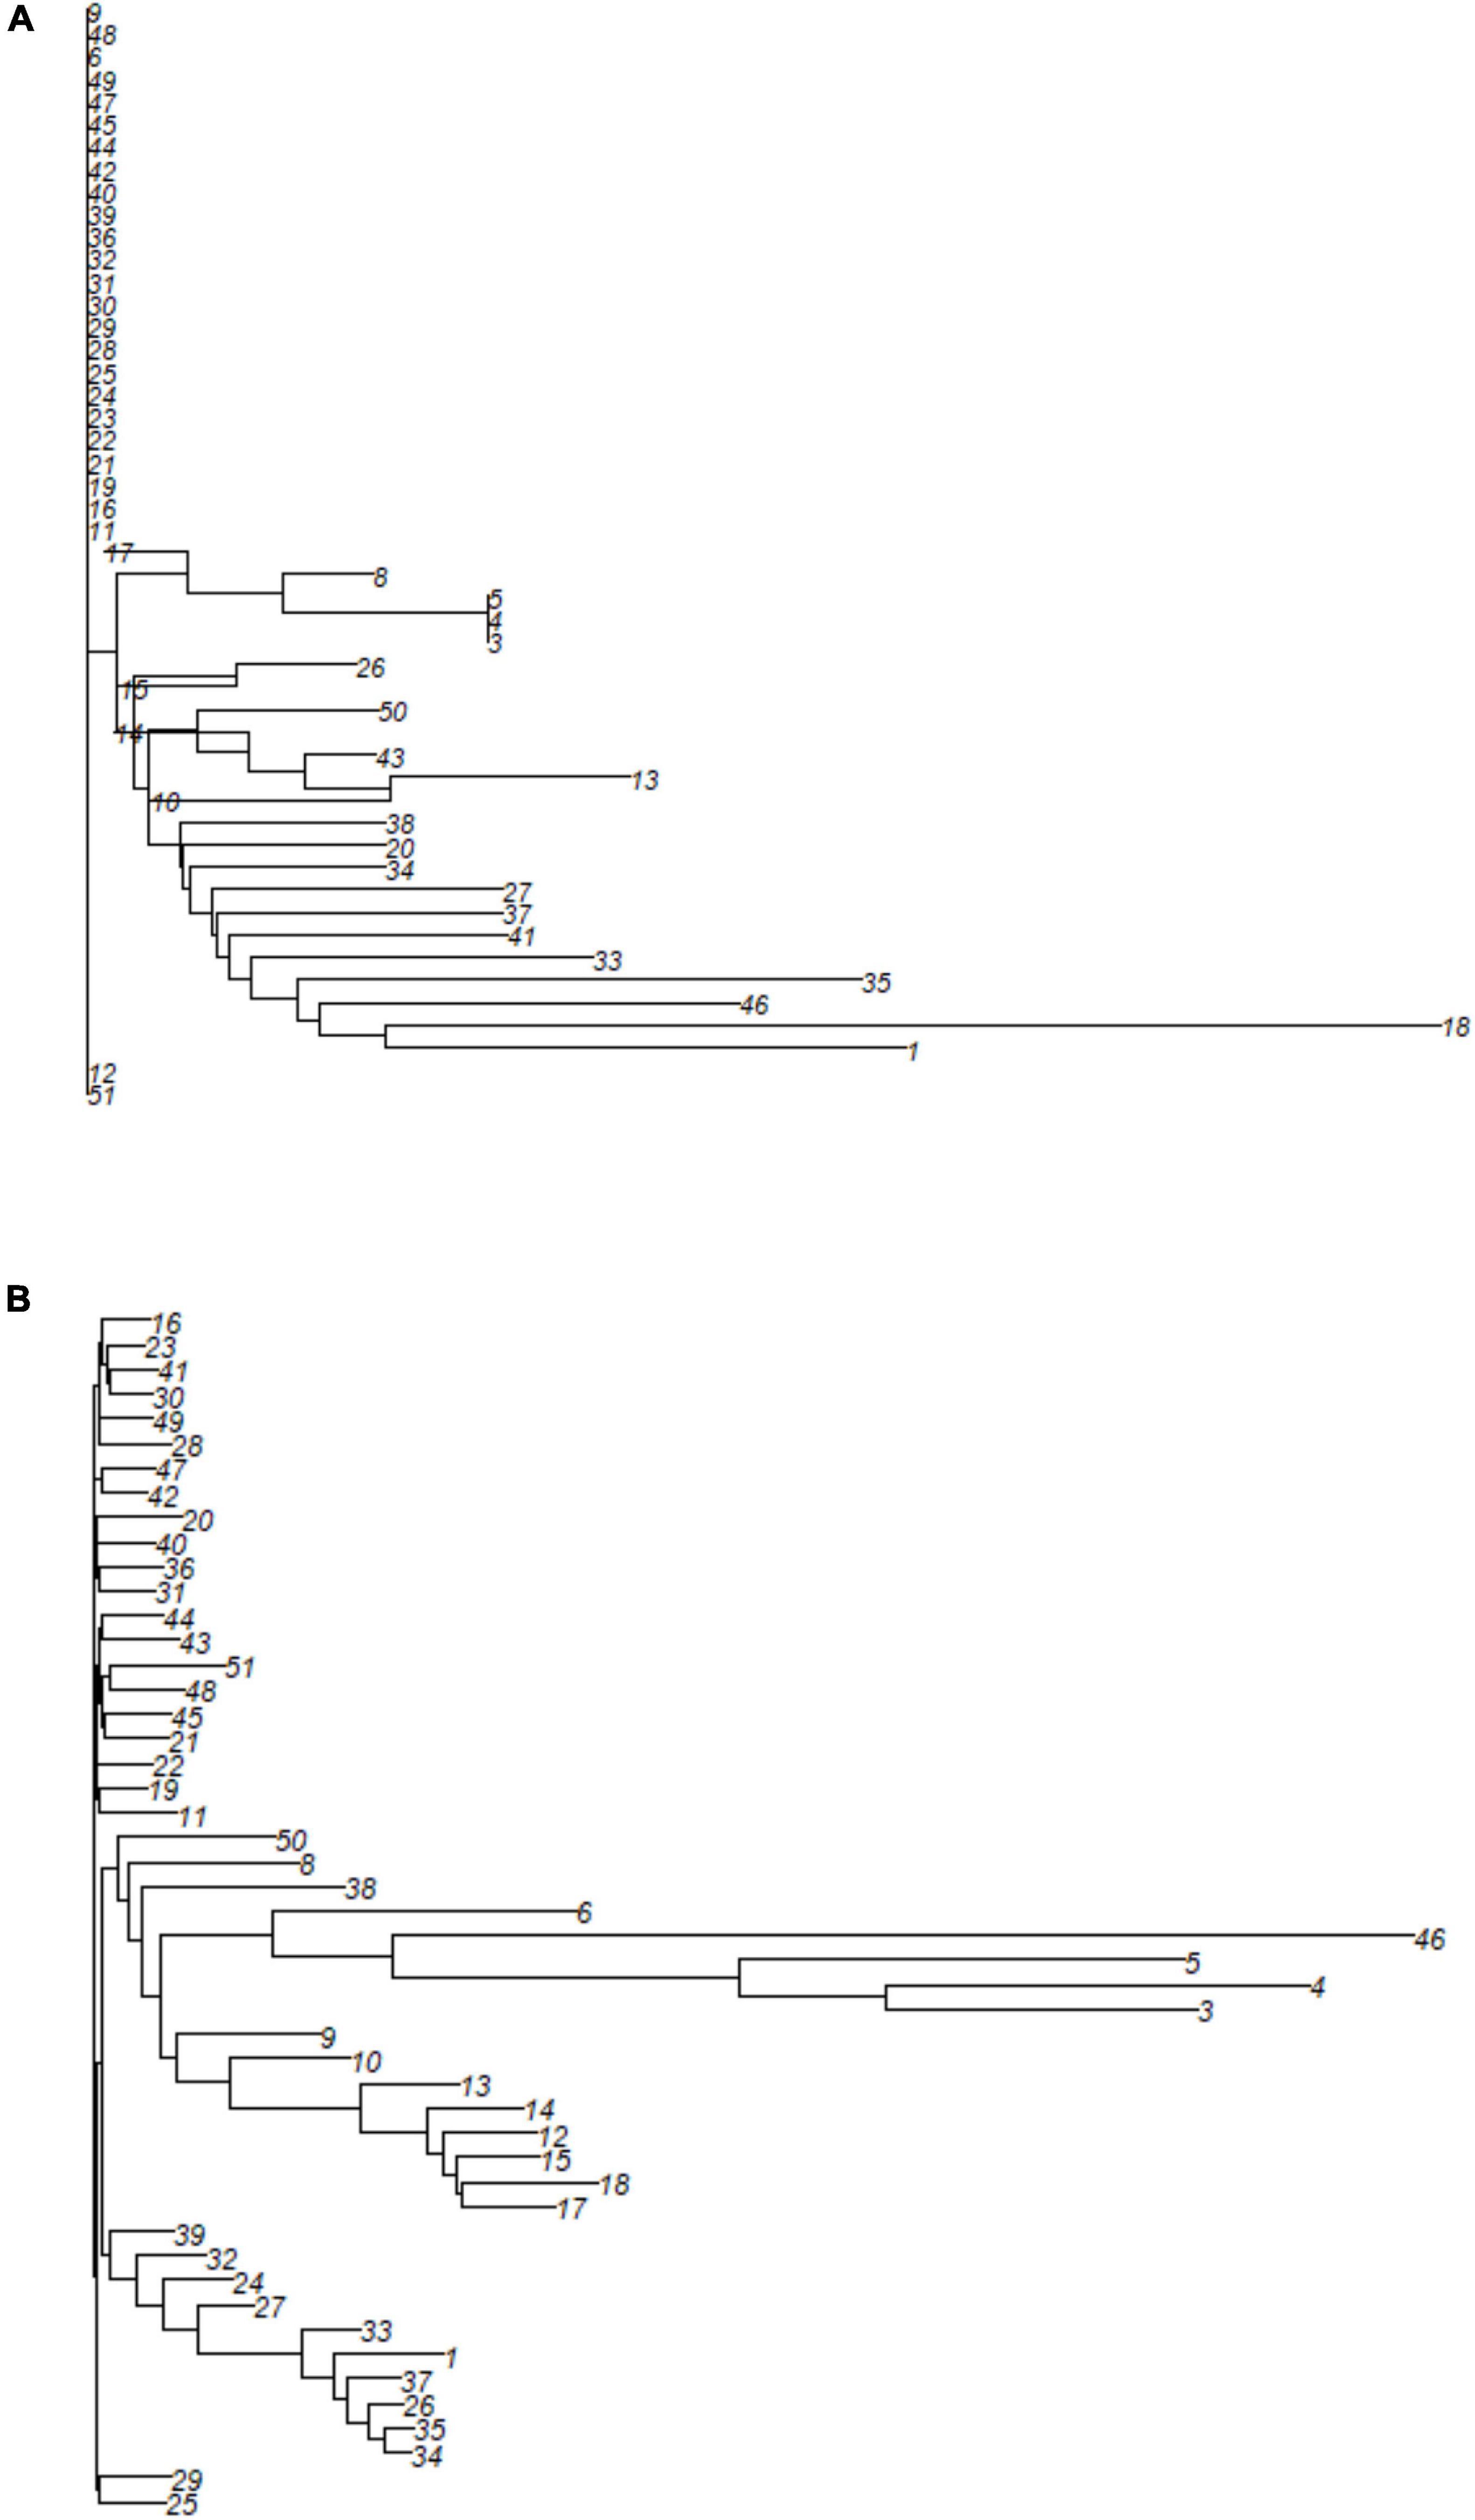
Figure 6. A neighbor-joining cluster analysis based on (A) SNP and (B) SilicoDArT markers to group 49 M. argun individuals. For information on collection sites and generation categories, see the corresponding individual numbers in Supplementary Table 1.
Based on SNP markers, most variation was within generations and sites, while variation among generations and sites was not significant (1%; p > 0.05, Table 1). Based on SilicoDArT markers, genetic variation among generations was 23% (PhiPT, p < 0.01), while 100% of variation was present within collection sites (PhiPT, p > 0.05, Table 1).
Table 1. Analyses of molecular variance (AMOVA) conducted for 49 Medemia argun samples based on SNP and SilicoDArT markers, including three age classes (generations) and two collection sites.
Based on SNP markers, the pairwise FST values equaled 0.109 (p < 0.05) between old and middle-age palms, and 0.177 (p < 0.01) between old and young palms with gene flow (Nm) equaling 2.044 and 1.162, respectively, while no differentiation was found between young and middle-age palms (Table 2). The pairwise FST value between the two collection sites was 0.025 (p < 0.01), and Nm was 9.75 (Table 2). The pairwise differentiation (FST) revealed by SilicoDArT markers was higher than that revealed by SNP markers, especially between old and middle-age palms (0.554; p < 0.01), and old and young ones (0.491; p < 0.01), which indicated limited gene flow. Considering generation groups, the lowest FST values were found between middle-age and young palms (Table 2). The pairwise FST value between the two sites was 0.121 (p < 0.01).
Table 2. Pairwise FST values and gene flow (Nm) based on SNP and SilicoDArT markers for generations and collection sites.
We used a Bayesian analysis to determine the number of genetic groups (K value). We found that K = 5 best explains the genetic structure of the M. argun samples (Figure 7A). Cluster 1 included one young individual from site 1 (YS1–40), Cluster 2 included one middle-age individual from site 1 (MS1–11), Cluster 3 included one young individual from site 2 (YS2–20), Cluster 4 included one old individual from site 1 (OS1–1), and Cluster 5 included 45 individuals belonging to different generations from both sites. Based on the admixture analysis, the revealed gene flow network (Figure 7B) showed that there is no ancestral intercluster gene flow between these five genetic groups. A similar clustering pattern was observed in the UPGMA tree constructed based on the divergence matrix, determined by the BAPS analysis (Supplementary Figure 1).
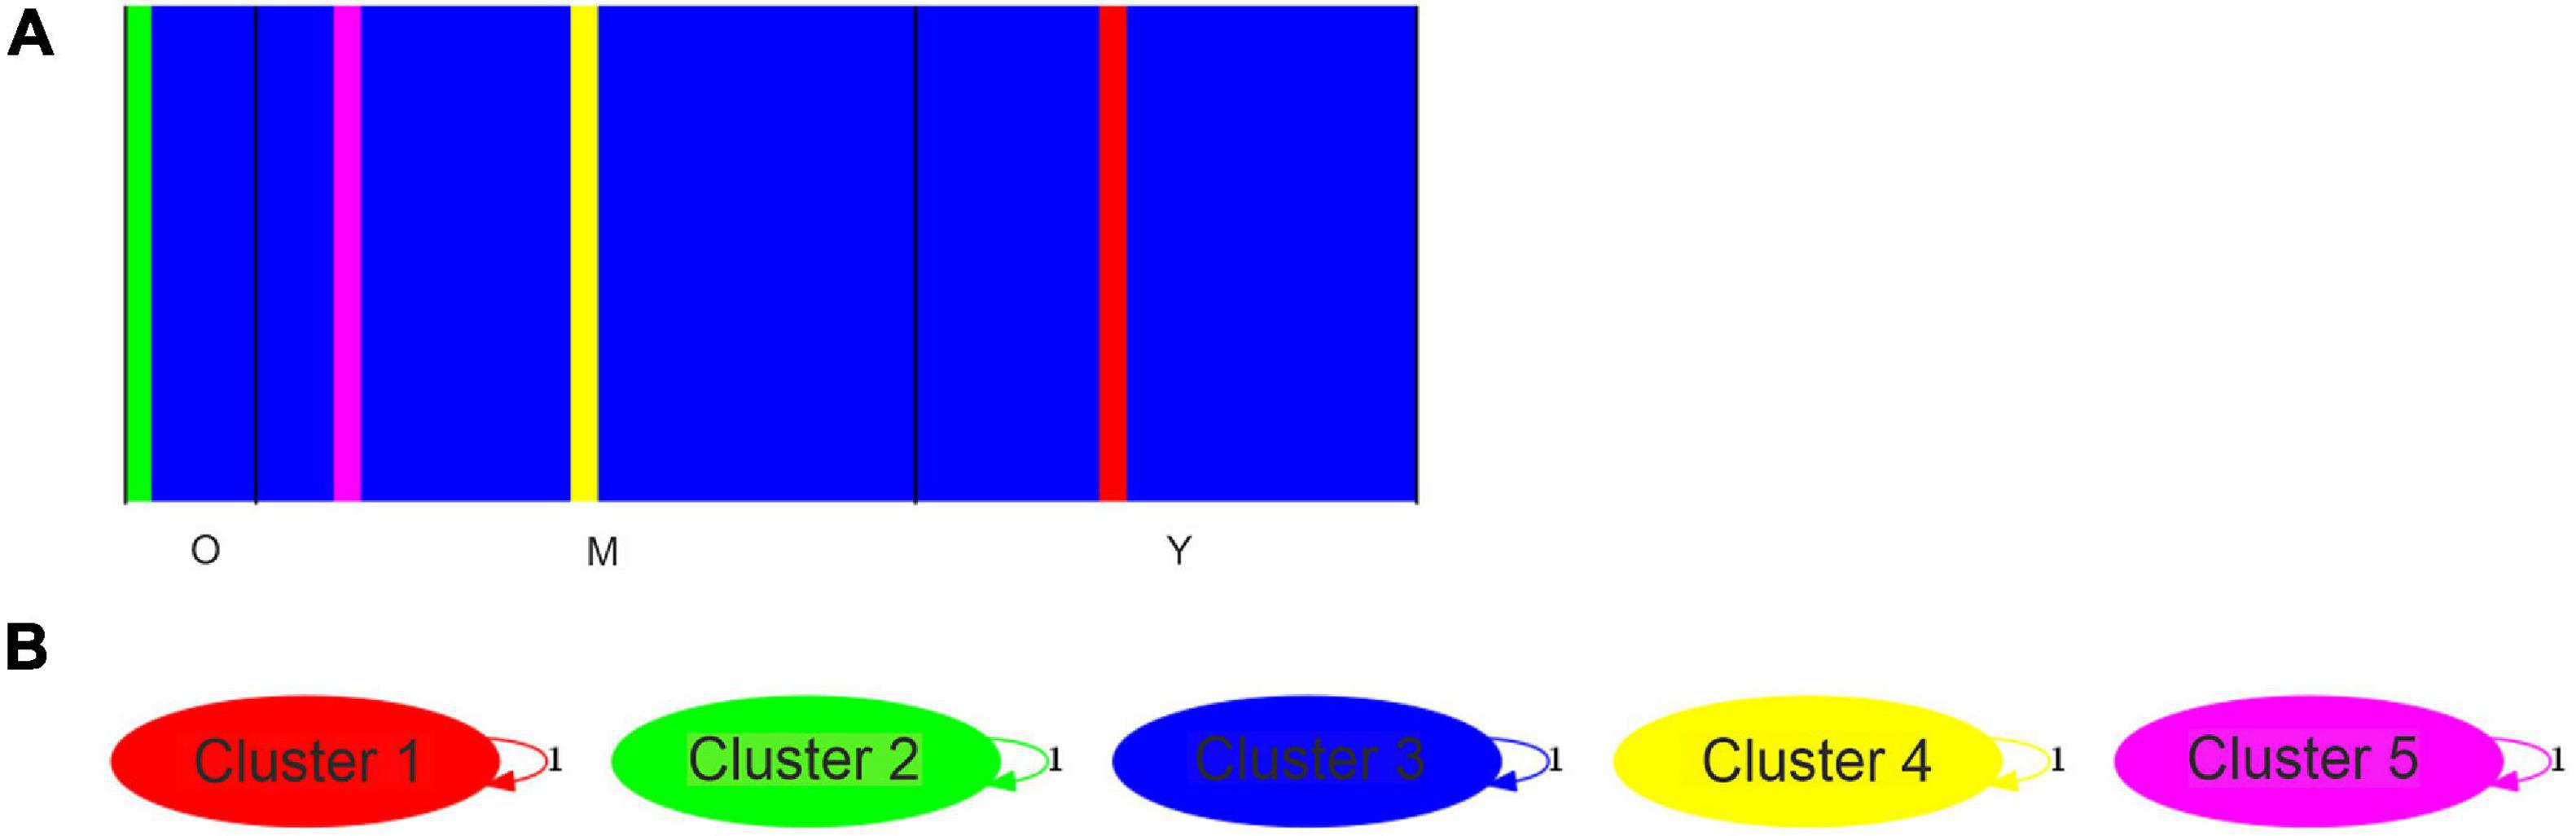
Figure 7. (A) Bar plot from the Bayesian clustering analysis of individuals from three generations of M. argun; O assigned for old, M for middle-age, and Y for young individuals. Bar plot for a K = 5 model based on SNP markers. (B) A gene flow network identified for the five clusters (K = 5) as obtained by BAPS based on SNP markers. Weighted arrows indicate relative average amounts of ancestry coming from the source cluster but present now among individuals assigned to the target cluster. However, no gene flow was detected. Cluster 1 = individual YS2–40, Cluster 2 = individual MS1–11, Cluster 3 = individual YS2–20, Cluster 4 = individual OS1–1, and Cluster 5 includes other 45 individuals belonging to different generations from both sites.
Pollen and Seed Contributions to Gene Flow
As discovered by Elshibli and Korpelainen (2018) based on cpSSR markers, the PhiPT value equaled 0.398 (p < 0.001) for generations/age classes and 0.116 (p < 0.028) for collection sites. We used these previous cpSSR marker results and the nuclear marker results from this study (PhiPT values; Table 1) to estimate the ratio of pollen and seed flow between different generations and collection sites. Based on SNP markers, the results revealed high pollen flow compared to seed flow, about 140 times for generation groups (ratio = 139.86) and about eight times for collection sites (ratio = 7.96). Based on SilicoDArT markers, pollen flow was about four times compared to seed flow for collection sites (ratio = 4.43), but seed flow was higher than pollen flow for generation groups (ratio = 0.16).
Discussion
Although lower diversities were observed for SNP markers compared to SilicoDArT markers, the overall diversity shows comparable trends for both marker types, as elucidated by the moderate positive correlation revealed by the Mantel test. The genetic diversity level is explained by the PIC values (Figure 4), which describe the degree of polymorphism at each locus (Botstein et al., 1980). The average PIC values in this study were less than 0.25 for both marker types, which indicates a low level of polymorphism (Botstein et al., 1980) in the sampled population. Similarly, a low degree of genetic variation was previously observed in M. argun based on chloroplast DNA markers (Elshibli and Korpelainen, 2018). On the other hand, data on tropical forest palm species indicate high expected heterozygosities (0.787 in Euterpe edulis, Novello et al., 2018; and 0.66 in Euterpe precatoria, Ramos et al., 2021). Overall, a wide range of PIC values were reported for other palm species, for example, based on SNP markers, in oil palm Elaeis guineensis, ranging from 0.223 to 0.375 (Ong et al., 2015), and from 0.066 to 0.375 (Pootakham et al., 2013). However, higher gene diversities were reported for other palm species; for example, the mean PIC value for the American oil palm (Elaeis oleifera) germplasm bank, including 553 samples from six geographic regions, collected in the Amazon rainforest in Brazil, was 0.355 (based on SNP markers, Pereira et al., 2020). Based on microsatellite markers, Ang et al. (2011) reported higher PIC values ranging from 0.491 to 0.932 (average 0.771) for the endangered and endemic palm Johannesteijsmannia lanceolata, sampled from the Angsi Reserve Forest in Malaysia. These high levels of diversities can be a result of biodiversity protection and management in the case of Angsi Forest Reserve and the wide coverage of diverse material collected in the case of the germplasm bank.
In this study, AMOVA showed less structuring among collection sites and generation groups than previously reported based on cpSSR markers (12 and 40%, respectively, Elshibli and Korpelainen, 2018). Different levels of genetic differentiation have been reported among natural populations of other palm species. For example, based on microsatellite markers, very low genetic differentiation was reported among natural populations of adult neotropical palms Oenocarpus bataua in a recently fragmented landscape and in a continuous forest in Ecuador (1.76%, Browne et al., 2015). Vardareli et al. (2019) reported lower genetic differentiation among six populations of the relict endemic Phoenix theophrasti in Turkey. The FST value was 0.34, and gene flow (Nm = 0.49) was very high within one generation among the six populations when compared to gene flow in M. argun based on SilicoDArT markers (old vs. younger individuals, Table 2). In M. argun, the gene flow (Nm) between the two sampled sites is high, while genetic differentiation based on FST values was significant among old and younger palm groups (Table 2), which confirmed the previously observed loss of genetic variation in M. argun palms among descending generations (Elshibli and Korpelainen, 2018).
For both marker types, the level of gene exchange was highest between young and middle-age palms as indicated by FST values (Table 2). Relatively similar genetic patterns among generations have been reported in a natural population of Pinus sylvestris, when comparing old (100 years) and middle-age trees (40–80 years) (FST = 0.129), and middle-age trees and seedlings (1–3 years old, FST = 0.037) (Wojnicka-Półtorak et al., 2017). The pairwise FST values between the two collection sites of both marker types were lower than found, for instance, among natural populations of endangered Hopea hainanensis trees (FST = 0.23) in tropical rainforest ecosystems (Wang et al., 2020).
da Silva Carvalho et al. (2015) found that variation in genetic diversity among 16 sites of seedlings in a tropical palm (E. edulis) in a human-modified rainforest was best explained by historical effective population sizes, while genetic differentiation is most likely influenced by recent changes caused by habitat loss and fragmentation. In agreement, Melo et al. (2018) reported that historical demography and environmental changes shaped the distribution and evolutionary success of the Amazonian palm (Mauritia flexuosa). These conclusions may explain the differences in the observed and reported levels of genetic differentiation and gene flow among different palm species including M. argun. Different trends were also observed among natural stands of species other than palms. For example, Dadjo et al. (2020) found only 0.86% genetic differentiation among sites in Garcinia kola (Heckel), which is an extensively utilized tree, and Wojnicka-Półtorak et al. (2017) reported 13% genetic differentiation among age classes in natural populations of P. sylvestris.
The pattern of genetic structure (Table 1) as well as the presence of extensive gene flow (Table 2) between collection sites showed that these two sites do not possess as distinct subpopulations as expected. Some valleys may receive seeds from a network of small tributaries that bring different genetic materials from more distant stands of M. argun (for example, see Figure 8), which can lead to the observed coexistence of genetically distant individuals. The presence of such individuals within a population can explain the low level of genetic diversity, suggesting a founder effect in small populations due to few, new seeds being brought to new locations during rainy seasons. To gain deeper insights into the genetic processes of M. argun, it would be important to locate and study denser and more continuous populations of this palm species.
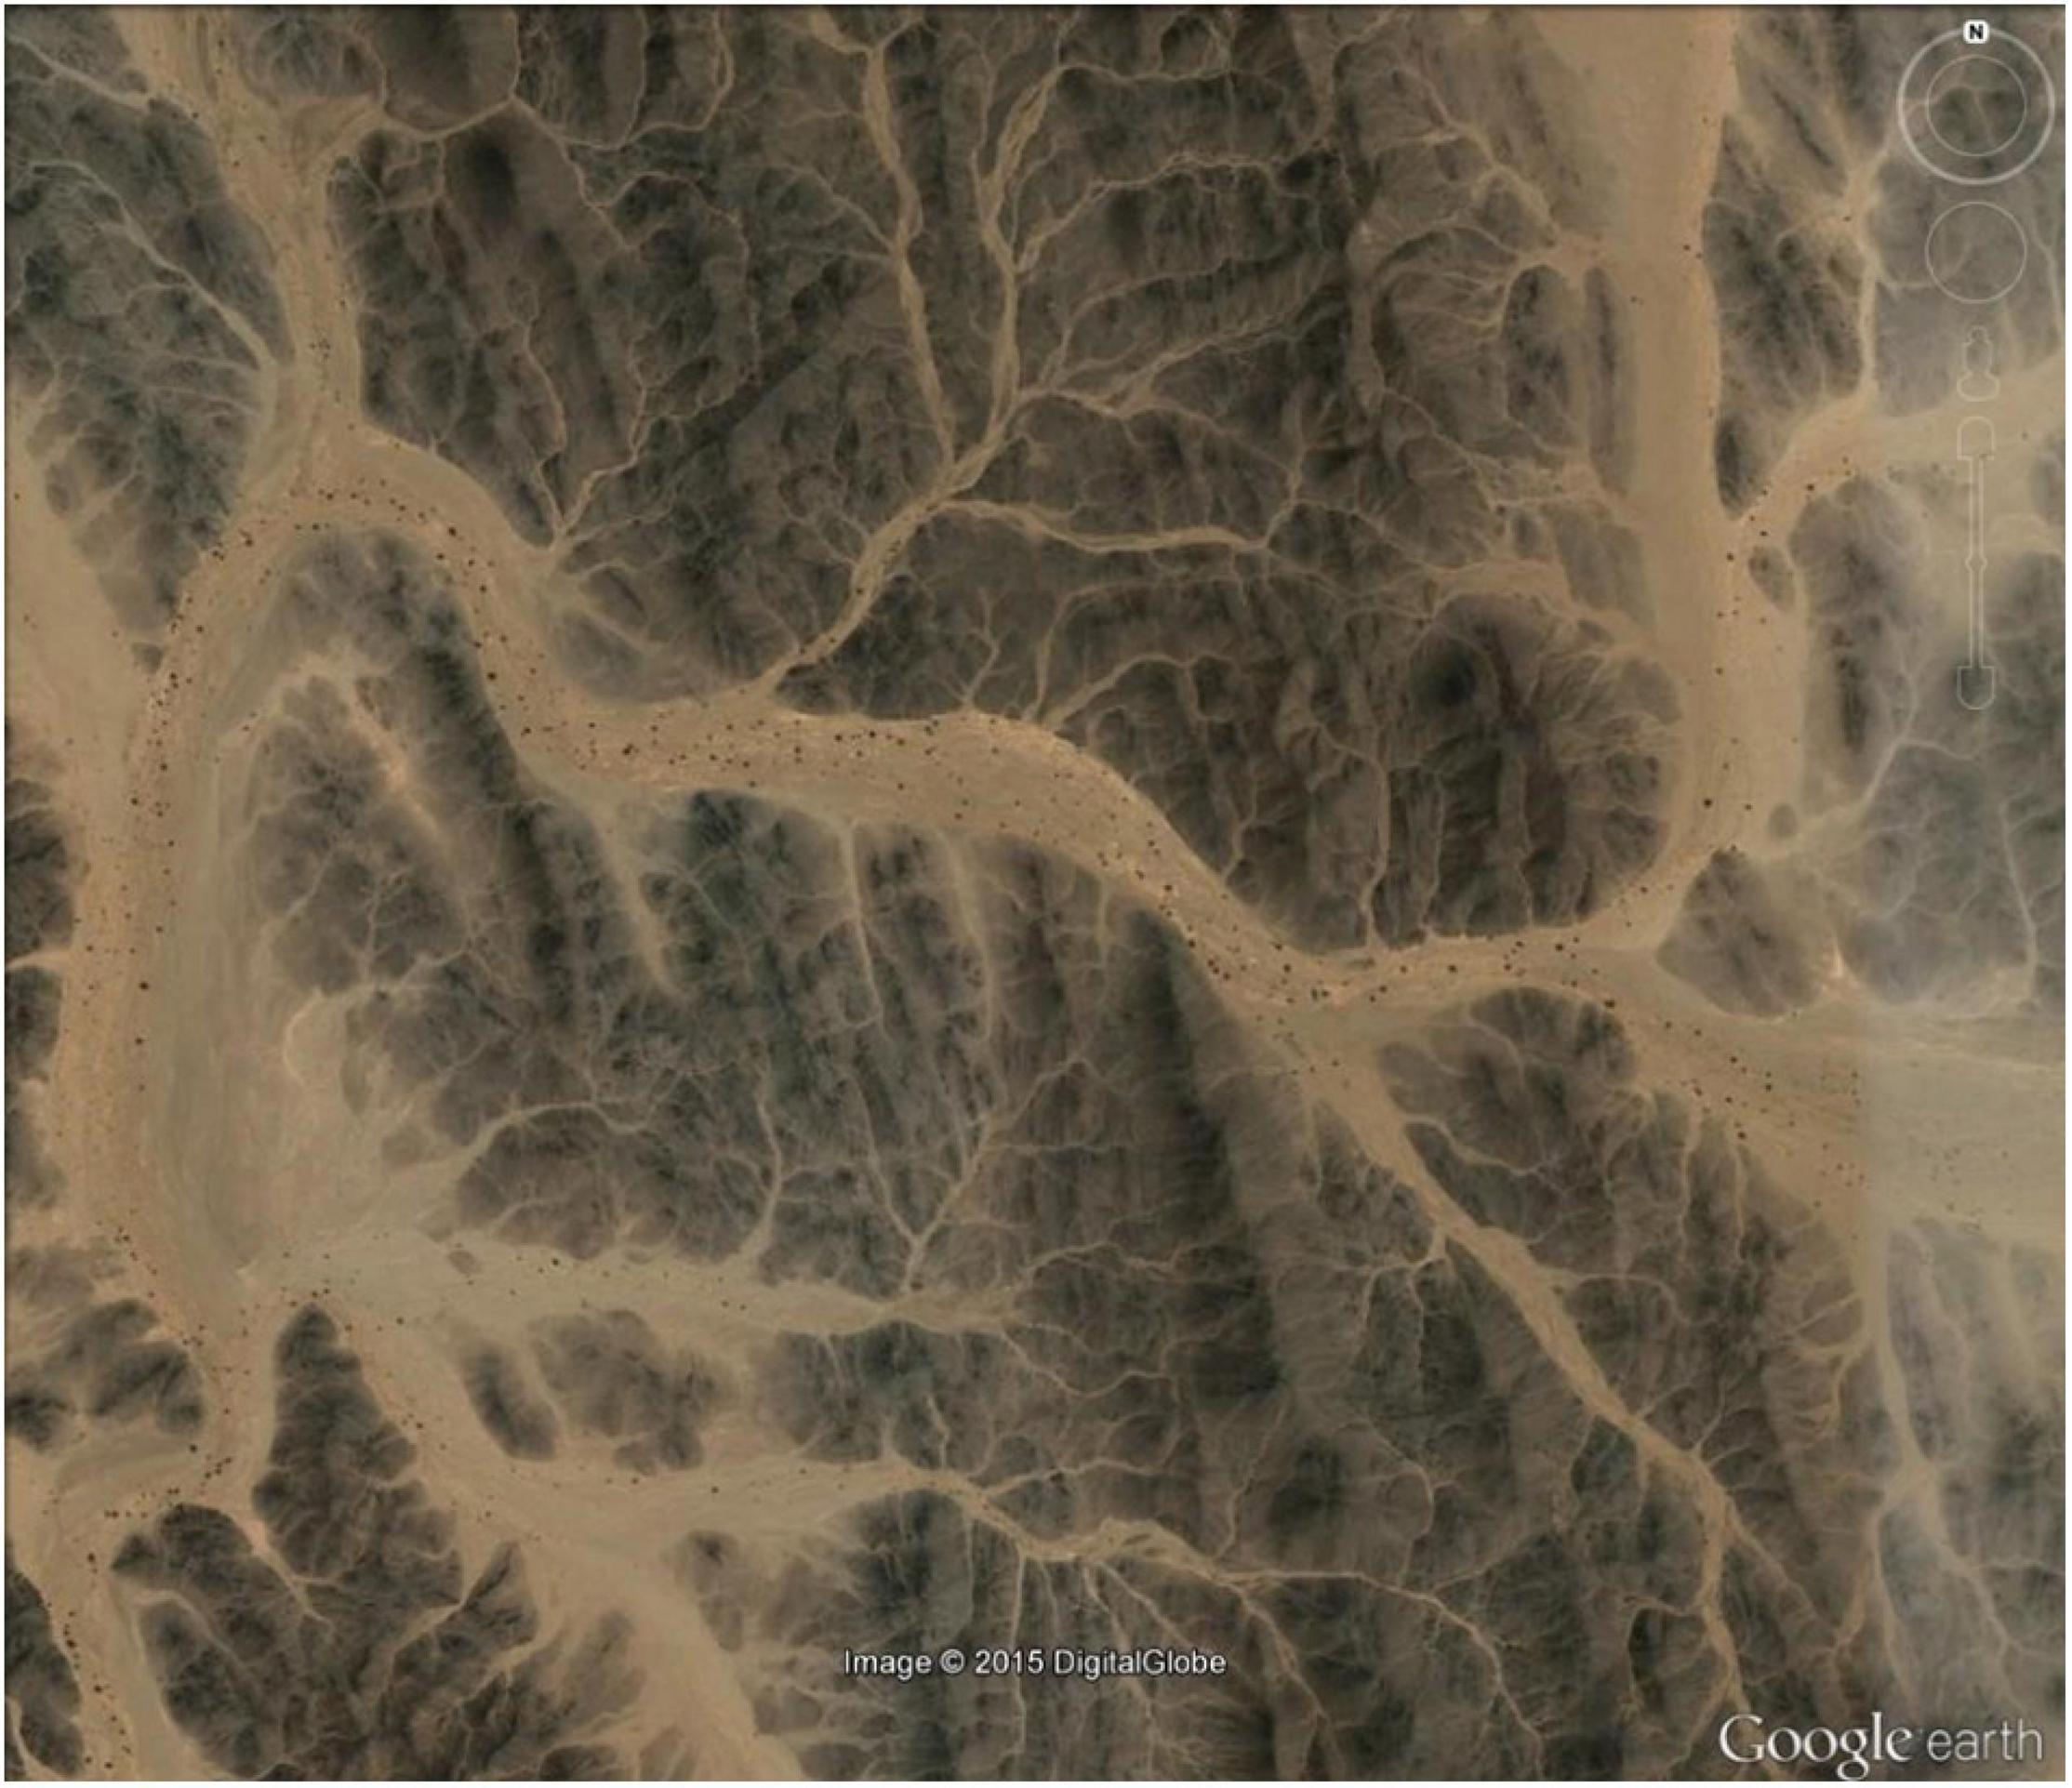
Figure 8. Google Earth view showing an example of M. argun habitat and the network of seasonal watercourses (the geographic coordinates: 20°59′34.96″N, 34° 40′00.20″E).
Based on the Sudan 1:250,000 Scale Survey Map (MaṣlaḥatAl-Misāḥah, 1909) and Google Earth map searches, we found previously unknown dense and continuous ranges of M. argun (Figure 9 and Supplementary Figures 2–4). These populations are located in the region from East (21°00′–21°33′N, 35°50′–36°19′E; Figure 1B) and through the Kiau Valley, around the Abu Dueim Mountain to Khor Abu Dueim, and they expand westward to Gabgaba Valley. Some names of the surroundings are indicative of the long historical existence of M. argun populations in the area. In addition, we found another unreported population of M. argun in the northwestern part of the Sahara within Sudan (Figure 10). The existence of these populations is very important for the sustainability of this species and is highly relevant for future research. Field visits to some of these populations are needed to precisely locate populations, to validate the proposed distribution based on Google Earth maps, and to collect samples with a wider coverage. Locating different populations and individuals as reference sources will facilitate research using remote sensing and analyses of Satellite Image Time Series, which will offer further opportunities for detecting and understanding spatial and temporal changes in M. argun populations and for determining the causes of these changes, with possibility for modeling and predicting future changes. Research combining work on population genetics, ecology, population dynamics, and demography would be a holistic approach that would help to define the conservation needs of M. argun in the long term.
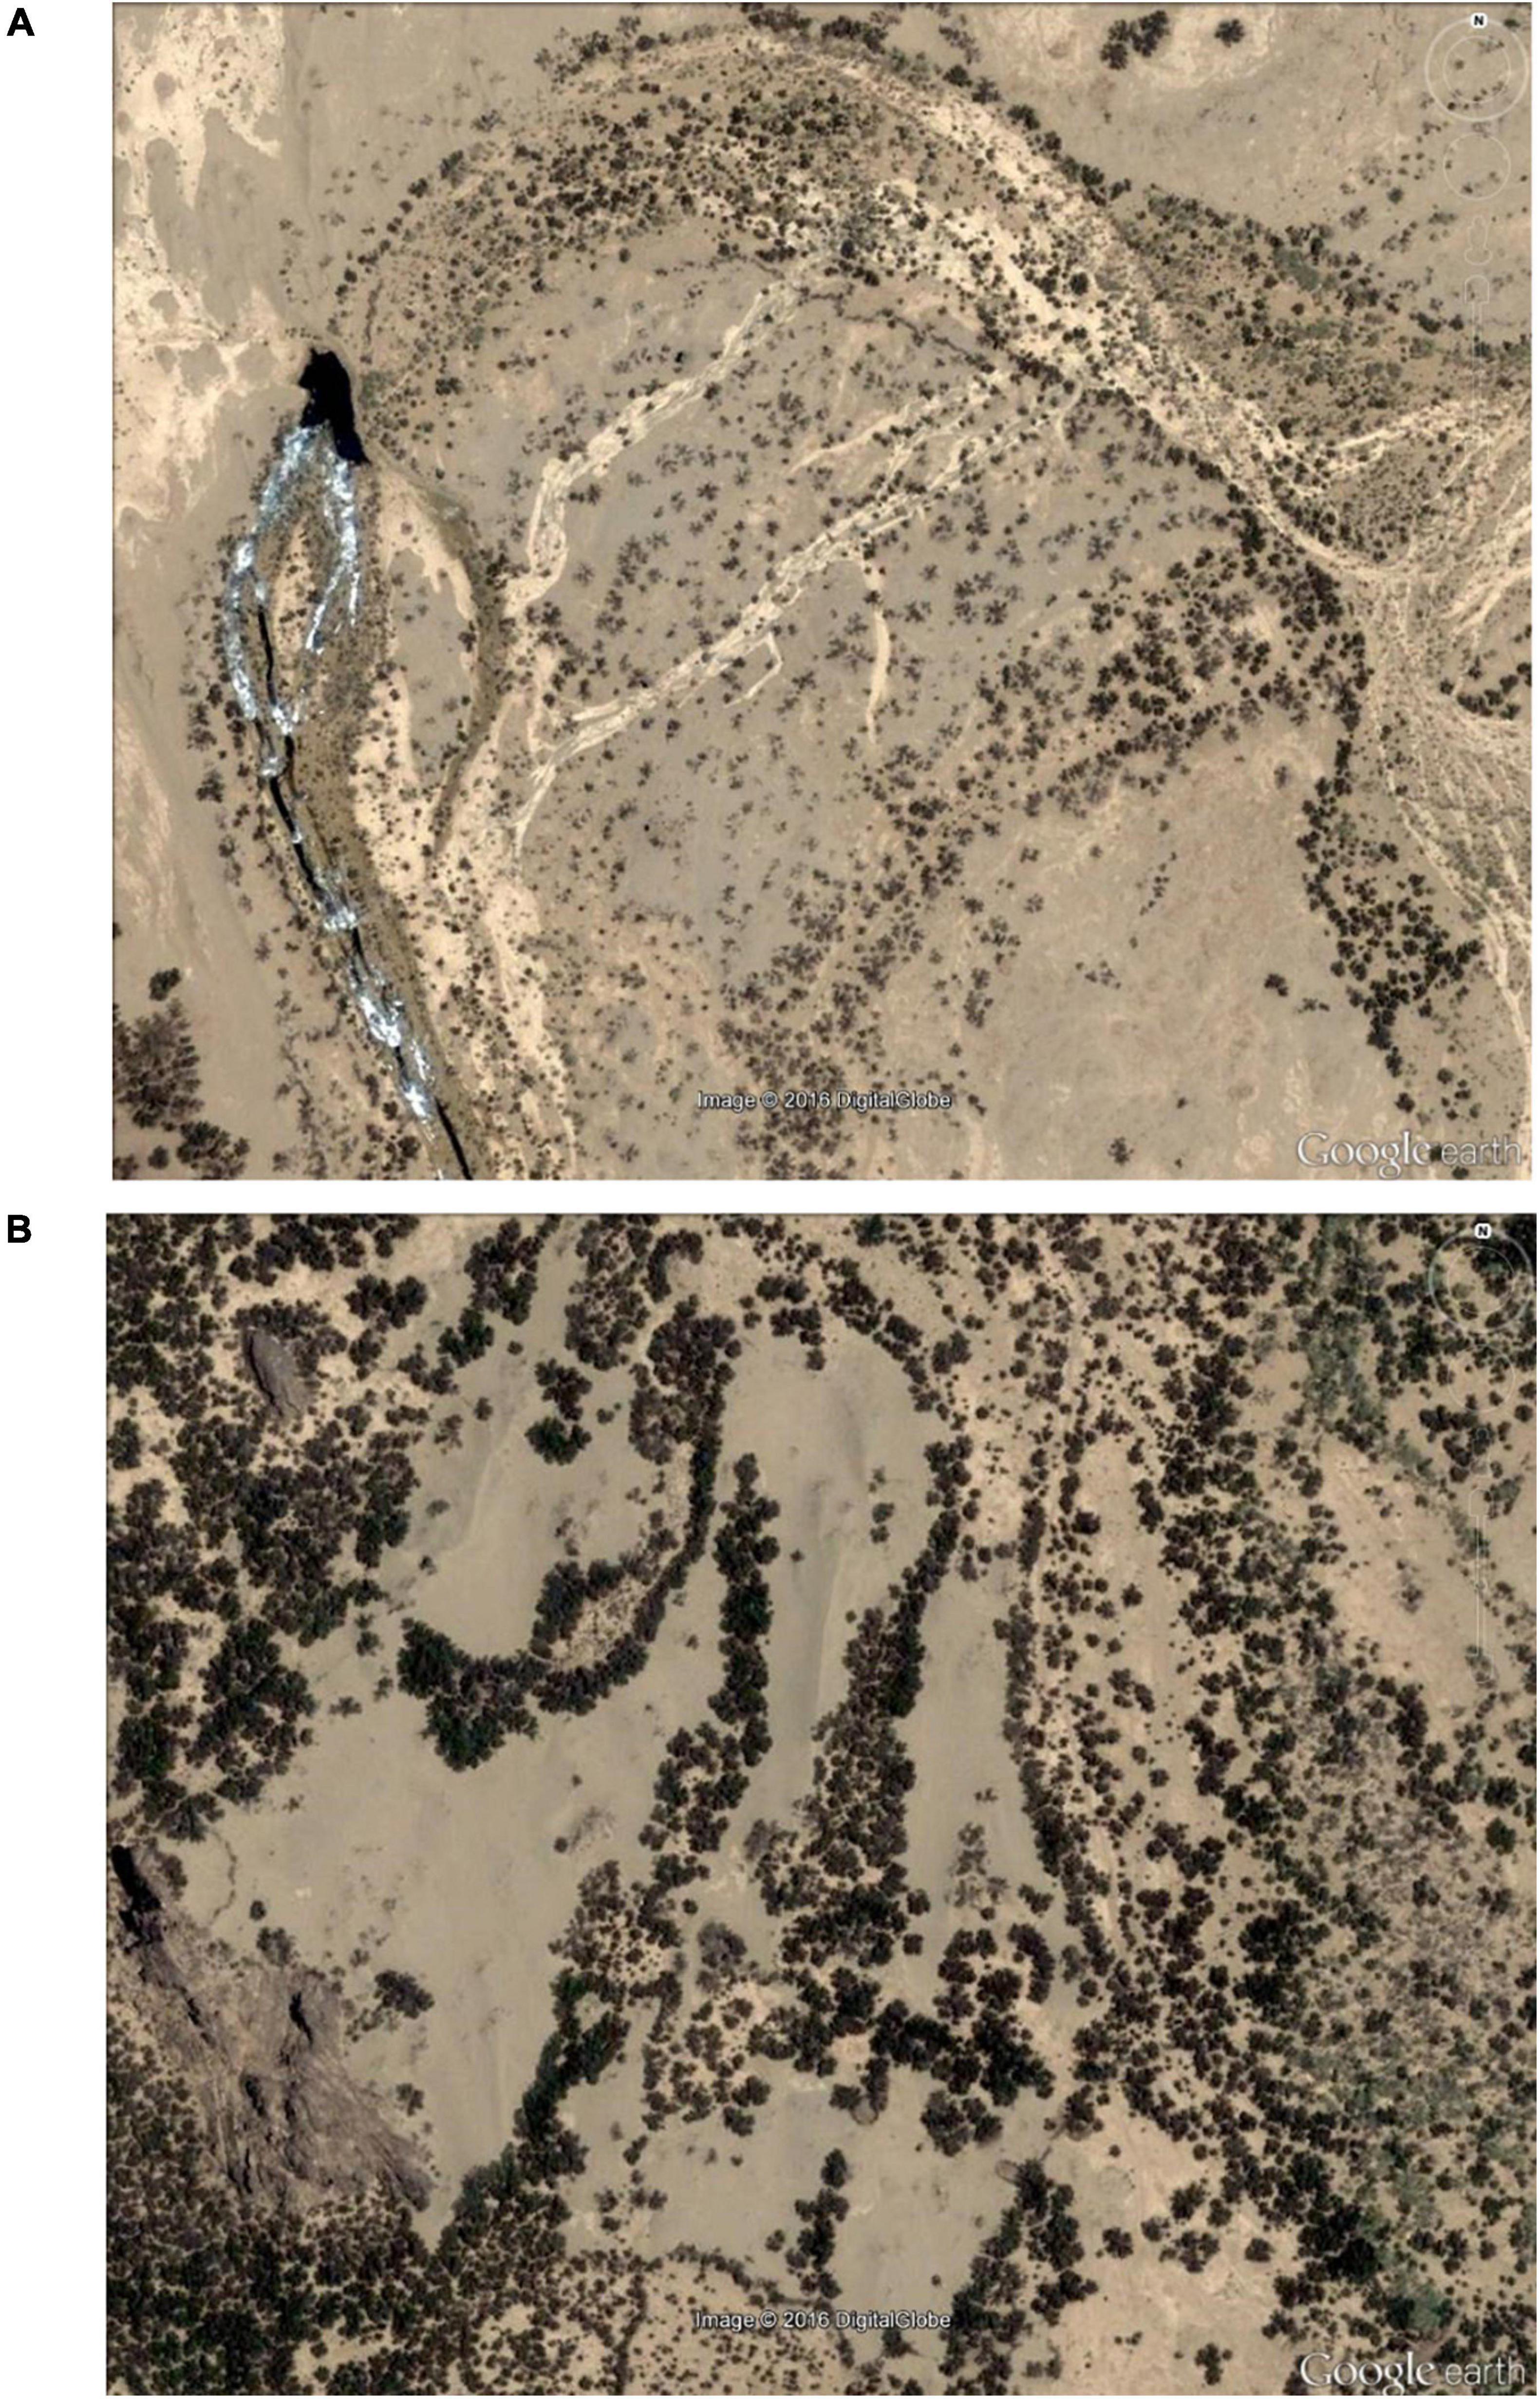
Figure 9. Google Earth view of new populations of M. argun, as described by local trade travelers. The network of watercourses shapes their distribution. (A) In the image, M. argun palms with a flowing river in the location (the geographic coordinates: 21°28′49.66″N, 36° 05′47.65″E). (B) Dense populations of M. argun. The two different shades of color indicate the presence of tree species other than palms in the same location, as also told by travelers (the geographic coordinates: 21°30′35.43″N, 36°05′18.53″E).
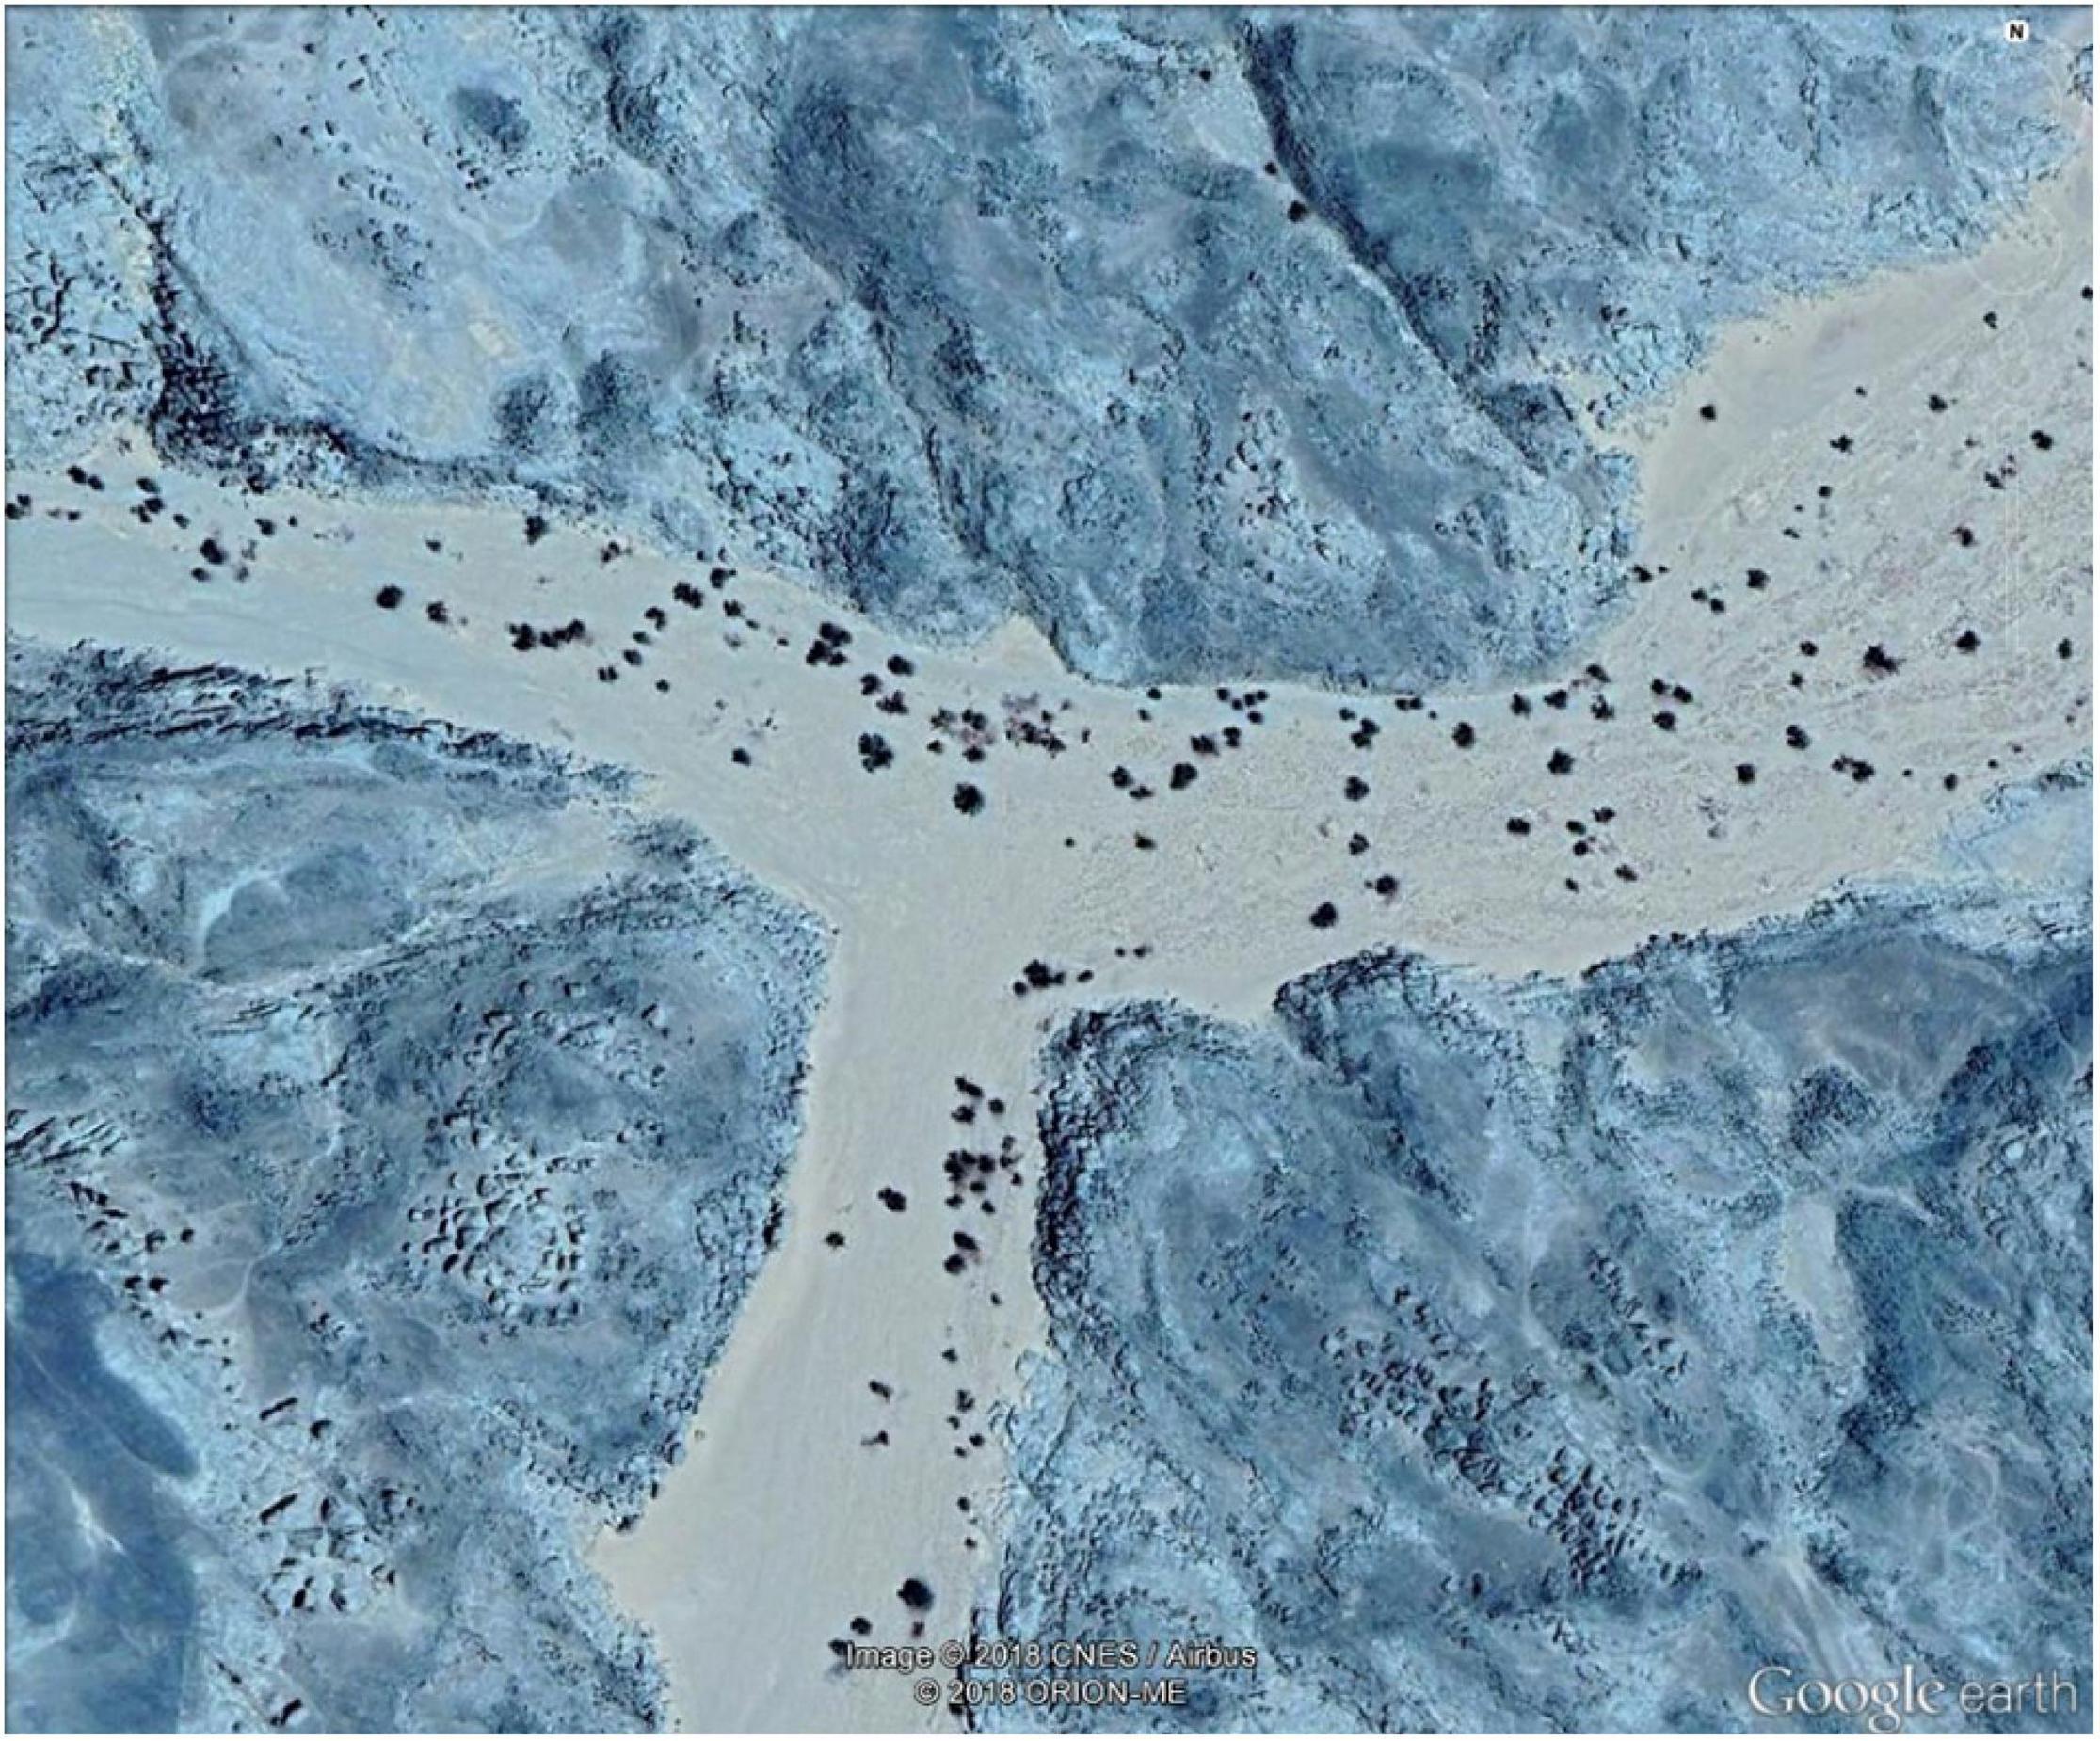
Figure 10. Google Earth view of a proposed new population of M. argun in the northwestern part of the Sahara within Sudan (the geographic coordinates: 21°57′37.31″N, 25°07′13.83″E).
The availability of cpSSR marker results (Elshibli and Korpelainen, 2018) enabled us to compare the genetic effects of different modes of dispersal by calculating the pollen to seed gene flow ratio, assuming that the chloroplast genome is maternally inherited (Ennos, 1994). The higher rate of pollen-mediated gene flow in M. argun compared to seed flow was notable when there was a high gene flow and no or very little genetic differentiation. This was the case for SNP markers for generation and site groups, and for SilicoDArT markers for site groups. The higher rate of seed-mediated gene flow compared to pollen flow was apparent when there was limited gene flow and considerable genetic differentiation. This was visible for generation groups based on SilicoDArT markers. A wide range of pollen to seed flow ratios have been reported among species; for example, pollen to seed gene flow ratios of 17 and five have been observed in oak populations across Europe (Gerber et al., 2014). Pollen to seed ratios of up to 10 have been reported in sweet vernal grass, as revealed by comparing AFLP (nuclear) and cpDNA data (Freeland et al., 2012). Based on 93 compiled studies comparing maternal, paternal, and nuclear DNA markers in seed plants, the median value of pollen/seed gene flow ratio estimates was 17 (Petit et al., 2005). Comparable very high pollen/seed flow ratios, as observed in our study (140 times), have been reported, in the hermaphroditic tropical tree Corythophora alta (200 times; Hamilton and Miller, 2002), and in wind-pollinated, animal-dispersed tree species (an average ratio nearly 150 times; García-Verdugo et al., 2010; reviewed by Freeland et al., 2012). Although most studies have reported the predominance of gene flow by pollen (e.g., Petit et al., 2005; Garot et al., 2019; Sujii et al., 2021), seed dispersal accounts for a large part of the total gene flow in 25 species (Petit et al., 2005). Genetic differentiation caused by limited seed dispersal (Elshibli and Korpelainen, 2018) is homogenized by strong gene flow caused by pollen [see Bai et al. (2014)]. Similarly, Sujii et al. (2021) have reported that spatially limited gene flow by seeds has been compensated by high gene flow through pollen in the neotropical legume tree, Centrolobium tomentosum. There is no information about pollinators of M. argun and seed dispersal agents other than watercourses, which pinpoint future areas of research.
This study highlights the benefits of employing both nuclear and cpDNA markers to analyze pollen- and seed-mediated gene flow in M. argun. Based on cpDNA markers, Elshibli and Korpelainen (2018) suggested a key role of seeds and the seasonal network of watercourses in determining the spatial genetic structure of M. argun populations. Based on nuclear markers analyzed in this study, the clustering pattern observed in Bayesian analyses, we confirm the existence of genetically distant individuals even under the observed high pollen/seed flow ratios. Elshibli and Korpelainen (2018) have designed a set of 49 cpSSR markers, of which seven were developed and applied, and the rest can be tested and used to provide further comparative analyses on M. argun populations.
The observed low genetic diversity in the sampled M. argun populations indicates the vulnerability of these populations to cope with the expected changes in the environmental conditions of the Nubian Desert due to climate change (Blach-Overgaard et al., 2015) and increased human impact as a result of growing mining activities (e.g., Klemm and Klemm, 2013). The detected loss of genetic diversity among generation groups proposes an increasing risk of extinction in M. argun populations because of a low adaptive capacity, and the accumulation of deleterious alleles and the consequent loss of fitness (Hedrick and Kalinowski, 2000). For example, Ali (2016) has reported observing dead M. argun palms in some valleys, which could be related to reduced adaptation to drought and/or diseases.
Knowledge of genetic diversity can be used as an indicator to predict population reduction and effective population sizes. Current and future declines are important IUCN criteria when assessing the conservation status of a species (IUCN Standards and Petitions Committee, 2019). Effective assessment practices and the development of conservation programs on M. argun would greatly benefit from comprehensive investigations on changes in temporal and spatial genetic variability within and among populations.
Although this study was performed under challenging conditions without resources for wider field expeditions, our results confirmed the existence of genetically vulnerable M. argun populations. To develop an effective conservation strategy for M. argun in the Nubian Desert in Sudan, we recommend a plan to (1) allocate funding for field research to map the distribution and abundance of the individuals in their natural habitat; (2) develop an ex situ conservation strategy by collecting seed material for experimentation and development of managed M. argun materials that could be utilized to increase genetic variability of threatened populations; (3) develop general and public awareness about the value of M. argun, especially among local and international gold miners; and (4) develop legislation to protect M. argun populations alongside gold mining activities.
Data Availability Statement
The datasets presented in this study can be found in online repositories. The names of the repository/repositories and accession number(s) can be found below: https://datadryad.org/stash and https://doi.org/10.5061/dryad.x95x69pht.
Author Contributions
SE performed the fieldwork, prepared the material for sequencing, and analyzed the data. HK supervised the work. SE wrote the manuscript with contributions from HK. Both authors contributed to the article and approved the submitted version.
Funding
The University of Helsinki provided financial support for the research.
Conflict of Interest
The authors declare that the research was conducted in the absence of any commercial or financial relationships that could be construed as a potential conflict of interest.
Publisher’s Note
All claims expressed in this article are solely those of the authors and do not necessarily represent those of their affiliated organizations, or those of the publisher, the editors and the reviewers. Any product that may be evaluated in this article, or claim that may be made by its manufacturer, is not guaranteed or endorsed by the publisher.
Acknowledgments
We would like to thank Amal Elshibli for technical support on map-based surveys and for participating in the fieldwork.
Supplementary Material
The Supplementary Material for this article can be found online at: https://www.frontiersin.org/articles/10.3389/fevo.2021.687188/full#supplementary-material
References
Ali, O., and Idris, M. (2016). The contribution of environmental impact assessment studies to the flora biodiversity in Sudan. J. Environ. Prot. 7, 1707–1718. doi: 10.4236/jep.2016.712138
Ali, O. M. M. (2016). The argun palm, Medemia argun, in the Eastern Nubian Desert of Sudan. Palms 60, 145–153.
Andrews, K. R., Good, J. M., Miller, M. R., Luikart, G., and Hohenlohe, P. A. (2016). Harnessing the power of RADseq for ecological and evolutionary genomics. Nat. Rev. Genet. 17:81. doi: 10.1038/nrg.2015.28
Ang, C. C., Lee, S. L., Lee, C. T., Tnah, L. H., Zakaria, R. M., and Ng, C. C. (2011). Isolation and characterization of microsatellite loci in an endangered palm, Johannesteijsmannia lanceolata (Arecaceae). Am. J. Bot. 98, e117–e119. doi: 10.3732/ajb.1000494
Bai, W. N., Wang, W. T., and Zhang, D. Y. (2014). Contrasts between the phylogeographic patterns of chloroplast and nuclear DNA highlight a role for pollen-mediated gene flow in preventing population divergence in an East Asian temperate tree. Mol. Phylogenet. Evol. 81, 37–48. doi: 10.1016/j.ympev.2014.08.024
Blach-Overgaard, A., Balslev, H., Dransfield, J., Normand, S., and Svenning, J. (2015). Global-change vulnerability of a key plant resource, the African palms. Sci. Rep. 5:12611. doi: 10.1038/srep12611
Botstein, D., White, R. L., Skolnick, M., and Davis, R. W. (1980). Construction of a genetic linkage map in man using restriction fragment length polymorphisms. Am. J. Hum. Genet. 32:314.
Broun, A. F., and Massey, R. E. (1929). Flora of the Sudan. Published with the Consent of the Sudan Government. Obtainable from the Sudanese Government Office. Wellington House: Sudanese Government Office.
Browne, L., Ottewell, K., and Karubian, J. (2015). Short-term genetic consequences of habitat loss and fragmentation for the neotropical palm Oenocarpus bataua. Heredity 115, 389–395. doi: 10.1038/hdy.2015.35
Corander, J., Marttinen, P., Sirén, J., and Tang, J. (2013). BAPS: Bayesian Analysis of Population Structure. Available online at: http://web.abo.fi/fak/mnf/mate/jc/software/BAPS5manual.pdf (accessed October 15, 2020).
Cosiaux, A., Ibrahim, H., and Baker, W. J. (2020). Medemia argun. IUCN Red List Threat. Species 2020:e.T30401A2793256.
da Silva Carvalho, C., Ribeiro, M. C., Côrtes, M. C., Galetti, M., and Collevatti, R. G. (2015). Contemporary and historic factors influence differently genetic differentiation and diversity in a tropical palm. Heredity 115, 216–224. doi: 10.1038/hdy.2015.30
Dadjo, C., Nyende, A. B., Yao, N., Kiplangat, N., and Assogbadjo, A. E. (2020). Genome-wide genetic diversity and population structure of Garcinia kola (Heckel) in Benin using DArT-Seq technology. PLoS One 15:e0238984. doi: 10.1371/journal.pone.0238984
Ellstrand, N. C., and Elam, D. R. (1993). Population genetic consequences of small population size: implications for plant conservation. Annu. Rev. Ecol. Syst. 24, 217–242. doi: 10.1146/ANNUREV.ES.24.110193.001245
Elshibli, S., and Korpelainen, H. (2018). Genetic profiling of the critically endangered palm species Medemia argun using newly developed chloroplast DNA markers. Plant Ecol. Div. 11, 185–192. doi: 10.1080/17550874.2018.1455231
Ennos, R. (1994). Estimating the relative rates of pollen and seed migration among plant populations. Heredity 72, 250–259. doi: 10.1038/hdy.1994.35
Excoffier, L., Smouse, P. E., and Quattro, J. M. (1992). Analysis of molecular variance inferred from metric distances among DNA haplotypes: application to human mitochondrial DNA restriction data. Genetics 131, 479–491. doi: 10.1093/genetics/131.2.479
Florenzano, A., Mercuri, A. M., Altunoz, M., and Garcea, E. A. (2016). Palynological evidence of cultural and environmental connections in Sudanese nubia during the early and middle Holocene. Quat. Int. 412, 65–80. doi: 10.1016/j.quaint.2016.01.001
Frankham, R., Ballou, J. D., and Briscoe, D. A. (2002). Introduction to Conservation Genetics. Cambridge: Cambridge University Press.
Freeland, J. R., Biss, P., and Silvertown, J. (2012). Contrasting patterns of pollen and seed flow influence the spatial genetic structure of sweet vernal grass (Anthoxanthum odoratum) populations. Journal of Hered. 103, 28–35. doi: 10.1093/jhered/esr111
García-Verdugo, C., Forrest, A. D., Fay, M. F., and Vargas, P. (2010). The relevance of gene flow in metapopulation dynamics of an oceanic island endemic, Olea europaea subsp. guanchica. Evolution 64, 3525–3536. doi: 10.1111/j.1558-5646.2010.01091.x
Garot, E., Joët, T., Combes, M. C., and Lashermes, P. (2019). Genetic diversity and population divergences of an indigenous tree (Coffea mauritiana) in Reunion Island: role of climatic and geographical factors. Heredity 122, 833–847. doi: 10.1038/s41437-018-0168-9
Gerber, S., Chadœuf, J., Gugerli, F., Lascoux, M., Buiteveld, J., Cottrell, J., et al. (2014). High rates of gene flow by pollen and seed in oak populations across Europe. PloS One 9:e85130. doi: 10.1371/journal.pone.0085130
Gibbons, M., and Spanner, T. W. (1999). In the valleys of the Sudan: finding Medemia. Palm J. 149, 33–35.
Gruber, B., Unmackm, P. J., Berry, O. F., and Georges, A. (2018). dartr: an R package to facilitate analysis of SNP data generated from reduced representation genome sequencing. Mol. Ecol. Resour. 18, 691–699. doi: 10.1111/1755-0998.12745
Hall, D., Zhao, W., Wennström, U., Gull, B. A., and Wang, X. R. (2020). Parentage and relatedness reconstruction in Pinus sylvestris using genotyping-by-sequencing. Heredity 124, 633–646. doi: 10.1038/s41437-020-0302-3
Hamilton, M. B., and Miller, J. R. (2002). Comparing relative rates of pollen and seed gene flow in the island model using nuclear and organelle measures of population structure. Genetics 162, 1897–1909. doi: 10.1093/genetics/162.4.1897
Hedrick, P. W., and Kalinowski, S. T. (2000). Inbreeding depression in conservation biology. Annu. Rev. Ecol. Syst. 31, 139–162.
IUCN. (1998). Medemia argun. Available online at: http://www.iucnredlist.org/details/30401/0 (accessed July 13, 2015).
IUCN Standards and Petitions Committee. (2019). Guidelines for Using the IUCN Red List Categories and Criteria. Version 14. Prepared by the Standards and Petitions Committee. Available online at: http://www.iucnredlist.org/documents/RedListGuidelines.pdf (accessed May 15, 2021).
Jaccoud, D., Peng, K., Feinstein, D., and Kilian, A. (2001). Diversity arrays: a solid state technology for sequence information independent genotyping. Nucleic Acids Res. 29:e25.
Jansen, R. K., Cai, Z., Raubeson, L. A., Daniell, H., Depamphilis, C. W., Leebens-Mack, J., et al. (2007). Analysis of 81 genes from 64 plastid genomes resolves relationships in angiosperms and identifies genome-scale evolutionary patterns. Proc. Natl. Acad. Sci.U.S.A. 104, 19369–19374. doi: 10.1073/pnas.0709121104
Kilian, A., Wenzl, P., Huttner, E., Carling, J., Xia, L., Blois, H., et al. (2012). “Diversity arrays technology: a generic genome profiling technology on open platforms,” in Data Production and Analysis in Population Genomics, eds F. Pompanon and A. Bonin (Totowa, NJ: Humana Press), 67–89. doi: 10.1007/978-1-61779-870-2_5
Klemm, R., and Klemm, D. (2013). Gold and Gold Mining in Ancient Egypt and Nubia: Geoarchaeology of the Ancient Gold Mining Sites in the Egyptian and Sudanese Eastern Deserts. Berlin: Springer Science & Business Media.
Korinsak, S., Tangphatsornruang, S., Pootakham, W., Wanchana, S., Plabpla, A., Jantasuriyarat, C., et al. (2019). Genome-wide association mapping of virulence gene in rice blast fungus Magnaporthe oryzae using a genotyping by sequencing approach. Genomics 111, 661–668. doi: 10.1016/j.ygeno.2018.05.011
Maliński, P. (2017). Searching for Nubian Desert Gold with a Metal Detector. Available online at: https://scholar.google.com/scholar?hl=fi&as_sdt=0%2C5&q=Malinski%2C+P.+%282017%29.+%C2%B4+Searching+for+Nubian+Desert+Gold+with+a+Metal+Detector.+Q22+Available+online+at%3A+http%3A%2F%2Fcyfrowaetnografia.pl%2FContent%2F6217%23page%3D124+%28accessed+December+06%2C+2020%29&btnG= (accessed December 06, 2020).
Mantel, N. (1967). The detection of disease clustering and a generalized regression approach. Cancer Res. 27(2 Pt 1), 209–220.
MaṣlaḥatAl-Misāḥah, S. (1909). Sudan 1:250,000. Available online at: https://www.loc.gov/item/87692353/ (accessed May 13, 2021).
McCauley, D.~E. (1995). The use of chloroplast DNA polymorphism in studies of gene flow in plants. Trends Ecol. Evol. 10, 198–202. doi: 10.1016/s0169-5347(00)89052-7
Melo, W.~A., Freitas, C.~G., Bacon, C.~D., and Collevatti, R.~G. (2018). The road to evolutionary success: insights from the demographic history of an Amazonian palm. Heredity 121, 183–195. doi: 10.1038/s41437-018-0074-1
Nadeem, M.~A., Guizado, S.~J.~V., Shahid, M.~Q., Nawaz, M.~A., Habyarimana, E., Ercişli, S., et al. (2021). In-depth genetic diversity and population structure of endangered Peruvian Amazon rosewood germplasm using genotyping by sequencing (GBS) technology. Forests 12:197. doi: 10.3390/f12020197
Nistelberger, H.~M., Byrne, M., Coates, D., and Roberts, J.~D. (2015). Genetic drift drives evolution in the bird-pollinated, terrestrial island endemic Grevillea georgeana (Proteaceae). Bot. J. Linn. Soc. 178, 155–168. doi: 10.1111/boj.12270
Novello, M., Viana, J.~P.~G., Alves-Pereira, A., de Aguiar Silvestre, E., Nunes, H.~F., Pinheiro, J.~B., et al. (2018). Genetic conservation of a threatened Neotropical palm through community-management of fruits in agroforests and second-growth forests. For. Ecol. Manag. 407, 200–209. doi: 10.1016/j.foreco.2017.06.059
Ong, P.~W., Maizura, I., Abdullah, N.~A.~P., Rafii, M.~Y., Ooi, L.~C.~L., Low, E.~T.~L., et al. (2015). Development of SNP markers and their application for genetic diversity analysis in the oil palm (Elaeis guineensis). Genet. Mol. Res. 14, 12205–12216. doi: 10.4238/2015.October.9.9
Peakall, R., and Smouse, P.~E. (2006). GENALEX 6: genetic analysis in excel. population genetic software for teaching and research. Mol. Ecol. Notes 6, 288–295. doi: 10.1111/j.1471-8286.2005.01155.x
Peakall, R., and Smouse, P.~E. (2012). GenAlEx 6.5: genetic analysis in excel. population genetic software for teaching and research-an update. Bioinformatics 28, 2537–2539. doi: 10.1093/bioinformatics/bts460
Pereira, V.~M., Filho, J.~A.~F., Leão, A.~P., Vargas, L.~H.~G., de Farias, M.~P., Rios, S.~D.~A., et al. (2020). American oil palm from Brazil: genetic diversity, population structure, and core collection. Crop Sci. 60, 3212–3227. doi: 10.1002/csc2.20276
Petit, R.~J., Duminil, J., Fineschi, S., Hampe, A., Salvini, D., and Vendramin, G.~G. (2005). Invited review: comparative organization of chloroplast, mitochondrial and nuclear diversity in plant populations. Mol. Ecol. 14, 689–701. doi: 10.1111/j.1365-294X.2004.02410.x
Pootakham, W., Uthaipaisanwong, P., Sangsrakru, D., Yoocha, T., Tragoonrung, S., and Tangphatsornruang, S. (2013). Development and characterization of single-nucleotide polymorphism markers from 454 transcriptome sequences in oil palm (Elaeis guineensis). Plant Breed. 132, 711–717. doi: 10.1111/pbr.12095
R Core Team. (2020). R: A Language and Environment for Statistical Computing. Vienna: R Foundation for Statistical Computing.
Ramos, S.~L.~F., Dequigiovanni, G., Lopes, M.~T.~G., de Aguiar, A.~V., Lopes, R., Veasey, E.~A., et al. (2021). Genetic structure in populations of Euterpe precatoria Mart in the Brazilian Amazon. Front. Ecol. Evol. 8:603448. doi: 10.3389/fevo.2020.603448
Salih, A.~M. (1999). The Manasir of Northern Sudan: Land and People. A~Riverain Society and Resource Scarcity. Köln: Rüdiger Köppe Verlag.
Sansaloni, C., Petroli, C., Jaccoud, D., Carling, J., Detering, F., Grattapaglia, D., et al. (2011). Diversity arrays technology (DArT) and next-generation sequencing combined: genome-wide, high throughput, highly informative genotyping for molecular breeding of Eucalyptus. BMC Proc. 26(Suppl 7):54. doi: 10.1186/1753-6561-5-S7-P54
Sujii, P.~S., Tambarussi, E.~V., Grando, C., de Aguiar Silvestre, E., Viana, J.~P.~G., Brancalion, P.~H., et al. (2021). High gene flow through pollen partially compensates spatial limited gene flow by seeds for a Neotropical tree in forest conservation and restoration areas. Conserv. Genet. 22, 383–396. doi: 10.1007/s10592-021-01344-3
Tang, J., Hanage, W.~P., Fraser, C., and Corander, J. (2009). Identifying currents in the gene pool for bacterial populations using an integrative approach. PLoS Comput. Biol. 5:e1000455. doi: 10.1371/journal.pcbi.1000455
Vardareli, N., Doğaroğlu, T., Doğaç, E., Taşkın, V., and Taşkın, B.~G. (2019). Genetic characterization of tertiary relict endemic Phoenix theophrasti populations in Turkey and phylogenetic relations of the species with other palm species revealed by SSR markers. Plant Syst. Evol. 305, 415–429.
Wang, C., Ma, X., Ren, M., and Tang, L. (2020). Genetic diversity and population structure in the endangered tree Hopea hainanensis (Dipterocarpaceae) on Hainan Island, China. PLoS One 15:e0241452. doi: 10.1371/journal.pone.0241452
Weir, B.~S., and Cockerham, C.~C. (1984). Estimating F-statistics for the analysis of population structure. Evolution 38, 1358–1370. doi: 10.1111/j.1558-5646.1984.tb05657.x
Wojnicka-Półtorak, A., Celiński, K., and Chudzińska, E. (2017). Genetic differentiation between generations of Pinus sylvestris natural population: a case study from the last European primeval forest. Aust. J. For. Sci. 134, 261–280.
Keywords: Medemia argun, genetic diversity, Sudan, Nubian Desert, SNP markers, SilicoDArT markers, conservation
Citation: Elshibli S and Korpelainen H (2021) Genetic Diversity and Population Structure of Medemia argun (Mart.) Wurttenb. ex H.Wendl. Based on Genome-Wide Markers. Front. Ecol. Evol. 9:687188. doi: 10.3389/fevo.2021.687188
Received: 29 March 2021; Accepted: 21 June 2021;
Published: 23 July 2021.
Edited by:
Gerardo Avalos, University of Costa Rica, Costa RicaReviewed by:
Mohamed Abdelaal, Mansoura University, EgyptRakesh Bhutiani, Gurukul Kangri Vishwavidyalaya, India
Copyright © 2021 Elshibli and Korpelainen. This is an open-access article distributed under the terms of the Creative Commons Attribution License (CC BY). The use, distribution or reproduction in other forums is permitted, provided the original author(s) and the copyright owner(s) are credited and that the original publication in this journal is cited, in accordance with accepted academic practice. No use, distribution or reproduction is permitted which does not comply with these terms.
*Correspondence: Sakina Elshibli, c2FraW5hLmVsc2hpYmxpQGhlbHNpbmtpLmZp