 Alexander B. Brummer1,2,3,4*
 Van M. Savage1,2,3,5
- 1Institute for Quantitative and Computational Biosciences, University of California, Los Angeles, Los Angeles, CA, United States
- 2Department of Ecology and Evolutionary Biology, University of California, Los Angeles, Los Angeles, CA, United States
- 3Department of Computational Medicine, University of California, Los Angeles, Los Angeles, CA, United States
- 4Department of Computational and Quantitative Medicine, Division of Mathematical Oncology, Beckman Research Institute, City of Hope National Medical Center, Duarte, CA, United States
- 5Santa Fe Institute, Santa Fe, NM, United States
Biological allometries, such as the scaling of metabolism to mass, are hypothesized to result from natural selection to maximize how vascular networks fill space yet minimize internal transport distances and resistance to blood flow. Metabolic scaling theory argues two guiding principles—conservation of fluid flow and space-filling fractal distributions—describe a diversity of biological networks and predict how the geometry of these networks influences organismal metabolism. Yet, mostly absent from past efforts are studies that directly, and independently, measure metabolic rate from respiration and vascular architecture for the same organ, organism, or tissue. Lack of these measures may lead to inconsistent results and conclusions about metabolism, growth, and allometric scaling. We present simultaneous and consistent measurements of metabolic scaling exponents from clinical images of lung cancer, serving as a first-of-its-kind test of metabolic scaling theory, and identifying potential quantitative imaging biomarkers indicative of tumor growth. We analyze data for 535 clinical PET-CT scans of patients with non-small cell lung carcinoma to establish the presence of metabolic scaling between tumor metabolism and tumor volume. Furthermore, we use computer vision and mathematical modeling to examine predictions of metabolic scaling based on the branching geometry of the tumor-supplying blood vessel networks in a subset of 56 patients diagnosed with stage II-IV lung cancer. Examination of the scaling of maximum standard uptake value with metabolic tumor volume, and metabolic tumor volume with gross tumor volume, yield metabolic scaling exponents of 0.64 (0.20) and 0.70 (0.17), respectively. We compare these to the value of 0.85 (0.06) derived from the geometric scaling of the tumor-supplying vasculature. These results: (1) inform energetic models of growth and development for tumor forecasting; (2) identify imaging biomarkers in vascular geometry related to blood volume and flow; and (3) highlight unique opportunities to develop and test the metabolic scaling theory of ecology in tumors transitioning from avascular to vascular geometries.
1. Introduction
Since Max Kleiber's finding of the remarkable biological pattern that organismal basal metabolic rate, B, scales with body mass, M, as B ∝ M3/4, scientists have worked to both understand and extend the phenomenon of metabolic scaling (Kleiber, 1932). Applications of metabolic scaling have permeated the biological sciences, spanning evolutionary and cellular biology (DeLong et al., 2010), predator-prey interactions at both the individual level (Pawar et al., 2012; Hatton et al., 2015) and at the trophic level (Brose et al., 2006), fish reproduction energetics (Barneche et al., 2018), forest structure, demography, and dynamics (Enquist et al., 2009; West et al., 2009), and species distribution modeling (Harte and Newman, 2014). Explanations for the origins of metabolic scaling in individual vascular organisms are numerous, and all center around functional optimization of a hierarchically branching vascular network that distributes and delivers resources throughout the body (West et al., 1997; Turcotte et al., 1998; Bejan, 2001; Banavar et al., 2010). The phenomenon of metabolic scaling has been studied through measurements of metabolism at either the whole organism level (Schmidt-Nielsen, 1984; Mori et al., 2010), or with predictions of metabolism rooted in vascular theory (Bentley et al., 2013; Lau et al., 2019; Brummer et al., 2021).
Surprisingly, we could not find a single study that examines metabolism from both of these perspectives for the same tissue, organ, or organism (Price et al., 2012). Furthermore, proposed theories that purport to explain the origins of metabolic scaling in vascular organisms fail to explain why the pattern persists in avascular organisms. To address these issues, we present simultaneous measurements of metabolic scaling in tumors derived from uptake of metabolic radio-tracers and of the vasculature that comprises and surrounds the tumors. Recent efforts to improve and expedite cancer diagnosis, treatment planning, and tracking responses have produced medical imaging and computer vision technologies that offer a unique lens with which to study metabolic scaling, particularly within tissues that have undergone the avascular-to-vascular transition. We show that insight from metabolic scaling theory can be leveraged to derive vascular-based biomarkers of cancer, potentially introducing an ensemble of biomarkers indicative of tumor growth and the distribution and flow of blood.
Radiological images of non-small cell lung cancer (NSCLC) are predominately analyzed from medical imaging as solid volumes of tissue absent of surrounding vessels (Gevaert et al., 2012; Aerts et al., 2014; Zhou et al., 2018; Ardila et al., 2019). Yet, when viewed at an enhanced scale, these volumes are seen to be entirely embedded in, and sometimes partially composed of, networks of vascular tissue that are distinguishable from surrounding healthy tissues (Figure 1) (Jain, 2005; Rao et al., 2016; Wang et al., 2017; Alilou et al., 2018). The radiomics paradigm of personalized medicine uses artificial intelligence and machine learning algorithms to detect and classify NSCLCs, and to track individual response to intervention and treatment. This approach requires large and accurate datasets of all possible biological features, or biomarkers, associated with disease (Lambin et al., 2017). The current practice within radiomics restricts the space of possible features to statistical measures regarding tumor volume, shape, and intensity variation—the latter being directly indicative of metabolism. This approach necessitates the existence of solid masses in order to facilitate detection, thus setting a fundamental limit on early detection (Pashayan and Pharoah, 2020). As a way to support existing metrics and to provide a more comprehensive view of the tumor environment, we propose a way forward that leverages the connectivity of the vessels that compose and surround an NSCLC and that incorporates results and insights from theory on tumor metabolism and growth. (West et al., 2001; Guiot et al., 2003, 2006; Herman et al., 2011; Milotti et al., 2013; Ribeiro et al., 2017; Pérez-García et al., 2020).
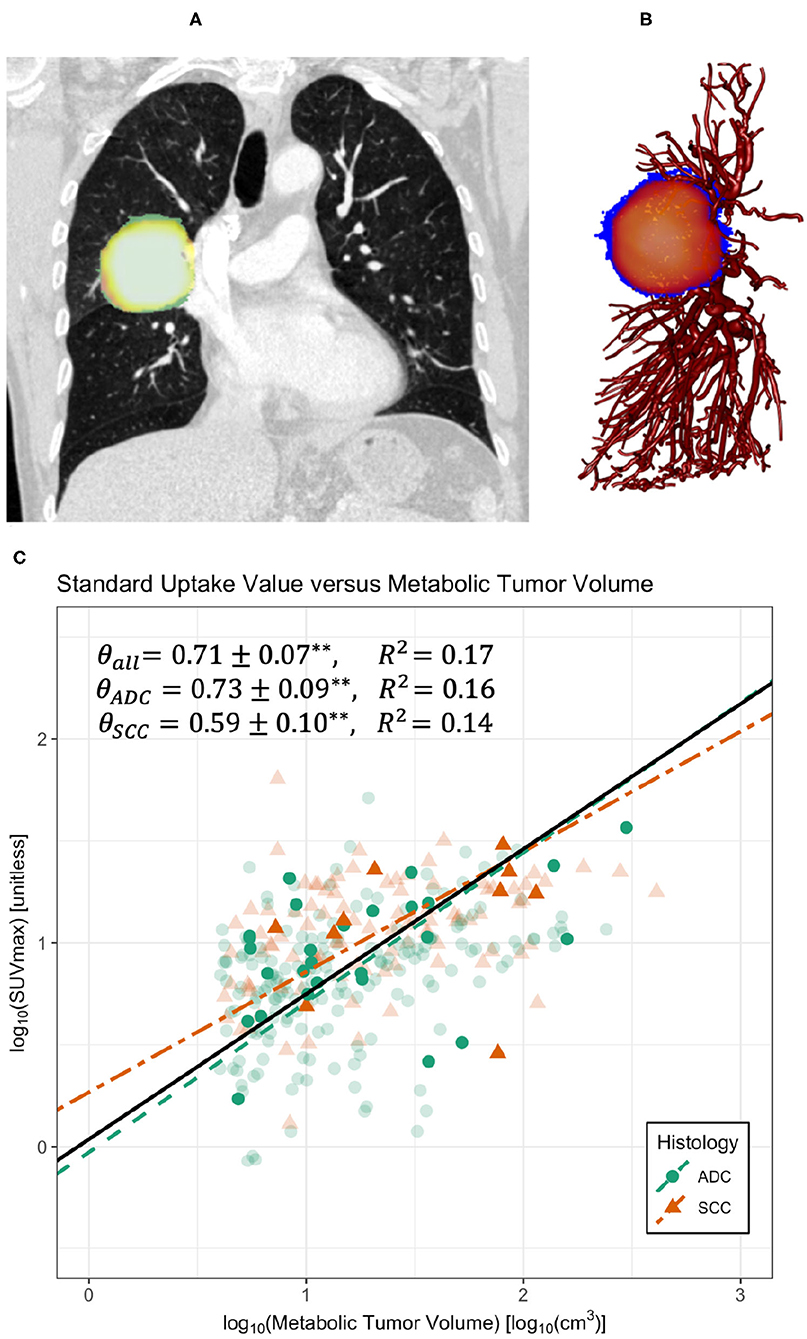
Figure 1. Co-registered PET-CT images (A) and sample skeletonization of pulmonary vasculature with tumor (B). (C) Regression on maximum standard uptake value (SUVmax) and metabolic tumor volume (MTV) for all data compiled (black solid line), divided into the histological categories of adenocarcinoma (ADC) and squamous cell carcinoma (SCC). Regressions demonstrate a significant scaling relationship between SUVmax and MTV with scaling exponents approximately equal to 0.71 (Table 1). **Indicates p < 0.005. Bold symbols represent data with accompanying clinical imaging used in vascular analyses, whereas transparent symbols represent data collected without original clinical imaging. Data was truncated at MTV ≈ 4cm3 to avoid errors from the partial volume effect.
Established theory predicts average empirical branching properties at the whole-network level by minimizing energy to pump and distribute blood and ensuring that vessels efficiently reach and feed all cells. However, there exists wide variation around predictions for these average properties. Variation in measures of vessel branching, connectivity, and scaling have been shown to serve as biomarkers of disease (Yao et al., 2011; Huang et al., 2018; Pandey et al., 2018; Apte et al., 2019). Furthermore, there exist competing theories relating organ and organismal growth and metabolism to vascular branching patterns—relationships that result from the optimization of fluid transport and resource distribution (West et al., 1997; Zamir, 2006; Savage et al., 2008; Huo and Kassab, 2009a,b; Banavar et al., 2010; Dodds, 2010). Extensions of these theories predict the growth trajectories of tumors, incorporating the angiogenic transition from avascular, diffusion-dominated growth to vascularized growth that often precedes metastasis (West et al., 2001; Guiot et al., 2003, 2006; Herman et al., 2011; Milotti et al., 2013; Ribeiro et al., 2017; Pérez-García et al., 2020). Yet, no rigorous application of these theories has been conducted to examine energetic measures of metabolic scaling in tumors to the underlying vasculature supplying tumor growth and maintenance. We analyze clinical human NSCLC X-ray images to identify the vascular branching features most prevalent with NSCLC presence. We then map these vascular patterns to variation in the metabolic scaling of tumors as measured from metabolic imaging techniques of nuclear medicine.
2. Materials and Methods
2.1. PET-CT Imaging
As tumors undergo rapid cellular proliferation they subsequently have higher metabolic demands. The deregulated uptake of glucose to sustain growth and maintenance in tumors can be observed with the nuclear imaging technique of positron emission tomography (PET). The radioactive tracer [18F]fluro-2-deoxyglucose (18F-FDG) is utilized to measure glucose uptake in tumors in clinical settings. The standard uptake values (SUV) of glucose uptake are measured as SUV = r/(a′/w), where r is the concentration of radioactivity (measured in kiloBecquerels per milliliter, kBq/mL) detected, a′ is the radioactivity of the full volume of injected radio-tracer (kBq) adjusted for radioactive decay since injection, and w is the weight of the patient (g). Importantly, implicit assumptions are made that tissue imaged has a density of 1 g/mL, and that, aside from the more highly metabolic tissues of the brain, liver, and tumors, the radio-tracer injected is uniformly distributed throughout the body. Thus, an SUV of 1 can be loosely interpreted as normal (Kinahan and Fletcher, 2010). Due to the potential for variation between individuals, imaging machines and imaging protocols, SUV measures are presently used as a qualitative biomarker for disease to examine relative metabolic demand.
Advances in medical imaging technology allow for the simultaneous use of PET and X-ray computerized tomographic (PET-CT) imaging to extract overlapping images of tissue metabolism and soft-to-hard tissue presence. When coupled with computer vision software, collections of two-dimensional image “slices” can be reconstructed into three-dimensional volumes from which spatial patterns can be extracted for disease diagnostics. These technologies are not without crucial limitations. The two-dimensional image slices have a finite resolution and thickness, and consequently errors can occur when examining structures near these resolution-thickness limits. These errors are broadly categorized as partial-volume effects (PVE), and require careful consideration (Soret et al., 2007).
In order to introduce typical imaging metrics, it is important to first consider any volume or region of interest (ROI) as being subdivided into a collection of N cubes, or voxels, of uniform volume. These voxel volumes are determined by the image slice thickness and resolution. Importantly, CT imaging maps the spatial distribution of biologic structures, while PET imaging maps the metabolic uptake of those structures. Any given ROI will have a total volume V as determined from CT imaging as the sum of each voxel volume vi within that large volume. Each voxel volume has its own corresponding SUV measure, SUVi, determined from PET imaging. Conventional tumor evaluation involves measuring the following: total, or gross tumor volume (GTV) as the sum of all voxel volumes vi that comprise the tumor as observed strictly from CT imaging. Metabolic tumor volume (MTV) is the sum of all voxel volumes vi that comprise the tumor with a corresponding SUVi exceeding a conventional threshold of 2.5. Total lesion activity (TLA) is the summed product of voxel volume and SUVi, or . Tumor size is a common clinical metric determined from semi-major and semi-minor tumor diameters. Finally, various summary statistics for SUV may be computed over a whole ROI, such as maximum, SUVmax, median, SUVmed, mean, SUVmean, or over a temporal range, such as peak SUVpeak (Bailey et al., 2005; Valk et al., 2006). In radiomics studies, this small collection of metrics quickly runs into the hundreds, as many metrics are analyzed as spatial distributions with many accompanying statistical features.
2.2. Establishment of Metabolic Scaling
In this work we compiled data from four separate studies of PET-CT imaging of NSCLC patients (Furumoto et al., 2018; Mattonen et al., 2019; Chardin et al., 2020; Pérez-García et al., 2020). These studies consisted of pre-treatment PET-CT scans for 535 patients, of which 401 were adenocarcinoma and 134 were squamous cell carcinoma. Imaging acquisition and patient information for each study can be found in the original publications. The metrics we chose to focus on were SUVmax as a measure of metabolism, MTV as a measure of glucose consuming tumor volume, and GTV as a measure of total tumor volume that includes glucose consuming tissue in addition to all other tumor tissues (e.g., metabolically active but glucose inactive tissues, and necrotic tissues). SUVmax was chosen over other SUV features as it is less susceptible to variation in delineation of the tumor ROI.
Measures of maximum standard uptake value (SUVmax) and metabolic tumor volume (MTV) were graphed on a log-log scale to identify the existence of a scaling relationship between these variables (Figure 1). In addition to regressing on the whole dataset, these data were also categorized by the histological classifications of adenocarcinoma (ADC) and squamous cell carcinoma (SCC) to allow for possible variations in metabolic scaling due to tumor heterogeneity. Standard major axis regressions were performed as interest is primarily on the regression slope, and the axes of variation have fundamentally different units. Of the data collected, a subset have the original PET-CT imaging available on The Cancer Imaging Archive (Clark et al., 2013; Prior et al., 2013). For this subset of data, log-log graphs were analyzed to investigate scaling between SUVmax and MTV as well as MTV and gross tumor volume (GTV) (Figure 2). Regression statistics are located in Table 1. To account for the partial volume effect associated with small voxel thresholding in PET imaging, we analyzed the data by imposing a hard threshold on tumors less than 4cm3 in volume. Tumors smaller than this volume are known to exhibit greater than 10% error on measurements of SUVmax from PET imaging due to the partial volume effect (Soret et al., 2007; Kinahan et al., 2009). After filtering for the partial volume effect, left for analysis were 207 ADC and 109 SCC data points.
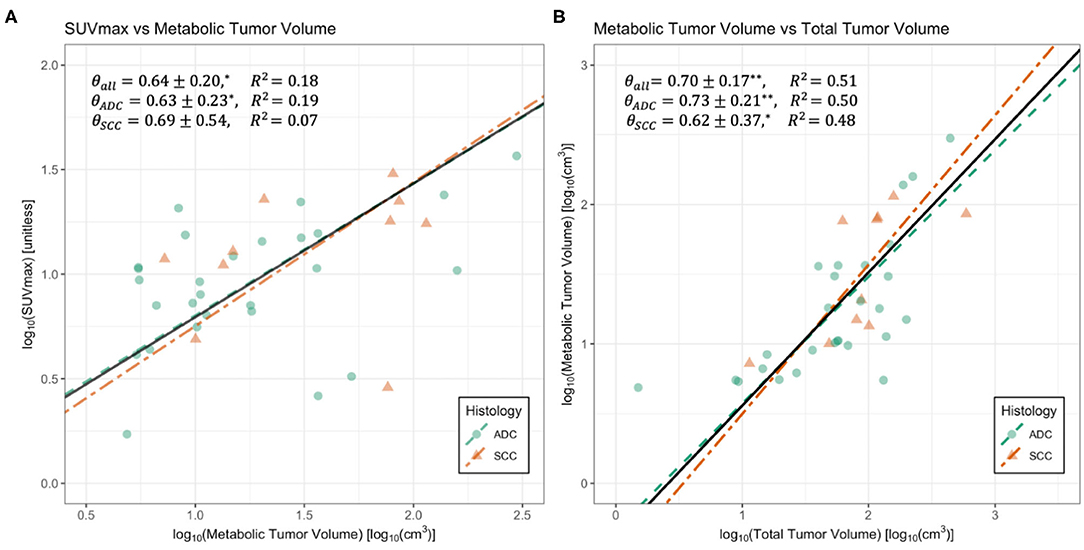
Figure 2. Regressions for maximum standard uptake value (SUVmax) vs. metabolic tumor volume (MTV) (A) and MTV vs. gross tumor volume (GTV) (B). Data is divided by the histological classifications of adenocarcinoma (ADC) and squamous cell carcinoma (SCC). Black solid lines represent regressions on whole datasets. Summaries of regressions are presented in Table 1. *Indicates p < 0.05, and ** indicates p < 0.005. Standard major axis regression shows that both methods result in significant and consistent measurements of metabolic scaling exponents.
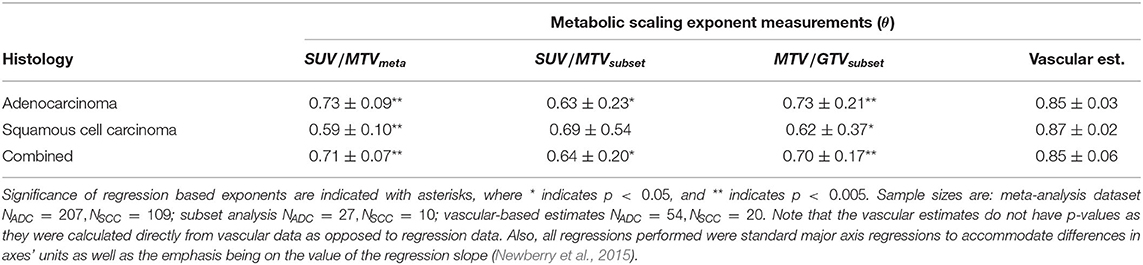
Table 1. Estimates of metabolic scaling exponents.
2.3. Segmentation of CT Images for Vascular Measurement
This data is part of the Radiogenomics dataset from Gevaert et al. (2012) and Zhou et al. (2018) and consists of CT scans of 211 NSCLC patients with manual annotations delineating tumor boundaries and PET-CT imaging available for 150 of these patients. We selected patients with clinical staging of II or greater to ensure tumors were sufficiently large enough for identifiable vasculature. Within this group we examined vasculature where pulmonary vessels could be easily identified as supplying tumors with blood, resulting in 56 patients.
Image processing prior to segmentation is crucial for expediency and accuracy. To extract only lung interior regions of interest, we implemented the watershed technique (Shojaii et al., 2005; D'Sa et al., 2019) with a black top-hat transform for re-inclusion of juxtapleural nodes and near-hilar vessels (Singadkar et al., 2018). This routine is followed by contrast limited adaptive histogram equalization (CLAHE) (Jin et al., 2001) and iterated global thresholding (Samet and Yildirim, 2016) to enhance the signal to noise ratio (Figure 3).
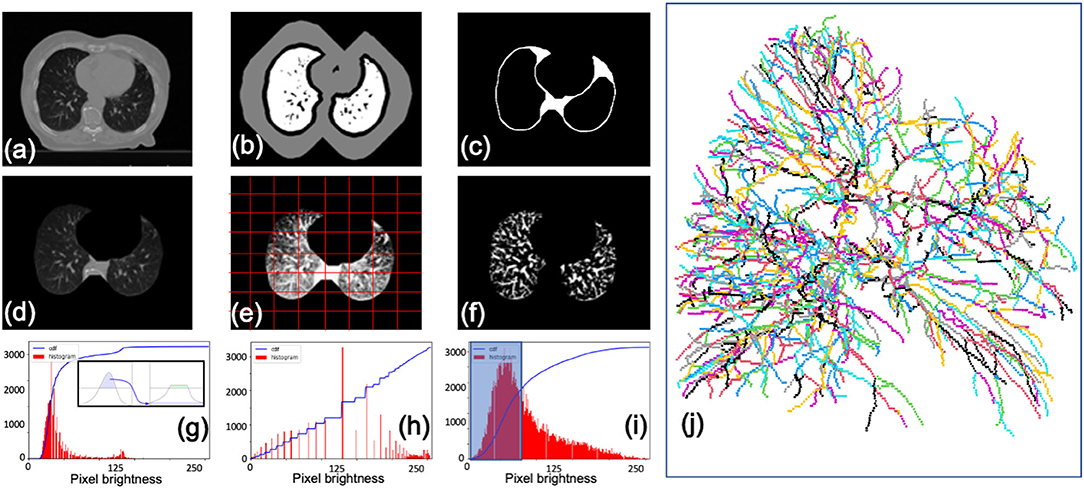
Figure 3. Segmentation procedure for CT scans. (a) Initial image. (b) Lung boundary markers determined using watershed. (c) Mask with boundaries re-included by black top-hat transform. (d) Segmented image. (e) Contrast enhanced image with adaptive mesh (red) overlaid for limited equalization (CLAHE). (f) Final image after enhancement and de-noising via thresholding. Examples of pixel brightness histograms prior to enhancement (g), after enhancement (h), and with a de-noising filter (i). (j) Left lung vessel skeletonization output from Angicart following steps described previously. Vessels are colored by canonical generation labeling (see Figure 4).
Segmentation of vasculature is accomplished using the open-source software Angicart, developed by the Savage Lab at UCLA (Newberry et al., 2015; Brummer et al., 2021). Angicart software reconstructs digital representations of vascular networks from medical images of any modality. The segmentation routine uses a spherical-growth algorithm to map the vascular network. It is a fully automated software (as defined in Myatt et al., 2012) that only requires vessels of interest to be brighter on a grayscale than surrounding tissues. Angicart output consists of vessel radii, lengths, branching angles, connectivity, and centerline coordinates. Angicart results have been published for: μCT mouse lung data, human thoracic CT scans, and pulmonary vasculature (Newberry et al., 2015; Tekin et al., 2016; Brummer et al., 2021).
2.3.1. Errors From the Segmentation and Skeletonization Procedures
Three types of errors in the data acquisition process consisted of: (1) individual vessels disconnected from vascular trees, (2) nonvascular tissue misidentified as vascular trees (3) misidentification of vascular tree roots.
The segmentation procedure can produce disconnected individual artifacts that Angicart automatically identifies as singular vessels. As the framework of metabolic scaling theory relies on vascular networks, such artifacts are simply filtered from the resulting skeletonization. Similarly, certain non-vascular tissues that pass the segmentation procedure may result in erroneous vascular trees. Common examples of such errors are non-vascular tissues in the hilar and sternal regions of the lungs. These errors are easily identified and removed manually.
Finally, misidentification of vascular tree roots occurs due to programming in Angicart intended to identify roots based on vessel radius, an assumption based on models of healthy vascular networks. This assumption does not hold in this study however as pulmonary vascular networks embedded with tumors are known to have vessels with unusually large diameters within the boundary of the tumor (Wang et al., 2017). Thus, to identify vascular tree roots, we calculated the geometric centroid of all vessel coordinates for each half of the lungs in an effort to approximate the location of the hilar vessel roots. Vascular tree roots were then identified as those nearest to the centroid position.
2.4. Modeling Vascular Data
Metabolic scaling theory is a first principles model linking biologic scaling phenomena to hierarchically branching resource distribution networks. It was initially proposed as a model for Kleiber's law—the scaling of organismal metabolism, B, with body mass, m, expressed as (Kleiber, 1932; West et al., 1997). It has since been applied to a myriad of systems spanning plant metabolism, forest demography, city scaling, and organismal growth and development (Enquist et al., 1998; West et al., 1999, 2001; Bettencourt et al., 2007). Importantly, both theoretical and empirical studies have demonstrated allometric relationships based on vascular branching within many different organs and tissue types, spanning heart, lungs, cerebral arterial trees, muscle tissue, and the torso (Majumdar et al., 2005; Huo and Kassab, 2009a; Wright et al., 2013). Despite apparent differences in absolute metrics such as blood pressure, flow resistance, and vessel number-density, a crucial component of vascular branching from the perspective of biological allometries is that they provide scale-free metrics of different organs and tissues. Thus, the combination of scale-dependent and organ-specific metrics (e.g., diameter, length, and pressure at the initial and terminal generations) and scale-free metrics (e.g., ratios of vessel diameters and lengths) can provide functional information related to biologic rates, namely metabolism. Here we summarize the pertinent variables used to describe vascular branching in metabolic scaling theory, the mechanistic constraints that predict values for these variables, and how metabolic scaling theory can be applied to investigate PET-CT imaging data for NSCLC. For further background, see (West et al., 2001; Savage et al., 2008; Herman et al., 2011; Brummer et al., 2017, 2021).
2.4.1. Branching Variables
Metabolic scaling theory idealizes vascular trees as having cylindrically shaped, pipe-like branching architectures (Figure 4A). Here, the fundamental units are individual bifurcations consisting of a parent vessel that divides into two child vessels. Any vessel can be parameterized by its radius, r, length, l, and branching generation, j, the latter of which takes the value j = 0 at the root and j = N for an N generational network. We next define the following asymmetric scale factors: the average and difference radial scale factors and Δβ = (lj, μ−lj, ν)/(2lj−1), and the average and difference length scale factors and Δγ = |lj, μ−lj, ν|/(2lj−1).
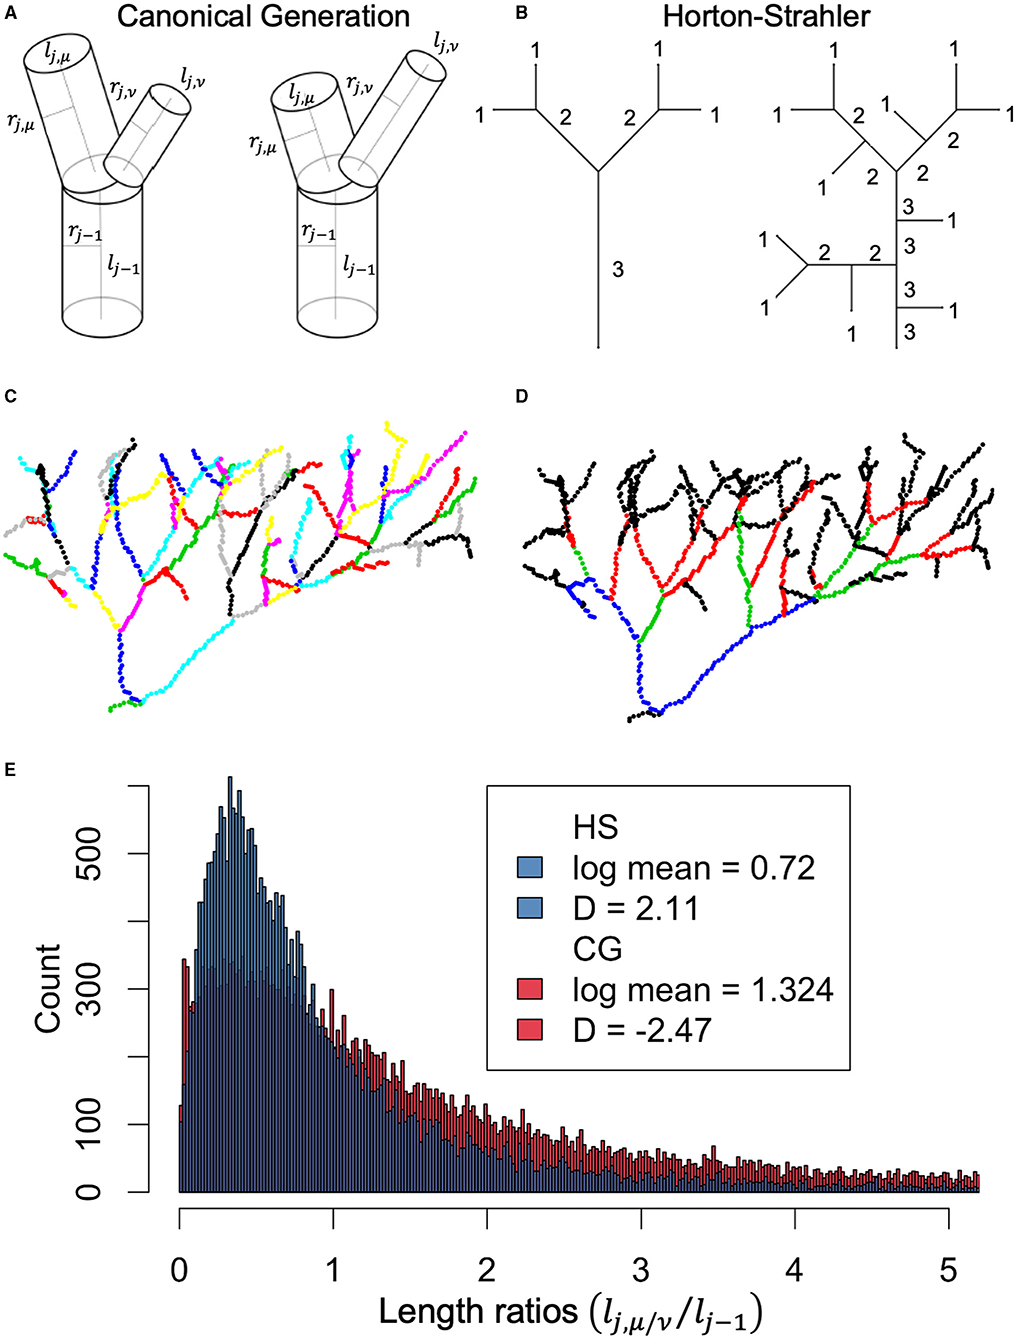
Figure 4. (A) Canonical generation (CG) labeling for asymmetric bifurcation demonstrates how vessel endpoints are determined by presence of bifurcation. (B) Horton-Strahler (HS) labeling demonstrating how vessel endpoints are determined by changes in HS label. (C) Example vessel network color coded by different vessels labeled according CG method. (D) Same network as in (C), now color coded by difference vessels defined according to HS labeling. (E) Histogram of length-scale factors calculated using CG labeling (red) or HS labeling (blue). Importantly, metabolic scaling theory predicts that vessel lengths branch according to , where D represents the fractal dimension and should be equivalent to the Euclidean dimension of the space being filled. Estimates of the fractal dimension using HS labeling fall within the expected range of D ∈ [2, 3], compared to the non-intuitive value of D = −2.47 for CG labeling.
These four scale factors can be constrained through two optimizations that: (1) maximize the number of capillaries per unit volume of tissue and (2) minimize the resistance to fluid flow. Here we outline the conceptual arguments for these constraints at the single bifurcation level. Maximizing capillaries per unit volume is done by modeling the system as a space-filling fractal (Mandelbrot, 1982; Barnsley, 2012). In the context of vascular branching systems, this can be demonstrated through an iterative process (Savage et al., 2008). To supply blood to the NN terminal vessels in generation N, each comprising a blood volume of vN, the NN−1 vessels of the preceding generation N − 1 must have a matching volume of blood across all vessels, each with a blood volume of vN−1. Iterating this argument across multiple generations results in the expression that NNvN = NN−1vN−1 = … = N0v0. To apply this argument at the level of a single bifurcation, we approximate the blood service volumes by the vessel lengths, , allow for asymmetric branching, and express this iterative argument instead by considering first a generic parent service volume in generation j − 1 that supplies all child vessels distal to it, yielding . Writing this expression in terms of the asymmetric branching scale factors yields,
Minimizing the resistance to fluid flow results in two separate constraints depending on whether the flow is pulsatile—with resistance —or laminar—with resistance . In pulsatile flow, reflections can occur as pulses cross a bifurcation. Thus, impedance matching across a given bifurcation minimizes reflections and results in,
Of note, Equation (2) preserves the cross-sectional area from a parent vessel to its child vessels, which results in a constant blood flow rate across the bifurcation. For laminar flow, resistance due to friction is minimized, which results in,
In Equation (3) the cross-sectional area increases from a parent vessel to its child vessels, which subsequently slows the rate of blood flow across the bifurcation. We note that Equation (3) is a variation on the canonical Murray's Law (Murray, 1926), only here the vessels radii have been expressed in terms of the radial branching scale factors and Δβ.
We also examined the Horton-Strahler length scale factor, γHS, a measure of length scaling that originates from an alternative generational labeling scheme first proposed in (Horton, 1945; Strahler, 1957) and examined in greater detail in (Yekutieli and Mandelbrot, 1994; Turcotte et al., 1998; Eloy et al., 2017). This scheme starts with labeling all identified terminal tips as the starting generation N = 1, and, working upstream toward the root vessel, advances the generation index only when two equally labeled vessels merge, as shown in Figure 4B. After labeling, vessels are redefined by their Horton-Strahler index such that a “new” vessel does not “begin” unless the Horton-Strahler index has changed. This relabeling between canonical generation (CG) labeling and Horton-Strahler (HS) labeling is demonstrated in Figures 4C,D. In Figure 4E, we compare distributions of the symmetrically defined length scale factor from CG labeling γCG = lj/lj−1, which ignores sibling branch variation, to the length scale factor from HS labeling γHS = lHS,j/lHS,j−1.
Measurements of the branching scale factors, and Δγ, were made for all segmented pulmonary vessels. Additionally, the following branching network metrics were collected: number of generations and number of terminal vessels across all identified vascular networks; root-vessel length, radius, and volume; terminal vessel length, radius, and volume. Two additional metrics that were collected were the Horton-Strahler length scale factor and the volumetric scale factor. Summary statistics for vascular network metrics collected are presented in Table 2. The volumetric scale factor represents the scaling of blood volume across a bifurcation, and is defined as . This metric is informative for examining how vascular based estimates of metabolic scaling vary with network size.
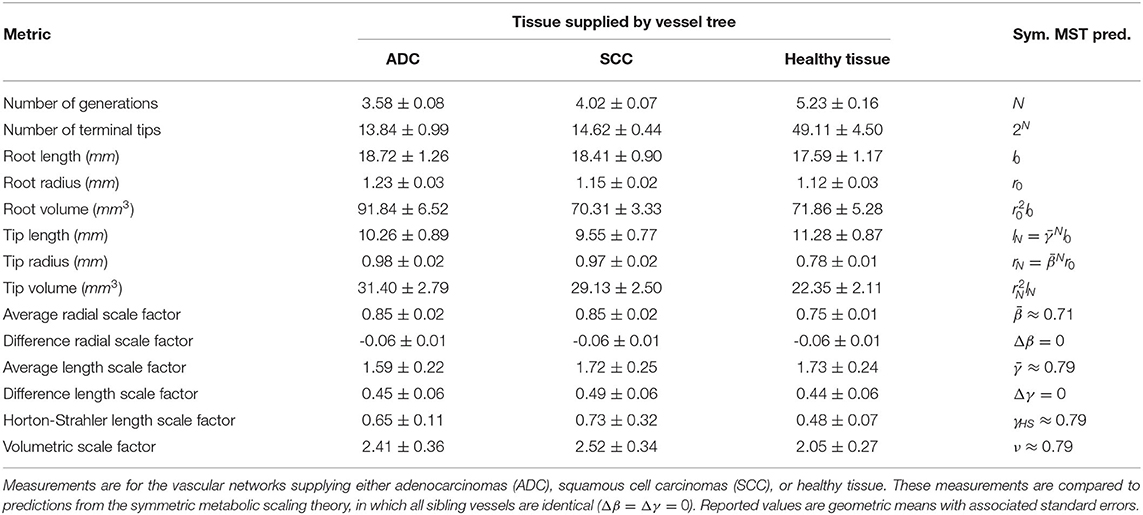
Table 2. Summaries of vessel network properties.
2.4.2. Measurement Procedures
To examine patterns and variations in vascular branching features between vessels that supply tumor tissue and those that supply healthy tissue, vessels first had to be categorized into these two different groups. To identify vessels directly responsible for supplying tumors, we identified all vessels from the Angicart segmentation output that intersected with the manual annotation of the tumor boundary. Next, all parent vessels to those intersecting the tumor boundary were added to the group of tumor supplying vessels. This process was iterated until reaching the vessel root for any given pulmonary vessel network. For multiple examples of tumor supplying vessels identified in this manner, see Figure 5. Importantly, some vessels that comprised these tumor supplying vessel subnetworks had either sibling or child vessels that did not service the tumor. These vessels were treated as part of the collection of vessels supplying healthy tissue.
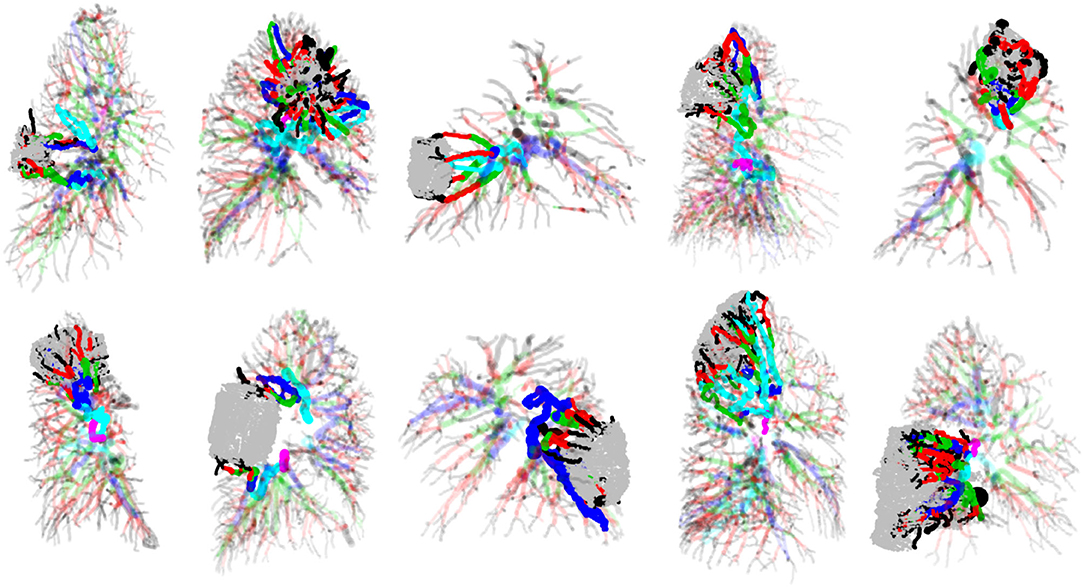
Figure 5. Examples of tumors, the pulmonary vasculature in which they are embedded and supplied by, and remaining pulmonary vasculature of the lungs. Tumors are the rounded shapes colored in gray, and vessels are cylindrical shapes colored according to HS generation labeling. Tumor-supplying vasculature is drawn in full-color with zero transparency, while healthy-tissue supplying vasculature are drawn in color but with partial transparency.
We used a kernel density estimator (KDE) method to compare vascular branching scale factor distributions between tumor supplying and non-tumor supplying networks as reported in (Brummer et al., 2021). This approach can be interpreted as a multidimensional extension of the univariate Kolmogorov-Smirnov test (KS-test) (Duong et al., 2012). We compared two-dimensional distributions for the constrained scale factor pairs of and , shown in Figure 6. The local KDE test identifies contours within the compared data that are uniquely responsible for driving differentiation between compared groups above a user defined threshold. This threshold has a natural translation into the conventional p-value of hypothesis testing (Duong, 2013). We chose to search for regions corresponding to the conventional p-value of 0.05, presented in Figure 6C. This technique is akin to layer-wise relevance propagation in deep learning algorithms (Montavon et al., 2019).
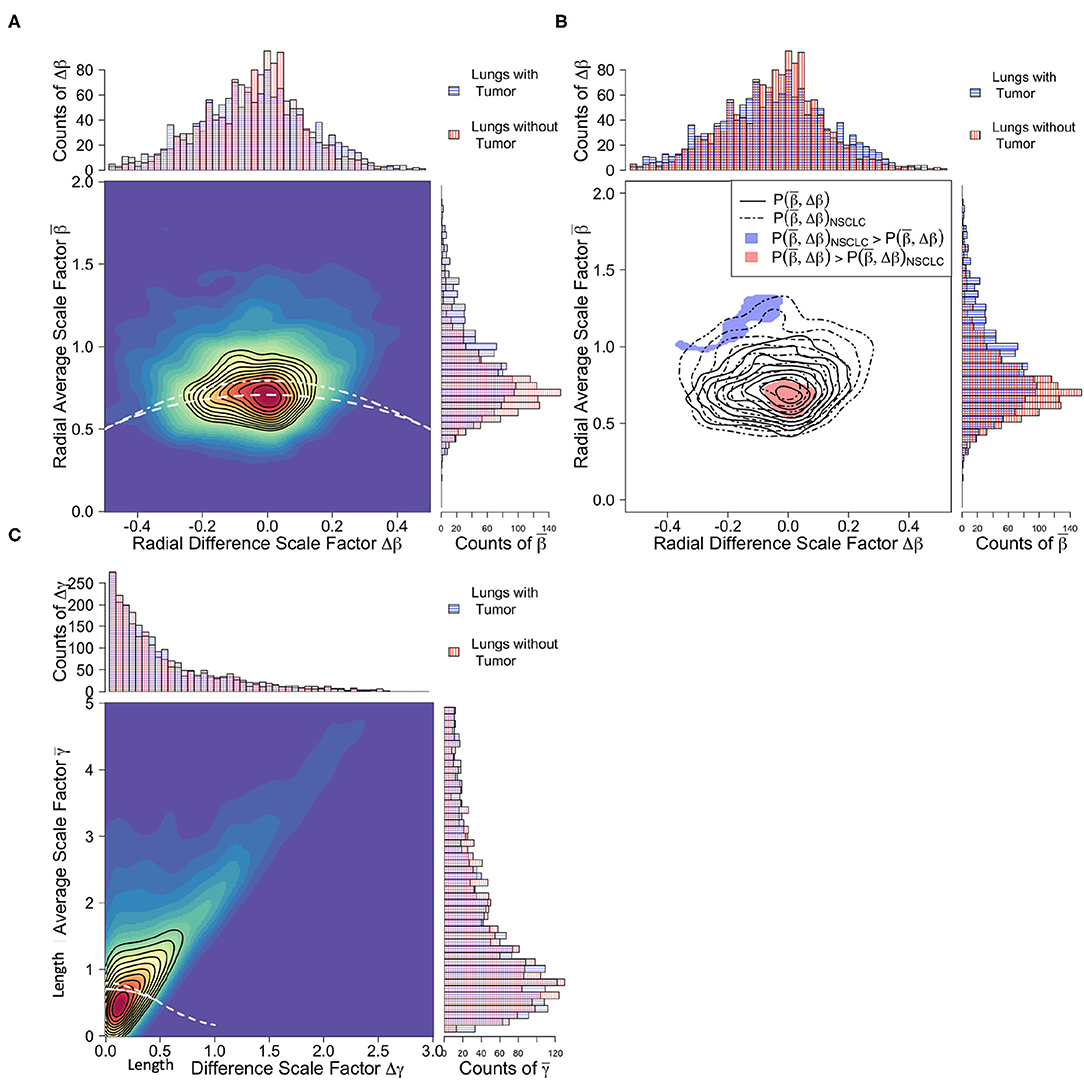
Figure 6. Comparison of branching scale factors between tumor-supplying vessels (blue) and healthy tissue-supplying vessels (red). (A) Joint and marginal distributions for radial scale factors. White dashed lines correspond to predicted constraint equations for cubic, area-increasing scaling, Equation (3), (top line) and square, area-preserving scaling, Equation (2), (bottom line). Note that both categories of vessel groups closely follow area-preserving scaling, yet variation in the tumor-supplying vessel groups trend toward area-increasing scaling. (B) Significance contours identifying regions in the radial scale factor feature space responsible for differentiation. Unlike the radial scale factors, length scale factors (C) defined using canonical generation labeling do not result in significant differentiation between vessel groups.
2.5. Metabolic Scaling From Vascular Measurements
By treating total metabolism of the supplied tissue as the sum of the metabolism of every terminal unit (e.g., cells and capillaries), Btot = BcapNcap, and examining the total volume, Vtot, of the vascular network that supplies the volume of cells, one can exactly express the metabolic scaling exponent, θ, as,
where N represents the total number of generations within the network and ν represents the scaling of blood volume across a bifurcation and is equal to . The piecewise definition of Equation (4) is required due to the asymptotic limit when ν ≈ 1, or when the combined volume of two child branches is equal to that of their parent branch. Two important assumptions underlying Equation (4) are that the network is strictly bifurcating (two child vessels for every parent vessel) and that the degree of asymmetry in the network does not result in significant self-pruning of vessels at high generations. This second assumption has the interpretation that the number of vessels N generations distal from a given parent vessel is approximately 2N. For detailed analyses of self-pruning in asymmetric pulmonary vascular networks see (Majumdar et al., 2005). An important conceptual interpretation of Equation (4), and metabolic scaling theory in general, is that it links the geometric distribution and delivery of blood supply to a given volume of metabolizing tissue.
To calculate metabolic scaling exponents for vascular trees using Equation (4), distributions of volumetric scale factors ν were first calculated for all bifurcations within the network. Geometric means for these distributions in ν were calculated to identify the average scaling of volume within each vascular tree. Estimates for the number of branching generations, N, within each vascular tree were determined from the number of terminal vessels, Ntips within each tree using the expression N = log(Ntips)/log(2). As this expression produces non-integer values for the number of generations, N was then rounded to the nearest integer. Examination of how the rounding of N influences final estimates of θ demonstrated no significant change.
2.6. Metabolic and Gross Tumor Volume Scaling
An important prediction of metabolic scaling theory is a power-law relationship between the metabolic tumor volume (MTV) and the gross tumor volume (GTV) that incorporates the metabolic scaling exponent (θ). The full derivation of this formula incorporates aspects of oxygen diffusion, vessel recruitment, and vascular branching arguments, and it can be found in the Supplementary Material. We present here the results of that argument,
where V0 is a normalization constant. The 2/3 exponent reflects the fact that the metabolically active region of the tumor is an exterior shell, and thus a Euclidean surface-area-to-volume scaling occurs between this region and the total tumor volume. Equation (5) provides an important method to extract metabolic scaling exponents from PET-CT imaging, as the metabolically active tumor volume (MTV) is measured with both PET and CT modalities, while the gross tumor volume (GTV) is measured only with the CT modality. This is in addition to the scaling of maximum standard uptake value to metabolic tumor volume, given as
where W0 is a normalization constant. Both of Equations (5) and (6) are used to examine PET-CT data collected for this study, shown in Figures 1, 2. Having dual measurements for the metabolic scaling exponent at the whole-tumor level gives added support when comparing these measurements against vascular based estimates using Equation (4).
3. Results
3.1. Allometric Regressions
Examination of PET-CT imaging data shows clear allometric trends in Figures 1, 2. For the larger dataset, we found that estimates of metabolic scaling exponents, θ, based on are θ = 0.71 ± 0.07, with histologically specific values of θ = 0.73 ± 0.09 for adenocarcinomas (ADCs) and θ = 0.59 ± 0.10 for squamous cell carcinomas (SCCs) (see Table 1). These measurements are consistent with those from the subset of the PET-CT data from which vascular segmentations were examined. However, variation in SUVmax is large enough that, with the smaller sample size for this latter subset, estimates for the metabolic scaling exponent θ are found to be less-significant for ADC and the combined data, and non-significant for SCCs. Estimates of θ based on the scaling of metabolic tumor volume and gross tumor volume, as in Equation (5), were found to be significant for both ADC (θ = 0.73 ± 0.21), SCC (θ = 0.62 ± 0.37), and the combined groups (θ = 0.70 ± 0.17). This finding indicates a potential robustness in image-based metabolic biomarkers that are distributed over the tumor volume, as opposed to those that are derived from the single brightest voxel.
3.2. Scale Factor Analysis
Scale factor analysis demonstrated significant differences between vasculature that supplies tumors and that which supplies healthy lung tissue. In Figure 6A, the joint distributions of the radial scale factors for healthy-tissue supplying vasculature can be seen to adhere well to the area preservation constraint of Equation (2), particularly in the presence of asymmetry (Δβ ≠ 0). Whereas the tumor supplying vasculature tends to exhibit area increasing radial scaling. This is supported by the average scale factor values for presented in Table 2, where for both ADC and SCC tumor vasculature, and for healthy-tissue vasculature. This is reinforced by the local KDE test in Figure 6B. Here the distinguishing regions of the different vessel category distributions are those corresponding precisely to area-preservation scaling for healthy tissue, and extreme area increasing scaling for the tumor vasculature. These differences have important physiological consequences related to fluid flow rates and blood volume supply that we explore in the Discussion.
Unlike the radial scale factors, no significant differences were observed between the tumor supplying and healthy tissue supplying vasculature in the average and difference length scale factor feature space , as seen in Figure 6C and Table 2. However, upon relabeling vessels using the Horton-Strahler topology, and remeasuring lengths and the Horton-Strahler length scale factor γHS, we found significant differences between the healthy vessel and tumor vessel populations (Figure 4). Specifically, we found that healthy vessels had an HS length scale factor of γHS = 0.48 ± 0.07, while ADC HS length scale factors averaged γHS = 0.65 ± 0.11 and SCCs averaged γHS = 0.73 ± 0.32. Theory does not presently exist to rigorously translate Horton-Strahler length scale factors into fractal dimensions of scaling. However, assuming that the fractal dimension can still be defined under the conventional manner as D = −log(2)/log(γHS), then one can still calculate the fractal dimension for a bifurcating system. In this case, the fractal dimension for the healthy tissue vasculature using Horton-Strahler labeling is D = 0.94, for ADCs is D = 1.61 and for SCCs is D = 2.20.
In addition to the conventional branching scale factors related to length and radius, we also analyzed the volumetric scale factor, ν, the ratio of the volume of both child branches to the volume of the parent branch across a bifurcation. Expressed in terms of the radial and length average and difference scale factors, . We measured distributions of ν for every bifurcation across all vessel categories. We found significant differences in volumetric scaling between the two tumor categories of ADC and SCC and the healthy tissue supplying vasculature. Specifically, we measured the average volumetric scale factor for healthy tissue vasculature was ν = 2.05 ± 0.27, where for ADCs ν = 2.41 ± 0.36 and for SCCs ν = 2.52 ± 0.34. This pronounced difference in the volume of blood supplied by the vasculature is due in part to the observed difference in radial scaling, and has important consequences for metabolic scaling given the dependence on ν in Equation (4).
3.3. Vascular Based Estimates of Metabolic Scaling
Evaluation of Equation (4) to estimate metabolic scaling exponents from vascular branching resulted in average values for ADCs of θ = 0.85 ± 0.03 and for SCCs θ = 0.87 ± 0.02 (see Table 1). These values are within the 95% confidence intervals of the PET-CT imaging based estimates using the scaling of metabolic tumor volume (MTV) to gross tumor volume (GTV) from Equation (5). Importantly, the consistency of these two, simultaneous measurements marks a first-of-its-kind test of metabolic scaling theory.
Further analysis of the vascular based estimates of the metabolic scaling exponents is shown in Figure 7, where the dependence of the metabolic scaling exponent on volumetric scaling and total network generation is presented, with results for vasculature supplying ADCs, SCCs, and healthy lung tissue. We find that the tumors and healthy tissues cluster separately within the feature space of metabolic scaling exponent, θ, number of network generations, N, and volumetric scale factor, ν. Specifically, the ADCs have values of N = 3.58 ± 0.08 and ν = 2.41 ± 0.36, the SCCs have values of N = 4.03 ± 0.07 and ν = 2.52 ± 0.34, and the healthy tissue vascular networks have values of N = 5.23 ± 0.16 and ν = 2.05 ± 0.27. These and other measured network values are reported in Table 2. The differences in the number of branching generations and volumetric scaling exist despite the fact that the tumors and healthy tissue vessel networks result in the same average values for the metabolic scaling exponent. This result serves to reinforce the potential value of vascular scale factors as imaging biomarkers for tumors.
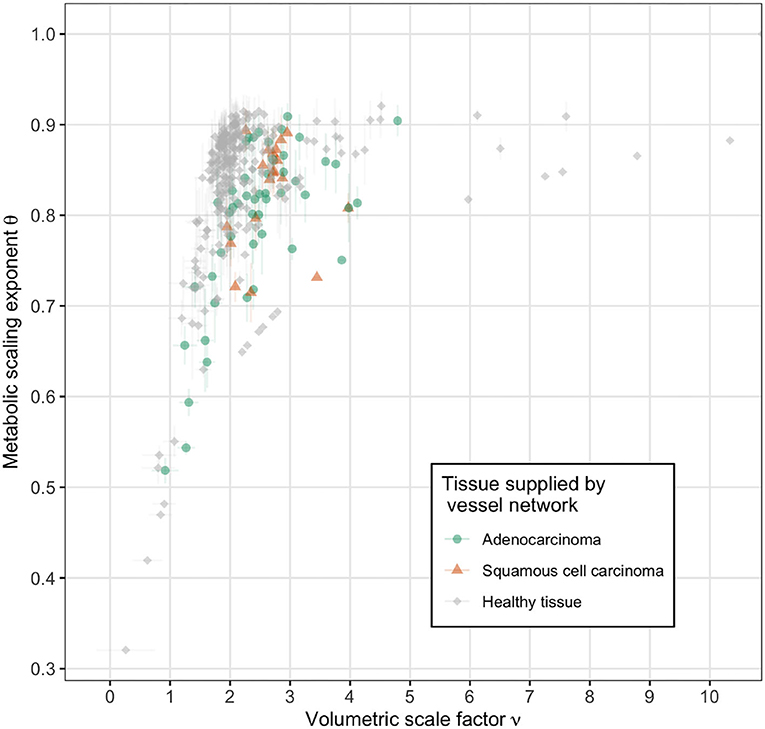
Figure 7. Vascular based estimates of metabolic scaling exponents as a function of volumetric scale factor for tumor supplying vessel networks (adenocarcinoma in green and squamous cell carcinoma in orange) and healthy tissue supplying vessel networks (gray). The direction of increasing network size, as measured by generation number N, is into the upper left corner. Note the distinct clustering of the healthy tissue supplying networks along ν ≈ 2 and the tumor supplying networks along ν > 2.
4. Discussion
In this work we demonstrate the potential for clinical cancer imaging to serve as a novel test of metabolic scaling theory. The nuclear and structural imaging modalities of positron emission tomography and X-ray computed tomography (PET-CT) provide a unique lens with which to examine metabolic scaling theory, with non-small cell lung cancer tumors serving as a model subject. We report several key findings as a result of this work, and summarize and discuss their implications. (i) We have conducted a first-of-its-kind simultaneous measurement of metabolic scaling. We utilize PET imaging to measure tumor glucose uptake as an estimate of metabolism via Equations (5) and (6), and CT imaging to measure the tumor-supplying vasculature that leads to vascular-based estimates of metabolic scaling via Equation (4). We report consistent measurements between these two approaches, a result that serves to validate the metabolic scaling theory of ecology. Furthermore, we highlight how growth models rooted in energetic partitioning connect these morphologic changes in tumor-supplying vasculature to tumor growth trajectories. (ii) We measure tumor-specific metabolic scaling exponents based on morphologic changes to the geometric scaling of the tumor-supplying vasculature. These structural changes in vascular scaling may serve as future imaging biomarkers to aid in disease detection, diagnosis, and stratification. (iii) We emphasize the opportunity for cancer to serve as a model subject to probe metabolic scaling theory at the onset of vascular development through the examination of small avascular tumors that transition to large vascularized tumors. (iv) Finally, we close by discussing several extensions and limitations of the work presented.
4.1. Simultaneous Measurements and Tumor Growth Trajectories
4.1.1. Simultaneous Measurements
Since the original inception of metabolic scaling theory in (West et al., 1997), simultaneous measurements of metabolic scaling have been elusive. However, these measurements are crucial for identifying strengths and weaknesses in the methods and theory of metabolic scaling, and for refining our understanding of metabolic scaling as a phenomenon (Price et al., 2012).
Our work presents a new and complementary perspective to the field of cancer biology which has recently seen a surge of interest in the scaling of tumor metabolism to tumor mass. Here, metabolic scaling is used as a quantitative framework for understanding the de-regulated growth of tumors facilitated by aerobic glycolysis, also known as the Warburg effect (Warburg, 1956; Vander Heiden et al., 2009). In these differing schools of thought, variation in metabolic scaling can be attributed to: variation in turnover rates from proliferative to necrotic states, resulting in transitions from linear to sub-linear scaling as in (Milotti et al., 2013); cell migration and competition as a driver of tumor subpopulations evolving from single to heterogenous states, resulting in transitions from sub-linear to super-linear scaling as in (Pérez-García et al., 2020); or sudden increases in oxygen supply levels as a result of angiogenesis, resulting in momentary accelerations in tumor growth and temporary super-linear scaling as in (Azimzade et al., 2021). Here, we present a perspective that connects variation in metabolic scaling to variation in the geometric scaling of the tumor-supplying vasculature. While the many proposed mechanisms of variation in metabolic scaling offer complementary views of tumor growth and heterogeneity, they can also inform possible reasons for treatment failures.
Important benefits of simultaneous measurements are their ability to test the robustness of models and measurable features from experimental and clinical data. Although the two different regression methods of measuring metabolic scaling exponents in Equations (5) and (6) led to consistent results, both measurements rely heavily on the maximum standard update value (SUVmax) from the PET imaging. Despite the fact that SUVmax will have little variation from differences in contouring, it can still vary from effects such as machine variability, patient physiology, and the partial volume effect. The latter of these is quite significant for metabolic scaling studies as it precludes many clinical PET imaging metrics from tumors smaller than 4 cm3. While important work is being done in the realm of quantitative imaging biomarker discovery to standardize metrics (see Sullivan et al., 2015), we comment here on two other metrics of growing interest, total lesion activity (TLA) and glucose metabolic rate (MRglu).
Recalling that TLA is the summed product of voxel volume and SUVi, or , we argue caution should be made in using TLA for examining metabolic scaling as it can introduce potentially spurious super-linear scaling. To see this, we highlight that if one calculates a volume-weighted average of SUV as , the definition of TLA appears in the numerator. Solving for TLA here results in, TLA = V〈SUV〉V. Thus, in comparing TLA to MTV as candidate metrics for a scaling phenomenon, a potential extra factor of volume can appear that may bias inferred scaling exponents toward the super-linear regime.
On the other hand, dynamic PET imaging may offer improved resolution of scaling phenomenon. Work by Visser et al. (2008) demonstrated that the combination of pharmacokinetic models of glucose uptake and dynamic PET imaging methods to measure the tumor glucose metabolic rate (MRglu) result in systematic reduction in estimates of tumor volume when compared to static PET images. However, comparison of tumor volume estimates from both static and dynamic PET imaging to tumor volumes measured after surgical resection show that both imaging metrics under-predicted tumor volume by as much as 50% (Meijer et al., 2017). Despite these varied differences, such work can still be valuable for metabolic scaling studies as over- or under-predicting tumor volume can be corrected as long as the deviations are systematic.
4.1.2. Growth Trajectories
Interpretation of the value of the metabolic scaling exponent for tumors is most easily done through the context of growth models. Although the data considered in this study consists entirely of single point-in-time measurements, the metabolic scaling exponent can provide insight into tumor growth trajectories. Metabolic scaling theory can be extended to model the growth trajectory of an organ or organism using energetic partitioning. Derivations and analyses of the following model can be found in the literature (West et al., 2001; Guiot et al., 2006; Herman et al., 2011). Here we summarize the main points of an energetic tumor growth model, and in particular as it relates to the vascular supply network.
The growth of tumor mass over time can be expressed in the following differential equation,
where mc is the mass of an individual cell, Ec is the energetic cost of cellular division, Bc is the metabolic cost of cellular maintenance, and B0 is the normalization constant for the metabolic scaling allometry. Equation (7) is derived by partitioning the total metabolic power available into two terms: one for cellular growth and the other for the cost of cellular maintenance. In Equation (7), the resulting growth term appears on the left-hand-side, while the terms for total metabolism minus the cost of maintenance appear on the right-hand-side. Historically, Equation (7) is also known as the Bertalanffy-Richards model of growth (Von Bertalanffy, 1957; Richards, 1959).
An important feature of Equation (7) is how the stability of the equilibrium mass, meq, changes with respect to the metabolic scaling exponent θ. For super-linear metabolic scaling, where θ > 1, the equilibrium mass is an unstable fixed point. Furthermore, if m < meq, the maintenance term in Equation (7) dominates the behavior and the system converges to meq = 0, whereas if m > meq then the cost term is negligible, and the tumor mass grows without bound. For linear metabolic scaling, associated with laminar blood flow and where θ = 1, Equation (7) reduces to that of exponential growth, with no stable equilibrium. Finally, for sub-linear scaling, where θ < 1, the equilibrium mass is a stable fixed point.
The combination of Equations (4) and (7) highlights how patterns in vascular development during tumor angiogenesis can determine a growth trajectory (this is in addition to the histologically specific values of mc, Ec, Bc, and B0. In particular, as a tumor neoplasm develops, it first exists in the linear metabolic scaling regime with no equilibrium state and exhibits runaway growth. Once the tumor begins secreting angiogenic factors, new vasculature develops to supply the tumor with blood, subsequently reshaping the local vascular branching geometry and driving the tumor into the sub-linear metabolic scaling regime with a stable equilibrium. Thus, in the context of metabolic scaling theory, the geometric scaling of the tumor vasculature can serve as a measurable bifurcation parameter of the tumor growth trajectory.
The vascular-based tuning of growth demonstrates the importance for future measurements of both metabolic scaling exponents and tumor microenvironment variables extracted from pathology samples and/or altogether new metabolic radio-tracers to determine the overall tumor growth trajectory (Momcilovic et al., 2019). These efforts are especially important in understanding variation in tumor growth due to differences in tumor histology (e.g., squamous cell carcinoma and adenocarcinoma) and heterogeneity.
4.2. Vascular Morphogenesis
Our work in examining metabolic scaling in tumors relies heavily on measurements of the pulmonary vascular-network that is supplying the tumors with blood. We propose a procedure for identifying the tumor-supplying vessels as those that penetrate the segmented tumor contours, and a routine for identifying the vascular tree in which these vessels are connected. We subsequently demonstrate that these tumor-supplying vascular trees exhibit markedly different radial scaling than the healthy lung tissue-supplying vascular networks (Figure 6). These differences have important connections to volumetric blood-flow rates.
There are two potential physiological consequences for the observed differences in radial scaling. Conservation of fluid flow dictates that area increasing scaling will result in a slowing of the blood flow from parent to child vessels across a bifurcation. Large tumors will necessarily attach to large diameter vessels, which diminishes the number of branching generations that would normally be present to slow the flow of blood. Thus, vessel widening may be viewed as a compensatory mechanism to facilitate the slowing down of blood flow in the absence of a sufficient number of branching generations.
The second consequence for increased radial scaling is increasing the total blood volume delivered per unit time. This is supported by the observed increase in volumetric scaling for tumor-supplying vessels over healthy tissue-supplying vessels (Figure 7 and Table 2). As a tumor grows it places an increasing demand on nutrient supply in terms of blood volume. This can be accomplished by increasing either the vessel length or vessel radius. However, an increase in vessel length can only occur through the process of growing wholly new vessels, or by pruning existing vessels at a branch point, whereas increasing vessel radius can be achieved in any existing vessel. Furthermore, as changes in vessel volume are constant with respect to length and linear with respect to radius, the benefit of increasing radius is two-fold. That is, doubling the length only doubles the volume, but doubling the radius will quadruple the volume.
4.3. Metabolic Scaling in Avascular Systems
Finally, this work highlights important opportunities for insights and perspectives from cancer biology to inform ecology and evolutionary biology. Although applications of metabolic scaling in ecology and evolutionary biology permeate a myriad of systems (e.g., food webs, predator-prey interactions, forrest demography, and species-area distributions) a central hallmark of metabolic scaling theory is the reliance on a well-defined vascular network distributing resources. Thus, in systems absent of resource distribution networks, deviations from metabolic scaling predictions can be challenging to interpret.
The biological processes of tumor growth and angiogenesis represent a unique opportunity to study metabolic scaling theory beyond the vascular regime. Many conventional tumor growth and angiogenesis models are cast as reaction-diffusion processes that highlight different phenomena operating at different scales (Hormuth et al., 2021). Cellular-scale models incorporate any number of terms specific to cellular growth, death, interactions, and importantly include cellular motion due to diffusion, advection and chemical attraction (Frieboes et al., 2010). Tissue-scale models balance the demands of fluid transport within vascular networks, fluid flux through vessel walls, and interstitial flow that links the embedding tissues with the supplying vessels (Wu et al., 2020).
Metabolic scaling theory may serve to bridge these phenomenological scales by linking geometric patterns of tissue vasculature to the metabolic demands of cellular processes. Alternatively, framing the cell and tissue scale processes in the context of metabolic scaling theory may help to inform the modeling of other biological systems conventional to ecology and evolutionary biology. For example, models of cellular diffusion bear much resemblance to those of species aggregation and migration, and could inform recent efforts in landscape disturbance ecology (Harte et al., 2021). Similarly, the interaction between tumor driven angiogenesis and changes in the tumor microenvironment may guide studies on the interaction between environmental drivers and biomechanical limits to cellular evolution (Malerba and Marshall, 2021).
4.4. Extensions and Limitations
Here we outline several extensions and limitations of this work. These span: improvements in technical analyses and model approaches; the focus of pulmonary arterial networks over bronchial arterial networks; applications in tumor directed chemotherapy, embolization, and malignancy determination; and the general study of other cancers.
4.4.1. Small Lesions and Partial Volume Limitations
A challenge of the current study is the inability to accurately apply metabolic scaling theory to the study of small lesions, here defined as having a tumor volume less than 4 cm3. This is a consequence of the partial volume effect, an imaging artifact in which objects near the resolution limit may appear larger than they actually are (Soret et al., 2007). The partial volume effect can skew measurements of tumor and vessel volumes extracted from CT imaging, in addition to metabolic measurements from PET imaging. Important work has been done to quantify the size of the partial volume effect in PET imaging by using imaging phantoms (materials designed with known radioactivities) (Kinahan et al., 2009), as well as to define analysis protocols to correct for the partial volume effect based on background PET measurements in the vicinity of a lesion (Salavati et al., 2017). Regarding CT imaging, recent studies of variation in image acquisition (dose and resolution) and reconstruction methods are providing important insight into the source and nature of variation in lesion detection and quantification (Lo et al., 2016). Finally, recent work leveraging mathematical theorems of vessel shape and geometry have identified systematic procedures for subsampling vessel image data to resolutions beyond the imaging modality limit (Brummer et al., 2021). Thus, while small lesions were omitted from this work, future efforts have multiple avenues available for their inclusion.
4.4.2. Horton-Strahler Corrections to Vascular Branching Architecture
The biased differences between the PET-CT derived estimates for the metabolic scaling exponents and the vascular based estimates can be partially resolved with careful examination of the length scale factors of the vascular networks. A common finding in measuring length scale factors is the heavy-tailed structure of their distributions (Newberry et al., 2015; Tekin et al., 2016; Brummer et al., 2021). This results in large distribution means for length scale factors , which can subsequently increase the estimate of the metabolic scaling exponent. A benefit of the Horton-Strahler labeling scheme is that it systematically lowers the estimates for length scaling and results in more biophysically realistic estimates of the fractal dimension for the network (Figure 4E and Table 2). Furthermore, we can approximate the impact of the length scaling bias on estimates of the metabolic scaling exponent by utilizing the Horton-Strahler length scale factor and the fact that the vascular networks studied exhibit radial symmetry.
An exact derivation of Equation (4) for the Horton-Strahler topology remains elusive, primarily due to the challenges of bridging the formalisms for asymmetrically branching networks. However, our measurements show that the vascular systems exhibit radial symmetry, 〈Δβ〉 ≈ 0 (see Figure 6 and Table 2). Thus, the definition of the volume scale factor reduces to , where we have substituted with γHS under a symmetric approximation. Evaluating Equation (4) with this approximate form of ν and values taken from Table 2 results in estimates of the metabolic scaling exponent of θHS = 0.60 for ADCs and θHS = 0.65 for SCCs, values that are intriguingly closer to those extracted from the PET-CT allometric scaling measurements. This suggests the HS topology may be a more appropriate labeling scheme for these types of vasculature (Table 1).
4.4.3. Pulmonary vs. Bronchial (Systemic) Arterial Networks
A unique feature of the lung is that it possesses a dual arterial blood supply. The pulmonary arterial trees are responsible for oxygenating the blood supply and dispelling byproducts of systemic cellular respiration, while the bronchial (or systemic) arterial trees provide oxygenated blood specifically to lung tissue for their own cellular respiration. This dual blood supply feature of the lungs is also shared with lung tumors (Milne, 1967), and resolving the extent to which the different vascular networks are involved in tumor initiation, growth, histology, and metastasization is an active field of research (Nguyen-Kim et al., 2015; Eldridge et al., 2016; Deng et al., 2020).
Importantly for this study, the diameters of the vessels in the bronchial arterial tree are an order of magnitude smaller than those found in the pulmonary arterial tree. This results in many of the bronchial vessels not being detected in typical clinical CT imaging devices and likely being absent from our study. There exist methods to simultaneously measure both pulmonary and bronchial arterial networks using carefully designed perfusion CT imaging. However, these methods are technologically demanding and require exceptionally large doses of radiation to be given to patients, precluding their widespread adoption (Yuan et al., 2012; Nguyen-Kim et al., 2015).
The absence of bronchial vascular networks from our study may contribute to the observed difference between the allometric-based and vascular-branching-based measurements of metabolic scaling exponents (Table 1). The exact size of the contribution of the bronchial networks to the total tumor metabolism is not currently known. However, current understanding suggests as tumors increase in size they begin to undergo hypoxia internally and subsequently develop necrotic cores. As a result, vessel recruitment through either angiogenesis or cooption of the pulmonary arterial vessels can occur at the tumor boundary to facilitate an increase in tumor blood supply. Thus, we presume that by focusing this study to larger tumors of clinical staging II-IV, the reliance on bronchial arterial supply is minimized.
4.4.4. Tumor Directed Therapies and Embolization
Tumor directed therapies—ones that try to localize treatment more to the local tumor and not the whole body—may be greatly informed by distinguishing between bronchial and pulmonary tumor vascular supply, providing a major motivator for future studies in that direction. Expansive knowledge of the vascular supply to hepatic tumors has led to a multitude of standard treatment options that combine vascular embolization with any of radio-, chemo-, or immunotherapy (Erinjeri et al., 2019). These methods provide localized tumor directed treatment and alleviate many of the complicating side-effects associated with systemic (whole-body) approaches or surgical intervention. In the treatment of lung cancer, transpulmonary chemoembolization has proven successful as an interventional technique, yet has questionable impact on overall patient survival (Lindemayr et al., 2007; Vogl et al., 2013). We propose our framework of coupling tumor vascular supply to tumor metabolism as a method for screening for patients that are likely to respond to tumor directed therapies. Specifically, tumors whose vascular supply is dominated by the pulmonary arterial vasculature may be good candidates for these therapies as the likelihood of treatment escape through the bronchial arterial supply should be minimal.
4.4.5. Malignancy Determination in Lung Cancer
The methods and results presented here have potential to serve as biomarkers of tumor malignancy. Previous work by others has demonstrated the ability of blood vessel branching metrics to serve as indicators of tumor malignancy. In a radiomics-inspired study, blood vessel volume was identified as an imaging biomarker that could distinguish between adenocarcinomas and granulomas in the networks supplying and surrounding the nodules (Alilou et al., 2018). Blood vessel volume would be most directly related to our volumetric scale factor, ν, which we found to indicate significant differences between blood vessel networks supplying healthy and tumor burdened lungs (Table 2). Furthermore, another study identified blood vessel diameter as being indicative of malignant vs. benign classification in a patient cohort with comorbidities of chronic obstructive pulmonary disorder (e.g., emphysema) (Wang et al., 2017). Blood vessel diameter constitutes our radial average and difference scale factors, and Δγ, which also demonstrated significant differences between healthy and tumor burdened pulmonary vessels (Table 2). Finally, our measurements of vessel length scaling, specifically the average length scale factor, , and the Horton-Strahler length scale factor, γHS, identified modest differences between adenocarcinomas and squamous cell carcinomas, suggesting that histologically-based differences in tumor-supplying vasculature may exist (Table 2). These results motivate future work to better quantify the diagnostic potential of blood vessel biomarkers both for malignancy determination and histological stratification.
4.4.6. General Study of Other Cancers
While this work focused on the application of metabolic scaling theory to the study of non-small cell lung carcinoma and PET-CT imaging, it should be applicable to other cancers and imaging modalities. Recent work by Pérez-García et al. (2020) has demonstrated the existence of metabolic allometries in brain, lung, breast, rectal, and head and neck cancers. The challenge that persists is accurate segmentation of the supplying vasculature, and more so, the vasculature that comprises the tumor itself. This is a challenge at the intersection of imaging modality and computer vision. We chose to focus on the lung in order to minimize the presence of background tissue that may complicate accurate vessel segmentation using high dose CT. However, ongoing efforts that utilize vessel segmentation to guide therapeutic interventions and track treatment response in liver and breast cancer using diffusion-weighted contrast-enhanced magnetic resonance imaging (see Marčan et al., 2015; Wu et al., 2020) may benefit from metabolic scaling theory, or even contribute to its development. In fact, the highly vascularized nature of liver tumors offers a unique opportunity to test the assumption that tumor-supplying vessels are a sufficient proxy for tumor-comprising vessels.
5. Conclusion
We present a first-of-its-kind test of metabolic scaling theory. Leveraging clinical PET-CT imaging across a cohort of patients, and computer vision methods to extract pulmonary vascular segmentation, we simultaneously measure metabolic scaling exponents from allometric regressions on tumor metabolism and mass as well as geometric models of the vascular branching architecture. The consistency of these measurements supports the framework of metabolic scaling theory, and introduces new opportunities for imaging biomarkers in the detection, diagnostics, and tracking of non-small cell lung carcinoma. Specifically, we find that the pulmonary vascular networks that supply tumors with blood exhibit area-increasing radial scaling with essential physiological consequences. This scaling facilitates a slowing of blood flow and an increase in total blood volume delivered. In combination with measurements of tumor cell proliferation from histological studies, these vascular imaging features can be utilized for the prediction of tumor growth. Additionally, this work highlights unique opportunities to further develop and test the metabolic scaling theory of ecology in avascular systems.
Data Availability Statement
Publicly available datasets were analyzed in this study. This data can be found at the Cancer Imaging Archive: https://www.cancerimagingarchive.net/ at the repository titled “Radiogenomics”. Data collected and generated are available on a Github repository https://github.com/alexbbrummer/NSCLC_metabolic_scaling.
Ethics Statement
Ethical review and approval was not required for the study on human participants in accordance with the local legislation and institutional requirements. Written informed consent for participation was not required for this study in accordance with the national legislation and the institutional requirements.
Author Contributions
ABB and VMS designed the study. ABB assembled the data, performed all the analyses, and wrote the first draft of the manuscript. Both authors have discussed the results and contributed extensively to the final manuscript.
Funding
ABB was supported in part by the National Science Foundation (grant 1254159).
Conflict of Interest
The authors declare that the research was conducted in the absence of any commercial or financial relationships that could be construed as a potential conflict of interest.
Publisher's Note
All claims expressed in this article are solely those of the authors and do not necessarily represent those of their affiliated organizations, or those of the publisher, the editors and the reviewers. Any product that may be evaluated in this article, or claim that may be made by its manufacturer, is not guaranteed or endorsed by the publisher.
Acknowledgments
The authors would like to acknowledge the following individuals who contributed data to this study as well as comments on the initial draft: Sarah Mattonen (Mattonen et al., 2019), Yoshihasa Shimada and Yojiro Makino (Furumoto et al., 2018), David Chardin and Olivier Humbert (Chardin et al., 2020), and Jesús Bosque Martínez and Víctor Manuel Pérez García (Pérez-García et al., 2020). Furthermore, the authors would like to acknowledge the following individuals for insightful discussions during the development of this work and manuscript: Mary Sehl, David Shackelford, Russell Rockne, Michael McNitt-Gray, Aaron Lisberg, Eric Deeds, and Vikram Adhikarla.
Supplementary Material
The Supplementary Material for this article can be found online at: https://www.frontiersin.org/articles/10.3389/fevo.2021.691830/full#supplementary-material
References
Aerts, H. J., Velazquez, E. R., Leijenaar, R. T., Parmar, C., Grossmann, P., Carvalho, S., et al. (2014). Decoding tumour phenotype by noninvasive imaging using a quantitative radiomics approach. Nat. Commun. 5:4006. doi: 10.1038/ncomms5644
Alilou, M., Orooji, M., Beig, N., Prasanna, P., Rajiah, P., Donatelli, C., et al. (2018). Quantitative vessel tortuosity: a potential CT imaging biomarker for distinguishing lung granulomas from adenocarcinomas. Sci. Rep. 8:15290. doi: 10.1038/s41598-018-33473-0
Apte, R. S., Chen, D. S., and Ferrara, N. (2019). Vegf in signaling and disease: beyond discovery and development. Cell 176, 1248–1264. doi: 10.1016/j.cell.2019.01.021
Ardila, D., Kiraly, A. P., Bharadwaj, S., Choi, B., Reicher, J. J., Peng, L., et al. (2019). End-to-end lung cancer screening with three-dimensional deep learning on low-dose chest computed tomography. Nat. Med. 25, 954–961. doi: 10.1038/s41591-019-0447-x
Azimzade, Y., Saberi, A. A., and Gatenby, R. A. (2021). Superlinear growth reveals the allee effect in tumors. Phys. Rev. E 103:042405. doi: 10.1103/PhysRevE.103.042405
Bailey, D. L., Maisey, M. N., Townsend, D. W., and Valk, P. E. (2005). Positron Emission Tomography: Basic Sciences, Vol. 2. London: Springer.
Banavar, J. R., Moses, M. E., Brown, J. H., Damuth, J., Rinaldo, A., Sibly, R. M., et al. (2010). A general basis for quarter-power scaling in animals. Proc. Natl. Acad. Sci. U.S.A. 107, 15816–15820. doi: 10.1073/pnas.1009974107
Barneche, D. R., Robertson, D. R., White, C. R., and Marshall, D. J. (2018). Fish reproductive-energy output increases disproportionately with body size. Science 360, 642–645. doi: 10.1126/science.aao6868
Bejan, A. (2001). The tree of convective heat streams: its thermal insulation function and the predicted 3/4-power relation between body heat loss and body size. Int. J. Heat Mass Transfer 44, 699–704. doi: 10.1016/S0017-9310(00)00138-1
Bentley, L. P., Stegen, J. C., Savage, V. M., Smith, D. D., von Allmen, E. I., Sperry, J. S., et al. (2013). An empirical assessment of tree branching networks and implications for plant allometric scaling models. Ecol. Lett. 16, 1069–1078. doi: 10.1111/ele.12127
Bettencourt, L. M., Lobo, J., Helbing, D., Kühnert, C., and West, G. B. (2007). Growth, innovation, scaling, and the pace of life in cities. Proc. Natl. Acad. Sci. U.S.A. 104, 7301–7306. doi: 10.1073/pnas.0610172104
Brose, U., Williams, R. J., and Martinez, N. D. (2006). Allometric scaling enhances stability in complex food webs. Ecol. Lett. 9, 1228–1236. doi: 10.1111/j.1461-0248.2006.00978.x
Brummer, A. B., Hunt, D., and Savage, V. (2021). Improving blood vessel tortuosity measurements via highly sampled numerical integration of the Frenet-Serret equations. IEEE Trans. Med. Imaging 40, 297–309. doi: 10.1109/TMI.2020.3025467
Brummer, A. B., Lymperopoulos, P., Shen, J., Tekin, E., Bentley, L. P., Buzzard, V., et al. (2021). Branching principles of animal and plant networks identified by combining extensive data, machine learning and modelling. J. R. Soc. Interface 18:20200624. doi: 10.1098/rsif.2020.0624
Brummer, A. B., Savage, V. M., and Enquist, B. J. (2017). A general model for metabolic scaling in self-similar asymmetric networks. PLoS Comput. Biol. 13:e1005394. doi: 10.1371/journal.pcbi.1005394
Chardin, D., Paquet, M., Schiappa, R., Darcourt, J., Bailleux, C., Poudenx, M., et al. (2020). Baseline metabolic tumor volume as a strong predictive and prognostic biomarker in patients with non-small cell lung cancer treated with pd1 inhibitors: a prospective study. J. Immunother. Cancer 8:e000645. doi: 10.1136/jitc-2020-000645
Clark, K., Vendt, B., Smith, K., Freymann, J., Kirby, J., Koppel, P., et al. (2013). The cancer imaging archive (TCIA): maintaining and operating a public information repository. J. Digital Imaging 26, 1045–1057. doi: 10.1007/s10278-013-9622-7
DeLong, J. P., Okie, J. G., Moses, M. E., Sibly, R. M., and Brown, J. H. (2010). Shifts in metabolic scaling, production, and efficiency across major evolutionary transitions of life. Proc. Natl. Acad. Sci. U.S.A. 107, 12941–12945. doi: 10.1073/pnas.1007783107
Deng, L., Tang, H., Qiang, J., Wang, J., and Xiao, S. (2020). Blood supply of early lung adenocarcinomas in mice and the tumor-supplying vessel relationship: a micro-CT angiography study. Cancer Prevent. Res. 13, 989–996. doi: 10.1158/1940-6207.CAPR-20-0036
Dodds, P. S. (2010). Optimal form of branching supply and collection networks. Phys. Rev. Lett. 104:048702. doi: 10.1103/PhysRevLett.104.048702
D'Sa, R., Lewis, K., Pereira, J., Thomas, V., Chavan, D., et al. (2019). “Comparative analysis of lung segmentation,” in Proceedings of International Conference on Communication and Information Processing (ICCIP). doi: 10.2139/ssrn.3424473
Duong, T. (2013). Local significant differences from nonparametric two-sample tests. J. Nonparametric Stat. 25, 635–645. doi: 10.1080/10485252.2013.810217
Duong, T., Goud, B., and Schauer, K. (2012). Closed-form density-based framework for automatic detection of cellular morphology changes. Proc. Natl. Acad. Sci. U.S.A. 109, 8382–8387. doi: 10.1073/pnas.1117796109
Eldridge, L., Moldobaeva, A., Zhong, Q., Jenkins, J., Snyder, M., Brown, R. H., et al. (2016). Bronchial artery angiogenesis drives lung tumor growth. Cancer Res. 76, 5962–5969. doi: 10.1158/0008-5472.CAN-16-1131
Eloy, C., Fournier, M., Lacointe, A., and Moulia, B. (2017). Wind loads and competition for light sculpt trees into self-similar structures. Nat. Commun. 8:1014. doi: 10.1038/s41467-017-00995-6
Enquist, B. J., Brown, J. H., and West, G. B. (1998). Allometric scaling of plant energetics and population density. Nature 395, 163–165. doi: 10.1038/25977
Enquist, B. J., West, G. B., and Brown, J. H. (2009). Extensions and evaluations of a general quantitative theory of forest structure and dynamics. Proc. Natl. Acad. Sci. U.S.A. 106, 7046–7051. doi: 10.1073/pnas.0812303106
Erinjeri, J. P., Fine, G. C., Adema, G. J., Ahmed, M., Chapiro, J., Den Brok, M., et al. (2019). Immunotherapy and the interventional oncologist: challenges and opportunities—a society of interventional oncology white paper. Radiology 292, 25–34. doi: 10.1148/radiol.2019182326
Frieboes, H. B., Jin, F., Chuang, Y.-L., Wise, S. M., Lowengrub, J. S., and Cristini, V. (2010). Three-dimensional multispecies nonlinear tumor growth—II: tumor invasion and angiogenesis. J. Theoret. Biol. 264, 1254–1278. doi: 10.1016/j.jtbi.2010.02.036
Furumoto, H., Shimada, Y., Imai, K., Maehara, S., Maeda, J., Hagiwara, M., et al. (2018). Prognostic impact of the integration of volumetric quantification of the solid part of the tumor on 3DCT and FDG-PET imaging in clinical stage IA adenocarcinoma of the lung. Lung Cancer 121, 91–96. doi: 10.1016/j.lungcan.2018.05.001
Gevaert, O., Xu, J., Hoang, C. D., Leung, A. N., Quon, A., Rubin, D. L., et al. (2012). Non-small cell lung cancer: identifying prognostic imaging biomarkers by leveraging public gene expression microarray data-methods and preliminary results. Radiology 264, 387–396. doi: 10.1148/radiol.12111607
Guiot, C., Degiorgis, P. G., Delsanto, P. P., Gabriele, P., and Deisboeck, T. S. (2003). Does tumor growth follow a “universal law”? J. Theoret. Biol. 225, 147–151. doi: 10.1016/S0022-5193(03)00221-2
Guiot, C., Delsanto, P. P., Carpinteri, A., Pugno, N., Mansury, Y., and Deisboeck, T. S. (2006). The dynamic evolution of the power exponent in a universal growth model of tumors. J. Theoret. Biol. 240, 459–463. doi: 10.1016/j.jtbi.2005.10.006
Harte, J., and Newman, E. A. (2014). Maximum information entropy: a foundation for ecological theory. Trends Ecol. Evol. 29, 384–389. doi: 10.1016/j.tree.2014.04.009
Harte, J., Umemura, K., and Brush, M. (2021). Dynamete: a hybrid maxent-plus-mechanism theory of dynamic macroecology. Ecol. Lett. 24, 935–949. doi: 10.1111/ele.13714
Hatton, I. A., McCann, K. S., Fryxell, J. M., Davies, T. J., Smerlak, M., Sinclair, A. R., et al. (2015). The predator-prey power law: biomass scaling across terrestrial and aquatic biomes. Science 349:aac6284. doi: 10.1126/science.aac6284
Herman, A. B., Savage, V. M., and West, G. B. (2011). A quantitative theory of solid tumor growth, metabolic rate and vascularization. PLoS ONE 6:e22973. doi: 10.1371/journal.pone.0022973
Hormuth, D. A., Phillips, C. M., Wu, C., Lima, E. A. B. F., Lorenzo, G., Jha, P. K., et al. (2021). Biologically-based mathematical modeling of tumor vasculature and angiogenesis via time-resolved imaging data. Cancers 13:3008. doi: 10.3390/cancers13123008
Horton, R. E. (1945). Erosional development of streams and their drainage basins; hydrophysical approach to quantitative morphology. Geol. Soc. Am. Bull. 56, 275–370. doi: 10.1130/0016-7606(1945)56[275:EDOSAT]2.0.CO;2
Huang, Q., Hu, X., He, W., Zhao, Y., Hao, S., Wu, Q., et al. (2018). Fluid shear stress and tumor metastasis. Am. J. Cancer Res. 8:763.
Huo, Y., and Kassab, G. S. (2009a). A scaling law of vascular volume. Biophys. J. 96, 347–353. doi: 10.1016/j.bpj.2008.09.039
Huo, Y., and Kassab, G. S. (2009b). The scaling of blood flow resistance: from a single vessel to the entire distal tree. Biophys. J. 96, 339–346. doi: 10.1016/j.bpj.2008.09.038
Jain, R. K. (2005). Normalization of tumor vasculature: an emerging concept in antiangiogenic therapy. Science 307, 58–62. doi: 10.1126/science.1104819
Jin, Y., Fayad, L. M., and Laine, A. F. (2001). “Contrast enhancement by multiscale adaptive histogram equalization,” in Proc. SPIE 4478, Wavelets: Applications in Signal and Image Processing IX. doi: 10.1117/12.449705
Kinahan, P. E., Doot, R. K., Wanner-Roybal, M., Bidaut, L. M., Armato, S. G. III, Meyer, C. R., et al. (2009). PET/CT assessment of response to therapy: tumor change measurement, truth data and error. Transl. Oncol. 2, 223–230. doi: 10.1593/tlo.09223
Kinahan, P. E., and Fletcher, J. W. (2010). Positron emission tomography-computed tomography standardized uptake values in clinical practice and assessing response to therapy. Semin. Ultrasound CT MRI 31, 496–505. doi: 10.1053/j.sult.2010.10.001
Lambin, P., Leijenaar, R. T., Deist, T. M., Peerlings, J., De Jong, E. E., Van Timmeren, J., et al. (2017). Radiomics: the bridge between medical imaging and personalized medicine. Nat. Rev. Clin. Oncol. 14:749. doi: 10.1038/nrclinonc.2017.141
Lau, A., Martius, C., Bartholomeus, H., Shenkin, A., Jackson, T., Malhi, Y., et al. (2019). Estimating architecture-based metabolic scaling exponents of tropical trees using terrestrial lidar and 3D modelling. Forest Ecol. Manage. 439, 132–145. doi: 10.1016/j.foreco.2019.02.019
Lindemayr, S., Lehnert, T., Korkusuz, H., Hammerstingl, R., and Vogl, T. J. (2007). Transpulmonary chemoembolization: a novel approach for the treatment of unresectable lung tumors. Tech. Vasc. Intervent. Radiol. 10, 114–119. doi: 10.1053/j.tvir.2007.09.010
Lo, P., Young, S., Kim, H., Brown, M., and McNitt-Gray, M. (2016). Variability in CT lung-nodule quantification: effects of dose reduction and reconstruction methods on density and texture based features. Med. Phys. 43, 4854–4865. doi: 10.1118/1.4954845
Majumdar, A., Alencar, A. M., Buldyrev, S. V., Hantos, Z., Lutchen, K. R., Stanley, H. E., et al. (2005). Relating airway diameter distributions to regular branching asymmetry in the lung. Phys. Rev. Lett. 95:168101. doi: 10.1103/PhysRevLett.95.168101
Malerba, M. E., and Marshall, D. J. (2021). Larger cells have relatively smaller nuclei across the tree of life. Evol. Lett. 5, 306–314. doi: 10.1002/evl3.243
Marčan, M., Kos, B., and Miklavčič, D. (2015). Effect of blood vessel segmentation on the outcome of electroporation-based treatments of liver tumors. PLOS ONE 10:e0125591. doi: 10.1371/journal.pone.0125591
Mattonen, S. A., Davidzon, G. A., Bakr, S., Echegaray, S., Leung, A. N., Vasanawala, M., et al. (2019). [18f] fdg positron emission tomography (PET) tumor and penumbra imaging features predict recurrence in non–small cell lung cancer. Tomography 5:145. doi: 10.18383/j.tom.2018.00026
Meijer, T. W., de Geus-Oei, L.-F., Visser, E. P., Oyen, W. J., Looijen-Salamon, M. G., Visvikis, D., et al. (2017). Tumor delineation and quantitative assessment of glucose metabolic rate within histologic subtypes of non–small cell lung cancer by using dynamic 18f fluorodeoxyglucose PET. Radiology 283, 547–559. doi: 10.1148/radiol.2016160329
Milne, E. N. (1967). Circulation of primary and metastatic pulmonary neoplasms: a postmortem microarteriographic study. Am. J. Roentgenol. 100, 603–619. doi: 10.2214/ajr.100.3.603
Milotti, E., Vyshemirsky, V., Sega, M., Stella, S., and Chignola, R. (2013). Metabolic scaling in solid tumours. Sci. Rep. 3, 1–6. doi: 10.1038/srep01938
Momcilovic, M., Jones, A., Bailey, S. T., Waldmann, C. M., Li, R., Lee, J. T., et al. (2019). In vivo imaging of mitochondrial membrane potential in non-small-cell lung cancer. Nature 575, 380–384. doi: 10.1038/s41586-019-1715-0
Montavon, G., Binder, A., Lapuschkin, S., Samek, W., and Müller, K.-R. (2019). “Layer-wise relevance propagation: an overview,” in Explainable AI: Interpreting, Explaining and Visualizing Deep Learning, eds W. Samek, G. Montavon, A. Vedaldi, L. Hansen, and K. R. Müller (Springer), 193–209. doi: 10.10007/978-3-030-28954-6_10
Mori, S., Yamaji, K., Ishida, A., Prokushkin, S. G., Masyagina, O. V., Hagihara, A., et al. (2010). Mixed-power scaling of whole-plant respiration from seedlings to giant trees. Proc. Natl. Acad. Sci. U.S.A. 107, 1447–1451. doi: 10.1073/pnas.0902554107
Murray, C. D. (1926). The physiological principle of minimum work: I. The vascular system and the cost of blood volume. Proc. Natl. Acad. Sci. U.S.A. 12:207. doi: 10.1073/pnas.12.3.207
Myatt, D., Hadlington, T., Ascoli, G., and Nasuto, S. (2012). Neuromantic – from semi-manual to semi-automatic reconstruction of neuron morphology. Front. Neuroinform. 6:4. doi: 10.3389/fninf.2012.00004
Newberry, M. G., Ennis, D. B., and Savage, V. M. (2015). Testing foundations of biological scaling theory using automated measurements of vascular networks. PLoS Comput. Biol. 11:e1004455. doi: 10.1371/journal.pcbi.1004455
Nguyen-Kim, T. D. L., Frauenfelder, T., Strobel, K., Veit-Haibach, P., and Huellner, M. W. (2015). Assessment of bronchial and pulmonary blood supply in non-small cell lung cancer subtypes using computed tomography perfusion. Investig. Radiol. 50, 179–186. doi: 10.1097/RLI.0000000000000124
Pandey, A. K., Singhi, E. K., Arroyo, J. P., Ikizler, T. A., Gould, E. R., Brown, J., et al. (2018). Mechanisms of VEGF (vascular endothelial growth factor) inhibitor–associated hypertension and vascular disease. Hypertension 71, e1–e8. doi: 10.1161/HYPERTENSIONAHA.117.10271
Pashayan, N., and Pharoah, P. D. P. (2020). The challenge of early detection in cancer. Science 368, 589–590. doi: 10.1126/science.aaz2078
Pawar, S., Dell, A. I., and Savage, V. M. (2012). Dimensionality of consumer search space drives trophic interaction strengths. Nature 486, 485–489. doi: 10.1038/nature11131
Pérez-García, V. M., Calvo, G. F., Bosque, J. J., León-Triana, O., Jiménez, J., Pérez-Beteta, J., et al. (2020). Universal scaling laws rule explosive growth in human cancers. Nat. Phys. 16, 1232–1237. doi: 10.1038/s41567-020-0978-6
Price, C. A., Weitz, J. S., Savage, V. M., Stegen, J., Clarke, A., Coomes, D. A., et al. (2012). Testing the metabolic theory of ecology. Ecol. Lett. 15, 1465–1474. doi: 10.1111/j.1461-0248.2012.01860.x
Prior, F. W., Clark, K., Commean, P., Freymann, J., Jaffe, C., Kirby, J., et al. (2013). “TCIA: an information resource to enable open science,” in Annual International Conference of the IEEE Engineering in Medicine and Biology Society, IEEE Engineering in Medicine and Biology Society (NIH Public Access), 1282, 1282–1285. doi: 10.1109/embc.2013.6609742
Rao, S. R., Shelton, S. E., and Dayton, P. A. (2016). The “fingerprint” of cancer extends beyond solid tumor boundaries: assessment with a novel ultrasound imaging approach. IEEE Trans. Biomed. Eng. 63, 1082–1086. doi: 10.1109/TBME.2015.2479590
Ribeiro, F. L., dos Santos, R. V., and Mata, A. S. (2017). Fractal dimension and universality in avascular tumor growth. Phys. Rev. E 95:042406. doi: 10.1103/PhysRevE.95.042406
Salavati, A., Duan, F., Snyder, B. S., Wei, B., Houshmand, S., Khiewvan, B., et al. (2017). Optimal FDG PET/CT volumetric parameters for risk stratification in patients with locally advanced non-small cell lung cancer: results from the ACRIN 6668/RTOG 0235 trial. Eur. J. Nuclear Med. Mol. Imaging 44, 1969–1983. doi: 10.1007/s00259-017-3753-x
Samet, R., and Yildirim, Z. (2016). “A new methodology for blood vessel segmentation on lung CT images,” in 2016 Nicograph International (NicoInt) (IEEE), 1–7. doi: 10.1109/NicoInt.2016.1
Savage, V. M., Deeds, E. J., and Fontana, W. (2008). Sizing up allometric scaling theory. PLoS Comput. Biol. 4:e1000171. doi: 10.1371/journal.pcbi.1000171
Schmidt-Nielsen, K. (1984). Scaling: Why Is Animal Size So Important? Cambridge: Cambridge University Press.
Shojaii, R., Alirezaie, J., and Babyn, P. (2005). “Automatic lung segmentation in CT images using watershed transform,” in IEEE International Conference on Image Processing 2005 (IEEE), 1270. doi: 10.1109/ICIP.2005.1530294
Singadkar, G., Mahajan, A., Thakur, M., and Talbar, S. (2018). Automatic lung segmentation for the inclusion of juxtapleural nodules and pulmonary vessels using curvature based border correction. J. King Saud Univ. Comput. Inform. Sci. 1–13. doi: 10.1016/j.jksuci.2018.07.005
Soret, M., Bacharach, S. L., and Buvat, I. (2007). Partial-volume effect in PET tumor imaging. J. Nuclear Med. 48, 932–945. doi: 10.2967/jnumed.106.035774
Strahler, A. N. (1957). Quantitative analysis of watershed geomorphology. EOS Trans. Am. Geophys. Union 38, 913–920.
Sullivan, D. C., Obuchowski, N. A., Kessler, L. G., Raunig, D. L., Gatsonis, C., Huang, E. P., et al. (2015). Metrology standards for quantitative imaging biomarkers. Radiology 277, 813–825. doi: 10.1148/radiol.2015142202
Tekin, E., Hunt, D., Newberry, M. G., and Savage, V. M. (2016). Do vascular networks branch optimally or randomly across spatial scales? PLoS Comput. Biol. 12:e1005223. doi: 10.1371/journal.pcbi.1005223
Turcotte, D., Pelletier, J., and Newman, W. (1998). Networks with side branching in biology. J. Theoret. Biol. 193, 577–592.
Valk, P. E., Delbeke, D., Bailey, D. L., Townsend, D. W., and Maisey, M. N. (2006). Positron Emission Tomography: Clinical Practice. London: Springer Science & Business Media.
Vander Heiden, M. G., Cantley, L. C., and Thompson, C. B. (2009). Understanding the warburg effect: the metabolic requirements of cell proliferation. Science 324, 1029–1033. doi: 10.1126/science.1160809
Visser, E. P., Philippens, M. E., Kienhorst, L., Kaanders, J. H., Corstens, F. H., de Geus-Oei, L.-F., et al. (2008). Comparison of tumor volumes derived from glucose metabolic rate maps and SUV maps in dynamic 18F-FDG PET. J. Nuclear Med. 49, 892–898. doi: 10.2967/jnumed.107.049585
Vogl, T. J., Shafinaderi, M., Zangos, S., Lindemayr, S., and Vatankhah, K. (2013). “Regional chemotherapy of the lung: transpulmonary chemoembolization in malignant lung tumors,” in Seminars in Interventional Radiology (Thieme Medical Publishers), 30, 176–184. doi: 10.1055/s-0033-1342959
Wang, X., Leader, J. K., Wang, R., Wilson, D., Herman, J., Yuan, J.-M., et al. (2017). Vasculature surrounding a nodule: a novel lung cancer biomarker. Lung Cancer 114, 38–43. doi: 10.1016/j.lungcan.2017.10.008
West, G. B., Brown, J. H., and Enquist, B. J. (1997). A general model for the origin of allometric scaling laws in biology. Science 276, 122–126.
West, G. B., Brown, J. H., and Enquist, B. J. (1999). A general model for the structure and allometry of plant vascular systems. Nature 400, 664–667.
West, G. B., Brown, J. H., and Enquist, B. J. (2001). A general model for ontogenetic growth. Nature 413:628. doi: 10.1038/35098076
West, G. B., Enquist, B. J., and Brown, J. H. (2009). A general quantitative theory of forest structure and dynamics. Proc. Natl. Acad. Sci. U.S.A. 106, 7040–7045. doi: 10.1073/pnas.0812294106
Wright, S. N., Kochunov, P., Mut, F., Bergamino, M., Brown, K. M., Mazziotta, J. C., et al. (2013). Digital reconstruction and morphometric analysis of human brain arterial vasculature from magnetic resonance angiography. Neuroimage 82, 170–181. doi: 10.1016/j.neuroimage.2013.05.089
Wu, C., Hormuth, D. A., Oliver, T. A., Pineda, F., Lorenzo, G., Karczmar, G. S., et al. (2020). Patient-specific characterization of breast cancer hemodynamics using image-guided computational fluid dynamics. IEEE Trans. Med. Imaging 39, 2760–2771. doi: 10.1109/TMI.2020.2975375
Yao, Y., Jumabay, M., Wang, A., and Boström, K. I. (2011). Matrix gla protein deficiency causes arteriovenous malformations in mice. J. Clin. Investig. 121:2993. doi: 10.1172/JCI57567
Yekutieli, I., and Mandelbrot, B. (1994). Horton-strahler ordering of random binary trees. J. Phys. A Math. Gen. 27:285.
Yuan, X., Zhang, J., Ao, G., Quan, C., Tian, Y., and Li, H. (2012). Lung cancer perfusion: can we measure pulmonary and bronchial circulation simultaneously? Eur. Radiol. 22, 1665–1671. doi: 10.1007/s00330-012-2414-5
Zamir, M. (2006). The Physics of Coronary Blood Flow. New York, NY: Springer Science & Business Media.
Keywords: metabolic scaling, Kleiber's law, PET-CT image analysis, quantitative imaging biomarkers, lung cancer
Citation: Brummer AB and Savage VM (2021) Cancer as a Model System for Testing Metabolic Scaling Theory. Front. Ecol. Evol. 9:691830. doi: 10.3389/fevo.2021.691830
Received: 07 April 2021; Accepted: 13 September 2021;
Published: 08 October 2021.
Edited by:
Christopher J. Whelan, Moffitt Cancer Center, United StatesReviewed by:
Caterina Guiot, University of Turin, ItalyKenneth Gage, H. Lee Moffitt Cancer Center & Research Institute, United States
Copyright © 2021 Brummer and Savage. This is an open-access article distributed under the terms of the Creative Commons Attribution License (CC BY). The use, distribution or reproduction in other forums is permitted, provided the original author(s) and the copyright owner(s) are credited and that the original publication in this journal is cited, in accordance with accepted academic practice. No use, distribution or reproduction is permitted which does not comply with these terms.
*Correspondence: Alexander B. Brummer, YWJydW1tZXJAY29oLm9yZw==