 Cathleen Petit-Cailleux1*
 Hendrik Davi1
 François Lefèvre1
 Pieter Johannes Verkerk2
 Bruno Fady1
 Marcus Lindner3
 Sylvie Oddou-Muratorio1,4
- 1UR 629 Ecologie des Forêts Méditerranéennes, INRAE, Avignon, France
- 2Bioeconomy Programme, European Forest Institute, Joensuu, Finland
- 3Resilience Programme, European Forest Institute, Bonn, Germany
- 4ECOBIOP Université de Pau et des Pays de l'Adour, E2S UPPA, INRAE, ECOBIOP, Saint-Pée-sur-Nivelle, France
General Context: Climate change can positively or negatively affect abiotic and biotic drivers of tree mortality. Process-based models integrating these climatic effects are only seldom used at species distribution scale.
Objective: The main objective of this study was to investigate the multi-causal mortality risk of five major European forest tree species across their distribution range from an ecophysiological perspective, to quantify the impact of forest management practices on this risk and to identify threats on the genetic conservation network.
Methods: We used the process-based ecophysiological model CASTANEA to simulate the mortality risk of Fagus sylvatica, Quercus petraea, Pinus sylvestris, Pinus pinaster, and Picea abies under current and future climate conditions, while considering local silviculture practices. The mortality risk was assessed by a composite risk index (CRIM) integrating the risks of carbon starvation, hydraulic failure and frost damage. We took into account extreme climatic events with the CRIMmax, computed as the maximum annual value of the CRIM.
Results: The physiological processes' contributions to CRIM differed among species: it was mainly driven by hydraulic failure for P. sylvestris and Q. petraea, by frost damage for P. abies, by carbon starvation for P. pinaster, and by a combination of hydraulic failure and frost damage for F. sylvatica. Under future climate, projections showed an increase of CRIM for P. pinaster but a decrease for P. abies, Q. petraea, and F. sylvatica, and little variation for P. sylvestris. Under the harshest future climatic scenario, forest management decreased the mean CRIM of P. sylvestris, increased it for P. abies and P. pinaster and had no major impact for the two broadleaved species. By the year 2100, 38–90% of the European network of gene conservation units are at extinction risk (CRIMmax=1), depending on the species.
Conclusions: Using a process-based ecophysiological model allowed us to disentangle the multiple drivers of tree mortality under current and future climates. Taking into account the positive effect of increased CO2 on fertilization and water use efficiency, average mortality risk may increase or decrease in the future depending on species and sites. However, under extreme climatic events, our process-based projections are as pessimistic as those obtained using bioclimatic niche models.
1. Introduction
Sustainable forest management ultimately aims to attain a balance between society's increasing demands for forest products and services, and the long-term preservation of forest health and biodiversity. However, ongoing climate and global changes pose major challenges to this balance by affecting forest ecosystem functioning (Hanewinkel et al., 2012; Verkerk et al., 2020), the composition of communities and populations, and consequently the geographic distribution of species (Lindner et al., 2014). Therefore, there is an urgent need to understand the future ecological dynamics of forest ecosystems to guide sustainable management and conservation efforts.
Climate change interacts with other global change factors such as nitrogen deposition, atmospheric CO2 concentration increase, 03 pollution, land use, and forest management. These factors may have antagonistic or partially offsetting effects on the physiological functioning of trees and the ecological dynamics of forests (Walther et al., 2002; Begon et al., 2006; Thuiller et al., 2006; Morin et al., 2008; Lindner et al., 2014; Pretzsch et al., 2014; Anderegg et al., 2015). For example, increasing atmospheric CO2 concentration can increase water use efficiency on the one hand and photosynthesis on the other hand (see Walker et al., 2021 for a synthesis). Rising temperatures can also increase the length of the growing season (i.e., the period between leaf budburst and leaf fall; Davi et al., 2006b; Keenan et al., 2014) and consequently increase tree growth and forest productivity. However, the combination of rising temperatures and decreasing summer precipitation in some regions has been associated with increasing frequency and duration of droughts. This results in a decreasing tree growth and forest productivity (Zhao and Running, 2010; Reyer et al., 2014; Reyer, 2015), increasing risks of tree mortality (Allen et al., 2010) and increasing risk of disturbances (wildfire, pests; Seidl et al., 2014, 2017). In addition, a single climatic driver can have both positive and negative effects on tree performance; this is exemplified by the role of increasing temperature on the advance of leaf phenology (Bigler and Bugmann, 2018), which is expected to increase vegetation length, but also to expose plants to higher risk of late frosts (Vitasse et al., 2014).
Correlative bioclimatic niche models (BNMs) are popular modeling tools used to predict the future risk of mortality and species distribution ranges (Urban, 2015). A major strength of BNMs is that the data needed to calibrate them (e.g., species-specific presence/absence) are available in large numbers and with increasing resolution in open-access databases (Duputié et al., 2014). However, most BNMs are not mechanistic and are usually not able to take into account the physiological response of trees to new environments (e.g., the combination of increasing CO2 concentration and increasing temperatures). Furthermore, the spatial variation in soil properties could have complex effects on species favorability, depending on the interaction between the soil-related water capacity, the climate-related water availability, and the species-specific physiological vulnerability to water stress (E Silva et al., 2012). These well-known limitations of correlative BNMs may explain the contradictory projections sometimes generated with different BNMs, as for Abies alba along the southern edge of its distribution (Mairota et al., 2013; Tinner et al., 2013).
Ecophysiological process-based models (PBMs) offer the advantage to simulate vegetation functioning in response to explicit climate and soil variability, through their impacts on plant physiology (e.g., Cramer et al., 2001; Dufrêne et al., 2005). Regarding the prediction of future tree species distribution range, comparisons of PBMs vs. BNMs showed that PBMs were generally less pessimistic (Morin and Thuiller, 2009; Cheaib et al., 2012). Ecophysiological PBMs were initially developed to simulate carbon and water fluxes in forest ecosystems, but can also be used to investigate the environmental drivers and physiological processes triggering tree mortality under climate change. For instance, they are particularly suitable to disentangle the physiological processes contributing to mortality in face of drought (McDowell et al., 2008), and the intricate roles of hydraulic failure (the loss of hydraulic conductivity resulting from xylem embolism) and carbon starvation (the depletion of carbon reserve resulting from stomata closure to avoid hydraulic failure). These same models are also able to model the phenology of plants and the dynamics of cold resistance of the organs (Leinonen, 1996).
Forest dynamics models also have a long tradition of being used to support forest management. Recently, both ecophysiological PBMs or forest dynamics models incorporating ecophysiological processes have been applied to evaluate how management and climate change may interact to influence forest dynamics (Oddou-Muratorio et al., 2020). For instance, simulations studies supported that decreasing stand density through thinning can improve the resistance of forests to climate change by decreasing the competition for water amongst the remaining stems, and can be used to inform thinning intensity and frequencies (Guillemot et al., 2014; Cabon et al., 2018). However, the consequences of management practices on forest ecophysiological functioning remain largely unknown. Hence, it is important to investigate if and how current locally prescribed management systems may mitigate the impacts of climate change on the risk of mortality.
Assessing the future physiological functioning and ecological dynamics of forest stands requires not only accounting for the multiple effects of climate change, and for their variation across tree species distribution ranges, but also for the adaptive response of tree populations and the possible effects of forest management on this response. The adaptive potential of tree populations in face of a changing environment is usually assumed to be non negligible: besides tracking their ecological niche spatially through migration, tree populations can adapt in the short-run through individual physiological tolerance, and/or in the long-run through evolutionary response to environment-induced natural selection (Benito Garzón et al., 2011; Oddou-Muratorio and Davi, 2014). Genetic diversity also represents a key resource that can be harnessed by managers for resilience (Fady et al., 2016). Existing networks of dynamic Genetic Conservation Units (GCUs) for forest trees represent a central reservoir of possible future options for adaptation of forests to climate change (Supplementary Figure 1 for the GCUs distribution by species). In Europe, this network was set up to dynamically conserve forest genetic resources by preserving the ecological and evolutionary processes contributing to the adaptive potential of tree populations to environmental variations (Koskela et al., 2012). The European transnational network of forest tree GCUs contains 3,593 GCUs, representing 4,316 tree populations (http://portal.eufgis.org/). BNM projections indicate that many GCUs may have a high risk of extirpation under climate change, thus weakening the conservation network as a whole (Schueler et al., 2014). These projections indicate that 33–65% of conservation units, mostly located in southern Europe, will be at the limit or outside the current bioclimatic niche of their constituting species by 2,100. The highest average increase in the risk of extirpation throughout the network can be expected for coniferous trees.
The assessment of tree mortality risk under different climate change scenarios at continental scale is needed to support sustainable forest management in Europe in three ways : (i) to identify at continental scales areas of higher risk of mortality and better understand the main drivers of mortality risk in these areas; (ii) to assess the impact of locally prescribed silviculture on tree mortality risk; (iii) and to characterize the level of threat across the in-situ gene conservation networks. Here, we focused on the risk of mortality associated with droughts and frosts, two major risks likely to increase in the future (Augspurger, 2013; IPCC, 2014; Charrier et al., 2018). We used the ecophysiological and biophysical PBM CASTANEA (Dufrêne et al., 2005), to simulate the risk of hydraulic failure, carbon starvation, and frost damages of five tree species representative of the main European forest biomes: Fagus sylvatica and Quercus petraea for temperate deciduous broadleaved forests; Picea abies and Pinus sylvestris for high-latitude and high-altitude evergreen conifer forests; and Pinus pinaster, for low-latitude, evergreen conifer temperate forests (Supplementary Figure 1). Using a composite risk index of mortality (CRIM), we addressed the following issues: (1) How does the risk of mortality in face of drought and frost vary among species and across species' distribution ranges? We expected CRIM differences between species to emerge from their different sensitivity to the target climatic stress, which is modeled in CASTANEA through species-specific parameters. (2) What is the impact of forest management practices on this risk? We expected the potential mitigation effect of thinning on CRIM to vary among species and among climatic scenarios. (3) Will GCUs' risk of extinction increase under future climates, and are the projections of our PBM consistent with those based on BNMs? We expected a less pessimistic prediction of mortality risks and a lower number of GCUs with a high risk of extinction.
2. Materials and Methods
2.1. CASTANEA Model
CASTANEA is an ecophysiological PBM used to simulate carbon and water fluxes in forest ecosystems (Dufrêne et al., 2005). Briefly, this model simulates the development of an average tree modeled by six functional compartments: canopy, branches, stem, coarse roots, fine roots, and reserves (an unlocated compartment corresponding to the Non-Structural Carbohydrates, NSC). The canopy is divided into five layers of leaves. Photosynthesis is hourly computed for each canopy layer using the model of Farquhar et al. (1980), analytically coupled to the stomatal conductance model proposed by Ball et al. (1987). The effect of temperature on photosynthesis is modeled using a response function of Rubisco-limited photosynthesis (Bernacchi et al., 2001). Maintenance respiration is modeled as proportional to the nitrogen content of the considered organs (Ryan, 1991). Growth respiration is computed from growth increment combined with a construction cost specific to the type of tissue (De Vries et al., 1974). Transpiration is also calculated hourly using the equations of Monteith (1965). The dynamics of Soil Water Content (SWC) is calculated daily using a three-layer bucket model. Soil drought drives stomata closure with a linear decrease when relative SWC is under 40% of field capacity (Sala and Tenhunen, 1996; Granier et al., 2000). In the carbon allocation sub-model (Davi et al., 2005; Cailleret et al., 2017), the allocation coefficients of biomass between the six compartments are daily calculated, depending on the sink force and on the phenology constraints. CASTANEA was originally developed and validated at stand scale for F. sylvatica, and then for Pinus sp. and Q. petreae (Davi et al., 2005, 2006a). The whole parameterization for the five species is detailed in Supplementary Appendix 1.
In this study, we focused on five output variables simulated by CASTANEA: (1) the Net Primary Production (NPP) and ring widths to assess the ability of the model to reproduce the bioclimatic niche, (2) the percent loss of conductivity (PLC) as an indicator of risk of hydraulic failure, (3) the NSC content as an indicator of risk of carbon starvation, and (4) the frost damage index (FD).
The CASTANEA version we used allows PLC to be computed based on daily midday water potential and species vulnerability curve to embolism (Petit-Cailleux et al., 2021; Supplementary Appendix 2). To simulate budburst, we used the UniChill model (Chuine et al., 1999) in its version described in Gauzere et al. (2017). The UniChill model is a sequential two-phases model describing the cumulative effect of chilling temperatures on bud development during the endodormancy phase (first phase) and the cumulative effect of forcing temperatures during the ecodormancy phase (second phase). We simulated damages due to frosts based on the Leinonen (1996) model. Briefly, this model evaluate the daily frost damage as:
where FH is the frost hardiness (see Supplementary Material 2) and FS the frost sensitivity (fixed here to −2).
Then FDdaily is summed over the year.
It is therefore sufficient for FDdaily to reach 1 on a single day to cause maximum annual damage. Note that we considered that trees were able to reflush after late frosts
We simulated stand mortality due to competition by using the relative density index (RDI), derived from the self-thinning rule (Reineke, 1933), as a threshold to limit stand density. RDI is classically defined as the ratio of actual stand density (N) to the maximum stand density attainable in a stand with the same average tree volume (Nmax): RDI = N/Nmax, where Nmax is defined as:
with Dg the mean quadratic diameter, a the slope and b the intercept of the self thinning equation (Charru, 2012), these specific parameters are given in the Supplementary Appendix 1.
When N>Nmax, self-thinning occurs and stand density decreases to Nmax, which directly affects the Leaf Area Index (LAI) of the canopy. Indeed, the stand leaf area index (LAIstand) is simply modeled from stand density (N), the average Leaf Mass per Area (LMAmean), and the allometric relationship between tree size (dbh) and biomass of leaves (Bleaves).
where the biomass of leaves depends on tree diameter.
Moreover, the reduction of stand density also decreases the biomass of the trunk, branches, reserves, and large roots of the average tree. All these effects (decreasing N, LAI, and biomass) were also applied where stand density is reduced by thinning (see section Management Practices below).
2.2. Climate Data and Scenarios
We considered the European area included within longitudes ranging from −11°W to 40°E and within latitudes ranging from 36°N to 66°N (continental Europe, excluding the arctic circle). CASTANEA requires the following daily climatic input variables: the minimum, mean and maximum temperatures (in °C), precipitation (mm), the wind speed (m.s−1), the mean relative humidity (%) and the global radiation (MJ.m−2). These data were derived for seven climatic scenarios (three current and four future scenarios) as detailed below (Supplementary Table 1, Supplementary Figure 2).
2.2.1. Current Climate
We used the Water and Global Change (WATCH)-Forcing-Data-ERA-Interim data set (WATCH in the following) to obtain current climate data at European scale (Weedon et al., 2014). This daily meteorological forcing dataset is available for the period 1979–2008 worldwide, with a spatial resolution of 0.5° per 0.5°. This resolution (the coarsest among the climate and soil data set) was used to divide Europe into 3,411 raster cells.
2.2.2. Future Climates
To take into account the uncertainties on future climatic scenarios (McSweeney et al., 2015), we used a combination of two daily regional circulation models (RCMs) developed under the EURO-CORDEX initiative (Jacob et al., 2014), with the past CO2 concentration data and two future scenarios of representative concentration pathways (RCPs, Moss et al., 2010). All these daily meteorological model datasets are available from 1961 to 2005 (for current climatic scenario) and from 2005 to 2098 (for future climates scenarios). We selected the EUR-11.SMHI.CNRM-CERFACS-CNRM-CM5 (CM5 in the following) as warm and wet RCM (optimistic) and EUR-11.SMHI.MOHC-HadGEM2-ES (HadGEM in the following) as warm and dry RCM (pessimistic). Regarding future RCPs, the RCP4.5 scenario considers an increase of CO2 concentration of 650 ppm with a 1.0–2.6°C increase by 2100, and corresponds to the SRES B1 scenario (Nakićenović and Swart, 2000). The RCP8.5 scenario considers an increase of CO2 concentration of 1,350 ppm CO2 with a 2.6–4.8°C increase by 2100, and corresponds to the A1F1 SRES scenario (van Vuuren et al., 2011; Harris et al., 2014; IPCC, 2014). To avoid potential biases due to differences between WATCH and EURO-CORDEX datasets, we compared the simulations run on each future EURO-CORDEX scenario to their current EURO-CORDEX reference. The two current climate datasets (CM5_hist and HadGEM_Hist) and the four future climate datasets (CM5_RCP4.5, CM5_RCP8.5, HadGEM_RCP4.5, and HadGEM_RCP8.5) were corrected for bias and downscaled using the R package “meteoland” (De Caceres et al., 2018), and considering the WATCH dataset as reference data.
2.3. Soil Data
To account for the variability of soil water capacity across Europe, we used (1) the European Soil Database to obtain data on the soil depth reached by the roots; (2) the SoilGrids 250 m database to obtain data on bulk density and clay, silt, sand and coarse fragments contents; and (3) the 3D soil hydraulic database to obtain data on soil water content at field capacity and at wilting point (Hiederer, 2013; Hengl et al., 2017; Tóth et al., 2017). All these data were aggregated from 1 × 1 km resolution to 0.5° × 0.5° (WGS84) resolution using the R package “raster” (Hijmans et al., 2015). Then, we extracted the mean value of each parameter at each grid point. A summary table of the values of the climate and soil variables is available in the Supplementary Table 1.
2.4. Management Practices
Four silvicultural systems (SS) were modeled on the basis of locally prescribed management practices inventoried in (Härkönen et al., 2019):
• SS1, “No management”: no thinning nor regeneration cuts were applied.
• SS2, “Even-aged forest management with shelter-wood”: intermediate cuts depend on tree height, stand basal area, and/or age. The last thinning is a shelter-wood cut, removing the overstory and coinciding with the recruitment of young seedlings (typically 10 years old). The age of the shelter-wood and intermediate cuts are specific of each species and each ecoregion. Trees that do not meet the criteria are not cut.
• SS3, “Even-aged forest management with clear-cut”: intermediate cuts depend on tree height, stand basal area, and/or age. After clear-cut, a new stand is planted the following year. Simulation starts when the trees reach breast height, which takes different lengths of time depending on the ecoregion and the species.
• SS4, “Short rotation”: there are no thinnings applied, and an integral final cut is done at an early age, followed by planting.
These silvicultural systems were only applied to the main target tree species, and were assumed to be constant over the simulated period. Thinning rules were adapted from Härkönen et al. (2019) and determined the reduction in stand density according to stand age, and eventually to stand height and/or basal area (Supplementary Table 2). These thinning rules varied among the five species and the four main ecoregions (North, Central East, Central West, South; Supplementary Figure 3). At each grid point, the shares of the four possible silvicultural systems was derived from Cardellini et al. (2018) (Supplementary Table 3). For some countries, the share values of silvicultural systems were not available, and computed as the average of the percentage of each silvicultural systems from the closest ecoregion to the country. Supplementary Figure 4 shows the distribution of silvicultural systems across the simulated area.
2.5. Simulation Design
We first considered three past climatic scenarios (WATCH, CM5_Hist, HadGEM_Hist) and four future climatic scenario (CM5_RCP4.5, CM5_RCP8.5, HadGEM_RCP4.5, HadGEM_RCP8.5), without management. For each species and climatic scenario, we ran one CASTANEA simulation at each of the 3,411 grid points (i.e., inside and outside the current species distribution range). At each grid point, one average, even-aged stand was simulated (hence, one average tree), with fixed soil properties. For all simulations, we considered the same average starting tree, with an initial age of 8 years and a diameter at breast height of 5 cm. All species-specific parameters are available in Supplementary Appendix 1. In total, we ran 119,385 CASTANEA simulations (5 species × 7 climates × 3,411 grid points) without management (Supplementary Table 4).
Secondly, we considered the management practices locally prescribed for each species. Additional scenarios with silviculture were simulated only at the grid points where at least another silvicultural systems than SS1 was identified (Supplementary Table 3). At each of these grid point, up to three additional CASTANEA simulations were run (if SS2, SS3, and SS4 were all locally applied), with the same conditions as above. In total 71,695 additional simulations with silviculture were run (Supplementary Table 4).
The entire set of simulated points under WATCH climate was used to evaluate model predictions (see next section). The simulated points within current observed species range were used to investigate the risk of mortality and its variation between climate and silviculture scenario (Supplementary Figure 1—shape of species distribution is obtained from http://www.euforgen.org/species/). Note that the length of the simulated period varied among current and future scenarios (30 years for WATCH, 45 years for CM5_hist, and HadGEM_Hist, and 94 years for CM5_RCP4.5, CM5_RCP8.5, HadGEM_RCP4.5, and HadGEM_RCP8.5). Moreover, the silvicultural cycle of SS2 and SS3 most often require one hundred years to be completed. To be able to check the influence of climate change and silviculture on mortality risk and not an age effect, we compare the LAI, DBH, and stand density between WATCH, historical climate, and future climate at 2050 and 2100 years.
2.6. Model Evaluation
CASTANEA has already been evaluated at stand scale for the five species (Davi et al., 2006a; Delpierre et al., 2012). We re-evaluated the model on a series of CO2 flux measurements at five sites. Three of these datasets were obtained from the FLUXNET2015 (Pastorello et al., 2020), database CZ-BK1 for P. abies; FR-LBr for P. pinaster; NL-Loo for P. sylvestris. The two others came from the ICOS dataset, FR-Hes for F. sylvatica and FR-Fon for Q. petraea, see Supplementary Appendix 3 for details.
To evaluate the validity of CASTANEA large-scale simulations, we used a similar approach as Cheaib et al. (2012) using “R” (R Development Core Team, 2013). We investigated the model's ability to predict species range based on thresholds values of NPP and ring widths (rw), below/above which the species is considered as absent/present. The optimal thresholds minimizing the difference between the predicted and observed distribution were selected using an iterative procedure and three statistics used in SDM evaluation: the Area Under the receiver operating Curve (AUC) and the True Skill Statistic (TSS), two classical statistics (Fourcade et al., 2018); and also the Boyces index (BI), another statistic recently proposed and non correlated with classical metrics (Konowalik and Nosol, 2021).
First, AUC represents the rate of true positives (fraction of presences that are actually detected) vs. the rate of false positives (fraction of absences that are incorrectly detected as presence). It is independent from the threshold value used to convert probabilities of presence per pixel into presence-absence data (Elith and Graham, 2009). An AUC-value of 1 means a perfect fit between the predicted and observed distribution; an AUC-value of 0.5 corresponds to random prediction of a species presence and an AUC-value value of 0 means that the prediction is always wrong. To calculate the AUC we used the “PresenceAbsence” package (Freeman, 2012). Second, the TSS compares the number of correct predictions, minus those attributable to random guessing, to that of a hypothetical set of perfect predictions (sensitivity plus specificity −1) and varies between −1 (poor fit) and 1 (perfect fit). TSS normalizes the overall presence-absence by the presence-absence that might have occurred by chance alone and is not influenced by the distribution size. To calculate TSS, we converted the net primary production and ring width simulated into presence-absence data by using a threshold value maximizing sensitivity and specificity as recommended by Liu et al. (2013). Finally, the BI only requires presences and measures how much model predictions differ from random distribution of the observed presences across the prediction gradients (Boyce et al., 2002). It varies between −1 and +1. Positive values indicate that the model's predictions are consistent with the distribution of presences, values close to zero mean that the model is not different from a random model, negative values indicate counter predictions, i.e., poor ability to predict areas where presences are more frequent (Hirzel et al., 2006). We used the “ecospat” package to calculate the BI (Broennimann et al., 2021).
Finally, we also evaluated the effects of CO2 enrichment under future climate of the main output variables simulated by CASTANEA. To quantify and standardize CO2 effects across variables and varying ranges of [CO2] (Walker et al., 2021) proposed a relativized β factor:
where Ya and Ye are the values of any response variable at lower CO2 concentration (CO2,a) and higher CO2 concentration (CO2,e), respectively.
We computed the beta growth primary production (βGPP), βWUE, and βBG simulated by CASTANEA for F. sylvatica, using simulations between 1975 and 2005 under the HadGEM_Hist scenario (ambient CO2) on the one hand, and between 2070 and 2098 under the HadGEM_RCP8.5 scenario (elevated CO2) on the other hand. Then, we compared these simulated values to the observations compiled in Walker et al. (2021).
2.7. Computation of the Risk of Mortality
Note that we did not directly simulate mortality due to drought and frost damage with CASTANEA because the thresholds in PLC, NSC, and FD triggering mortality are unknown. Instead, to evaluate the risk of mortality, and compare it between scenarios and species, we computed the relative values of three CASTANEA output variables over all the simulated period, as in Petit-Cailleux et al. (2021).
First, the relative percent loss of conductivity (rPLC) was computed as a proxy of the risk of mortality due to hydraulic failure:
where PLCmean is the mean of yearly PLC-values over the simulated period, and PLCspecies threshold is the species-specific PLC-value above which mortality occurs (88% for deciduous and 50% for coniferous species; Brodribb, 2009; Urli et al., 2013). Hence, rPLC varied between 0 and 1, and increased with the risk of hydraulic failure.
Because rPLC is computed from the mean PLC value over the simulated period, it is expected to buffer the effect of extreme climate events such as intense drought. To overcome this limitation, we also computed rPLCmax by considering instead the maximum PLC-value over the simulated period (i.e., replacing PLCmean by PLCmax in Equation 3).
Second, the relative non-structural carbohydrate content (rNSC) was computed as a proxy of the risk of mortality due to carbon starvation:
where NSCfrac n is the average fraction of NSC biomass over the biomass of all the other compartments at a given year n, and NSCspecies threshold the threshold in NSC-value above which mortality through carbon starvation is unlikely. NSCspecies threshold was arbitrarily set at the CASTANEA initial NSC concentration value (gC.) that corresponds to the average measured value for each considered species (see references in Supplementary Appendix 1). Hence rNSC varied from 0 to 1, increasing values indicating an increasing risk of carbon starvation.
We also computed rNSCmax considering instead the minimum NSC-value over the simulated period (i.e., replacing NSCmean by NSCmin in Equation 4). Taking the average measured NSC value as a threshold value below which starvation risk occurs may seem too severe, but in reality, when carbon starvation occurs, the NSC drop quickly and we verified that the choice of the threshold had little impact.
Thirdly, the level of frost damage (rFD) was computed as a proxy of the risk of mortality due to frosts. The FDyearly index described in equation (2) is already relative and varies from 0 to 1, increasing values indicating an increasing risk of frost damage. rFD was thus computed as the mean of FDyearly values over the simulation period, and rFDmax as the maximal FD value over the simulation period.
Note that for scenarios with silviculture, there were possibly up to four simulations, and hence four values of PLC, NSC, or FD at a given grid point. In these cases, we computed a ratio taking into account the share of each silvicultural systems j at each grid point i:
where shareij is the share of each silvicultural system j at grid point i, and N is the number of different silvicultural systems at point i. The different PLC, NSC, or FD values for each silvicultural system j were weighed by Ratioij.
Finally, we computed a composite risk index of mortality (CRIM) combining rPLC, rFD, and rNSC with an identical weight. Annual CRIM values were computed as:
The mean CRIM value was then averaged across the simulated period. CRIM can vary between 0 (minimal risk of mortality) and 1 (maximal risk of mortality) and CRIMn=1 as soon as either rFDmax, rPLC or rNSC = 1. A similar CRIMmax value was calculated by combining rPLCmax, CRIMmax, and rFDmax.
3. Results
3.1. Model Evaluation
We obtained a high, positive correlation of GPP, the net ecosystem exchange and ecosystem respiration between measures and simulations for broadleaved species and P. sylvestris (r ≥ 0.74; Supplementary Appendix 3.2). For P. abies and P. pinaster, the correlation between measures and observations was high for GPP and the ecosystem respiration, but low for net ecosystem exchange.
We determined a species-specific threshold for ring widths and NPP-values maximizing the agreement between observed and predicted distributions for the TSS calculation. The current distribution ranges of broadleaved species were predicted with high TSS-values, high AUC-values and high BI-values; for F. sylvatica (TSS ≥ 0.62, AUC ≥ 0.86, and BI ≥ 0.94); and for Q. petraea (TSS ≥ 0.69, AUC ≥ 0.92, and BI = 1; Table 1). By contrast, the distribution ranges of coniferous species were poorly predicted: for P. abies TSS ≤ 0.15, AUC ≤ 0.56, and BI ≤ −0.03; and for P. sylvestris TSS ≤ 0.07, AUC ≤ 0.61 and with a negative correlation according to BI ≤ −0.31. For P. pinaster, the evaluation is contrasted between indices, with a poor TSS ≤ 0.32 and AUC ≤ 0.64, but a rather good prediction according to BI ≥ 0.64.
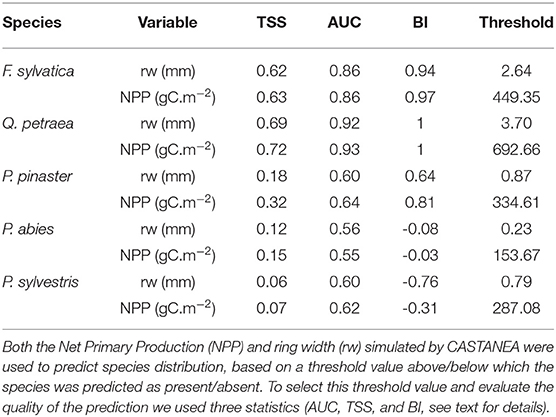
Table 1. Model evaluation based on the prediction of species distribution.
CASTANEA simulated a strong positive effect of increased CO2 on Gross Primary Production (GPP), Water Use Efficiency (WUE), and biomass growth (BG). for F. sylvatica between HadGEM_Hist and HadGEM_RCP8.5 scenario. Simulated βGPP was 0.71; βWUE was 0.64 and βBG reached 0.91.
3.2. Variations of the Risk of Mortality Over Species Realized Range Under Current Climate
Under the WATCH climatic scenario, the mean CRIM simulated from 1979 to 2008 was 0.13 for F. sylvatica, 0.25 for Q. petraea, 0.25 for P. pinaster, 0.28 for P. abies, and 0.34 for P. sylvestris, within their respective realized niche (Figure 1, Supplementary Table 5). For broadleaved species, the highest CRIM-values occurred in the eastern Mediterranean region, in mountainous areas and in the eastern part of their distribution. For P. abies and P. sylvestris, the highest CRIM-values occurred in the northern and eastern parts of their distribution. For P. pinaster, the highest CRIM-values occurred in the southern part of its distribution. When considering CRIMmax to better account for the effect of extreme climatic events on the risk of mortality, mean CRIMmax values were much higher for all species: 0.69 for P. pinaster, 0.48 for F. sylvatica, 0.83 for P. abies, 0.72 for Q. petraea, and 0.84 for P. sylvestris (Figure 2, Supplementary Table 5). The spatial variations of CRIMmax-values were similar to that of CRIM-values, except that high CRIMmax values were also observed at the southern part of P. abies and P. sylvestris distributions (Figure 2).
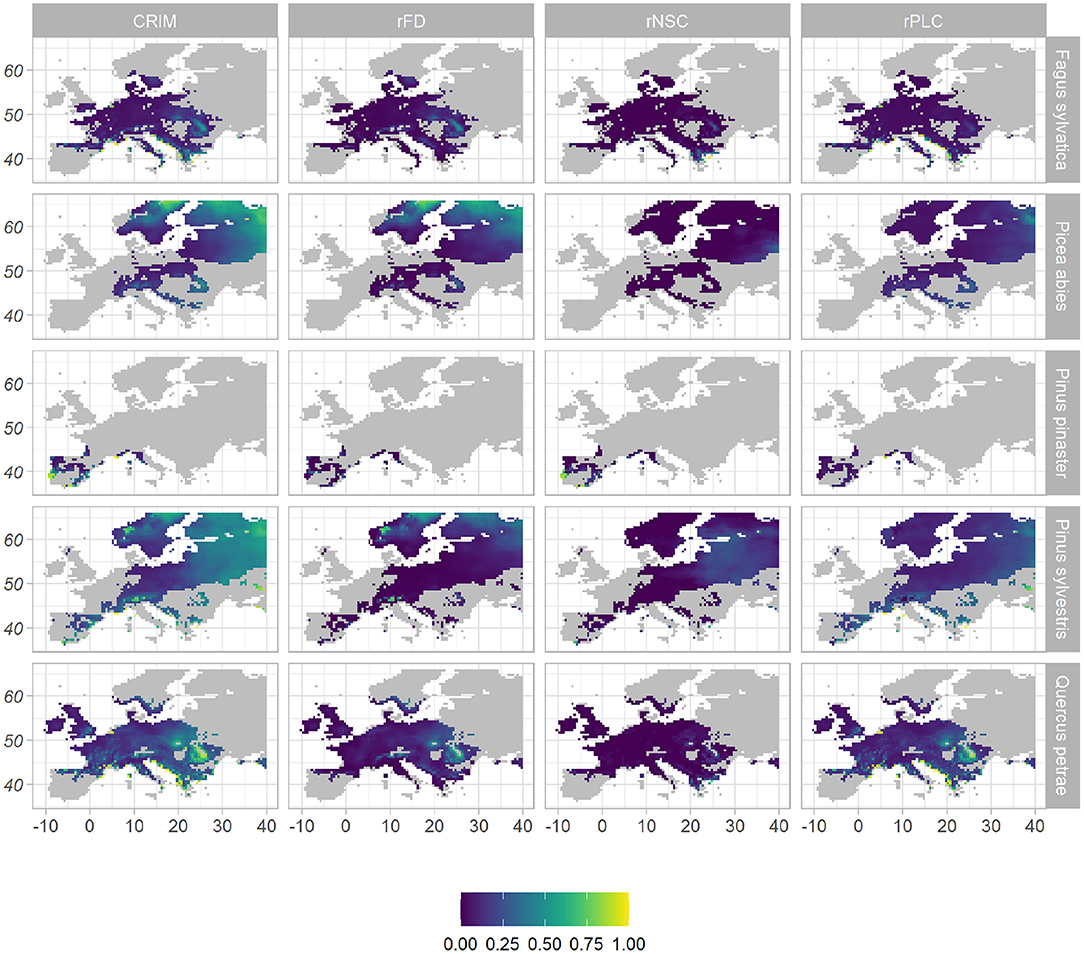
Figure 1. Spatial distribution of mean values of mortality risk indices under WATCH current climate, across species' distribution range. The composite risk index of mortality (CRIM), given in the first column, is the combination of the three indices displayed on the other columns: the frost damage index (rFD) as a proxy of the risk of mortality due to frost; the relative non-structural carbohydrate content (rNSC) as a proxy of the risk of carbon starvation; the relative percent loss of conductivity (rPLC) as a proxy of the risk of hydraulic failure. All indices vary from 0 (purple, low risk) to 1 (yellow, high risk).
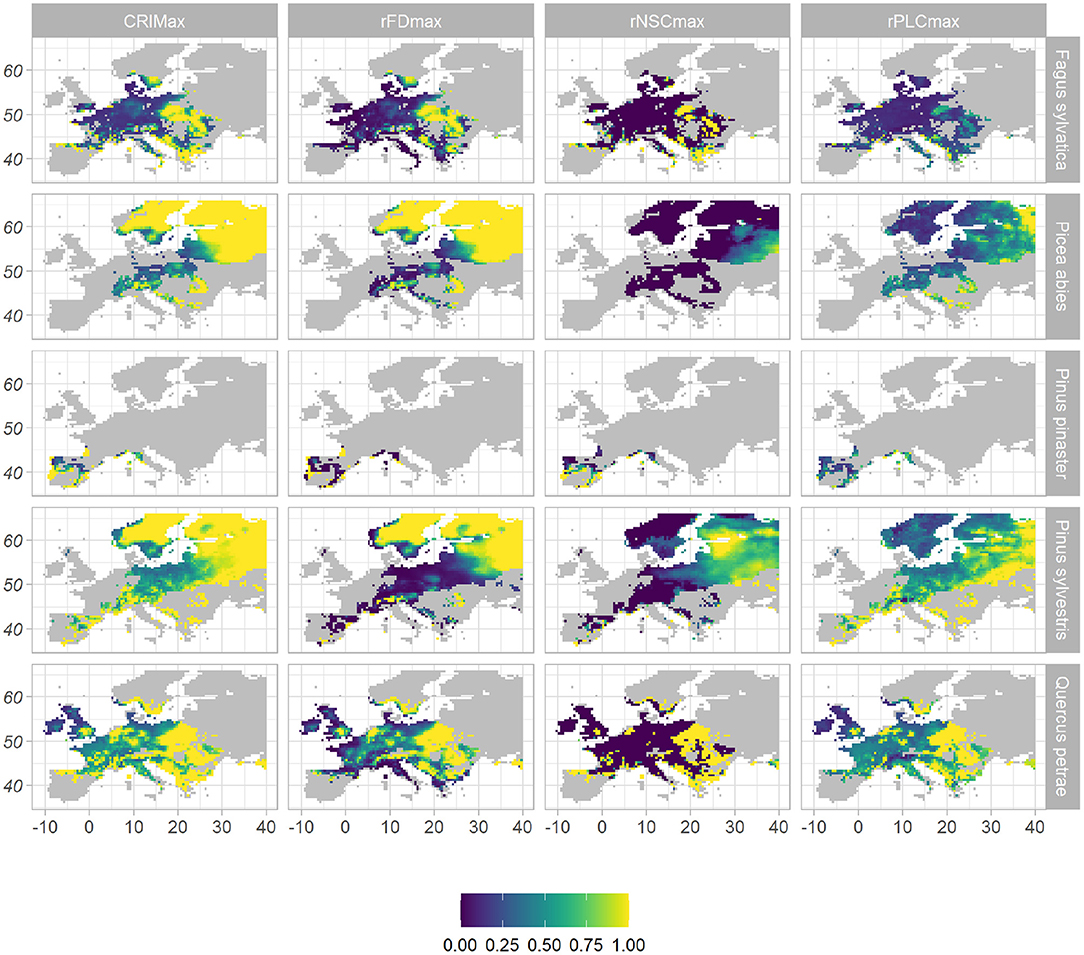
Figure 2. Spatial distribution of maximum values of mortality risk indices under WATCH current climate, across species' distribution range. The risk index of mortality (CRIMmax), given in the first column, is the combination of the three indices displayed on the other columns: the frost damage index (rFDmax) as a proxy of the risk of mortality due to frost; the relative non-structural carbohydrate content (rNSCmax) as a proxy of the risk of carbon starvation; the relative percent loss of conductivity (rPLCmax) as a proxy of the risk of hydraulic failure. All indices vary from 0 (purple, low risk) to 1 (yellow, high risk).
The processes contributing to the risk index of mortality varied among species and spatially (Figures 1, 2, Supplementary Table 5). For Q. petraea and P. sylvestris, CRIM was mostly driven by the risk of hydraulic failure (rPLC = 0.18 for both species), and CRIMmax by both the risk of hydraulic failure (rPLCmax = 0.6 and 0.63, respectively) and frost damage (rFDmax = 0.52 and 0.57, respectively). The highest rPLC-values occurred in the Mediterranean region and in Eastern Europe for these two species (Figures 1, 2). For P. abies, the risk of frost damage drove both the CRIM-value (rFD = 0.19) and the CRIMmax-value (rFDmax = 0.76). The highest rFD-values occurred in Northern and Eastern Europe for this species. For P. pinaster, the risk of carbon starvation drove the CRIM-value (rNSC = 0.13), while the three risks contributed equally to CRIMmax. For this species, the highest rNSC-values occurred along the coastline. Finally for F. sylvatica, CRIM was driven both the risk of hydraulic failure (rPLC = 0.07) and late frost (rFD = 0.05), while the three risks contributed equally to CRIMmax (CRIMmax = 0.21, rPLCmax = 0.23, and rFDmax = 0.30). For a given risk, the highest values did not occur in the same place for different species. For instance, for broadleaved species, the highest rFD-values mainly occurred at high altitudes (Meseta, Alps, Carpathian mountains), while for the coniferous species, the highest high rFD-values occurred in northern Europe. For a given species, the contributions of the physiological processes to the risk of mortality varied across its range. For instance considering CRIMmax and Q. petraea, in the eastern continental part of the range all three risks were high, in the Alps the risk of frost was predominant, in Northern Europe (Finland) the risks of hydraulic failure and frost damage were the highest, while in the Southern part of the range (Iberian peninsula) the risk of carbon starvation was predominant.
3.3. Evolution of the Risk of Mortality Between Current and Future Climates
The variation of the risk of mortality (estimated by CRIM and CRIMmax) between current (CM5hist and HadGEM_hist) and future (CM5_RCP4.5, CM5_RCP8.5, HadGEM_RCP4.5, HadGEM_RCP8.5) climatic scenarios differed between species (Figures 3, 4, Supplementary Figure 5). In average over all pairwise comparisons, the risk of mortality increased for P. pinaster (mean Δ CRIM = 0.10; mean Δ CRIMmax = 0.17), and this was mainly due to increasing risks of frost damage (mean Δ rFD = 0.04; mean Δ rFDmax = 0.40) and carbon starvation (mean Δ rNSC = 0.04; mean Δ CRIMmax = 0.08). By contrast, the risk of mortality markedly decreased in the future for F. sylvatica (mean Δ CRIM = −0.13; mean Δ CRIMmax = −0.17), Q. petraea (mean Δ CRIM = −0.21; mean Δ CRIMmax = −0.07), and P. abies (mean Δ CRIM = −0.17; mean Δ CRIMmax = −0.01). This decrease was due to decreasing risks of frost damage (e.g., for Q. petraea; mean Δ rFD = mean; Δ rFDmax = −0.06) and hydraulic failure (e.g., for Q. petraea, mean Δ rPLC = mean Δ rPLCDmax = −0.08). Finally, the variation of the risk of mortality was negligible for P. sylvestris (mean Δ CRIM = 0.01; mean Δ CRIMmax = 0.2). Note however that the risk of carbon starvation due to extreme climatic events increased for all species (from Δ rNSCmax = 0.07 for Q. petraea to Δ rNSCmax = 0.35 for P. abies). Spatial variations in Δ CRIM and Δ CRIMmax are shown on Supplementary Figure 14.
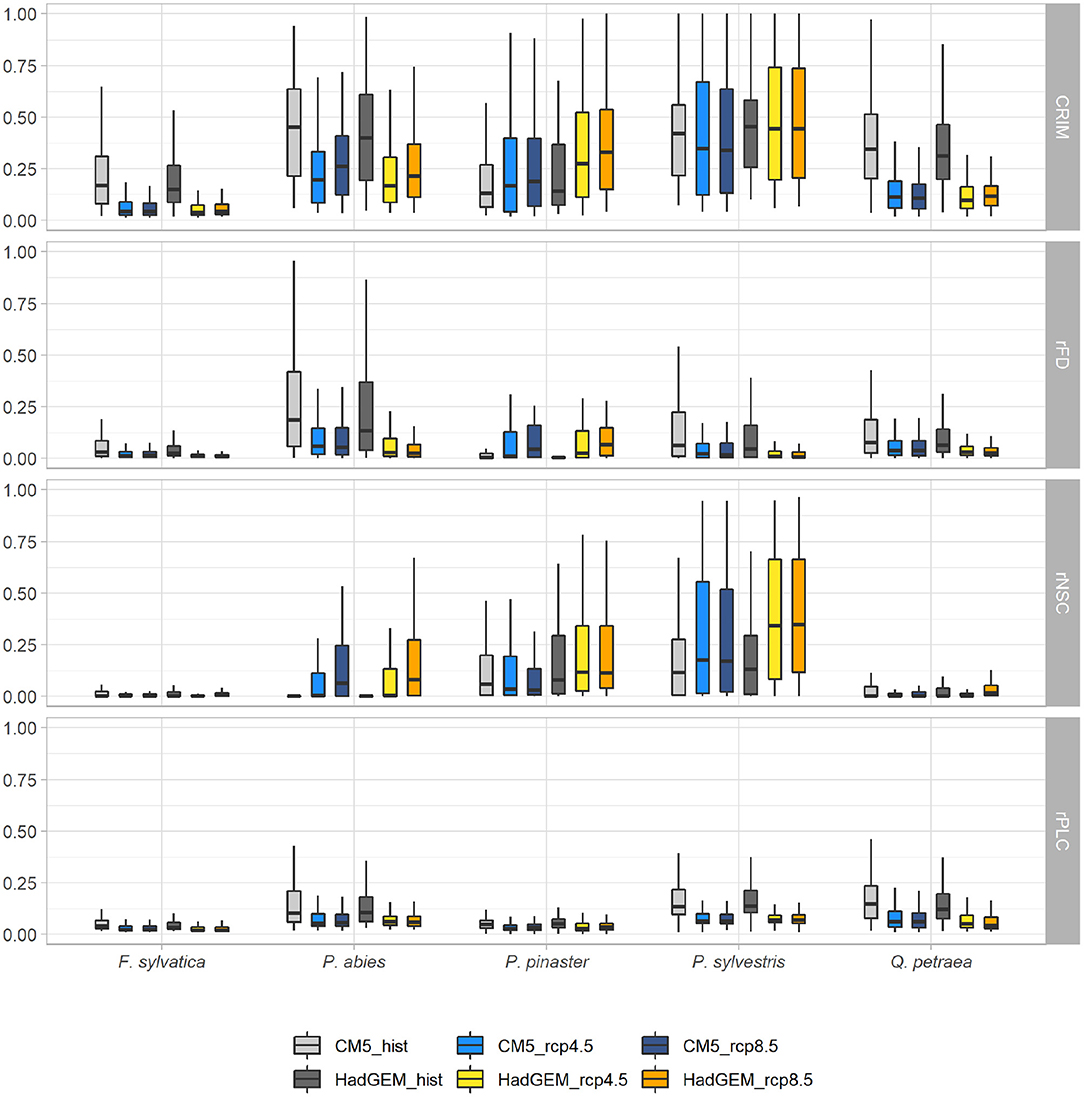
Figure 3. Variation of the mean values of mortality risk indices (CRIM, rFDmax, rNSC, and rPLC) under two current and four future climatic scenarios. Each whisker box represents the distribution of risk indices values across the simulated range (with the median as the horizontal line, the interquartile range as the box, and the minimal and maximal values at the ends of the vertical lines). Each future climatic scenario (in blue for the CM5 RCM and in orange for the HadGEM RCM) can be compared to their historical reference (in light and dark gray for the CM5 and HadGEM RCMs, respectively). Simulations were run without management (SS1).
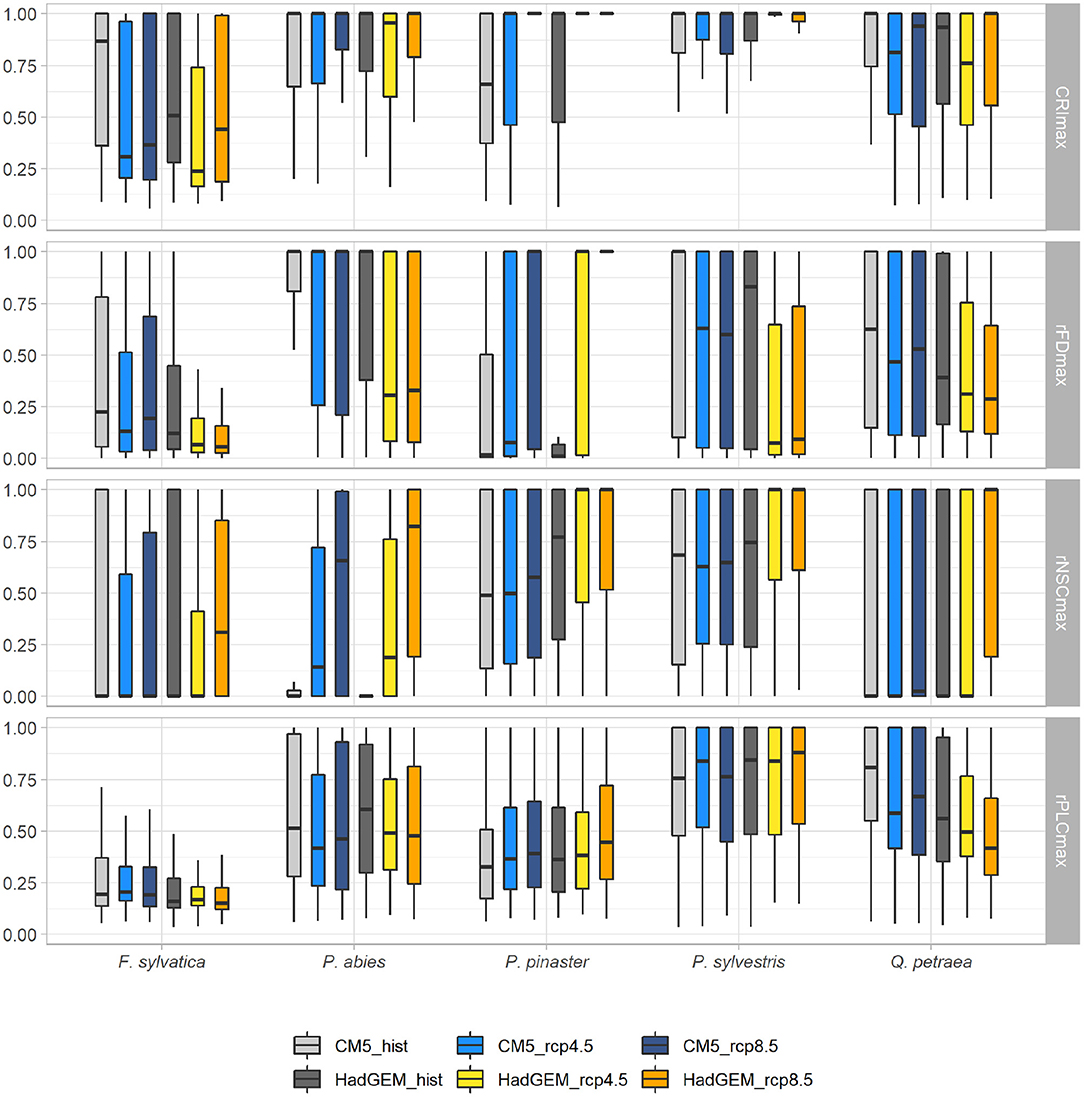
Figure 4. Variation of the mean values of mortality risk indices (CRIMmax, rFDmax, rNSCmax, and rPLCmax) under two current and four future climatic scenarios. Each future climatic scenario (in blue for the CM5 RCM and in orange for the HadGEM RCM) can be compared to their historical reference (in light and dark gray for the CM5 and HadGEM RCMs, respectively). Simulations were run without management (SS1). See legend of Figure 3 for whisker boxes.
The maximum value of CRIMmax = 1 was reached in many locations particularly for all conifers (Figures 2, 4). The risk of mortality estimated with both CRIM and CRIMmax tended to be lower for the “optimistic” CM5 RCM compared to the “pessimistic” HadGEM RCM for the coniferous species. For all species except P. abies, the CRIM-values were similar for the RCP 4.5 and RCP 8.5 scenarios whereas, for all species, CRIMmax tended to be higher for the RCP 8.5 scenarios (Figure 4).
To verify whether the observed changes in risks between present and future climatic scenarios could be due to the shorter simulation period for the present climatic scenario (45 years) than for the future (94 years), we also analyzed the mortality risk under future climate at the 2050 date (i.e., over a 45-year period): for each climate change scenario, the risks predicted at this intermediate date did not differ in any major way from those based on the entire simulation period (Supplementary Table 5, Supplementary Figures 6–9). Mean DBH slightly increased and tree density slightly decreased in 2050, and these changes were much more pronounced in 2100 for broadleaved species only (Supplementary Figures 10, 11).
3.4. Effect of Silviculture on the Risk of Mortality
In average, silviculture had contrasting effects on the risk of mortality under current climate depending on the species (Figure 5, Supplementary Table 5). Under HadGEM current climate, CRIM and CRIMmax decreased by 0.02 and 0.01, respectively for P. sylvestris between scenario SS1 (no sylviculture) and scenarios mixing SS1–SS4 (with silviculture). This decrease was driven by a decreased risk of carbon starvation (Δ rNSC = −0.12; Δ rNSCmax= −0.13), despite an increased risk of hydraulic failure. However, CRIM and CRIMmax increased by 0.05 and 0.04, respectively for P. abies. Silviculture had no effect on the risk of mortality for P. pinaster, F. sylvatica, and Q. petraea (Figure 5, Supplementary Table 5). Under current climatic conditions, the local impacts of management practices on the different risks were globally uniform and low all over species' range, except for P. sylvestris in which case silviculture tends to reduce the risk of carbon starvation in the north-eastern part of the range, i.e., precisely where this risk is higher (Supplementary Figure 12).
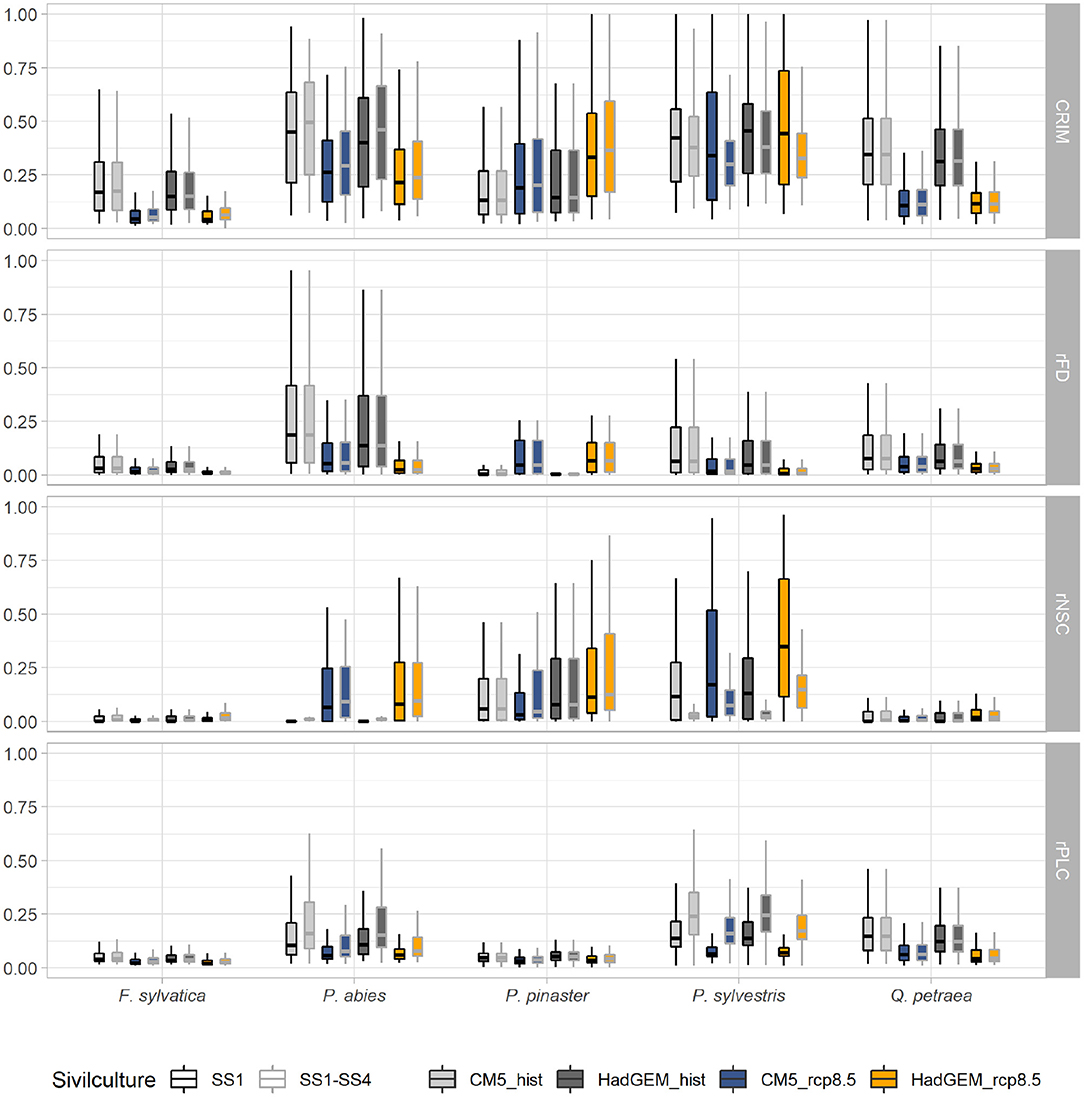
Figure 5. Variation of the mean values of mortality risk indices (CRIM, rFDmax, rNSC, and rPLC) under two current (CM5-hist in light gray and HadGEM-hist in dark gray) and two future (CM5-8.5 in blue and HadGEM-8.5 in orange) climatic scenarios. Each scenario with locally prescribed silviculture (i.e., four possible silvicultural systems) is represented with gray whisker box contouring, and can be compared to its reference without management (i.e., SS1), with black contouring. See legend of Figure 3 for whisker boxes.
Applying today's silviculture rules under future climatic scenario resulted in increasing CRIM-values as compared to the baseline scenario without silviculture (hist) for P. abies (mean Δ CRIM = 0.04) and P. pinaster (mean Δ CRIM = 0.03). This increase in CRIM was mostly driven by increasing risk of hydraulic failure (mean Δ rPLC = 0.03 and 0.01 for P. abies and P.pinaster, respectively) and carbon starvation (mean Δ rNSC = 0.01 and 0.04 for P. abies and P. pinaster, respectively). By contrast, silviculture was always associated to decreasing CRIM and rNSC-values for P. sylvestris (mean Δ CRIM = 0.10 and mean Δ rNSC = −0.22). However, CRIMmax-values increased for all species, including P. sylvestris, between scenarios without vs. with silviculture under future climates (mean Δ CRIMmax = 0.05 over the five species). This increase in CRIMmax was mostly driven by increasing risk of carbon starvation (mean Δ CRIMmax = 0.15 over the five species) (Figure 6, Supplementary Table 5). These changes in CRIMmax were associated to changes in tree density and LAI. In average, silviculture (SS1–SS4) was associated to lower LAI and density per hectare in P.abies and P.sylvestris. Silviculture was associated to lower LAI only for F. sylvatica and to lower density per hectare only for P. pinaster, while it has no effect on LAI and density per hectare of Q. petraea (Supplementary Figures 11, 13, 14).
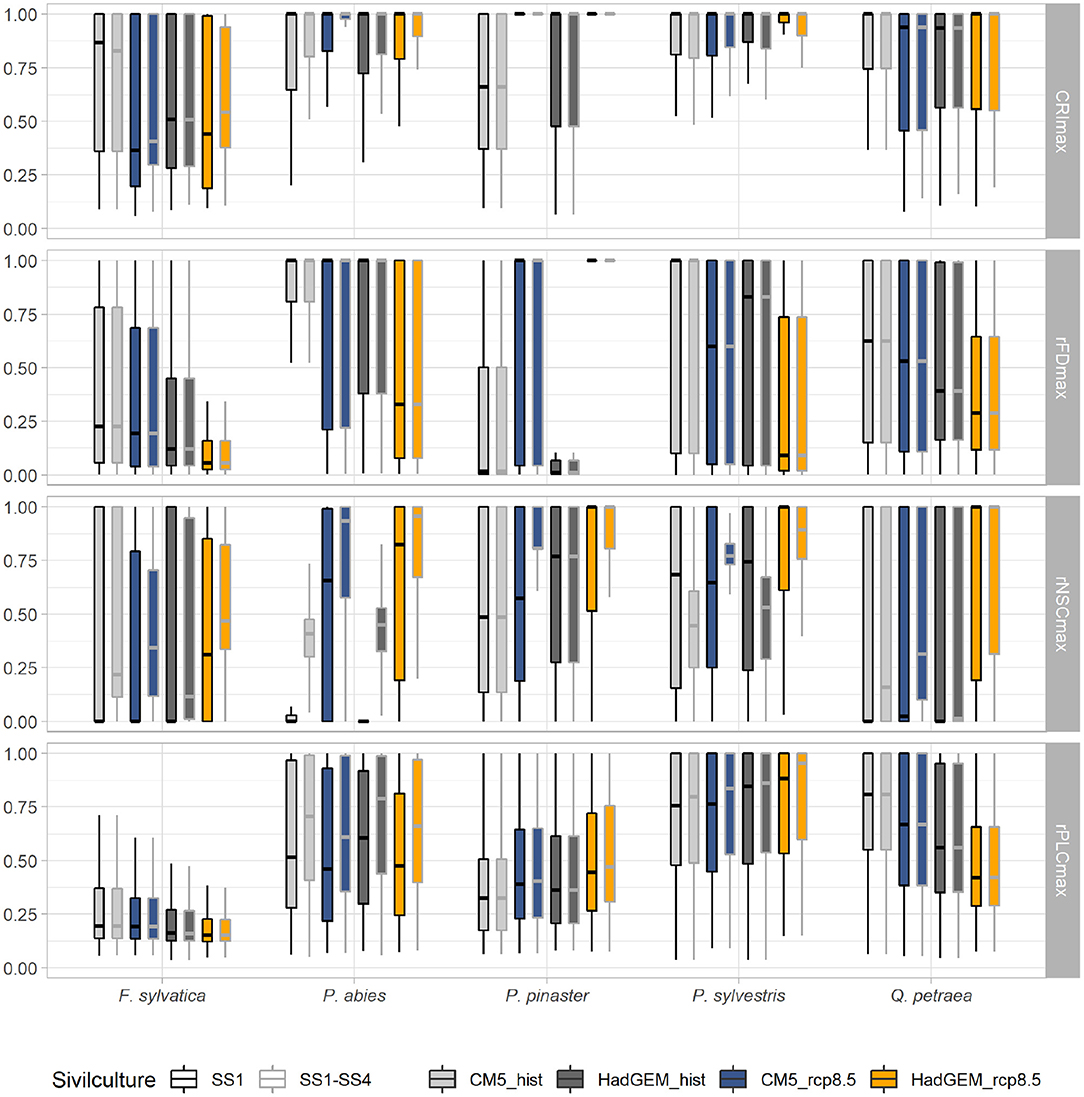
Figure 6. Variation of the mean values of mortality risk indices (CRIMmax, rFDmax, CRIMmax, and rPLCmax) under two current (CM5-hist in light gray and HadGEM-hist in dark gray) and two future (CM5-8.5 in blue and HadGEM-8.5 in orange) climatic scenarios. Each scenario with locally prescribed silviculture (i.e., four possible silvicultural systems) is represented with gray whisker box contouring, and can be compared to its reference without management (i.e., SS1), with black contouring. See legend of Figure 3 for whisker boxes.
3.5. The Risk of GCU's Extirpation
We used the value of CRIMmax = 1, i.e., predicted occurrence of mortality of the simulated stand during a period of time, as a criterion of threat of extinction. Under the most severe climate change scenario (HadGEM_rcp8.5), from 38% (F. sylvatica) to 90% (P. pinaster) of the GCUs are at threat of extinction in 2100 assuming that they are not managed, and these values are slightly higher if we assume they are managed following the current local silvicultural practices (Table 2), from 40% (F. sylvatica) to 98% (P. pinaster) in this case. The evolution of the index of mortality risk (CRIMmax) between current and 2100, under the harshest climate change scenario (HadGEM_rcp8.5), is highly variable among species: for F. sylvatica the risk will increase in 19% and decrease in 60% of the GCUs, whereas for P. pinaster the risk will increase in 48% and decrease in 2% of the GCUs (Table 2).
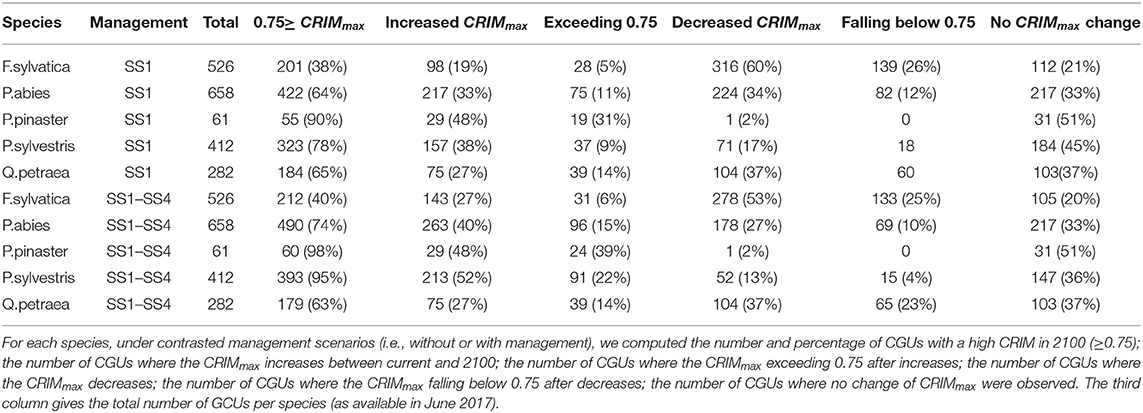
Table 2. Variation of GCU extirpation threat between species under HadGEM RCP 8.5 future climatic scenario.
4. Discussion
In this study, we used the process-based model CASTANEA to simulate spatial and temporal variation in mortality risks due to hydraulic failure, carbon starvation and frost damage. These risks were assessed in five major European tree species across their distribution range, as a function of variations in climate, soil properties and management practices. We focused on the risk of mortality associated with droughts and frosts (winter, spring, and fall frosts with varying frost resistance across season), two major risks likely to increase in the future (Augspurger, 2013; IPCC, 2014; Charrier et al., 2018).
4.1. The Impacts of Drought and Frost Vary Between Species and Across Distribution Range
Considering the current climate, our results show that the physiological processes driving the risk of mortality differ among species. Carbon starvation drives the mean mortality risk (CRIM) for P. pinaster; frost damage drives the CRIM for P. abies; hydraulic failure drives the CRIM for Q. petraea and P. sylvestris; and a combination of hydraulic failure and frost damage drives the CRIM for F. sylvatica. When considering extreme climatic events with CRIMmax, the risk is higher and the contributions of the three focal physiological processes are more balanced. The rank of simulated species-specific risks of hydraulic failure or frost damage were not necessarily those expected from physiological or phenological observations. Indeed, deciduous broadleaves have a narrower safety margin for hydraulic failure as compared to evergreen conifers (Choat et al., 2012; Martin-StPaul et al., 2017). Late-leafing species such as P. abies have a higher safety margin for frost damage as compared to early-leafing species (Bigler and Bugmann, 2018). The low contribution of carbon starvation to the mean risk index is consistent with current ecophysiological knowledge (Martínez-Vilalta et al., 2016). However, the fact that simulations are initiated with small trees (diameter 5 cm) probably contribute to explain this result. Simulations run with bigger and older trees on average may show higher carbon starvation risk. We also find that the physiological processes driving the risk of mortality vary across species distribution ranges. The highest risk of hydraulic failure is found under Mediterranean and continental climates in Eastern Europe, associated to long and severe droughts, which is consistent with other studies based on PBMs or cSDMs (Gárate-Escamilla et al., 2019). As expected, the places the most vulnerable to frosts are located at high latitude and altitude.
Secondly, our results highlight that the evolution of mortality risk under future climate by 2100 differs between species. CRIM markedly decreases for broadleaved species and P. abies, and slightly decreases for P. sylvestris. This decrease is driven by decreasing risks of hydraulic failure and frost damage, which compensates for the increasing risk of carbon starvation for coniferous species. Broadleaved species remain at a low risk of carbon starvation under future climate, which can be due to their higher stomatal sensitivity to CO2. Indeed, Klein and Ramon (2019) showed that conifers will need as much water as they currently do to complete their photosynthesis under future climate, while angiosperms will need less water for the same amount of CO2 to complete their photosynthetic cycles. In contrast, for P. pinaster, the CRIM increases due to increasing risk of frost damage and carbon starvation. For the broadleaved species and P. abies, our model predicts a marked reduction of CRIM between current climatic conditions and future RCP 4.5 scenario, but not so much changes between RCP 4.5 and RCP 8.5 scenarios. This singular pattern suggests a non linear beneficial effect of CO2 which compensates for the other harmful effects of climate change.
The evolution of mortality risk under future climate by 2100 also differs through space. Overall, for coniferous species, the risk of carbon starvation increases everywhere except in areas where it was already high and in mountainous areas. The risk of frost damage decreases or remains stable in most of Europe, which may be due to less severe winters; however it increases for P. pinaster in the Iberian Peninsula, likely due to earlier budburst and late frost in this area (Vitasse et al., 2014). The risk of hydraulic failure tends to decrease slightly throughout Europe between the current and future climate, except in a few patches mainly due to soil characteristics.
4.2. The Impact of Current Management Practices on the Risk of Mortality Under Current and Future Climate Varies Between Species
In our simulations, considering the current management practices has an ambivalent effect on the risk of mortality. Under current climate conditions, local forest management practices decrease in average the mean risk of mortality (CRIM) for P. sylvestris, slightly increase it for P. abies and has no impact on the other species. Under future climate conditions, the same local forest management practices still decrease the CRIM for P. sylvestris, slightly increase it for P. abies and P. pinaster and has no impact for the other species. Moreover, for all species, silviculture increases the risk of mortality due to carbon starvation when considering extreme drought events (rNSCmax).
Our results are thus at odds with previous studies showing that forest thinning could mitigate drought impacts (Elkin et al., 2015; Sohn et al., 2016). The simulated management practices reduce the average density of forest stands in coniferous species. This leads to a decrease of the average tree biomass and thereby its respiration. But the leaf area index (LAI) and thus the photosynthesis are also reduced by thinning. Hence, the effect of management practices on the risk of carbon starvation simulated by CASTANEA depends on the respective effects of forest thinning on respiration on the one hand, and photosynthesis on the other hand. For P. sylvestris this effect is always stronger on respiration and therefore management practices decreases the carbon starvation risk under current and future climates. But for P. abies and P. pinaster, management practices have the opposite effect in the future and increase the risk of carbon starvation.
The leaf area index decrease should also mitigate the risk of hydraulic failure by decreasing evapotranspiration (in average by 6% in our simulations, see Supplementary Table 5). That is why the increase in rPLC with silviculture for some species is quite unexpected. In these cases, the decrease in leaf area index is greater than the decrease in transpiration (data not shown), because leaf area index is quite high. The leaf midday water potential that determines the risk of cavitation is not calculated from the total tree transpiration, but from the transpiration per m2 of leaf. Physiologically, the higher the flux at leaf level, the greater the risk of cavitation. When the canopy is dense there are more leaves and therefore the flux is distributed over more surface, which explains why in these cases, rPLC is finally lower without silviculture.
This study is among the first attempts to simulate the large-scale effects of management practices with an ecophysiological PBM (see also Härkönen et al., 2019). Our simulations suggest that the impact of silviculture on the risk of mortality might not be so obvious and depend on species, the sites and the climatic scenarios considered. In particular for broadleaved species, the impacts of silviculture on the risks of mortality are uniformly low over species' distribution range. To improve these predictions, future simulations should take into account the variations in age and size class distribution at initialization.
4.3. The Threat of GCU Extirpation Under Climate Change Differs Among Species
Under the harshest climate change scenario, our projections of mortality risk in the five in situ conservation networks predict that 38–90% of the GCUs are at threat of extinction in 2100, depending on the species. These PBM-based projections are more pessismistic than earlier BNM-based projections predicting that 33–65% of the GCUs will be at the limit or outside their current climatic niche (Schueler et al., 2014). This unexpected contrast between PBM and BNM predictions has two main explanations. First, in contrast to Schueler et al. (2014) assumption that 95% of the species' current climatic niche is considered to be riskless, our CRIMmax predictions indicate that most of the CGUs are already in a high mortality risk zone under current climate. This is consistent with the policy of choosing some GCUs located in areas that are already experiencing climate-related selection pressures. There are few GCUs (from 5 to 31%) shifting from low CRIMmax (<0.75) in the current climate to high CRIMmax in the future climate (>0.75); by contrast, 12–51% of CGUs shift from high CRIMmax to low CRIMmax. Secondly, and contrasting with the line of previous studies (Morin and Thuiller, 2009; Cheaib et al., 2012), we used the maximal and not the mean risk index of mortality to predict the threat of GCU extirpation. We considered spatio-temporal patterns of mean CRIM variation useful to disentangle how hydraulic failure, carbon starvation and frost damage respectively contribute to the risk of mortality; however, we argue that realistic predictions of the extirpation threat should rather account for extreme climatic events triggering maximal physiological risks of mortality. Doing so, we may overestimate this threat. In particular, because of the coarse spatial resolution of our simulation grid (0.5 × 0.5°), the local climates at actual CGUs location may differ from the average climate at the grid point.
Our projections also show that traditional management systems would not help to reduce the mortality risk in those areas, and that risk reduction would require other specifically dedicated management practices. Our PBM approach lies on the pessimistic side of the projections because it does not account neither for the within-stand diversity of the response to climate, which is a factor of resilience of the populations facing disturbance since not all trees are equally threatened at the same time, nor for the evolutionary potential of each forest stand, which is a factor of adaptation from one generation of trees to the next. However, in the harshest situations, silvicultural interventions and natural evolution might not be sufficient to conserve the local population in situ, and ex situ conservation strategies, either dynamic or static, should be considered.
The EUFORGEN program has developed an operational decision support tool for the management of GCU based on demographic, genetic and disturbance indicators that can be measured by different verifiers, and recommended actions depending on the levels of these indicators (Rudow et al., 2020). A combined index of mortality risk such as CRIMmax could be used as a verifier to inform the risk of population loss.
4.4. Future Direction for PBM Improvements
The growth and NPP simulated with CASTANEA across the whole Europe (i.e., potential niche) under current climate were consistent with the realized distribution range of broadleaved species, but less so for coniferous species. Three hypotheses might explain why NPP variations may less correctly predict the realized distribution of coniferous species: (1) their distribution is rather determined by biotic interactions and management practices rather than by climate and soil conditions; (2) the coarse climatic grid does not correctly represent local climate conditions in mountainous areas where P. sylvestris and P. abies are located; (3) the realized distribution is not limited by survival at adult stage, but by reproduction or survival at seedling stages (Niinemets and Valladares, 2006). In addition, for P. abies, in the comparison with the CO2 flux measurements, we may underestimate the GPP if the average value of Vcmax used for the simulations and obtained from the literature underestimate photosynthesis (Walker et al., 2014), which can lead to too low values especially at the northern and eastern boundaries. The large-scale validation of CASTANEA needs to be improved for some species to better predict mortality. Two approaches, out of the scope of the current study, can be used. The first approach would be to simulate mortality at stand scale and compare it with mortality observations at European scale, as done in Petit-Cailleux et al. (2021) at local scale. A second one would be to compare NPP simulated with those measured from satellite data. These two approaches would additionally require to account for the variations in age and size classes for forest stand across the simulated area.
CASTANEA simulated a strong positive effect of increased CO2 on Gross Primary Production (GPP), Water Use Efficiency (WUE) and biomass growth (BG). The simulated βGPP is close to average value obtained across FACE experiments (βGPP = 0.73, 11 sites, 45 species). The simulated βWUE is a bit lower than the observed increase in ecosystem-scale plant WUE from Duke and ORNL FACE experiments (0.76 and 1.1, respectively). Finally, the simulated βBG is higher than the estimated βBG (between 0.49 and 0.56) from FACE experiments (Walker et al., 2021). However, CASTANEA does not take into account the possible acclimation of photosynthesis to rising CO2 concentration and temperatures neither that of respiration to rising temperatures and water stress. Yet, in C3 plants, the maximum carboxylation rate and the maximum rate of electron transport were significantly reduced at elevated CO2 (Ainsworth and Rogers, 2007). Most species can also shift their thermal optimum of photosynthesis upward in response to warming (Crous, 2019). Similarly, temperature acclimation of respiration involves a change in respiratory capacity and/or the sensitivity of respiration rate to temperature (Atkin et al., 2008). These acclimation processes would need to be accounted for in future simulation studies.
We also only partially accounted for interspecific variability in thresholds to mortality (e.g., the PLC value leading to mortality differed among broadleaved and conifer trees), and not at all for intra-specific variability in vulnerability. Yet, local adaptation is widespread in tree populations throughout their distribution ranges (Benito Garzón et al., 2011; Alberto et al., 2013). For example, Anderegg et al. (2016) demonstrated a genetic differentiation of xylem resistance traits in several species. For F. sylvatica, Kreyling et al. (2014) found genetic differentiation of frost resistance parameters, particularly in marginal populations. These patterns of intra-specific variability and differentiation of adaptive traits involved in response to drought and frost would be interesting to consider in future simulations.
Data Availability Statement
The datasets presented in this study can be found in online repositories at: doi: 10.5281/zenodo.5160130.
Author Contributions
SO-M, HD, FL, and BF initiated the study. SO-M, ML, and PV reviewed the silvicultural management across Europe. CP-C, HD, and SO-M upgraded and ran the PBM. CP-C, SO-M, and FL created the post processing method. CP-C drafted the manuscript. All authors contributed to its improvement and approved its final version.
Funding
This project received funding from the European Union's Horizon 2020 research and innovation program under Grant Agreement No. 676876 (GenTree) and No. 862221 (Forgenius).
Conflict of Interest
The authors declare that the research was conducted in the absence of any commercial or financial relationships that could be construed as a potential conflict of interest.
Publisher's Note
All claims expressed in this article are solely those of the authors and do not necessarily represent those of their affiliated organizations, or those of the publisher, the editors and the reviewers. Any product that may be evaluated in this article, or claim that may be made by its manufacturer, is not guaranteed or endorsed by the publisher.
Acknowledgments
This work was based on the Capsis platform, http://www.inra.fr/capsis, and we thank François de Coligny for his help. We thank Marta Benito-Garzon, François Pimont and Valentin Journé for useful discussion that helped improving the manuscript. The data set FLUXNET2015 allowed us to validate the model. Parametrization of the model have benefit from the request 6015 (Modeling vulnerability of European trees under climate change) to the TRY database from 2019-04-02.
Supplementary Material
The Supplementary Material for this article can be found online at: https://www.frontiersin.org/articles/10.3389/fevo.2021.706414/full#supplementary-material
References
Ainsworth, E. A., and Rogers, A. (2007). The response of photosynthesis and stomatal conductance to rising [CO2]: mechanisms and environmental interactions. Plant Cell Environ. 30, 258–270. doi: 10.1111/j.1365-3040.2007.01641.x
Alberto, F. J., Aitken, S. N., Alia, R., Gonzalez-Martinez, S. C., Hanninen, H., Kremer, A., et al. (2013). Potential for evolutionary responses to climate change - evidence from tree populations. Glob. Change Biol. 19, 1645–1661. doi: 10.1111/gcb.12181
Allen, C. D., Macalady, A. K., Chenchouni, H., Bachelet, D., McDowell, N., Vennetier, M., et al. (2010). A global overview of drought and heat-induced tree mortality reveals emerging climate change risks for forests. For. Ecol. Manage. 259, 660–684. doi: 10.1016/j.foreco.2009.09.001
Anderegg, W. R., Hicke, J. A., Fisher, R. A., Allen, C. D., Aukema, J., Bentz, B., et al. (2015). Tree mortality from drought, insects, and their interactions in a changing climate. New Phytol. 208, 674–683. doi: 10.1111/nph.13477
Anderegg, W. R., Klein, T., Bartlett, M., Sack, L., Pellegrini, A. F., Choat, B., et al. (2016). Meta-analysis reveals that hydraulic traits explain cross-species patterns of drought-induced tree mortality across the globe. Proc. Natl. Acad. Sci. U.S.A. 113, 5024–5029. doi: 10.1073/pnas.1525678113
Atkin, O. K., Atkinson, L. J., Fisher, R. A., Campbell, C. D., Zaragoza-Castells, J., Pitchford, J. W., et al. (2008). Using temperature-dependent changes in leaf scaling relationships to quantitatively account for thermal acclimation of respiration in a coupled global climate-vegetation model. Glob. Change Biol. 14, 2709–2726. doi: 10.1111/j.1365-2486.2008.01664.x
Augspurger, C. K. (2013). Reconstructing patterns of temperature, phenology, and frost damage over 124 years: spring damage risk is increasing. Ecology 94, 41–50. doi: 10.1890/12-0200.1
Ball, J. T., Woodrow, I. E., and Berry, J. A. (1987). “A model predicting stomatal conductance and its contribution to the control of photosynthesis under different environmental conditions,” in Progress in Photosynthesis Research (Stanford, CA: Department of Plant Biology; Springer), 221–224.
Begon, M., Townsend, C. R., and Harper, J. L. (2006). Ecology: From Individuals to Ecosystems Hoboken, NJ.
Benito Garzón, M., Alía, R., Robson, T. M., and Zavala, M. A. (2011). Intra-specific variability and plasticity influence potential tree species distributions under climate change. Glob. Ecol. Biogeogr. 20, 766–778. doi: 10.1111/j.1466-8238.2010.00646.x
Bernacchi, C. J., Singsaas, E. L., Pimentel, C., Portis, A. R. Jr, and Long, S. P. (2001). Improved temperature response functions for models of Rubisco-limited photosynthesis. Plant Cell Environ. 24, 253–259. doi: 10.1111/j.1365-3040.2001.00668.x
Bigler, C., and Bugmann, H. (2018). Climate-induced shifts in leaf unfolding and frost risk of European trees and shrubs. Sci. Rep. 8, 1–10. doi: 10.1038/s41598-018-27893-1
Boyce, M. S., Vernier, P. R., Nielsen, S. E., and Schmiegelow, F. K. (2002). Evaluating resource selection functions. Ecol. Model. 157, 281–300. doi: 10.1016/S0304-3800(02)00200-4
Brodribb, T. J. (2009). Xylem hydraulic physiology: the functional backbone of terrestrial plant productivity. Plant Sci. 177, 245–251. doi: 10.1016/j.plantsci.2009.06.001
Broennimann, O., Di Cola, V., and Guisan, A. (2021). ecospat: Spatial Ecology Miscellaneous Methods. R Package Version 3.2.
Cabon, A., Mouillot, F., Lempereur, M., Ourcival, J.-M., Simioni, G., and Limousin, J.-M. (2018). Thinning increases tree growth by delaying drought-induced growth cessation in a Mediterranean evergreen oak coppice. For. Ecol. Manage. 409, 333–342. doi: 10.1016/j.foreco.2017.11.030
Cailleret, M., Jansen, S., Robert, E. M., Desoto, L., Aakala, T., Antos, J. A., et al. (2017). A synthesis of radial growth patterns preceding tree mortality. Glob. Change Biol. 23, 1675–1690. doi: 10.1111/gcb.13535
Cardellini, G., Valada, T., Cornillier, C., Vial, E., Dragoi, M., Goudiaby, V., et al. (2018). EFO-LCI: a new life cycle inventory database of forestry operations in Europe. Environ. Manage. 61, 1031–1047. doi: 10.1007/s00267-018-1024-7
Charrier, G., Chuine, I., Bonhomme, M., and Améglio, T. (2018). Assessing frost damages using dynamic models in walnut trees: exposure rather than vulnerability controls frost risks. Plant Cell Environ. 41, 1008–1021. doi: 10.1111/pce.12935
Charru, M. (2012). La productivité forestiére dans un environnement changeant: caractérisation multi-échelle de ses variations récentes á partir des données de l'Inventaire Forestier National (IFN) et interprétation environnementale (Ph.D. thesis), Agroparistech, Paris, France.
Cheaib, A., Badeau, V., Boe, J., Chuine, I., Delire, C., Dufrêne, E., et al. (2012). Climate change impacts on tree ranges: model intercomparison facilitates understanding and quantification of uncertainty. Ecol. Lett. 15, 533–544. doi: 10.1111/j.1461-0248.2012.01764.x
Choat, B., Jansen, S., Brodribb, T. J., Cochard, H., Delzon, S., Bhaskar, R., et al. (2012). Global convergence in the vulnerability of forests to drought. Nature 491, 752–755. doi: 10.1038/nature11688
Chuine, I., Cour, P., and Rousseau, D. D. (1999). Selecting models to predict the timing of flowering of temperate trees: implications for tree phenology modelling. Plant Cell Environ. 22, 1–13. doi: 10.1046/j.1365-3040.1999.00395.x
Cramer, W., Bondeau, A., Woodward, F. I., Prentice, I. C., Betts, R. A., Brovkin, V., et al. (2001). Global response of terrestrial ecosystem structure and function to CO2 and climate change: Results from six dynamic global vegetation models. Glob. Change Biol. 7, 357–373. doi: 10.1046/j.1365-2486.2001.00383.x
Crous, K. Y. (2019). Plant responses to climate warming: physiological adjustments and implications for plant functioning in a future, warmer world. Am. J. Bot. 106, 1049–1051. doi: 10.1002/ajb2.1329
Davi, H., Bouriaud, O., Dufrêne, E., Soudani, K., Pontailler, J. Y., le Maire, G., et al. (2006a). Effect of aggregating spatial parameters on modelling forest carbon and water fluxes. Agric. For. Meteorol. 139, 269–287. doi: 10.1016/j.agrformet.2006.07.007
Davi, H., Dufrêne, E., Francois, C., Le Maire, G., Loustau, D., Bosc, A., et al. (2006b). Sensitivity of water and carbon fluxes to climate changes from 1960 to 2100 in European forest ecosystems. Agric. For. Meteorol. 141, 35–56. doi: 10.1016/j.agrformet.2006.09.003
Davi, H., Dufrêne, E., Granier, A., Le Dantec, V., Barbaroux, C., François, C., et al. (2005). Modelling carbon and water cycles in a beech forest. Part II: validation of the main processes from organ to stand scale. Ecol. Model. 185, 387–405. doi: 10.1016/j.ecolmodel.2005.01.003
De Caceres, M., Martin-StPaul, N., Turco, M., Cabon, A., and Granda, V. (2018). Estimating daily meteorological data and downscaling climate models over landscapes. Environ. Model. Softw. 108, 186–196. doi: 10.1016/j.envsoft.2018.08.003
De Vries, F. W., Brunsting, A. H., and Van Laar, H. H. (1974). Products, requirements and efficiency of biosynthesis a quantitative approach. J. Theor. Biol. 45, 339–377. doi: 10.1016/0022-5193(74)90119-2
Delpierre, N., Soudani, K., François, C., Le Maire, G., Bernhofer, C., Kutsch, W., et al. (2012). Quantifying the influence of climate and biological drivers on the interannual variability of carbon exchanges in European forests through process-based modelling. Agric. For. Meteorol. 154–155, 99–112. doi: 10.1016/j.agrformet.2011.10.010
Dufrêne, E., Davi, H., François, C., Le Maire, G., Le Dantec, V., and Granier, A. (2005). Modelling carbon and water cycles in a beech forest. Part I: model description and uncertainty analysis on modelled NEE. Ecol. Model. 185, 407–436. doi: 10.1016/j.ecolmodel.2005.01.004
Duputié, A., Zimmermann, N. E., and Chuine, I. (2014). Where are the wild things? Why we need better data on species distribution. Glob. Ecol. Biogeogr. 23, 457–467. doi: 10.1111/geb.12118
E Silva, D., Rezende Mazzella, P., Legay, M., Corcket, E., and Dupouey, J. L. (2012). Does natural regeneration determine the limit of European beech distribution under climatic stress? For. Ecol. Manage. 266, 263–272. doi: 10.1016/j.foreco.2011.11.031
Elith, J., and Graham, C. H. (2009). Do they? How do they? WHY do they differ? On finding reasons for differing performances of species distribution models. Ecography 32, 66–77. doi: 10.1111/j.1600-0587.2008.05505.x
Elkin, C., Giuggiola, A., Rigling, A., and Bugmann, H. (2015). Short- and long-term efficacy of forest thinning to mitigate drought impacts in mountain forests in the European Alps. Ecol. Appl. 25, 1083–1098. doi: 10.1890/14-0690.1
Fady, B., Cottrell, J., Ackzell, L., Alía, R., Muys, B., Prada, A., et al. (2016). Forests and global change: what can genetics contribute to the major forest management and policy challenges of the twenty-first century? Region. Environ. Change 16, 927–939. doi: 10.1007/s10113-015-0843-9
Farquhar, G. D., von Caemmerer, S., and Berry, J. A. (1980). A biochemical model of photosynthetic CO2 assimilation in leaves of C3 species. Planta 149, 78–90. doi: 10.1007/BF00386231
Fourcade, Y., Besnard, A. G., and Secondi, J. (2018). Paintings predict the distribution of species, or the challenge of selecting environmental predictors and evaluation statistics. Glob. Ecol. Biogeogr. 27, 245–256. doi: 10.1111/geb.12684
Gárate-Escamilla, H., Hampe, A., Vizcaíno-Palomar, N., Robson, T. M., and Benito Garzón, M. (2019). Range-wide variation in local adaptation and phenotypic plasticity of fitness-related traits in Fagus sylvatica and their implications under climate change. Glob. Ecol. Biogeogr. 28, 1336–1350. doi: 10.1111/geb.12936
Gauzere, J., Delzon, S., Davi, H., Bonhomme, M., Garcia de Cortazar-Atauri, I., and Chuine, I. (2017). Integrating interactive effects of chilling and photoperiod in phenological process-based models. A case study with two European tree species: Fagus sylvatica and Quercus petraea. Agric. For. Meteorol. 244–245, 9–20. doi: 10.1016/j.agrformet.2017.05.011
Granier, A., Biron, P., and Lemoine, D. (2000). Water balance, transpiration and canopy conductance in two beech stands. Agric. For. Meteorol. 100, 291–308. doi: 10.1016/S0168-1923(99)00151-3
Guillemot, J., Delpierre, N., Vallet, P., François, C., Martin-StPaul, N. K., Soudani, K., et al. (2014). Assessing the effects of management on forest growth across France: insights from a new functional-structural model. Ann. Bot. 114, 779–793. doi: 10.1093/aob/mcu059
Hanewinkel, M., Cullmann, D., Schelhaas, M.-J., Nabuurs, G.-J., and Zimmermann, N. (2012). Climate change may cause severe loss in the economic value of European forest land. Nat. Clim. Change 3, 203–207. doi: 10.1038/nclimate1687
Härkönen, S., Neumann, M., Mues, V., Berninger, F., Bronisz, K., Cardellini, G., et al. (2019). A climate-sensitive forest model for assessing impacts of forest management in Europe. Environ. Model. Softw. 115, 128–143. doi: 10.1016/j.envsoft.2019.02.009
Harris, R. M. B., Grose, M. R., Lee, G., Bindoff, N. L., Porfirio, L. L., and Fox-Hughes, P. (2014). Climate projections for ecologists. Wiley Interdisc. Rev. 5, 621–637. doi: 10.1002/wcc.291
Hengl, T., De Jesus, J. M., Heuvelink, G. B., Gonzalez, M. R., Kilibarda, M., Blagotić, A., et al. (2017). SoilGrids250m: global gridded soil information based on machine learning. PLoS ONE 12:e0169748. doi: 10.1371/journal.pone.0169748
Hiederer, R. (2013). Mapping Soil Typologies-Spatial Decision Support Applied to the European Soil Database. Publications Office of the European Union.
Hijmans, R. J., Mattiuzzi, M., Sumner, M., Greenberg, J. A., Bevan, A., and Shortridge, A. (2015). Geographic Data Analysis and Modeling. R CRAN Project.
Hirzel, A. H., Le Lay, G., Helfer, V., Randin, C., and Guisan, A. (2006). Evaluating the ability of habitat suitability models to predict species presences. Ecol. Model. 199, 142–152. doi: 10.1016/j.ecolmodel.2006.05.017
IPCC (2014). “Climate Change 2014: climate change impacts, adaptation and vulnerablility,” in Working Group II contribution to the Intergovernmental Panel on Climate Change Fifth Assessment Report. Summary for Policymakers, Vol. 2. IPCC.
Jacob, D., Petersen, J., Eggert, B., Alias, A., Christensen, O. B., Bouwer, L. M., et al. (2014). EURO-CORDEX: New high-resolution climate change projections for European impact research. Region. Environ. Change 14, 563–578. doi: 10.1007/s10113-013-0499-2
Keenan, T. F., Gray, J., Friedl, M. A., Toomey, M., Bohrer, G., Hollinger, D. Y., et al. (2014). Net carbon uptake has increased through warming-induced changes in temperate forest phenology. Nat. Clim. Change 4, 598–604. doi: 10.1038/nclimate2253
Klein, T., and Ramon, U. (2019). Stomatal sensitivity to CO2 diverges between angiosperm and gymnosperm tree species. Funct. Ecol. 33, 1411–1424. doi: 10.1111/1365-2435.13379
Konowalik, K., and Nosol, A. (2021). Evaluation metrics and validation of presence-only species distribution models based on distributional maps with varying coverage. Sci. Rep. 11, 1–15. doi: 10.1038/s41598-020-80062-1
Koskela, J, Lefevre, F, Schueler, S, Kraigher, H, Olrik, D.C, and Hubert, J.. (2012). Translating conservation genetics into management: Pan-European minimum requirements for dynamic conservation units of forest tree genetic diversity. Biol. Conserv. 157, 39–49. doi: 10.1016/j.biocon.2012.07.023
Kreyling, J., Buhk, C., Backhaus, S., Hallinger, M., Huber, G., Huber, L., et al. (2014). Local adaptations to frost in marginal and central populations of the dominant forest tree Fagus sylvatica L. as affected by temperature and extreme drought in common garden experiments. Ecol. Evol. 4, 594–605. doi: 10.1002/ece3.971
Leinonen, I. (1996). A simulation model for the annual frost hardiness and freeze damage of scots pine. Ann. Bot. 78, 687–693. doi: 10.1006/anbo.1996.0178
Lindner, M., Fitzgerald, J. B., Zimmermann, N. E., Reyer, C., Delzon, S., van der Maaten, E., et al. (2014). Climate change and European forests: what do we know, what are the uncertainties, and what are the implications for forest management? J. Environ. Manage. 146, 69–83. doi: 10.1016/j.jenvman.2014.07.030
Liu, C., White, M., and Newell, G. (2013). Selecting thresholds for the prediction of species occurrence with presence-only data. J. Biogeogr. 40, 778–789. doi: 10.1111/jbi.12058
Mairota, P., Cafarelli, B., Boccaccio, L., Leronni, V., Labadessa, R., Kosmidou, V., et al. (2013). Using landscape structure to develop quantitative baselines for protected area monitoring. Ecol. Indic. 33, 82–95. doi: 10.1016/j.ecolind.2012.08.017
Martínez-Vilalta, J., Sala, A., Asensio, D., Galiano, L., Hoch, G., Palacio, S., et al. (2016). Dynamics of non-structural carbohydrates in terrestrial plants: a global synthesis. Ecol. Monogr. 86, 495–516. doi: 10.1002/ecm.1231
Martin-StPaul, N., Delzon, S., and Cochard, H. (2017). Plant resistance to drought depends on timely stomatal closure. Ecol. Lett. 20, 1437–1447. doi: 10.1111/ele.12851
McDowell, N., Pockman, W. T., Allen, C. D., Breshears, D. D., Cobb, N., Kolb, T., et al. (2008). Mechanisms of plant survival and mortality during drought: why do some plants survive while others succumb to drought? New Phytol. 178, 719–739. doi: 10.1111/j.1469-8137.2008.02436.x
McSweeney, C. F., Jones, R. G., Lee, R. W., and Rowell, D. P. (2015). Selecting CMIP5 GCMs for downscaling over multiple regions. Clim. Dyn. 44, 3237–3260. doi: 10.1007/s00382-014-2418-8
Monteith, J. L. (1965). “Evaporation and environment. The state and movement of water in living organisms,” in Symposium of the Society of Experimental Biology, Vol. 19 (Cambridge), 205–234.
Morin, X., and Thuiller, W. (2009). Comparing niche- and process-based models to reduce prediction uncertainty in species range shifts under climate change. Ecology 90, 1301–1313. doi: 10.1890/08-0134.1
Morin, X., Viner, D., and Chuine, I. (2008). Tree species range shifts at a continental scale: new predictive insights from a process-based model. J. Ecol. 96, 784–794. doi: 10.1111/j.1365-2745.2008.01369.x
Moss, R. H., Edmonds, J. A., Hibbard, K. A., Manning, M. R., Rose, S. K., van Vuuren, D. P., et al. (2010). The next generation of scenarios for climate change research and assessment. Nature 463, 747–756. doi: 10.1038/nature08823
Nakićenović, N., and Swart, R. (2000). Special Report on Emission Scenarios. Cambridge: Cambridge University Press.
Niinemets, U., and Valladares, F. (2006). Tolerance to shade, drought, and waterlogging of temperate northern hemisphere trees and shrubs. Ecol. Monogr. 76, 521–547. doi: 10.1890/0012-9615(2006)076[0521:TTSDAW]2.0.CO;2
Oddou-Muratorio, S., and Davi, H. (2014). Simulating local adaptation to climate of forest trees with a Physio-Demo-Genetics model. Evol. Appl. 7, 453–467. doi: 10.1111/eva.12143
Oddou-Muratorio, S., Davi, H., and Lefévre, F. (2020). Integrating evolutionary, demographic and ecophysiological processes to predict the adaptive dynamics of forest tree populations under global change. Tree Genet. Genomes 16, 1–22. doi: 10.1007/s11295-020-01451-1
Pastorello, G., Trotta, C., Canfora, E., Chu, H., Christianson, D., Cheah, Y.-W., et al. (2020). The fluxnet2015 dataset and the oneflux processing pipeline for eddy covariance data. Sci. Data 7, 1–27. doi: 10.1038/s41597-020-0534-3
Petit-Cailleux, C., Davi, H., Lefévre, F., Garrigue, J., Magdalou, J.-A., Hurson, C., et al. (2021). Comparing statistical and mechanistic models to identify the drivers of mortality within a rear-edge beech population. bioRxiv 31. doi: 10.1101/645747
Pretzsch, H., Biber, P., Schütze, G., Uhl, E., and Rötzer, T. (2014). Forest stand growth dynamics in Central Europe have accelerated since 1870. Nat. Commun. 5:4967. doi: 10.1038/ncomms5967
R Development Core Team (2013). A Language and Environment for Statistical Computing. R Development Core Team.
Reineke, L. H. (1933). Perfecting a stand-density index for even-aged forests. J. Agric. Res. 46, 627–638.
Reyer, C. (2015). Forest productivity under environmental change-a review of stand-scale modeling studies. Curr. For. Rep. 1, 53–68. doi: 10.1007/s40725-015-0009-5
Reyer, C., Lasch-Born, P., Suckow, F., Gutsch, M., Murawski, A., and Pilz, T. (2014). Projections of regional changes in forest net primary productivity for different tree species in Europe driven by climate change and carbon dioxide. Ann. For. Sci. 71, 211–225. doi: 10.1007/s13595-013-0306-8
Rudow, A., Westergren, M., Biteveld, J., Buriánek, V., Cengel, B., Cottrell, J., et al. (2020). Decision Support Tool for the Management of Dynamic Geneticconservation Units. Technical report, ETH Zürich.
Ryan, M. G. (1991). Effects of climate change on plant respiration. Ecol. Appl. 1, 157–167. doi: 10.2307/1941808
Sala, A., and Tenhunen, J. D. (1996). Simulations of canopy net photosynthesis and transpiration in Quercus ilex L. under the influence of seasonal drought. Agric. For. Meteorol. 78, 203–222. doi: 10.1016/0168-1923(95)02250-3
Schueler, S., Falk, W., Koskela, J., Lefévre, F., Bozzano, M., Hubert, J., et al. (2014). Vulnerability of dynamic genetic conservation units of forest trees in Europe to climate change. Glob. Change Biol. 20, 1498–1511. doi: 10.1111/gcb.12476
Seidl, R., Schelhaas, M. J., Rammer, W., and Verkerk, P. J. (2014). Increasing forest disturbances in Europe and their impact on carbon storage. Nat. Clim. Change 4, 806–810. doi: 10.1038/nclimate2318
Seidl, R., Thom, D., Kautz, M., Martin-Benito, D., Peltoniemi, M., Vacchiano, G., et al. (2017). Forest disturbances under climate change. Nat. Clim. Change 7, 395–402. doi: 10.1038/nclimate3303
Sohn, J. A., Saha, S., and Bauhus, J. (2016). Potential of forest thinning to mitigate drought stress: a meta-analysis. For. Ecol. Manage. 380, 261–273. doi: 10.1016/j.foreco.2016.07.046
Thuiller, W., Lavorel, S., Sykes, M. T., and Araújo, M. B. (2006). Using niche-based modelling to assess the impact of climate change on tree functional diversity in Europe. Divers. Distrib. 12, 49–60. doi: 10.1111/j.1366-9516.2006.00216.x
Tinner, W., Colombaroli, D., Heiri, O., Henne, P. D., Steinacher, M., Untenecker, J., et al. (2013). The past ecology of Abies alba provides new perspectives on future responses of silver fir forests to global warming. Ecol. Monogr. 83, 419–439. doi: 10.1890/12-2231.1
Tóth, B., Weynants, M., Pásztor, L., and Hengl, T. (2017). 3D soil hydraulic database of Europe at 250 m resolution. Hydrol. Process. 31, 2662–2666. doi: 10.1002/hyp.11203
Urban, M. C. (2015). Accelerating extinction risk from climate change. Science 348, 571–573. doi: 10.1126/science.aaa4984
Urli, M., Porté, A. J., Cochard, H., Guengant, Y., Burlett, R., and Delzon, S. (2013). Xylem embolism threshold for catastrophic hydraulic failure in angiosperm trees. Tree Physiol. 33, 672–683. doi: 10.1093/treephys/tpt030
van Vuuren, D. P., Edmonds, J., Kainuma, M., Riahi, K., Thomson, A., Hibbard, K., et al. (2011). The representative concentration pathways: an overview. Clim. Change 109, 5–31. doi: 10.1007/s10584-011-0148-z
Verkerk, P., Costanza, R., Hetemäki, L., Kubiszewski, I., Leskinen, P., Nabuurs, G., et al. (2020). Climate-Smart Forestry: the missing link. For. Policy Econ. 115:102164. doi: 10.1016/j.forpol.2020.102164
Vitasse, Y., Lenz, A., and Kramer, C. (2014). The interaction between freezing tolerance and phenology in temperate deciduous trees. Front. Plant Sci. 5:541. doi: 10.3389/fpls.2014.00541
Walker, A. P., Beckerman, A. P., Gu, L., Kattge, J., Cernusak, L. A., Domingues, T. F., et al. (2014). The relationship of leaf photosynthetic traits - Vcmax and J max to leaf nitrogen, leaf phosphorus, and specific leaf area: a meta-analysis and modeling study. Ecol. Evol. 4, 3218–3235. doi: 10.1002/ece3.1173
Walker, A. P., De Kauwe, M. G., Bastos, A., Belmecheri, S., Georgiou, K., Keeling, R. F., et al. (2021). Integrating the evidence for a terrestrial carbon sink caused by increasing atmospheric CO2. New Phytol. 229, 2413–2445. doi: 10.1111/nph.16866
Walther, G. R., Post, E., Convey, P., Menzel, A., Parmesan, C., Beebee, T. J., et al. (2002). Ecological responses to recent climate change. Nature 416, 389–395. doi: 10.1038/416389a
Weedon, G. P., Balsamo, G., Bellouin, N., Gomes, S., Best, M. J., and Viterbo, P. (2014). The WFDEI meteorological forcing data set: WATCH Forcing data methodology applied to ERA-Interim reanalysis data. Water Resour. Res. 50, 7505–7514. doi: 10.1002/2014WR015638
Keywords: climate change stresses, tree mortality, ecophysiology, genetic resources, conservation strategy, management practices, process-based model
Citation: Petit-Cailleux C, Davi H, Lefèvre F, Verkerk PJ, Fady B, Lindner M and Oddou-Muratorio S (2021) Tree Mortality Risks Under Climate Change in Europe: Assessment of Silviculture Practices and Genetic Conservation Networks. Front. Ecol. Evol. 9:706414. doi: 10.3389/fevo.2021.706414
Received: 07 May 2021; Accepted: 13 August 2021;
Published: 27 September 2021.
Edited by:
Wilfried Thuiller, UMR5553 Laboratoire d'Écologie Alpine (LECA), FranceReviewed by:
Jiufeng Wei, Shanxi Agricultural University, ChinaPedro Álvarez-Álvarez, University of Oviedo, Spain
Copyright © 2021 Petit-Cailleux, Davi, Lefèvre, Verkerk, Fady, Lindner and Oddou-Muratorio. This is an open-access article distributed under the terms of the Creative Commons Attribution License (CC BY). The use, distribution or reproduction in other forums is permitted, provided the original author(s) and the copyright owner(s) are credited and that the original publication in this journal is cited, in accordance with accepted academic practice. No use, distribution or reproduction is permitted which does not comply with these terms.
*Correspondence: Cathleen Petit-Cailleux, cGV0aXQuY2F0aGxlZW5AZ21haWwuY29t