 Alexandre Kuhn
 Serge Aron
 Olivier J. Hardy
- 1Evolutionary Biology and Ecology, CP 160/12, Université Libre de Bruxelles, Brussels, Belgium
- 2Plants and Forests Health Unit, Department of Life Sciences, Walloon Agricultural Research Centre, Gembloux, Belgium
Reproductive strategies are diverse and a whole continuum of mixed systems lies between strict sexuality and strict clonality (apomixis), including automixis, a parthenogenetic mode of reproduction involving a meiosis and increasing homozygosity over generations. These various systems impact the genetic structure of populations, which can therefore be used to infer reproductive strategies in natural populations. Here, we first develop a mathematical model, validated by simulations, to predict heterozygosity and inbreeding in mixed sexual-automictic populations. It highlights the predominant role of the rate of heterozygosity loss experienced during automixis (γ), which is locus dependent. When γ is low, mixed populations behave like purely sexual ones until sex becomes rare. In contrast, when γ is high, the erosion of genetic diversity is tightly correlated to the rate of sex, so that the individual inbreeding coefficient can inform on the ratio of sexual/asexual reproduction. In the second part of this study, we used our model to test the presence of cryptic sex in a hybridogenetic Cataglyphis ant where new queens are produced parthenogenetically, leaving males with an apparent null fitness while they are essential to colony development as sperm is required to produce workers. Occasional sexual production of queens could resolve this paradox by providing males some fertile progeny. To determine whether this occurs in natural populations, we simulated genotypic datasets in a population under various regimes of sexual vs. asexual reproduction for queen production and compared the distribution of inbreeding, expected heterozygosity and inter-individual relatedness coefficients with those observed in a natural population of Cataglyphis mauritanica using microsatellites. Our simulations show that the distribution of inter-individual relatedness coefficients was particularly informative to assess the relative rate of sexual/asexual reproduction, and our dataset was compatible with pure parthenogenesis but also with up to 2% sexual reproduction. Our approach, implemented in an R script, should be useful to assess reproductive strategies in other biological models.
Introduction
Understanding how sexual or asexual reproduction affects the genetic structure and dynamics of populations is a major concern in evolutionary biology (Balloux et al., 2003; Halkett et al., 2005; Otto, 2009). In diploid organisms and for finite populations, models predict that sexual reproduction should maintain higher genotypic but lower allelic diversity than clonality (Balloux et al., 2003; Halkett et al., 2005). This is because recombination associated with sexual reproduction shuffles genes between individuals, while genomes are inherited as a block under strict asexual reproduction. Conversely, allelic diversity should be greater in clonal populations because mutations accumulate, which results in gene copies within individuals becoming more and more divergent (i.e., the Meselson effect; Welch and Meselson, 2000). Strict sexuality or asexuality are, however, extremities of a continuum of mixed reproductive strategies. Various taxa are indeed able to reproduce both sexually and asexually, including cyclical parthenogens (numerous aphids, or Daphnia, Simon et al., 2002; Decaestecker et al., 2009), facultative parthenogens (several insects and some vertebrates, Templeton et al., 1976; Schwander and Crespi, 2009; Booth et al., 2012), many flowering plants (Vallejo-Marín et al., 2010) or species that mainly reproduce through parthenogenesis but where rare sexual mixing occurs (Schurko et al., 2009). In the last 15 years, a number of models have been developed to determine the consequences of such mixed systems on population genetic structure and to estimate the rate of clonal vs. sexual reproduction in natural populations (e.g., Balloux et al., 2003; Bengtsson, 2003; Ali et al., 2016; Reichel et al., 2016). These models usually consider how varying degrees of sexual reproduction affect the genetic structure of populations characterized by asexual reproduction through apomictic parthenogenesis (i.e., parthenogenetic reproduction without recombination, similar to mitosis). However, an important fraction (especially in animals) of parthenogenetically reproducing organisms do so through automixis, an asexual but non-clonal mode of reproduction (Mogie, 1986; Stenberg and Saura, 2009; Engelstädter, 2017).
Automictic parthenogenesis occurs via a modified meiosis: reductional division and recombination proceed as in sexual reproduction but ploidy is restored by the fusion of two of the four nuclei generated by the same meiosis. Depending on which nuclei fuse for ploidy restoration, different types of automictic parthenogenesis can be distinguished, with various consequences for offspring homozygosity. These consequences have been extensively studied in previous works (Suomalainen et al., 1987; Pearcy et al., 2006, 2011; Engelstädter, 2017); hereafter, we briefly overview some of the most frequent cases of automixis: central fusion, terminal fusion and gamete duplication. Under central fusion automixis, nuclei formed after the second division of meiosis and containing non-sister chromatids fuse with each other. The mother’s heterozygosity at a given locus is therefore conserved in the offspring, except when a crossover event occurs between the centromere and this locus so that conversion to homozygosity occurs with a probability ranging from 0 (for a locus close to the centromere) to 1/3 (for a locus far from the centromere) (Pearcy et al., 2006, 2011). Under terminal fusion, nuclei formed after the second division and containing sister chromatids fuse. This situation is the reverse of the central fusion and mother’s heterozygosity will be lost with a probability ranging from 1 (close to the centromere) to 1/3 (far from the centromere). Under gamete duplication, meiotic nuclei do not fuse but the genome of one nucleus is doubled by DNA replication without cell division or by fusion of mitotic products, and the offspring are homozygous at all loci, independently of recombination events. Thus, depending on the mode of ploidy restoration, automictic populations will have a different genetic structure than strictly clonal (or sexual) ones. The evolutionary consequences of the different modes of automixis have recently been investigated in purely automictic populations (Haccou and Schneider, 2004; Engelstädter, 2017). However, how occasional sex can affect the genetic structure of partially automictic populations remains largely unstudied. Yet, population genetic models integrating automixis and sexual reproduction could provide valuable tools for investigating the presence of cryptic sex in apparently asexual populations, which may have critical implications for the understanding of natural systems (Halkett et al., 2005; Schurko et al., 2009).
Several species of desert ants of the genus Cataglyphis are characterized by a unique reproductive system, named social hybridogenesis (Leniaud et al., 2012; Eyer et al., 2013; Kuhn et al., 2020), whereby two genetically distinct lineages coexist and interbreed in populations. The non-reproductive workers are sexually produced from mating between a male and a queen originating from alternative lineages. In contrast, the reproductive queens are asexually produced by thelytokous parthenogenesis which proceeds through central fusion automixis (Pearcy et al., 2006; Eyer et al., 2013). Males develop from unfertilized eggs by arrhenotokous parthenogenesis, as is usually the case in Hymenoptera. Thus, in each lineage males and new reproductive queens are both parthenogenetically produced so that maternal genes only are perpetuated across generations. Asexual production of reproductive individuals of both sexes by queens may challenge the long-term stability of this system because males only sire non-reproductive workers (Leniaud et al., 2012; Schwander and Keller, 2012), hence, have no second-generation offspring (no fitness) and do not contribute to the fitness of the colony they originate from. Male production therefore represents a cost for the colonies and is expected to be counter selected. However, if one lineage stops producing males, the other one would be sperm depleted and, ultimately, both lineages would be affected (Darras et al., 2014a; Kuhn et al., 2018).
The cost of male production would be depreciated if they occasionally fathered reproductive daughters (i.e., new reproductive queens). Lab experiments indeed showed that mating between partners from the same genetic lineage occasionally occurs, giving rise to sexually produced new queens (Darras et al., 2014a; Kuhn et al., 2018). Such intra-lineage mating were also documented under natural conditions (Darras et al., 2014b; Kuhn et al., 2017), but their outcome remains completely unknown. Should intra-lineage mating result in the production of fertile reproductive queens in natural populations, males would then benefit from a non-null fitness without compromising the lineages’ maintenance. However, we have no direct evidence that this phenomenon indeed occurs in the wild. Since hybridogenetic species of Cataglyphis typically have a low reproductive output at each generation (Leniaud et al., 2012; Eyer et al., 2013; Darras et al., 2014b), it would be easy to miss sexual production of new queens if it only occurs sporadically.
In this study, we first extend the work of Engelstädter (2017) to describe neutral genetic variation and inbreeding in mixed sexual-automictic populations by developing a mathematical model and by performing stochastic simulations to assess the validity and robustness of the model. Second, we apply our model to investigate whether males of hybridogenetic Cataglyphis sometimes transmit their genes into reproductive new queens through intra-lineage mating under natural conditions. To this end, we used a simulation approach to assess the parameter space compatible with empirical genotypic data from a population of the hybridogenetic species Cataglyphis mauritanica. More specifically, the simulation algorithm used for our general model was modified to more closely mimic the reproductive system of C. mauritanica and the molecular markers used to determine its population genetic structure. We then simulated genotypic datasets in a population under various regimes of sexual vs. asexual reproduction for queen production, and compared the distribution of inbreeding, expected heterozygosity and inter-individual relatedness coefficients to those actually observed under natural conditions in this species.
Modeling Neutral Genetic Variation in Partially Automictic Populations
Theoretical Model
We adapted the neutral genetic variation model of Engelstädter (2017), developed for purely automictic populations, to predict heterozygosity and inbreeding in populations with a mixed sexual-automictic reproductive system (Figure 1). We assumed an isolated (no migration), unstructured and finite population of diploids where each adult produces offspring through asexual reproduction by automictic parthenogenesis at a rate a, and through sexual reproduction at a rate 1 – a. We considered a single, selectively neutral locus for which new alleles can arise by mutations at a rate μ per generation (assuming the same rate under sexual and asexual reproduction), each mutation producing a new allele – i.e., the “Infinite Alleles-Model” or IAM. Automictic parthenogenesis can induce a loss in heterozygosity, at a rate γ, according to the mode of automixis and the recombination frequency between the focal locus and the centromere (see Introduction). We also assumed that sexually reproducing individuals mate randomly in the population, generations are discrete and population size is constant, so that genetic variation at the population level can be lost through drift.
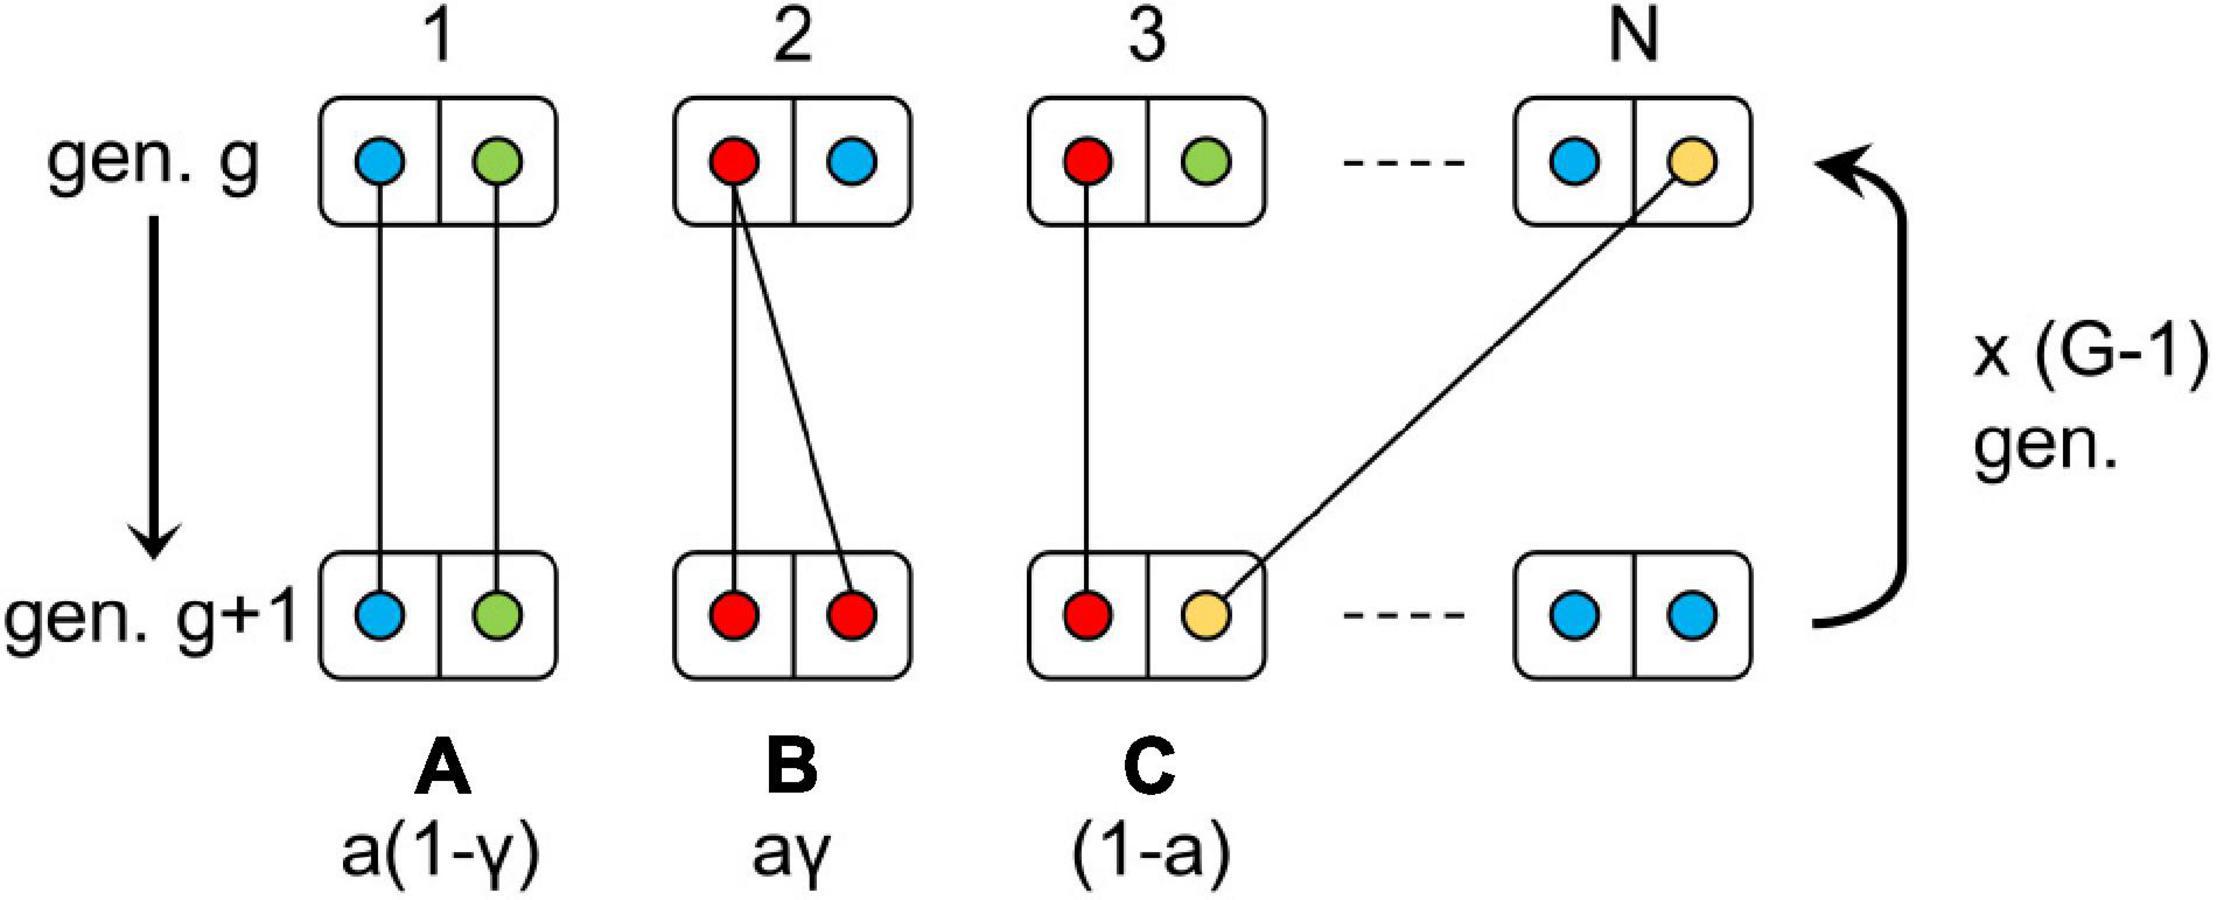
Figure 1. Design of the model simulated. Each box represents a diploid individual with circles of different colors corresponding to distinct alleles of a same locus. The letters A, B, and C represent the possible inheritance modes and their corresponding probability: A = automixis without loss of heterozygosity, B = automixis with loss of heterozygosity and C = sexual reproduction. The letters a and γ denote the rates of automixis and loss of heterozygosity, respectively. This process is repeated G-1 times to generate G new generations. For each transmission event between generations, there is a probability μ that the allele transmitted mutated to a new, non-existing, allele. “gen.” stands for generation.
We first considered the individual heterozygosity (proportion of heterozygote individuals), HI, and we modified Eq. (7) from Engelstädter (2017) expressing the change in homozygosity from a parental generation (1 − HI) to the next generation (1 – H’I) to account for a mixed reproductive system. Our derivation of HI thus combined heterozygosity due to automictic (a) and sexual (1 − a) reproduction in a population of N equally fertile diploid reproducers:
here, HS, the population heterozygosity, is the probability that two alleles picked from distinct individuals are different. The (1-μ)2 multiplier accounts for the fact that heterozygosity necessarily results whenever a mutation has occurred under the IAM. The 1− (1−γ)HI term accounts for the gain in homozygosity under some forms of automictic parthenogenesis. Finally, the term starting with (1-a) indicates that under random sexual mating, the alleles of the uniting gametes can derive from the same parental copy with probability 1/(2N), necessarily leading to homozygosity, or from two alleles from the same individual [probability = 1/(2N)] or different individuals (probability = 1−1/N) of the parental population, in which cases the offspring homozygosity equals, respectively, the individual (HI) and population (HS) homozygosities of the previous generation. Solving yields the equilibrium heterozygosity:
The fraction after the ≈ symbol is an approximation ignoring terms in μ2, which is appropriate for small mutation rates. Note that for a = 1 (pure automixis), Eq. (2) corresponds to Eq. (8) of Engelstädter (2017).
The transition equation between two generations for the population homozygosity, 1 − HS, due to genetic drift and mutations, is not affected by the mode of reproduction and is given by Eq. (9) of Engelstädter (2017):
After substituting from Eq. (2) for HI and solving , the equilibrium is found to be:
Again, the approximation ignores terms in μ2 and assumes that N is large such that N ± 1 ≈ N.
Using Eqs. (2) and (4) (without approximations), the equilibrium individual inbreeding coefficient FIS is
If we further approximate Eq. (5) by neglecting (1 – μ)2 terms:
hence, = 0 when a = 0 or γ = 1/(2N), is negative when , generalizing the inequality shown by Engelstädter (2017) when a = 1 (Figure 2C and Supplementary Figure 1C). In the particular case of γ = 0 (asexual reproduction without loss of heterozygosity, that is strict clonality),
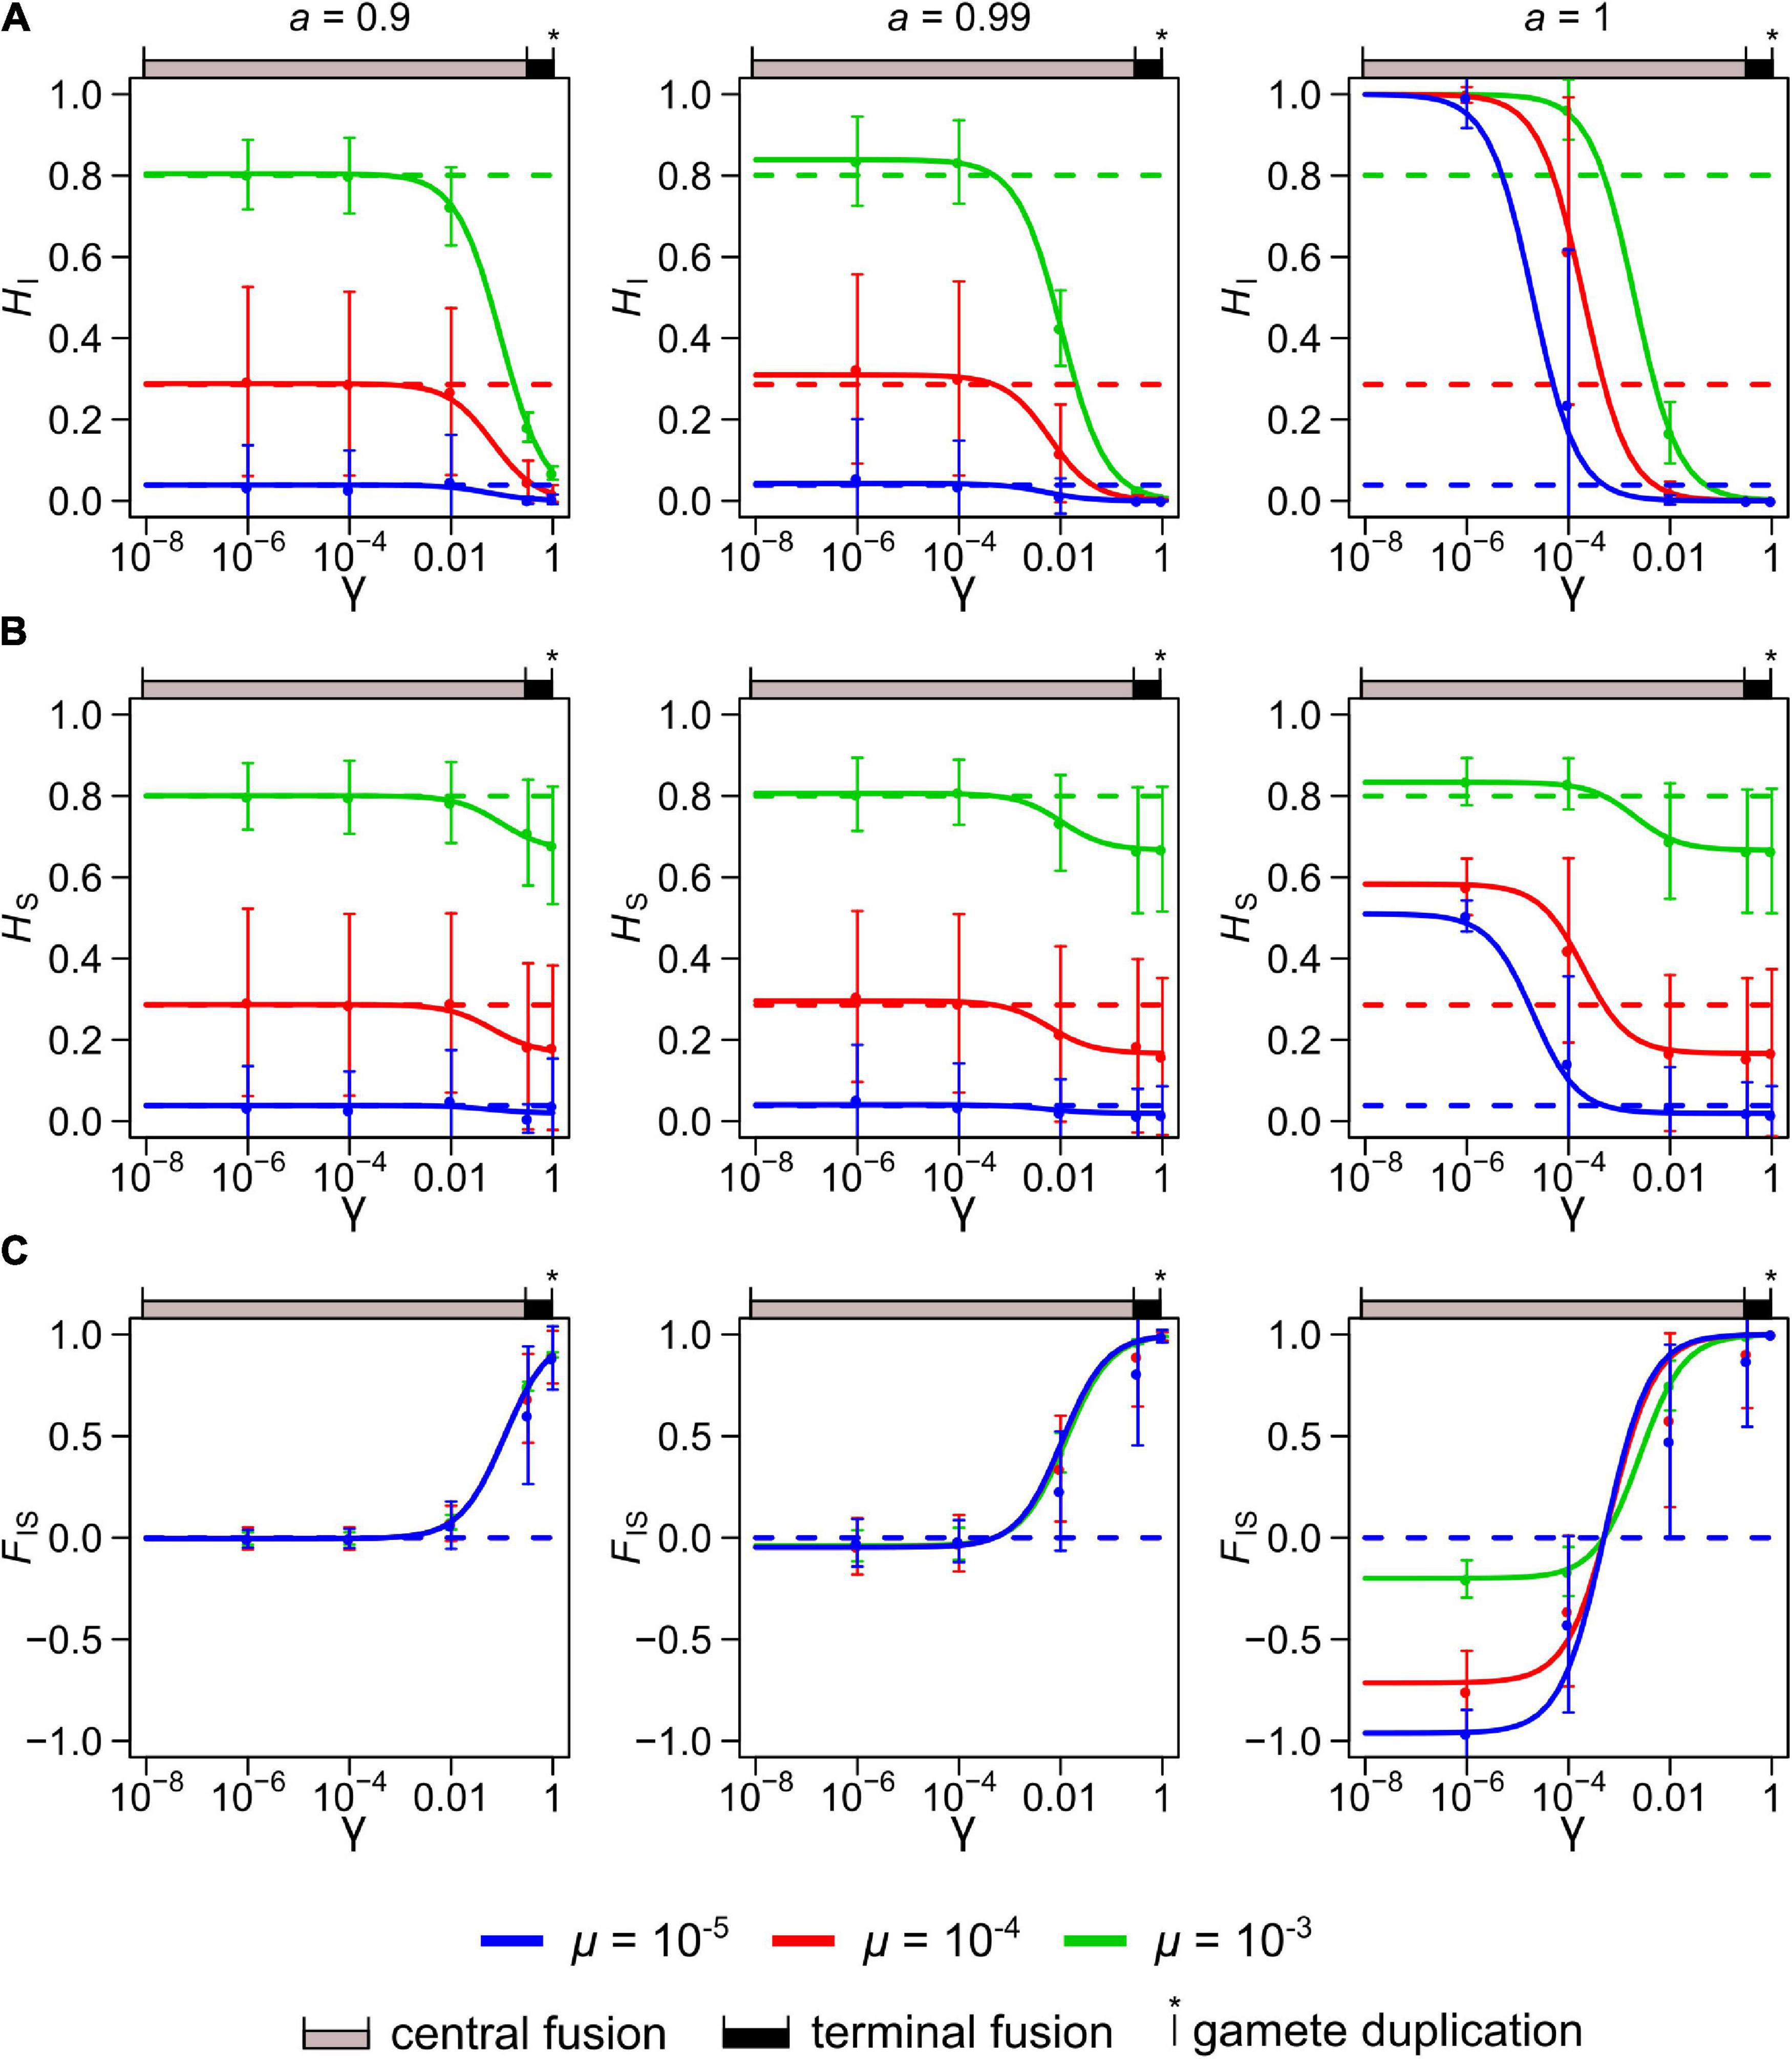
Figure 2. Neutral genetic diversity at equilibrium in a population with a mixed, sexual-automictic, reproductive system represented by three statistics: the individual heterozygosity, HI (A), the population heterozygosity, HS (B) and the individual inbreeding coefficient, FIS (C). The solid lines show the theoretical values for these statistics for varying rates of loss of heterozygosity, γ and under three discrete rates of automixis, a (0.9, 0.99, and 1). For each plot, three mutations rates, μ, are shown: 10–5 (blue), 10–4 (red), and 10–3 (green). The dashed lines show the corresponding expected values in purely sexual populations (i.e., where a = 0). Population size was set to N = 1000. The colored circles and the vertical bars represent the mean and standard deviations obtained by simulation for γ = 10–6, 10–4, 10–2, 1/3 and 1. The ranges of γ covered by the three main modes of automixis are indicated above each graph: central fusion automixis in gray (0 ≤ γ ≤ 1/3), terminal fusion automixis in black (1/3 ≤ γ ≤ 1) and gamete duplication automixis (γ = 1).
which is consistent with the derivation of Balloux et al. (2003) for an island model in the limiting case of a single population.
Simulation Algorithm
To assess the stochasticity of HI, HS, and FIS around their theoretical expectations, we simulated a population under the same assumptions as the theoretical model (Figure 1): constant population size, no overlap between generations, no migration, new mutations produced under an IAM and panmixis for sexually reproducing individuals.
The initial generation consists of N = 1000 diploid individuals homozygous for the same allele. Each individual is considered hermaphrodite and can thus transmit alleles as a male or as a female. A new generation (g+1) of size N is then built as follows. For each individual of the new generation (g+1), a mother is chosen randomly among the individuals of the previous generation (g) (hence, multiple individuals from generation g+1 can have the same mother) and its genotype depends on the reproductive mode, sexual (rate 1 – a) or automictic (rate a). Under sexual reproduction, one allele is randomly picked among its mother’s alleles, while the paternal allele is taken at random from the pool of individuals from the previous generation (excluding the mother). Under automictic parthenogenesis, if the mother is heterozygous, its offspring will inherit the same genotype with probability 1 – γ, or will be homozygous for one of the randomly chosen mother’s alleles with probability γ; and if the mother is homozygous it will inherit the maternal genotype. Finally, each allele from a new generation’s individuals has a probability μ of mutating to a new allele (in practice we considered up to 106 possible alleles), whatever the mode of inheritance (sexual or automictic). The process was repeated for G = 105 generations (Figure 1).
The three modeled statistics were then estimated at each generation from the simulated data. The individual heterozygosity (HI) was computed as the proportion of heterozygous individuals. The population heterozygosity (HS), corrected for finite sample size after (Nei and Chesser, 1983) and the inbreeding coefficient (FIS) were calculated by the following equations:
with pi being the frequency of the ith allele.
The simulation model was implemented as a script (Data Availability section) in the R statistical language (R version 3.5.1, R Core Team, 2018). Simulations were initialized by a burn-in period of 5 × 10⁴ generations. Then, statistics were estimated over the whole population (N = 1000 diploid individuals) during 5 × 10⁴ generations. For each set of tested parameters (Figure 2 and Supplementary Figure 1), five replicates were performed, and the results averaged.
The mean statistics investigated (HI, HS and FIS) obtained by simulation closely matched their theoretical expectations. However, when the rate of automixis approached a = 1, some departure appeared for FIS under the lowest mutation rates (Supplementary Figure 1), a situation where the simulated population was often fixed for one allele, preventing the estimation of FIS.
Impact of μ, γ and a on HI, HS and FIS
As expected, HI and HS decrease when μ decreases, and HI and HS decrease while FIS increases when γ increases (Figure 2 and Supplementary Figure 1). Under full automixis (a = 1), γ affects substantially all three statistics. However, when some sexual reproduction occurs, even just 1% (a = 0.99), the value of γ affects minimally the three statistics when it is small (γ < 10–2, a situation found under central fusion automixis with low recombination rates) (Figure 2). FIS is nearly unaffected by μ as long as some sexual reproduction occurs (a ≤ 0.99), while in a purely automictic population (a = 1) FIS is much affected by μ (Figure 2C). More specifically, FIS becomes all the more negative that μ is smaller when γ < 1/(2N) (central fusion with low recombination rates), while FIS approaches unity if γ > > 1/(2N) (gamete duplication, terminal fusion or central fusion with high recombination rates).
When γ approaches 1 (gamete duplication or terminal fusion with low recombination rates) and N > > 1, the relationship between FIS and a tends to become linear (Figure 3A and Supplementary Figure 1C), and FIS ≈ a when γ = 1. Finally, when γ = 0 (equivalent to strict clonality), FIS is much influenced by the population size (N) for high rates of automixis (a > 0.8) and approaches −1 only when Nμ is much lower than 1 and when a tends to 1 (Figure 3B, when μ = 10–4). Importantly, the FIS departs from 0 for smaller values of a as N decreases (Figure 3B).
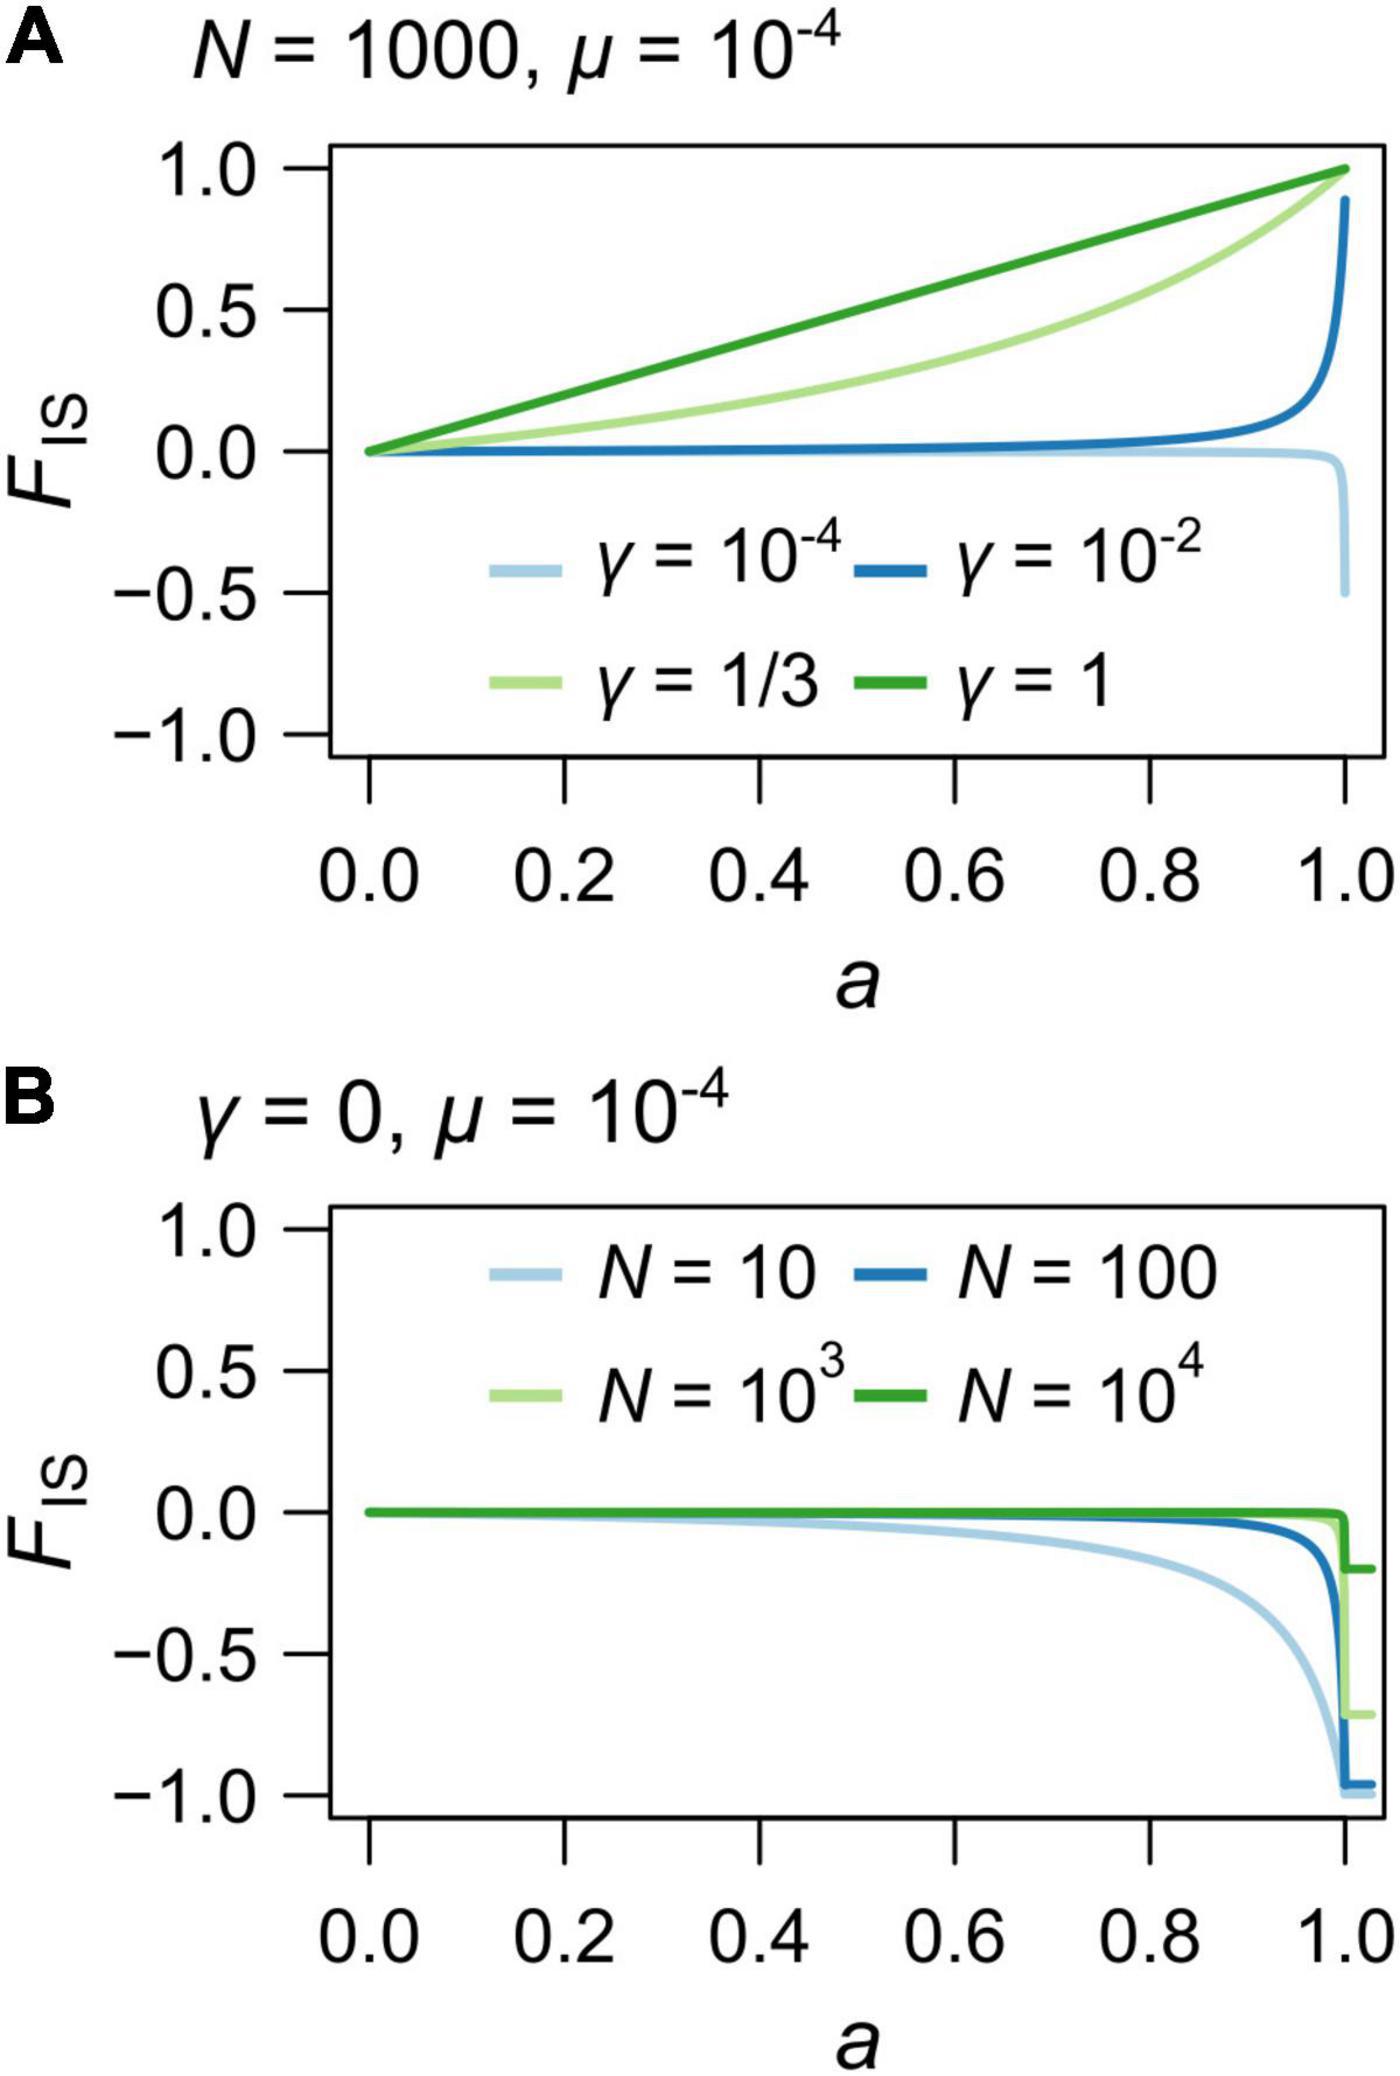
Figure 3. Theoretical values of the individual inbreeding coefficient, FIS for varying rates of automixis, a. (A) Variations due to different rates of loss of heterozygosity: γ = 10–4 (light blue), 10–2 (blue), 1/3 (light green) and 1 (green). Population size was set to N = 1000 and mutation rate to μ = 10–4. (B) Under automixis without loss of heterozygosity (i.e., strict apomixis; γ = 0), variations due to different population sizes: N = 10 (blue), 100 (light blue), 1000 (light red) and 10 000 (red). Horizontal bars with corresponding colors indicate the FIS values for a = 1. Mutation rate was set to μ = 10–4.
The variances of HI and HS tend to be higher when their expected values are intermediate (i.e., when HI or HS is closer to 0.5 than to 0 or 1) and they are little affected by γ or μ (Figures 2A,B and Supplementary Figures 1A,B). By contrast, the variance of FIS tends to increase substantially when γ or a is high (but not when both γ and a were close to 1 because the FIS then approaches 1) (Figure 2C and Supplementary Figure 1C).
Materials and Methods
The theoretical results obtained above show that FIS can contain relevant information to estimate the rate of automixis in natural populations with mixed sexual/asexual reproduction. Additional insights might be obtained from the distribution of relatedness coefficients between individuals because the genotypes of sibs or cousins are expected to be much more similar when resulting from automixis than from sexual reproduction, so that the variance of pairwise relatedness coefficients should be related to the rate of automixis. We have not been able to derive analytical predictions for the distribution of relatedness coefficients for our models, but numerical simulations of specific population models can nevertheless be used to assess if they can be informative. Hereafter, we use our analytical predictions and numerical simulations to try estimating the rate of sexual reproduction in an original ant species known to reproduce mostly by automixis.
Studied Species and Population Genetics Data
Cataglyphis mauritanica is a thermophile scavenger ant found in semiarid habitats in northern Africa (Cagniant, 2009). Colonies typically contain hundreds to a few thousands workers and are headed by multiple nestmate queens (range: 2–50) that are most often (80%) singly mated (Kuhn et al., 2017).
We sampled a large population of C. mauritanica in the Atlas Mountains of Morocco (Kuhn et al., 2017). This population is known to reproduce by social hybridogenesis (Eyer et al., 2013; Kuhn et al., 2017). Kuhn et al. (2017) genotyped one queen per colony from 327 colonies at nine microsatellite markers. A single queen genotype was considered representative of a colony because nestmate queens have nearly identical multilocus genotypes due to their production via parthenogenesis (Eyer et al., 2013; Kuhn et al., 2017). Among the 327 queens, 168 were identified as belonging to the lineage 1 and 159 to the lineage 2 (not a single queen harbored a hybrid genotype between the two lineages). Within each lineage, queen genotypes are distributed in a mosaic of parthenogenetic patches (Supplementary Figure 2; Kuhn et al., 2017). This pattern is a consequence of the automictic production of queens coupled to their short dispersal distances.
Characterizing the Genetic Structure of the Cataglyphis mauritanica Population
To investigate whether sexual reproduction contributes to the production of new queens through intra-lineage mating, we analyzed the two lineages separately. Two microsatellite markers were excluded from our analyses as they were nearly monomorphic for lineage 2 (HS Ch06 = 0 and HS Ch19 = 0.03). The seven remaining loci were polymorphic (mean number of alleles ± SD: 8.7 ± 3.9 and 6 ± 2.5 for lineage 1 and 2, respectively; Supplementary Table 1) and used for our analyses. To characterize the population genetic structure, the HI, HS and FIS were computed for each locus using SPAGeDi software (version 1.5, Hardy and Vekemans, 2002). The distribution of pairwise relatedness coefficients between queens (rij) was also investigated using the estimator of Li et al. (1993).
Simulating Data Comparable to the Studied Population
Our simulation algorithm was parametrized to mimic the C. mauritanica population described above in order to determine, in each lineage, the rates of sexual production of new queens compatible with the genetic structure observed in the empirical genetic data. We simulated genotypes as described above (see Simulation algorithm), but the algorithm was adjusted to more closely mimic the reproductive system of C. mauritanica and the molecular markers used to determine its population genetic structure. The initial generation of queens was generated by picking alleles, for each of the seven microsatellite markers, according to the allele frequencies observed in the empirical dataset (Supplementary Table 1). Genotypes of successive generations were obtained as described in the general model except that seven independent loci were simulated. Importantly, the reproduction mode (sexual or parthenogenetic) and the parent(s) of each individual in a new generation are consistent across loci. When a queen was sexually produced, its maternal allele was randomly picked among its mother’s alleles, for each marker, as in the general model. However, for its paternally inherited allele, we implemented a probability m of migration. Therefore, paternal alleles could either be randomly sampled in the previous generation (probability 1 – m), as described previously, or they could be picked according to allele frequencies of a ‘migrant gene pool’ (probability m). The latter is based on empirical allelic frequencies found in males that could not be assigned to putative mother colonies in the study of Kuhn et al. (2017). These males harbored genotypes that could not be related to any of the parthenogenetic patches of the populations and were thus considered as migrants (Supplementary Table 1). This migration probability is only implemented for the males because they disperse much further than queens in C. mauritanica (Kuhn et al., 2017). Therefore, the mother contribution is expected to mostly rely on the population allelic frequency (which is updated at each generation), while males can bring alleles from adjacent populations.
In Cataglyphis, thelytokous parthenogenesis proceeds by automixis with central fusion (Pearcy et al., 2006; Eyer et al., 2013). Therefore, γ was constrained to range between 0 and 1/3 at each locus. Finally, each allele from a new queen had a probability μ of mutating, whatever the mode of inheritance (sexual or parthenogenetic). Mutations were implemented following a “Stepwise Mutation-Model” (SMM): they change allele size by adding or subtracting (50% chance each) one repetition of the microsatellite motif. Thus, when a mutation occurs under SMM, it may generate an already existing allele by homoplasy. The SMM is more realistic for microsatellite markers than the IAM and should therefore better fit our empirical data (Ellegren, 2004). To determine the optimal μ and γ for each marker, we used Eqs. (4) and (5). Given the simulated population size (N) and rate of automixis (a) (defined for each simulation), μ and γ values were optimized to minimize the sum of squared differences between the observed (from the empirical data) and the expected values of FIS and HS [from Eqs. (4) and (5)]. To this aim, we used the “bobyqa” function from the R package “Minqa” (version 1.2.3, Bates et al., 2015) constraining μ to vary from 10–6 to 5 × 10⁻³ and γ from 0 to 1/3. To account for the fact that Eqs. (4) and (5) assume that mutations occur following the IAM while simulations assume SMM, we adjusted the HS calculation. This was not needed for the FIS which is much less influenced by the mutation rate (Figure 2C and Supplementary Figure 1C). In a Wright-Fisher population of diploids at mutation-drift equilibrium, the population heterozygosity reaches HIAM = M/(1+M) under the IAM, and HSMM = 1 – (1 + 2M)1/2 under the SMM, with M = 4Ne.μ where Ne is the effective population size (Goldstein and Schötterer, 1999). Combining these equations, we can convert the equilibrium heterozygosity expected under SMM and IAM:
We therefore used this relationship to adjust the theoretical HS to determine the optimal μ for each marker in our simulations.
We simulated 5 000 generations for each clonality rate investigated (see below – Simulation parameters). The first 2 500 generations were discarded as burn-in to get rid of the influence of the first panmictic generation and to reach mutation-drift equilibrium. Each simulation was run five times independently to assess the robustness of the results.
Simulation Parameters
We tested, for each lineage, rates of automixis for new queen production ranging from 95 to 99% by 1% steps and from 99.5 to 100% by 0.1% steps. a < 95% were very unlikely because mixed systems without a predominant proportion of parthenogenesis are nearly indistinguishable from strict sexual systems given the range of γ investigated to fit central fusion automixis (0 ≤ γ ≤ 1/3; Figure 2 and Supplementary Figure 1). Three population sizes (N) were tested: 250, 500 and 1 000. These sizes were estimated given the number of colonies sampled by Kuhn et al. (2017; 168 and 159 for lineage 1 and 2, respectively) and assuming that we have sampled between 1/3 and 2/3 of the actual number of colonies constituting the population (although sessile, Cataglyphis nests can be very hard to spot). Unsampled colonies were very likely disseminated among sampled ones. Because this population was structured in parthenogenetic patches (see above and Kuhn et al., 2017), so that nearby colonies were headed by queens with similar genotypes, unsampled colonies are expected to impact population size but their influence on allelic frequencies should be weak. The case N = 1 000 is a priori overestimated under pure automixis because new reproductive females cannot fly and remain inside or close to their natal colonies, while it could be realistic if sexual reproduction occurs because males do fly and might therefore extend substantially the limit of a population beyond the area sampled. The migration probability, m, was alternatively set to 0, 0.15 and 0.25 (27% of males were unassigned in the empirical dataset).
Tests Comparing Empirical and Simulated Data
Three statistics were used to assess whether the empirical data fitted simulated data over the tested parameters: HS, FIS and the distribution of pairwise relatedness coefficients between individuals (rij). To ensure the comparability of simulated vs. empirical datasets, for each lineage we randomly subsampled simulated data to reach the sample size of the empirical data (168 and 159 queens for lineage 1 and lineage 2, respectively).
HS and FIS were estimated for each marker and at each generation using Eqs. (8) and (9). For a given marker, the empirical value of each statistic (either HS or FIS) was compared to the distribution of the simulated values of the corresponding statistic over all generations (except the burn-in) from the five runs (resulting in 12,500 generations). A two-tail p-value was then calculated to evaluate the risk (α) of rejecting the model with a given parameter set when the empirical data actually fit the simulated data:
With Xemp ≤ (≥) xsim denoting the proportion of either HS or FIS estimates over the simulated data that is inferior or equal (superior or equal) to the empirical value of the corresponding statistic. The α threshold was set to 5%.
For the simulated generations, the presence of a fixed allele at a given marker prevents FIS calculation (because HS = 0). Thus, generations with a fixed allele at any marker were excluded from the comparisons (for both HS and FIS) for all markers. To integrate the comparison of HS and FIS estimates from the empirical and the simulated data over all markers, we combined their p-values using an empirical adaptation of Brown’s Method (an extension of Fisher’s Method; Poole et al., 2016) for combining dependent p-values, implemented in the R package “EmpiricalBrownsMethod” (version 3.7, Poole, 2018).
rij was computed for all pairs of individuals for every ten generations for the simulated data using the estimator of Li et al. (1993). The distribution of the rij between simulated queen genotypes (over all generations and over all runs for a given parameter set) was compared to the empirical distribution of rij (see above – Empirical data). To this end, rij values were represented as histograms of 0.1 bins ranging from −1.5 (minimum over all parameter sets) to 1. For the empirical data and for each simulated data (250∗5 = 1 250 simulated datasets), we computed a pseudo chi-square statistic as follow:
where xi denotes the proportion of rij values from the empirical or simulated data falling in bin i, is the mean proportion of simulated rij values falling in bin i and var(xi) is the variance of the proportion of simulated rij values falling in bin i among simulated datasets. The pseudo-χ2 from the empirical data was then compared to the distribution of the pseudo-χ2 from the simulated data using the two-tail p-value procedure applied above for the HS and FIS.
Results
Genetic Structure of the Cataglyphis mauritanica Population
HI, HS and FIS were highly variable depending on the marker investigated in both lineages (Table 1). The relatedness between queens (rij) followed a bimodal distribution within each lineage (red line in Figure 4): some pairs had very similar genotypes (rij between 0.7 and 1), presumably because they descended from a recent common ancestor under pure automixis, while other queens had divergent genotypes (rij between −0.8 and 0.3), presumably because they arose from intra-lineage sexual reproduction or because they accumulated many mutations since their last common ancestor (Kuhn et al., 2017).
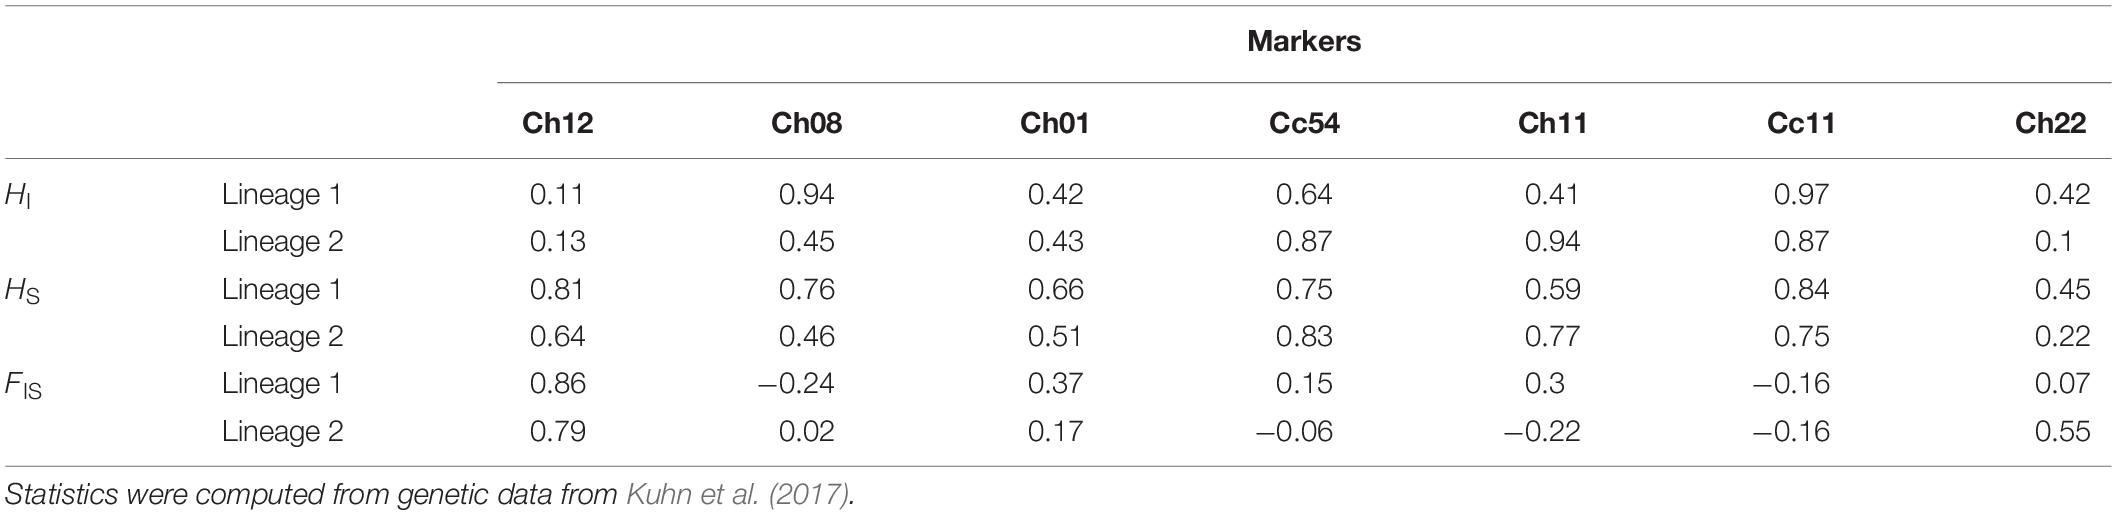
Table 1. Individual heterozygosity (HI), population heterozygosity (HS) and individual inbreeding coefficient (FIS) of queens from hybridogenetic lineages of C. mauritanica.
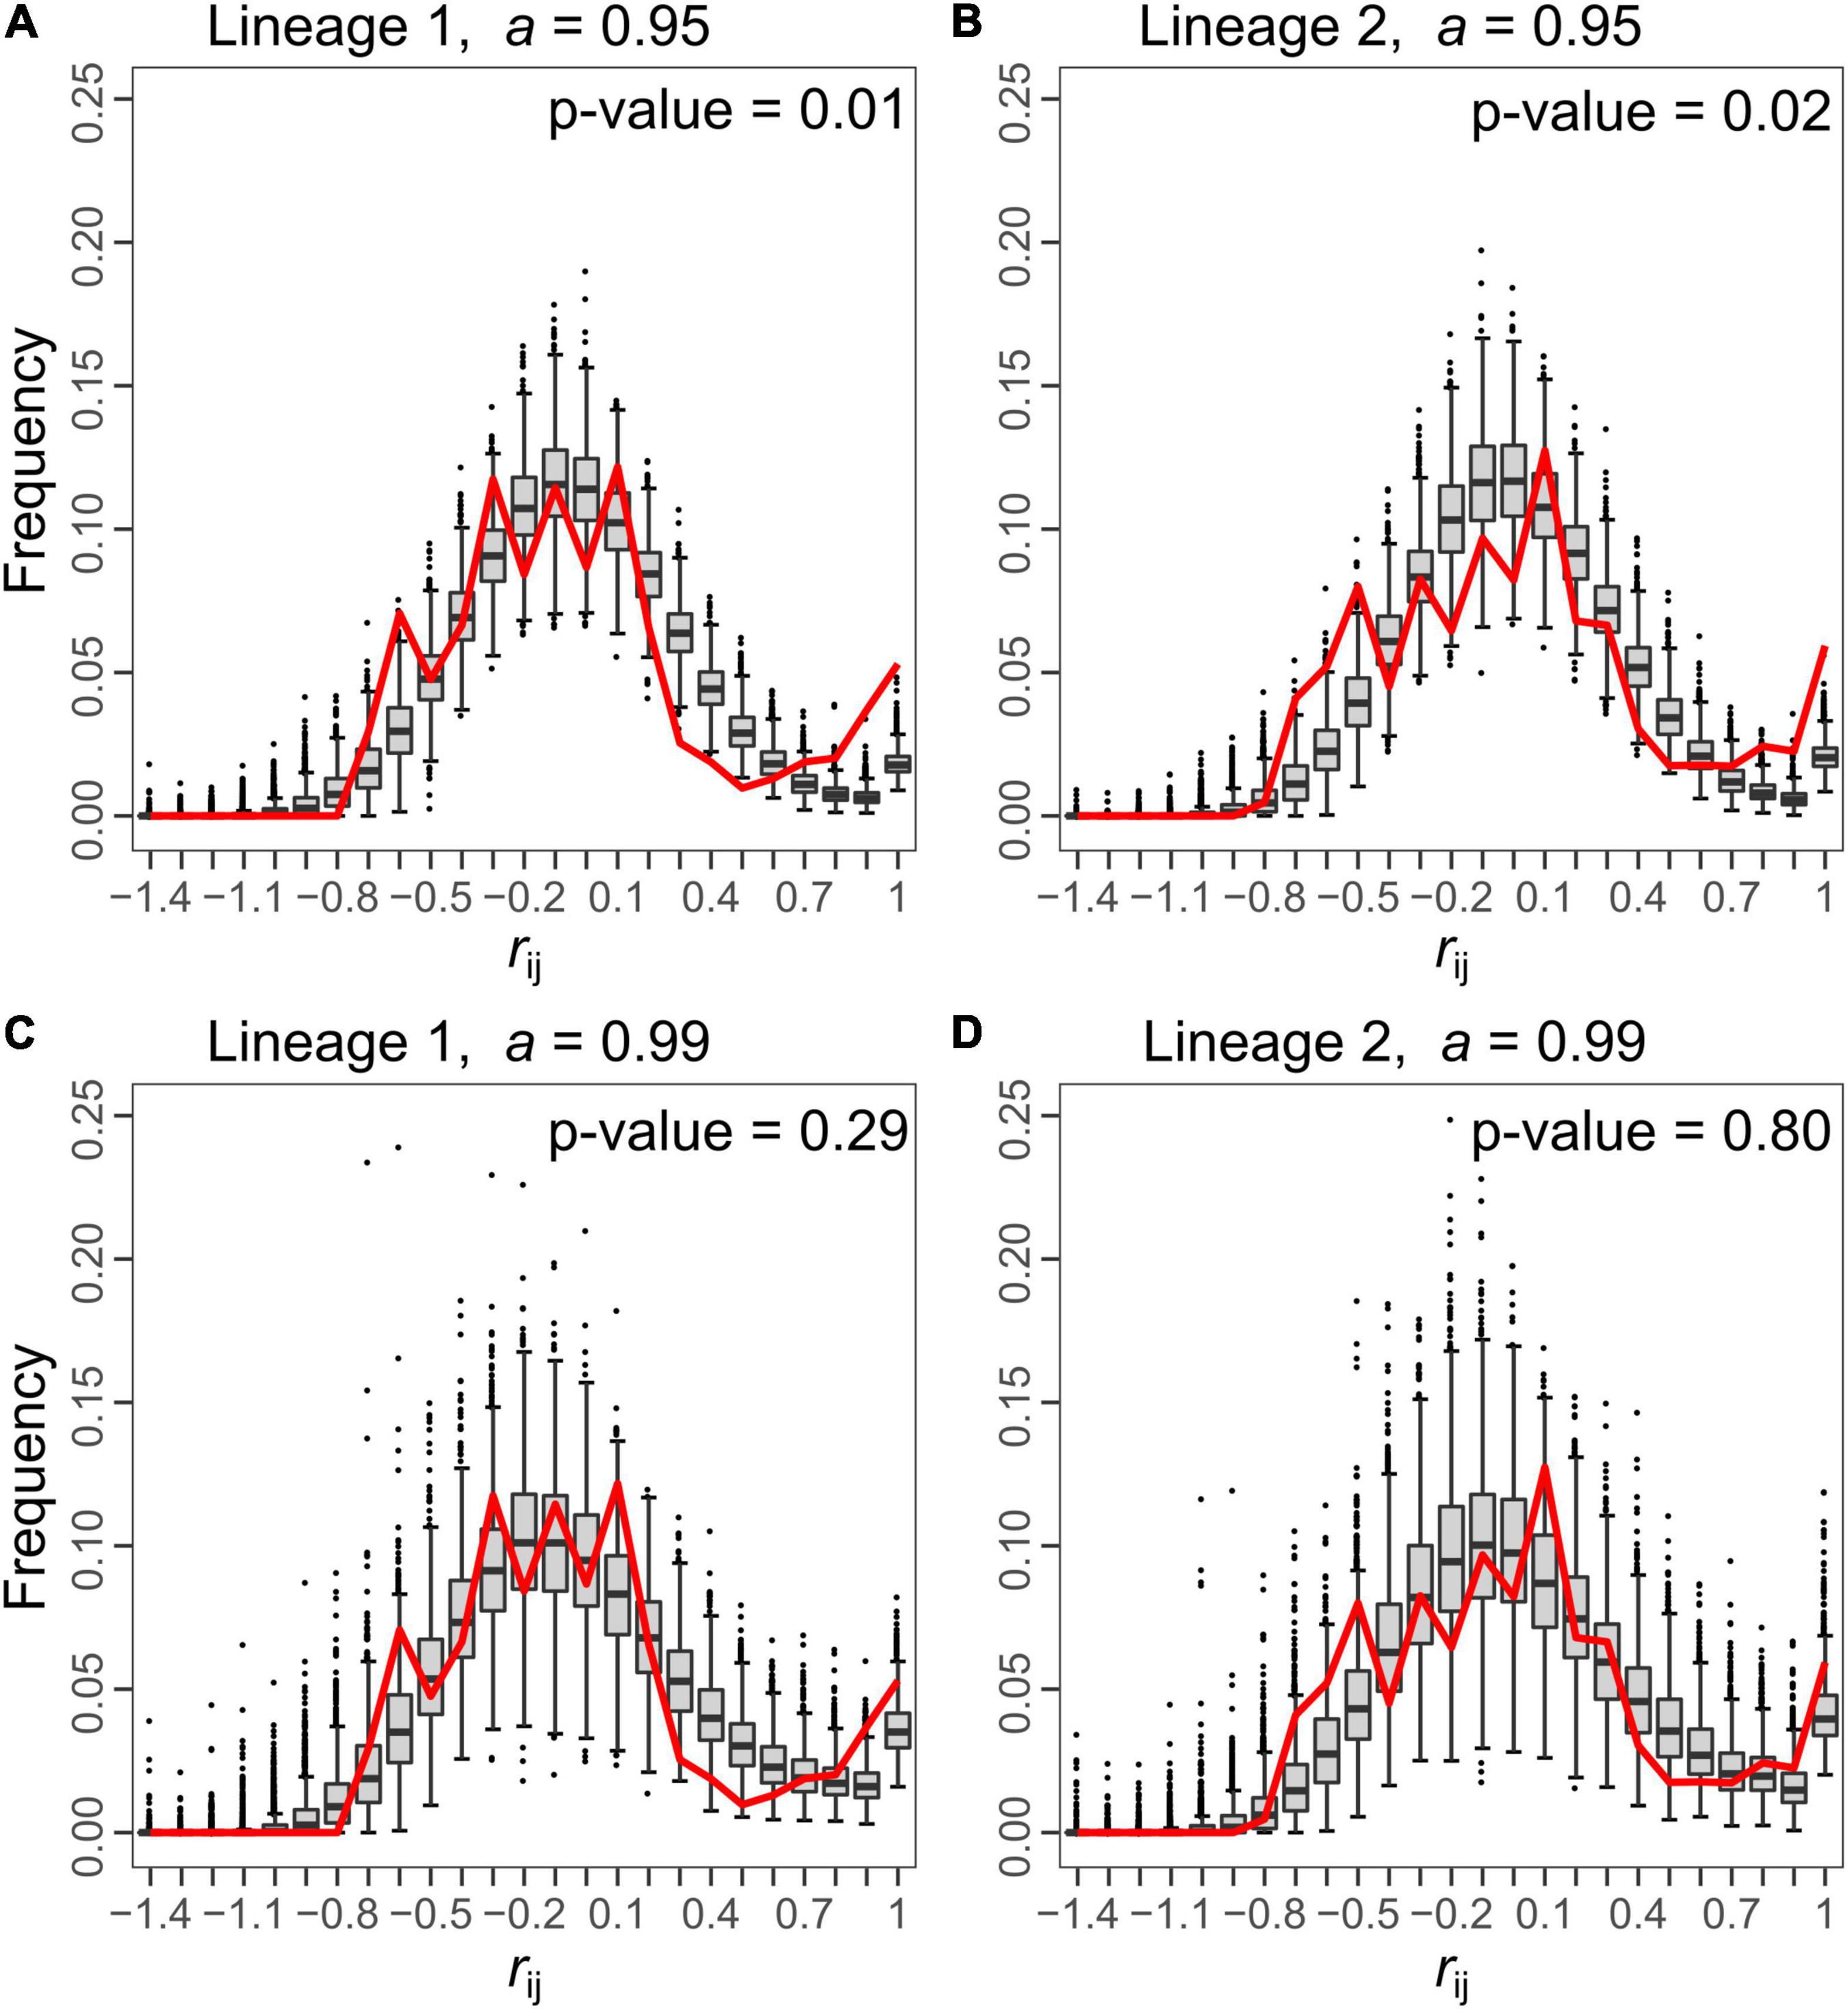
Figure 4. Comparison of the distributions of relationship coefficient (rij) between all pairs of queens from the simulated (box-and-whisker plots) and from the empirical (red line) data for both lineages. For each lineage, two rates of automixis are represented for the simulated data: a = 0.95 (A,B) and 0.99 (C,D). In all plots, simulations were generated with a population size, N, of 250 and no migration (m = 0). Under a = 0.95, the distribution of the simulated rij deviates from the bimodal empirical distribution (p-values = 0.01 and 0.02 for lineage 1 and 2, respectively), while a better fit is obtained for a = 0.99 (p-values = 0.29 and 0.80 for lineage 1 and 2, respectively). Each box-and-whisker plot represents the distribution of proportions of simulated rij values falling in a given bin among simulated datasets. The bottom and top of the box are the 25th and 75th percentiles, respectively, and the band within the box is the 50th percentile (the median). Values falling outside the box range (i.e., the range between the 25th and the 75th percentiles) are represented by the whiskers. The upper (lower) limit of the whisker corresponds to the most extreme value within the range of the 75th (25th) percentile + (–) 1.5 × the box range. Beyond these limits, outliers are represented by black dots. The x-axis indicates the upper bound of each bin.
Simulation Results and Comparison With Empirical Data
The simulation results for the three statistics investigated were highly similar for both hybridogenetic lineages of C. mauritanica (except for HS with N = 250). The fit of simulated data with empirical data (corresponding to high p-values) typically increased with higher a (Figure 5 and Supplementary Figure 3). Combining the fit of the three statistics, the largest range of compatible a (i.e., a values for which HS, FIS and rij p-values were above the 5% α threshold) was found for simulations with N = 250 where compatibility ranged from a = 98% or 99% (depending on m) to 100% (Figure 5 and Supplementary Figure 3). For N = 500, compatibility was restricted to a values ≥ 99.5% and showed higher stochasticity (marginal compatibility, if any, when m = 0.25) (Figure 5 and Supplementary Figure 3). For N = 1 000, most simulations did not fit the empirical data, whatever a (Figure 5 and Supplementary Figure 3).
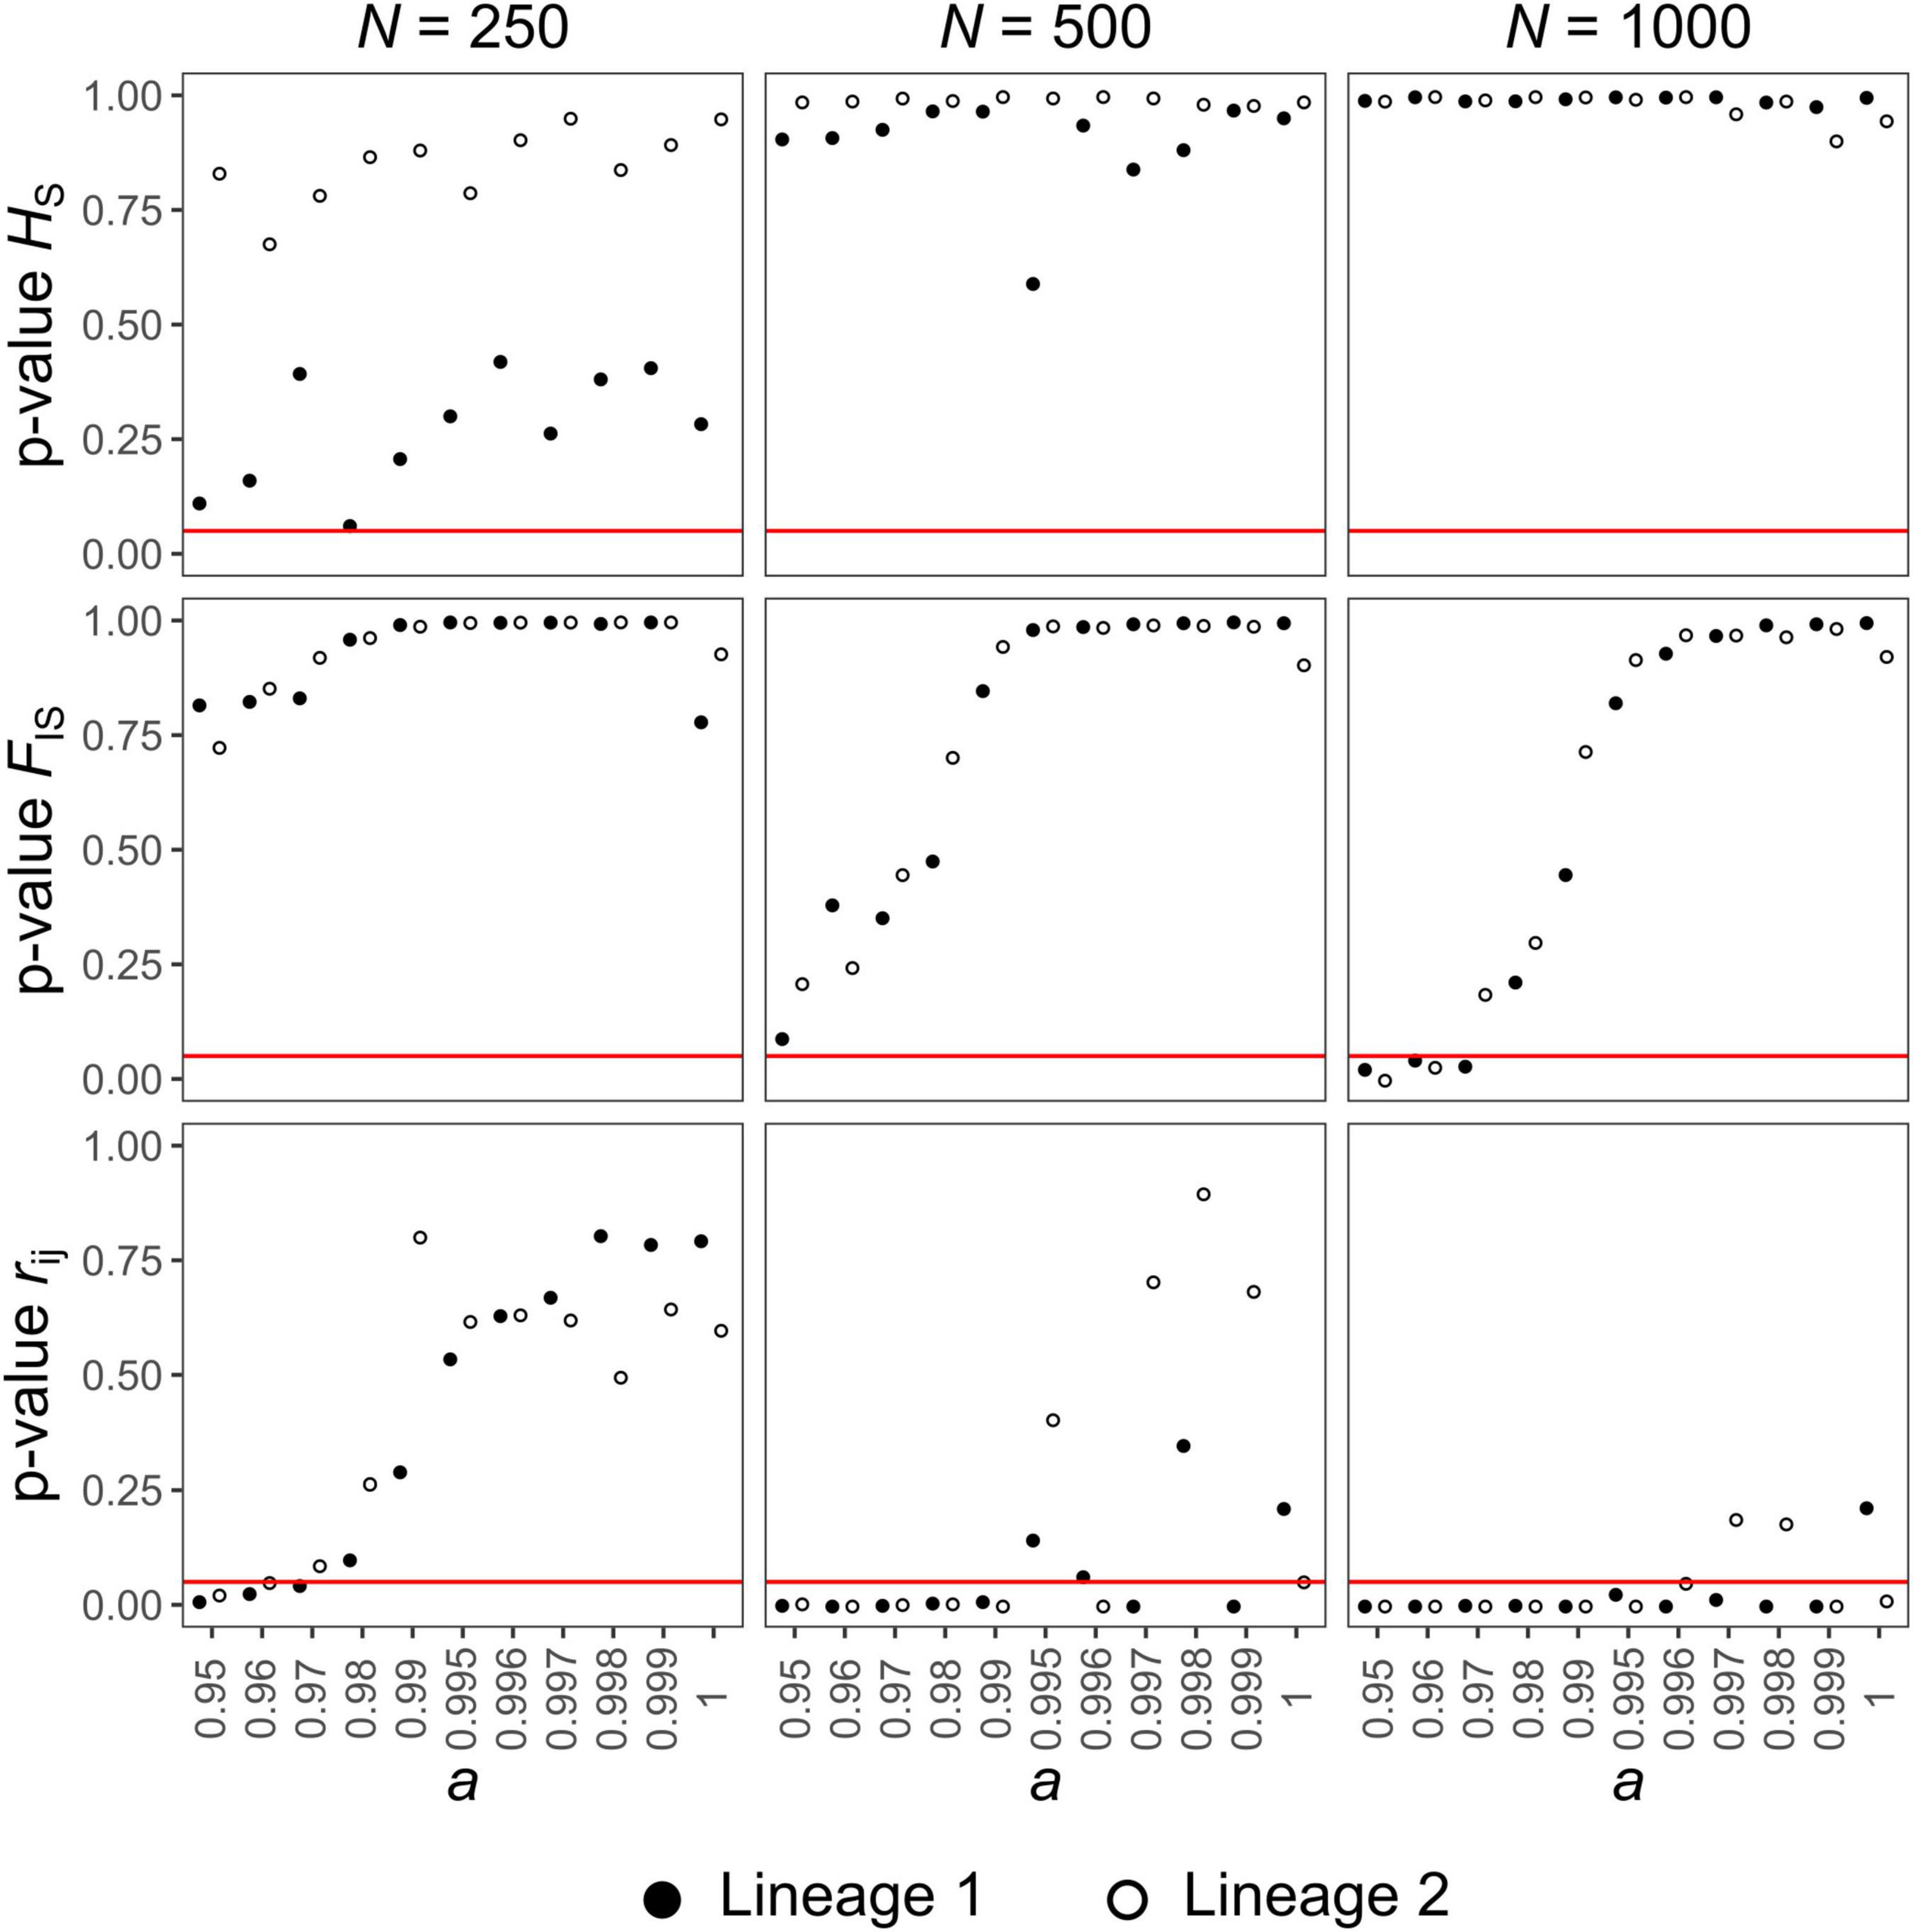
Figure 5. Test of consistency of the C. mauritanica population genetic structure with respect to simulated data under varying parameters (rate of automixis: a and population size: N), considering the population heterozygosity (HS), the individual inbreeding coefficient (FIS) and the distribution of pairwise relatedness coefficients between individuals (rij) as test statistics. For each combination of simulated parameters, a p-value indicates whether the statistic of the empirical data departs significantly from the distribution of the statistic obtained by simulation (when the p-value is below the α threshold set to 0.05). Hybridogenetic lineages 1 (black dots) and 2 (white dots) were analyzed separately. Three population sizes were investigated: N = 250, 500, and 1000. Simulated data were generated without migration (m = 0). The red line corresponds to the α threshold (0.05).
For all parameters investigated (N, m and a), simulations’ compatibility was mostly governed by the distribution of rij which appeared much more stringent than HS and FIS. Indeed, according to the later statistics, all investigated a (i.e., sexual reproduction ≤ 5%) fitted the empirical data for N = 250 (Figure 5 and Supplementary Figure 3). This similarity between simulated and empirical data was, however, limited for HS in lineage 1 when m = 0, whatever the value of a (Figure 5).
For N = 500 and 1 000, the lower compatible bound was around a = 95–98% and 98–99.5%, respectively (variations due to m; Figure 5 and Supplementary Figure 3). Although the influence of m on the compatibility was limited, growing values of m further restricted the compatible range of a (Supplementary Figure 3).
Incompatible simulated rij distributions typically had rij coefficients that were more centrally distributed around 0 and did not display a clear bimodal distribution (Figure 4 and Supplementary Figure 4). Differences between empirical and simulated rij distributions mainly came from the proportions of rij close to 0 (higher than empirical for incompatible simulations) and close to 1 (lower than empirical for incompatible simulations). These discrepancies were strengthened with increasing N and m (Figure 5 and Supplementary Figure 3). For FIS and HS, the fit of the simulations to the empirical data was mainly driven by a few markers (variable between lineages) whose empirical values were met by simulations under a restricted range of parameters. The empirical FIS of markers Cc11 (lineage 1 and 2), Ch08 (lineage 1) and Ch11 (lineage 2) were typically too negative for simulations with a below 0.98–0.99 (FIS Cc11 – lineage 1 = −0.14, FIS Cc11 – lineage 2 = −0.15, FIS Ch11 – lineage 2 = −0.23 and FIS Ch08 – lineage 2 = −0.24; Supplementary Figure 5 and Supplementary Table 2). For HS, the values simulated with N = 250 and m = 0 for marker Ch12 and Cc11 in lineage 1 were typically lower than their empirical counterparts, over the whole a range investigated (HS Ch12 – lineage 1 = 0.81and HS Cc11 – lineage 1 = 0.83; Supplementary Table 2). This behavior was only marginally observed in lineage 2 with the marker Cc54 (HS Cc54 – lineage 2 = 0.83; Supplementary Table 2). This difference likely originates from the reduced allelic diversity of lineage 2 (Supplementary Table 1).
Altogether, these results show that, for the two hybridogenetic lineages, our simulations generated levels of genetic diversity similar to that of the empirical data according to the statistics investigated, not only with pure automixis but also with 1–2% of sexual reproduction.
Discussion
Impact of Occasional Sex on the Genetic Structure of Predominantly Automictic Populations
In the first part of this study, we used both analytical approach and stochastic individual-based simulations to describe the dynamics of genetic diversity in mixed sexual-automictic populations. Our results show that the impact of sexual reproduction in partially automictic populations greatly differs according to the mode of ploidy restoration and the recombination rates of the investigated loci. For organisms reproducing through central fusion automixis, mixed populations are hardly distinguished from purely sexual ones until sexual reproduction becomes rare (a > 0.95) as long as the recombination rate (and so the heterozygosity loss) is relatively low (γ < 0.01). The same pattern was previously demonstrated for populations with a mixed apomictic (γ = 0) – sexual reproductive system (Balloux et al., 2003). For very high rates of parthenogenesis, however, apomixis and automixis (with central fusion) differently affect the population genetic diversity. The former should indefinitely increase heterozygosity because of the Meselson effect (and the FIS should approach −1), whereas the heterozygosity of the latter will be limited until the recombination rate is higher than the mutation rate (a condition expected for loci located far from the centromere).
The situation appears quite different under higher rates of heterozygosity loss (γ > 0.1), for example under automixis with terminal fusion, gamete duplication or central fusion for loci with high recombination rates. In these cases, the genetic diversity is gradually lost as the rate of automixis increases. The relationship between the statistics and the rate of automixis becomes increasingly linear as γ approaches 1. Thanks to this correlation, the FIS, which is nearly unaffected by the mutation rate for those γ values, provides a valuable tool to detect and quantify the contribution of sexual and automictic reproduction in species with a mixed reproductive system.
The observation of organismal signs of sex (such as rare male production or mating behavior) in typical parthenogenetic organisms does not provide evidence for effective sexual reproduction (Schurko et al., 2009). The situation is even more complicated in species that regularly engage apparent sexual reproduction but where gene transmission is unisexual, as is the case in gynogenetic, androgenetic and hybridogenetic systems (Lehtonen et al., 2013). In these cases, genetic data provide a fruitful alternative to detect rare sexual events because they only reflect effective reproductive events and thus, may help not only to detect but also to quantify the apportionment of sexual and asexual reproduction in populations. However, it is of crucial importance to have a priori knowledge on the reproductive mode of the investigated organisms because it drastically affects how partial sexual reproduction may impact the population genetic structure.
Is There Evidence of Occasional Sexual Production of Queens in Cataglyphis mauritanica?
We investigated, through a simulation approach, whether a fraction of new queens arose from intra-lineage sexual reproduction in the hybridogenetic ant C. mauritanica. Our results show that, regarding the three statistics considered (HS, FIS and rij), genotypic datasets simulated with a small or null proportion of sexual reproduction (98% ≤ a ≤ 100%) generated similar patterns of genetic diversity as the empirical genotypic dataset. For HS and FIS, these results were consistent, although not strictly identical, across the investigated populations sizes and migration rates. For rij, however, the fit between the simulated and the empirical data was mostly restricted to a population size of 250 queens. In this case, the empirical sample size (n = 168 and 159 queens for lineages 1 and 2, respectively) would correspond to 2/3 of the population size of each lineage. This is plausible (at least with the contemporary aspect of the population) since the sampling of Kuhn et al. (2017) was extensive and the population studied was surrounded by woods on a large portion of its area, where colony density was much lower (Kuhn A. pers. obs.). According to HS, the fit of the simulations with this population size was, however, limited for lineage 1 when no migration occurred. This is likely due to the prominent role of genetic drift with restricted population size. This genetic drift might be counterbalanced by a larger population size for lineage 1, but rij is mostly incompatible with N = 500 and 1000, especially for lineage 1. Alternative, non-mutually exclusive, explanations are non-null migration rate and/or higher mutation rates for markers driving the incompatibility.
Interestingly, simulations with 100% of asexual reproduction were also compatible with the genetic diversity observed in natural populations of C. mauritanica. This confirms that purely automictic populations can indeed maintain relatively high levels of genetic diversity (Engelstädter, 2017). Altogether, these results suggest that rare sexual reproduction events possibly contribute to the production of new queens through intra-lineage mating in C. mauritanica, even though our data do not allow us to discard the hypothesis of 100% automixis. The use of a larger set of molecular markers randomly distributed in the genome would be necessary to achieve higher resolution.
In light of our results, the persistence of social hybridogenesis over evolutionary times remains elusive. The fitness perspective of males appears highly restricted with a maximum contribution of 1% to queen production, which is probably insufficient to counteract the cost of male production. Occurrence of rare sex could nevertheless be a piece of the puzzle for explaining lineages consistency. In C. hispanica and C. velox, the pairs of hybridogenetic lineages are congruent over the whole species’ range (Darras et al., 2014b, 2019). Such a pattern might result from regular gene flow within each lineage through intra-lineage sexual production of new queens. Without such gene flow, one would expect to have as much divergence between lineages from a same population than with either lineage from another, geographically remoted, population.
In conclusion, our theoretical study shows that variation of neutral genetic diversity in populations with mixed sexual and automictic parthenogenetic reproductive strategies depends on the mode of ploidy restoration of automixis, hence on the rate of heterozygosity loss. When this rate is low, mixed populations behave like purely sexual ones until sex becomes rare. In contrast, for high rates of heterozygosity loss, the erosion of genetic diversity is tightly correlated to the rate of sex and the individual inbreeding coefficient may provide a reliable indicator on the population level of sexual/asexual reproduction. By comparing empirical and simulated datasets, we also show that full parthenogenesis or rare events of sexual reproduction may account for the level of genetic diversity observed in natural populations of the hybridogenetic ant Cataglyphis mauritanica. This result provides an additional clue on a reasonable way out to the apparent evolutionary dead-end faced by males of hybridogenetic Cataglyphis.
Data Availability Statement
The original contributions presented in the study are included in the article/Supplementary Material, further inquiries can be directed to the corresponding author. R code is available at https://github.com/alexkuhn89/cryptic_sex_simulations.
Author Contributions
AK and OH designed the research, developed the models and simulations, and performed the analyses. AK, OH, and SA wrote the manuscript. All authors contributed to the article and approved the submitted version.
Funding
This work was supported by the Fonds de la Recherche Scientifique de Belgique (F.R.S.-FNRS; Ph.D. fellowships to AK and PDR Grant No. X.3040.17 to OH), a grant from the Fonds Van Buuren-Jaumotte-Demoulin (AK), and financial support from the Fondation Universitaire de Belgique.
Conflict of Interest
The authors declare that the research was conducted in the absence of any commercial or financial relationships that could be construed as a potential conflict of interest.
Publisher’s Note
All claims expressed in this article are solely those of the authors and do not necessarily represent those of their affiliated organizations, or those of the publisher, the editors and the reviewers. Any product that may be evaluated in this article, or claim that may be made by its manufacturer, is not guaranteed or endorsed by the publisher.
Acknowledgments
We thank C. Kastally for its kind assistance in implementing simulations on R. Computational resources have been provided by the Consortium des Équipements de Calcul Intensif (CÉCI), funded by the Fonds de la Recherche Scientifique de Belgique (F.R.S.-FNRS) under Grant No. 2.5020.11, and by the Walloon Region.
Supplementary Material
The Supplementary Material for this article can be found online at: https://www.frontiersin.org/articles/10.3389/fevo.2021.741959/full#supplementary-material
References
Ali, S., Soubeyrand, S., Gladieux, P., Giraud, T., Leconte, M., Gautier, A., et al. (2016). CLONCASE?: estimation of sex frequency and effective population size by clonemate resampling in partially clonal organisms. Mol. Ecol. Resour. 16, 845–861. doi: 10.1111/1755-0998.12511
Balloux, F., Lehmann, L., and de Meeûs, T. (2003). The population genetics of clonal and partially clonal diploids. Genetics 164, 1635–1644. doi: 10.1093/genetics/164.4.1635
Bates, D., Mullen, K., Nash, J., and Varadhan, R. (2015). Minqa: Derivative-Free Optimization Algorithms by Quadratic Approximation (R Package Version 1.2.4). Vienna: R Foundation for Statistical Computing.
Bengtsson, B. O. (2003). Genetic variation in organisms with sexual and asexual reproduction. J. Evol. Biol. 16, 189–199. doi: 10.1046/j.1420-9101.2003.00523.x
Booth, W., Smith, C. F., Eskridge, P. H., Hoss, S. K., Mendelson, J. R. III, and Schuett, G. W. (2012). Facultative parthenogenesis discovered in wild vertebrates. Biol. Lett. 8, 983–985.
Cagniant, H. (2009). Le genre Cataglyphis Foerster, 1850 au Maroc (Hyménoptères Formicidae). Orsis 24, 041–071.
Darras, H., Kuhn, A., and Aron, S. (2014a). Genetic determination of female castes in a hybridogenetic desert ant. J. Evol. Biol. 27, 2265–2271. doi: 10.1111/jeb.12470
Darras, H., Leniaud, L., and Aron, S. (2014b). Large-scale distribution of hybridogenetic lineages in a Spanish desert ant. Proc. R. Soc. B. 281:20132396. doi: 10.1098/rspb.2013.2396
Darras, H., Kuhn, A., and Aron, S. (2019). Evolution of hybridogenetic lineages in Cataglyphis ants. Mol. Ecol. 28, 3073–3088. doi: 10.1111/mec.15116
Decaestecker, E., De Meester, L., and Mergeay, J. (2009). “Cyclical parthenogenesis in Daphnia: sexual versus asexual reproduction,” in Lost sex, eds I. Schön, K. Martens, and P. Dijk (Dordrecht: Springer), 295–316. doi: 10.1007/978-90-481-2770-2_15
Ellegren, H. (2004). Microsatellites: simple sequences with complex evolution. Nat. Rev. Genet. 5, 435–445. doi: 10.1038/nrg1348
Engelstädter, J. (2017). Asexual but not clonal: evolutionary processes in automictic populations. Genetics 206, 993–1009. doi: 10.1534/genetics.116.196873
Eyer, P. A., Leniaud, L., Darras, H., and Aron, S. (2013). Hybridogenesis through thelytokous parthenogenesis in two Cataglyphis desert ants. Mol. Ecol. 22, 947–955. doi: 10.1111/mec.12141
Goldstein, D. B., and Schötterer, C. (1999). Microsatellites: Evolution and Applications. Oxford: Oxford University Press.
Haccou, P., and Schneider, M. V. (2004). Modes of reproduction and the accumulation of deleterious mutations with multiplicative fitness effects. Genetics 166, 1093–1104. doi: 10.1093/genetics/166.2.1093
Halkett, F., Simon, J., and Balloux, F. (2005). Tackling the population genetics of clonal and partially clonal organisms. Trends Ecol. Evol. 20, 194–201. doi: 10.1016/j.tree.2005.01.001
Hardy, O. J., and Vekemans, X. (2002). SPAGeDi: a versatile computer program to analyse spatial genetic structure at the individual or population levels. Mol. Ecol. Notes 2, 618–620. doi: 10.1046/j.1471-8286.2002.00305.x
Kuhn, A., Bauman, D., Darras, H., and Aron, S. (2017). Sex-biased dispersal creates spatial genetic structure in a parthenogenetic ant with a dependent-lineage reproductive system. Heredity 119, 207–213. doi: 10.1038/hdy.2017.34
Kuhn, A., Darras, H., and Aron, S. (2018). Phenotypic plasticity in an ant with strong caste–genotype association. Biol. Lett. 14:20170705. doi: 10.1098/rsbl.2017.0705
Kuhn, A., Darras, H., Paknia, O., and Aron, S. (2020). Repeated evolution of queen parthenogenesis and social hybridogenesis in Cataglyphis desert ants. Mol. Ecol. 29, 549–564. doi: 10.1111/mec.15283
Lehtonen, J., Schmidt, D. J., Heubel, K., and Kokko, H. (2013). Evolutionary and ecological implications of sexual parasitism. Trends Ecol. Evol. 28, 297–306. doi: 10.1016/j.tree.2012.12.006
Leniaud, L., Darras, H., Boulay, R., and Aron, S. (2012). Social Hybridogenesis in the clonal ant Cataglyphis hispanica. Curr. Biol. 22, 1188–1193. doi: 10.1016/j.cub.2012.04.060
Li, C., Weeks, D., and Chakravarti, A. (1993). Similarity of DNA fingerprints due to chance and relatedness. Hum. Hered. 43, 45–52. doi: 10.1159/000154113
Mogie, M. (1986). Automixis: its distribution and status. Biol. J. Linn. Soc. 28, 321–329. doi: 10.1111/j.1095-8312.1986.tb01761.x
Nei, M., and Chesser, R. K. (1983). Estimation of fixation indices and gene diversities. Ann. Hum. Genet. 47, 253–259. doi: 10.1111/j.1469-1809.1983.tb00993.x
Pearcy, M., Hardy, O. J., and Aron, S. (2006). Thelytokous parthenogenesis and its consequences on inbreeding in an ant. Heredity 96, 377–382. doi: 10.1038/sj.hdy.6800813
Pearcy, M., Hardy, O. J., and Aron, S. (2011). Automictic parthenogenesis and rate of transition to homozygosity. Heredity 107, 187–188. doi: 10.1038/hdy.2010.172
Poole, W. (2018). Empirical Brown’s Method: Uses Brown’s Method to Combine P-Values from Dependent Tests. R Package Version 1.9.0.
Poole, W., Gibbs, D. L., Shmulevich, I., Bernard, B., and Knijnenburg, T. A. (2016). Combining dependent P-values with an empirical adaptation of Brown’s method. Bioinformatics 32, i430–i436. doi: 10.1093/bioinformatics/btw438
R Core Team (2018). R: A Language and Environment for Statistical Computing. Vienna: R Foundation for Statistical Computing.
Reichel, K., Masson, J.-P., Malrieu, F., Arnaud-Haond, S., and Stoeckel, S. (2016). Rare sex or out of reach equilibrium? The dynamics of FIS in partially clonal organisms. BMC Genet. 17:76. doi: 10.1186/s12863-016-0388-z
Schurko, A. M., Neiman, M., and Logsdon, J. M. (2009). Signs of sex: what we know and how we know it. Trends Ecol. Evol. 24, 208–217. doi: 10.1016/j.tree.2008.11.010
Schwander, T., and Crespi, B. J. (2009). Multiple direct transitions from sexual reproduction to apomictic parthenogenesis in Timema stick insects. Evolution 63, 84–103. doi: 10.1111/j.1558-5646.2008.00524.x
Schwander, T., and Keller, L. (2012). Evolution: sociality as a driver of unorthodox reproduction. Curr. Biol. 22, R525–R527. doi: 10.1016/j.cub.2012.05.042
Simon, J.-C., Rispe, C., and Sunnucks, P. (2002). Ecology and evolution of sex in aphids. Trends Ecol. Evol. 17, 34–39. doi: 10.1016/S0169-5347(01)02331-X
Stenberg, P., and Saura, A. (2009). “Cytology of asexual animals,” in Lost sex, eds I. Schön, K. Martens, and P. Dijk (Dordrecht: Springer), 63–74.
Suomalainen, E., Saura, A., and Lokki, J. (1987). Cytology and Evolution in Parthenogenesis. Boca Raton, FL: CRC Press.
Templeton, A. R., Carson, H. L., and Sing, C. F. (1976). The population genetics of parthenogenetic strains of Drosophila mercatorum. II. The capacity for parthenogenesis in a natural, bisexual population. Genetics 82, 527–542. doi: 10.1093/genetics/82.3.527
Vallejo-Marín, M., Dorken, M. E., and Barrett, S. C. (2010). The ecological and evolutionary consequences of clonality for plant mating. Annu. Rev. Ecol. Evol. Syst. 41, 193–213. doi: 10.1146/annurev.ecolsys.110308.120258
Keywords: cryptic sex, mixed reproductive system, population genetic model, automixis, Cataglyphis, social hybridogenesis
Citation: Kuhn A, Aron S and Hardy OJ (2021) Detection of Cryptic Sex in Automictic Populations: Theoretical Expectations and a Case Study in Cataglyphis Desert Ants. Front. Ecol. Evol. 9:741959. doi: 10.3389/fevo.2021.741959
Received: 15 July 2021; Accepted: 02 November 2021;
Published: 22 November 2021.
Edited by:
Alexey Yanchukov, Bülent Ecevit University, TurkeyReviewed by:
Eugenio López-Cortegano, University of Edinburgh, United KingdomSara Helms Cahan, University of Vermont, United States
Copyright © 2021 Kuhn, Aron and Hardy. This is an open-access article distributed under the terms of the Creative Commons Attribution License (CC BY). The use, distribution or reproduction in other forums is permitted, provided the original author(s) and the copyright owner(s) are credited and that the original publication in this journal is cited, in accordance with accepted academic practice. No use, distribution or reproduction is permitted which does not comply with these terms.
*Correspondence: Alexandre Kuhn, YWxleGt1aG44OUBnbWFpbC5jb20=