 Stapana Kongsen1
 Sumet Phantuwongraj1*
 Montri Choowong1*
 Sakonvan Chawchai1
 Nikhom Chaiwongsaen2
 Supawich Fuengfu2
 Doan Thi Anh Vu3
 Dinh Quoc Tuan4Frank Preusser5
- 1Morphology of Earth Surface and Advanced Geohazards in Southeast Asia Research Unit (MESA RU), Department of Geology, Faculty of Science, Chulalongkorn University, Bangkok, Thailand
- 2Independent Researcher, Bangkok, Thailand
- 3Department of Mineralogy and Petrology, Faculty of Geology, University of Science, Vietnam National University, Ho Chi Minh City (VNU-HCM), Ho Chi Minh City, Vietnam
- 4Department of Marine Geology and Petroleum Geology, Faculty of Geology, University of Science, Vietnam National University, Ho Chi Minh City (VNU-HCM), Ho Chi Minh City, Vietnam
- 5Institute of Earth and Environmental Sciences, University of Freiburg, Freiburg im Breisgau, Germany
Sedimentary evidence of storms and fluvial floods (FFs) is crucial for a better understanding of such events in coastal zones. In this study, we analyzed the sedimentary characteristics of the coastal storm and FF deposits at the Hoa Duan barrier, Thua Thien Hue, central Vietnam. Analyses of the sedimentary structures and properties (grain size distribution, composition, roundness, and sphericity) and loss on ignition revealed that the storm sediments were comprised of coarser grains with a low organic and carbonated content, and with sedimentary structures, including parallel and inclined landward lamination, multiple sets of normal and reverse grading, mud rip-up clasts, and sharp and erosional contacts (both top and bottom) with finer-grain layers. Conversely, the FF sediments had only fine to very fine grains, with dominant high organic and carbonate contents, and only exhibited sedimentary structures of sharp erosional top and bottom contacts with coarser-grained layers. The clearest differentiation to distinguish coastal storm layers from inland FF layers was obtained by plotting the mean grain size against the sorting. The results of optically stimulated luminescence dating suggested that two storm layers and one FF layer were deposited during the last 130 ± 10 years. Moreover, two layers were deposited by storms and one by a FF prior to that (>130 ± 10 years). The identification of the sedimentary diagnostic key of these two hazards can help to improve the understanding of the geomorphological evolution of the studied site and the other parts of this coastal region in order to remind the coastal community to prepare for future coastal hazards well.
Introduction
For the past two decades, the global mean sea level (msl) has been rising at an average rate of 2.9 mm per year (Nerem et al., 2018). Such an increase will result in the permanent and periodic inundation of low-lying areas, increased erosion, saltwater intrusion, and damage to physical infrastructures (Gornitz, 1991; McGranahan et al., 2007). Currently, the low-lying coastal communities are vulnerable to sea-level rise and stronger storms brought on by climate change due to global warming (McGranahan et al., 2007; Cui et al., 2015; Bevacqua et al., 2018; Maanan et al., 2018). Storm wave characteristics and storm surges are also affected by climate change since sea-level rises contribute to increased storm surge events (Hemer et al., 2013; IPCC, 2014; Maanan et al., 2018; Vousdoukas et al., 2020). Coastal areas are one of the most densely populated and developed geographical zones of the world (Luijendijk et al., 2018; Vousdoukas et al., 2020). Therefore, coastal hazards, such as coastal storms and erosion, constitute a severe danger to the physical, economic, and social systems of coastal communities (Bevacqua et al., 2018).
Identifying and dating past extreme events (e.g., floods and storm surge) is an important tool to evaluate the vulnerability of a region and ultimately aid in preparing to limit the effects of natural hazards in the future. This is done by investigating and dating the deposits of previous events with regard to their spatial context and nature. Sediment layers formed by storms and fluvial floods (FFs) have been analyzed in a variety of settings around the globe (e.g., Nanayama et al., 2000; Yao et al., 2019) as they should have characteristic sedimentary structures due to differences in the transport process.
For instance, Nanayama et al. (2000) discovered layers of anomalous sediments in the coastal area of Hokkaido, Japan, and classified them as storm, tsunami, and FF using sedimentary structures and grain size characteristics. A 50-cm-thick layer of flood deposits was characterized by light gray sand mixed with gravel, while storm deposits contained marine sand with a foreset bedding structure. The tsunami deposit, which overlaid the storm layer, had a similar thickness (35-cm thick) and contained the same landward thinning geometry. However, the tsunami deposit was comprised of four layers associated with the landward and seaward flows of the two main tsunami waves, while the storm deposit contained a single layer (Nanayama et al., 2000).
Yao et al. (2019) classified the storm deposits and FF deposits (FFDs) induced by a hurricane in the wetland environment of Texas, United States, using sedimentary structure, loss-on-ignition (LOI), and X-ray fluorescence analyses. The flood deposit had a 9-cm-thick layer and was characterized as a light-gray rootless mud underlaid by a 5- to 10-cm-thick layer of the storm deposits (Yao et al., 2019). Khan et al. (2013) investigated the sediments of the 2011 Mississippi River Flood using biological features as indicative of the fluvial origin to distinguish the flood deposit from the presurface sediment. Yamashita et al. (2011) discovered the FFDs on the river mouth from Ise Bay, Central Japan. The layer of the FFD contained muddy particles that covered the sand material of the tidal flat, which was distinguished from the overbank deposit by a sharp basal contact. Yamada et al. (2016) identified the flooding layer of the Abu River in Yamaguchi City, Japan, from an overbank deposit. Their finding indicated the variety of flood sediments, ranging from muddy particles to cobbles.
The often reported characteristics of storm deposits preserved in coastal areas include sharp and erosional contacts, normal and reverse grading, mud rip-up clasts (MRCs), mud laminae, laminated sand, marine shells, marine fossils, and marine microfossils (e.g., Liu and Fearn, 1993, 2000a, b; Donnelly et al., 2001; Liu, 2004, 2007; Donnelly, 2005; Elsner, 2007; Morton et al., 2007; Williams, 2010, 2013; Phantuwongraj and Choowong, 2012; Phantuwongraj et al., 2013; Williams et al., 2016; Kongsen et al., 2021). In contrast, FFDs can usually be identified by sharp and erosional contacts, lamination, cross-bedding, massive mud contents, well-sorted suspended sediment with a rounded shape due to long-distance transport, and a high organic matter (OM) and plant detritus content (e.g., Rubin et al., 1998; Zhu et al., 2005; Yamashita et al., 2011; Khan et al., 2013; Day et al., 2016; Matsumoto et al., 2016; Yamada et al., 2016). However, the individual regional setting (e.g., substrate and coastal geomorphology) might produce specific features that are not generally common.
Vietnam has been severely affected by natural hazards, such as FFs and tropical cyclones, for decades. More than 70% of the severe natural hazards affecting Vietnam are attributed to typhoons, whereas fluvial flooding is the second most frequent event (Imamura and To, 1997). The main cause for the vulnerability of Vietnam to these hazards is its geographical position, with approximately 3,260 km of coastline stretching longitudinally next to the Western Pacific Ocean (Imamura and To, 1997; Larson et al., 2014). This makes the population of Vietnam particularly vulnerable to a sea-level rise, floods, coastal erosion, and tropical cyclones (Imamura and To, 1997; Kleinen, 2002).
On average, Vietnam experiences five to six typhoons every year due to its proximity to significant tropical cyclone genesis zones (Wang et al., 2007) and the influence of the Mei-Yu front (Lee et al., 2006). During the 20th century, about 786 typhoons and tropical storms struck the Vietnamese coast, of which 348 had strong wind speeds (>120 km/h) (Kleinen, 2002). For example, there were two successive typhoons in 1985, starting with typhoon Andy (Category 2 on Saffir-Simpson Hurricane Scale) from October 1 to 3 in central Vietnam (Dong Hai and Le Thuy) (Figure 1A), followed by typhoon Cecil (Category 3 on Saffir-Simpson Hurricane Scale) on October 15 and 16. These were considered the most catastrophic disasters at that time, causing over 1,000 casualties, 276,790 destroyed and damaged houses, and 3,300 wrecked fishing boats (Imamura and To, 1997).
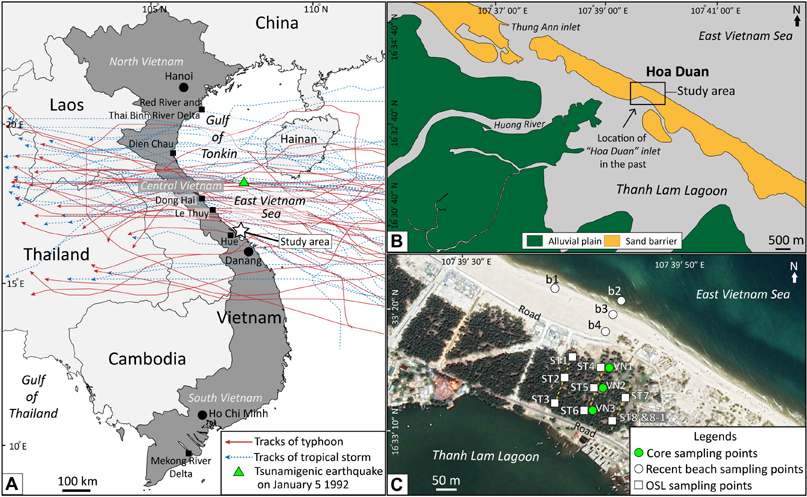
Figure 1. The study site at Hoa Duan, Thua Thein Hua, Central Vietnam. (A) Vietnam with tracks of major tropical storms and typhoons from 1952 to 2019, which mostly moved from east to west. Note that the tracks of tropical storms and typhoons are listed only for those in central Vietnam and are presented in Supplementary Table 2. (B) A geomorphological map of the study site showing the sand barriers, lagoons, alluvial plains, Thuan An inlet, and old Hoa Duan inlet (which was permanently closed), and (C) a close up satellite image from Google Earth of the Hoa Duan barrier showing the sampling points of core samples, OSL dating, and recent shore-normal beach samples.
Twelve years later (1997), tropical storm Linda was described as the most significant storm of the century, causing nearly 800 deaths, 2,132 missing people, and ruining over 300,000 houses (Kleinen, 2002). A severe FF occurred in November 1999 in central Vietnam, affecting numerous areas (IFRC, 2001; Beckman et al., 2002; Vu and Ranzi, 2017; Nga et al., 2018). The number of death was 793, and 52,500 houses were destroyed. Most damages occurred in the Hue region, where precipitation reached record levels of 2,288 mm, exceeding emergency thresholds. With the immense volume of water draining from the Huong River, the cities of Hue were submerged by 1–2 m of flood water, depending on the topography (Beckman et al., 2002). Moreover, apart from natural hazards, Hirai et al. (2008) stated that, if the global warming-induced sea level rise continues unabated, floods like the one in November 1999 will become more common.
Sedimentary records of the past storm and FF events are essential for raising the awareness of people living in low-lying coastal areas. It has to be noted that, until today, very little has been known about the particular characteristics of the storm and fluvial deposits in Vietnam (Mathers and Zalasiewicz, 1999; Williams et al., 2019), and that the history of extreme events in this region is poorly investigated. Therefore, to enhance the understanding of the natural events that deposited material in Vietnam, this study analyzed and provided the distinction between storm surge and FF deposits in the past centuries. The aim of this paper is to characterize the storm and fluvial deposits in central Vietnam, with the main objectives being to (1) present sedimentological classification of the storm, fluvial, and other deposits of the shore-normal processes (recent beach), (2) apply statistical grain size analysis as a sedimentological analog to distinct storm and flood deposits, and (3) use optically stimulated luminescence (OSL) dating to infer the age of the depositional event. This work provides sedimentary evidence of high energy events on the barrier island in Vietnam.
Geological Setting of the Study Area
The study site, with an area of approximately 0.30 km2, is located at Hoa Duan, Thua Thien Hue, central Vietnam (Hoa Duan, Hue City) (Figure 1), and is part of a 38-km-long barrier island that lies in a northwest-southeast direction. This barrier is narrow at the north, at about 300 m in width, and wider at the south, at about 4-km width. Elevation of the ground surface is low in the north at about 1–2 m above (a) msl and then rapidly increasing due to the change of topography from a coastal plain to sand dunes with an average height of about 15 m. The coast of the study area lies in a northeast direction, flanked by the East Vietnam Sea at the front with a large lagoon (Ðầm Thanh Lam) at the back. The lagoon water, with an average depth of only 1 to 2 m is usually connected to the East Vietnam Sea by the Thuan An inlet, which is located near the mouth of the Huong River (Hirai et al., 2008). The tidal range in the region is about 0.4 m and is, thus, categorized as a microtidal system. The study area is influenced by the monsoon climatic regime that is responsable for the rainy and dry seasons in this area. From mid-October to February, the northeast monsoon that passes the South China Sea brings abundant precipitation to the coastal area. The flood season usually occurs from September through December due to the northeast winds and typhoons. Subsequently, the southwest monsoon, from May to September, usually generates hot weather due to the southwest winds drying out after passing the high mountain range of the country (Nghiem et al., 2007). Therefore, the rainfall also decreased during the dry season.
Field investigations were carried out from January 8 to 15, 2019, after the end of the typhoon season (Larson et al., 2014). During the investigations, destroyed buildings and erosional marks on beach scarps were observed, indicating the highest wave impact during the preceding monsoon period (Figures 2A–C). The sediment investigated here was mainly sand (Figure 2D), which has differences in grain size. Finer-grained sediment was found on the surface in some areas, particularly at low-relief topography. Most of the surface was vegetated with grass. The highest point of the area is 2.5 m above the mean tide level (amtl) (Figure 2E). There was almost no anthropogenic modification in the study area, except for conifers planted along the barrier. However, outside the study area, a built-up area of coastal communities, restaurants, hotels, and resorts was found throughout the barrier island. In the northwest, there was a breach from the flood in November 1999 (Lam et al., 2007), which left an ephemeral inlet connecting Thanh Lam Lagoon and the East Vietnam Sea until it closed in 2001. This breach at Hoa Duan was the consequence of a washout process caused by a flood event that included more than 2,000 mm of rain in a week and an unusually high-water level in the lagoon of about 4-m amsl (Hirai et al., 2008). According to the study of Nguyen Huu and Duong (2015), flooding in 1999 completely devastated this area, destroying 13.2 hectares and consequently forming a new inlet at Hoa Duan.
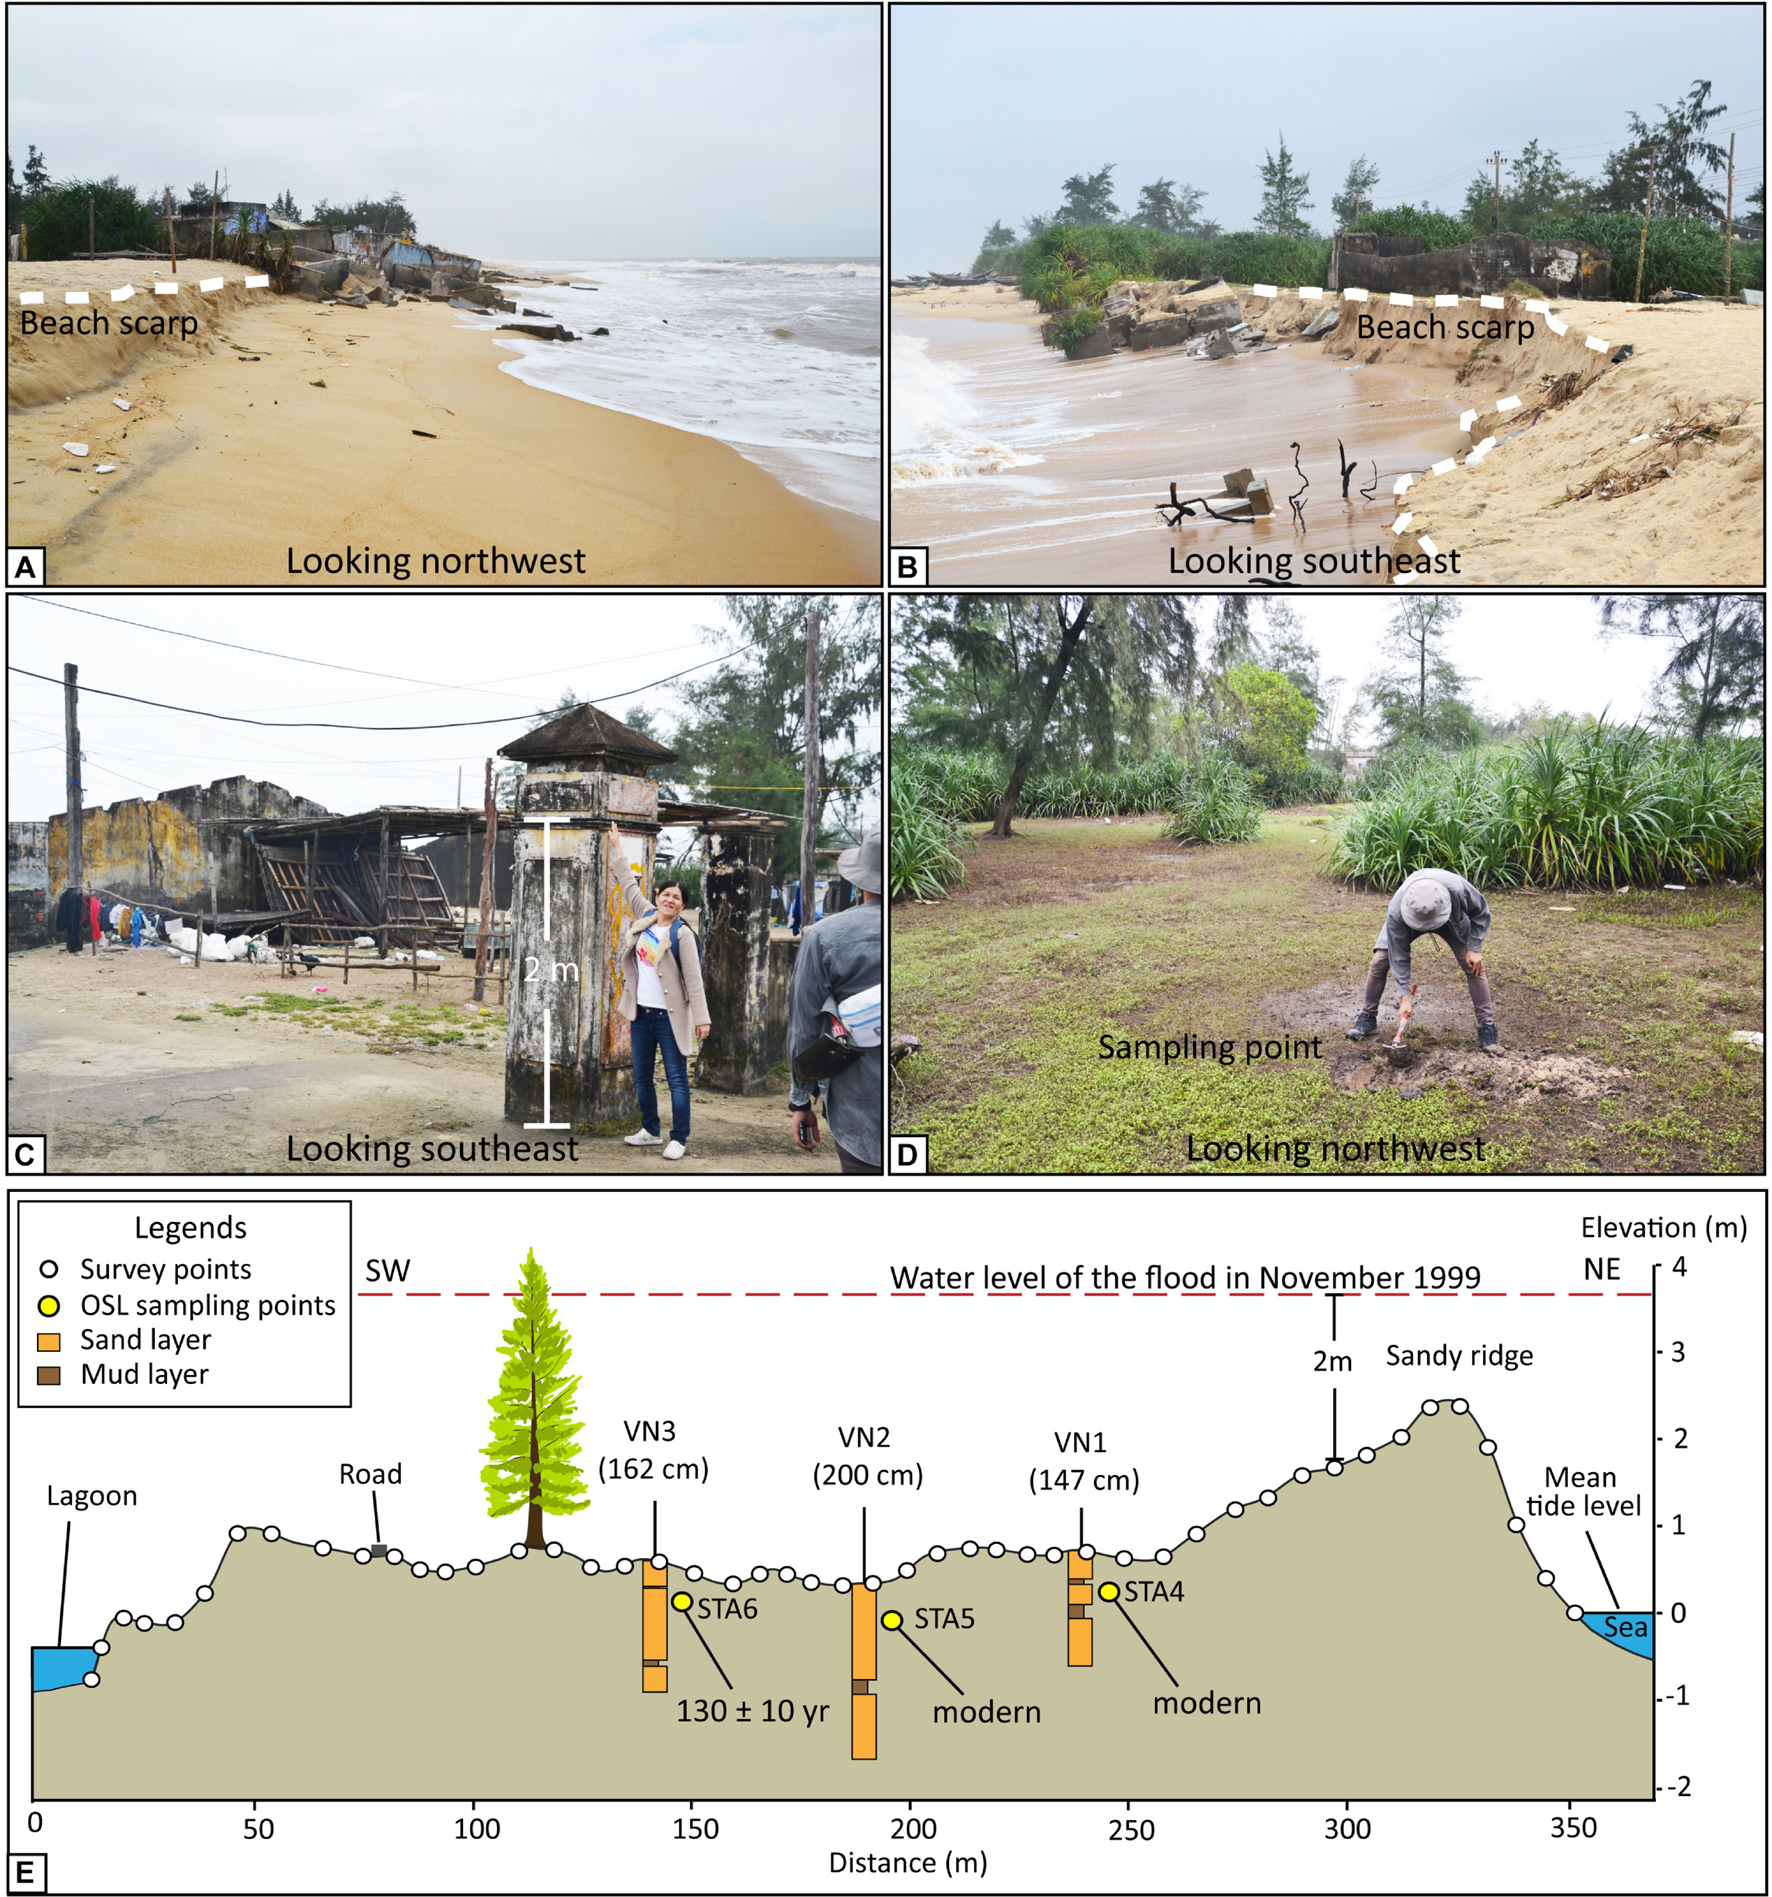
Figure 2. Hoa Duan barrier. (A,B) Beach scarps and derelict buildings resulting from wave erosion during the typhoon season that indicated the maximum wave height during the typhoon season. (C) A local villager showing a water mark level of the flood in November 1999 (2 m). (D) The VN1 and ST4 sampling points in the low topography of the Hoa Duan barrier. (E) Cross-section of Hoa Duan, measured using a total station survey camera, coupled with core locations with depth and the OSL ages (a yellow circle). A dashed red line indicates the water level of the flood in November 1999 that inundated this area (2-m depth). The OSL dating of STA4, STA5, and STA6 indicated the depositional ages as modern, modern, and 130 ± 10 years, respectively. The modern age means less than 100 years. The correlations are presented in detail in Figure 3. All photos were taken on January 12, 2019.
According to the historical records, the barrier here is associated with the closing and opening of the Hoa Duan and Thuan An inlets (Figure 1B; Lam et al., 2007; Schweyer, 2018). Lam et al. (2007) stated that the Hoa Duan inlet first opened in AD 1404 and closed in AD 1467, and then reopened in AD 1498 and closed again in AD 1909, and opened once again from the flood in November 1999 and most recently closed in 2001. Based on the historical record representing the existence of the barrier (Lam et al., 2007; Schweyer, 2018), the sea-level history of the area can be inferred from the location of the barrier, which has changed slightly in the centennial scale.
Approach and Methods
Topographic Survey and Stratigraphy
At the barrier beach ridge, a transect was mapped perpendicular to the East Vietnam Sea (northeast), drawn from the sea level to the Ðầm Thanh Lam lagoon (southwest) (Figures 1B,C). Topographic measurement of this transect was conducted using a total station survey camera SOKKIA (SET630R) to obtain its true elevation with reference to the water table of the Dong Ha meteorological station at the time of surveying. A handheld GPS was used to provide reference points of all stations. The accuracy of distance measurement using the fine average measurement mode with a prism was ± (2 + 2 ppm X D) mm (Kongsen et al., 2021). Tidal ranges of the area were established, including the mean tide, high tide, and low tide, by converting elevation into meters amsl, following the method of Williams et al. (2016).
Additionally, three cores were collected inland at 50-m intervals along the transect and designated as VN1, VN2, and VN3 (Figures 1C, 2E). Before coring, 40- to 50-cm-deep pits (Pit1, Pit2, and Pit3; Figure 3) were dug at each station to examine the deposition profile and prepare for the OSL sample collection. Pits could not be more profound because of the water table. Subsequently, three-inch-diameter plastic tubes were percussed from the ground surface to collect core samples, which were cleaned, sealed with duct tape, and, once secured, the cores were cut into two halves, photographed, logged, and sampled. In addition to collecting core samples, sediment samples from the shore-normal processes at the beach were also collected at the ground surface for comparing the sedimentary properties with the storm and FFDss and were designated as b1, b2, b3, and b4 (Figure 1C).
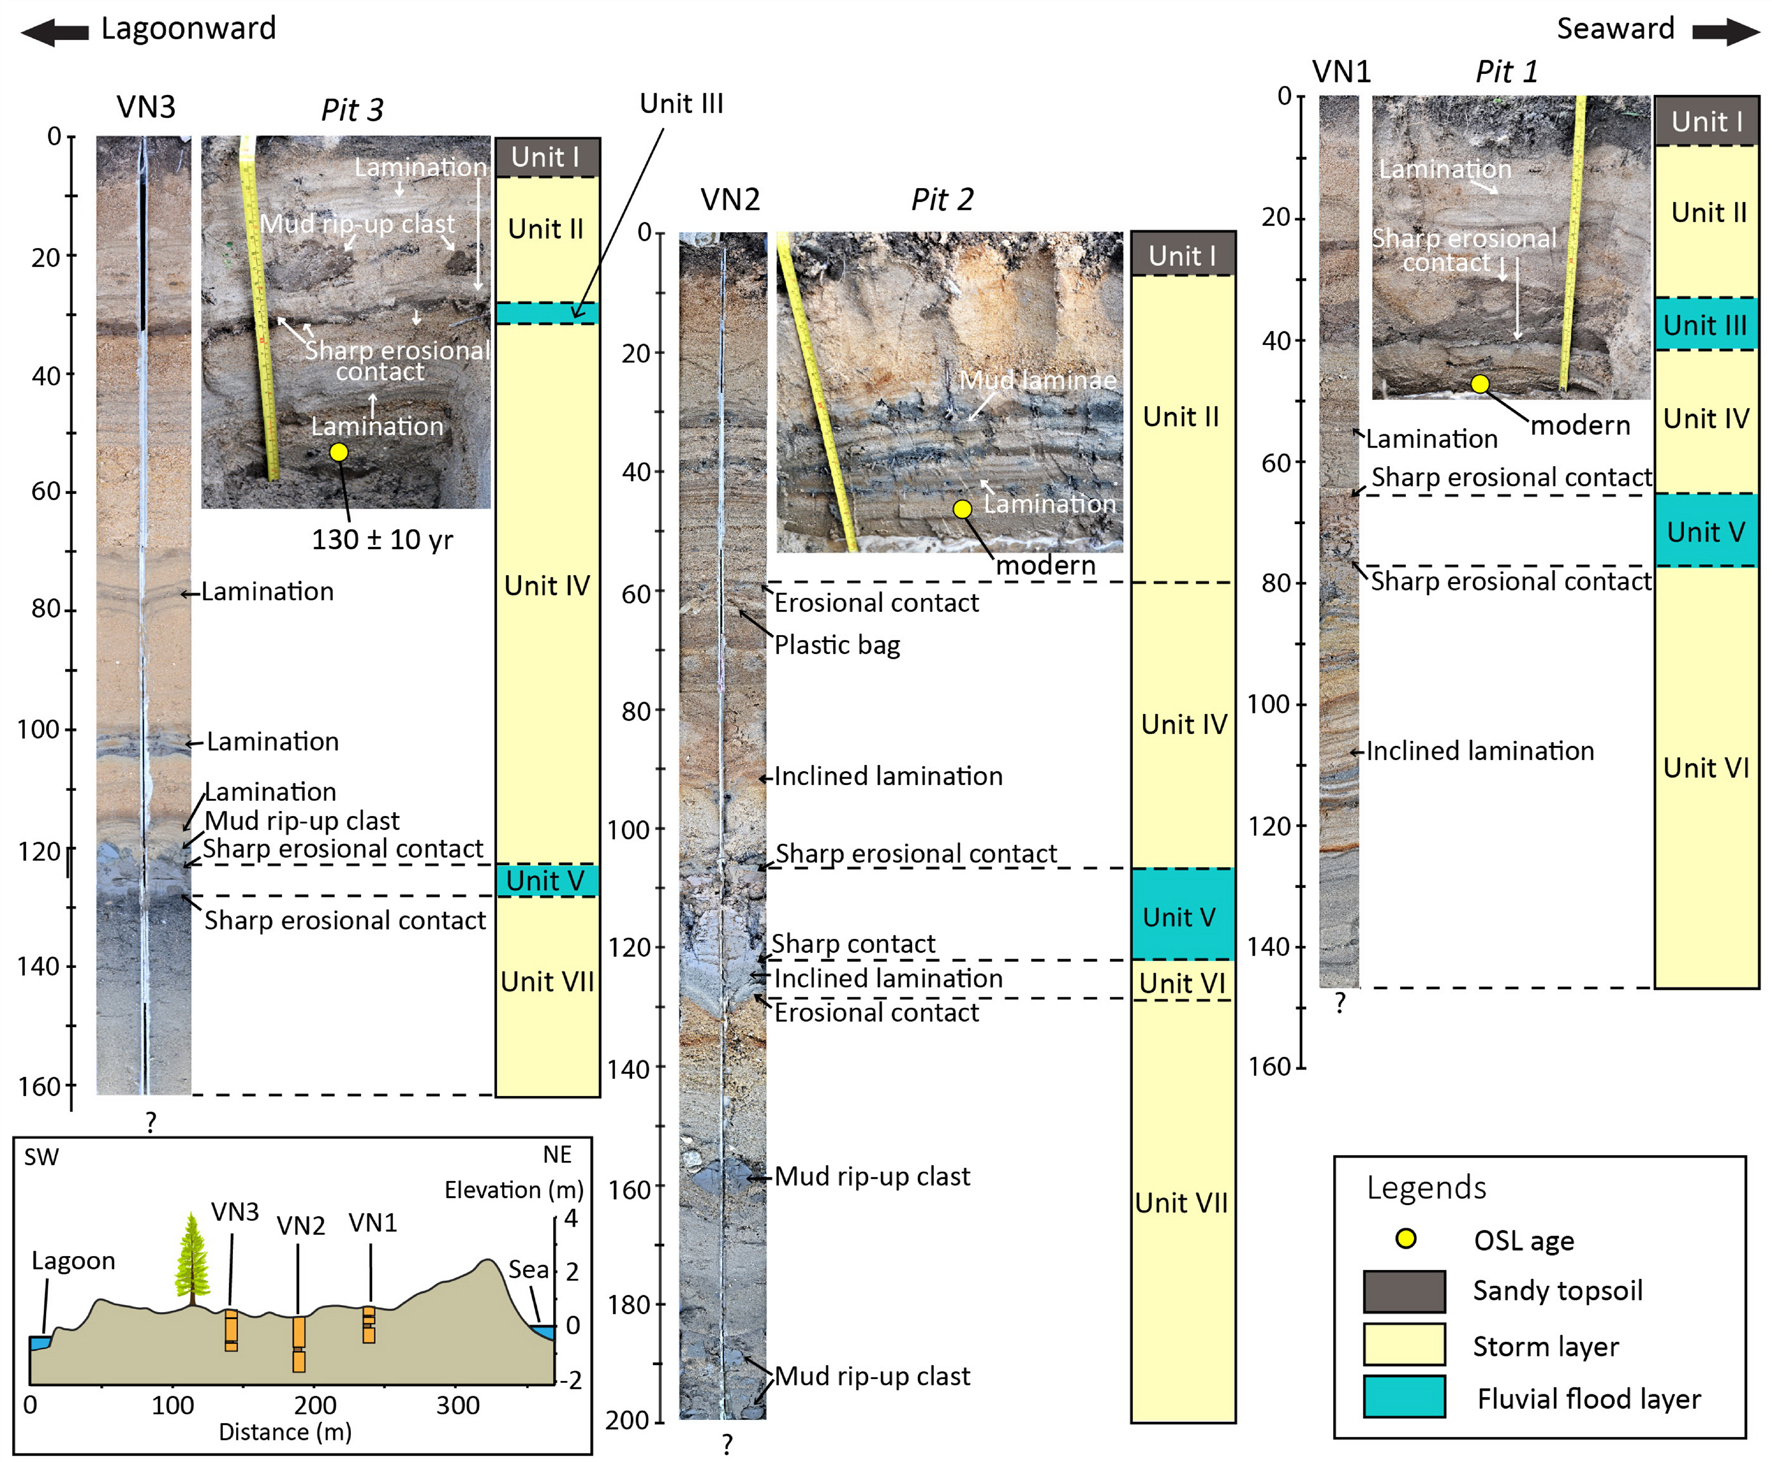
Figure 3. Cores VN1, VN2, and VN3 and pits of VN1, VN2. and VN3 represent the units of deposition between the storm and FF layers with the dominant sedimentary structures. Units II, IV, VI, and VII, which were considered to be the storm layers, mostly contained sharp basal contact and inclined and parallel lamination, whereas Units III and V, classified as the FF layers, were characterized as a mud grain layer with sharp, erosional top, and bottom contacts. The absence of the FF layer (Unit III) in core VN2 and Pit VN2 resulted from the erosion of the storm event in Unit II. Note that the distance interval of each core is 50 m, and the elevation of cores is based on the topographic elevation. A yellow circle in Pit 1, Pit 2, and Pit 3 indicates the OSL ages, whereas the modern age in Pit 1 and Pit 2 means less than 100 years.
Sedimentology and Loss-on-Ignition
Sediments in the cores were collected at 0.5- to 1-cm intervals for a layer from the top to the bottom, especially in places where the distinctive sedimentary structures of the sediments were observed, such as planar lamination or parallel lamination. Samples were separated into pairs of subsamples for physical property analysis.
Physical properties of the sediments, such as composition (Fritz and Moore, 1988; Rothwell, 1989; Rosenthal et al., 2018), roundness, and sphericity (Powers, 1953) were observed under a microscope and photographed. For grain size analysis, the sediment samples were analyzed using Mastersizer 3000 (Malvern Instruments Limited, Malvern, United Kingdom). Each 1 cm interval of the sand sample was put in water. Laser obscuration was set between 5 and 15%. Before measuring, ultrasound was used for 10 s to disperse the finer grains surrounding each sand grain. Each sample was run three times and then averaged. The average data of each sample were calculated in GRADISTAT Version 8 (Blott and Pye, 2001) using the logarithmic method of moment (Folk and Ward, 1957).
Various statistical parameters, including the mean grain size, sorting, skewness, and kurtosis, were calculated. Mean grain size can be used to identify the type of sediment according to the Wentworth scale (Wentworth, 1922). Sorting was used to measure the distribution of grain sizes from the mean. Skewness refers to the asymmetry of a given frequency distribution, in which a positive value specifies a coarse-dominated sample, whereas a negative value indicates a fine-dominated sample (Folk and Ward, 1957). Kurtosis indicates the concentration of grains relative to the average (Blott and Pye, 2001). It is similar to standard deviation in that high values indicate well-sorted distributions, while low values indicate a poor distribution (Cadigan, 1961). Also, a high kurtosis tends to match normal (mesokurtic) to very highly peaked distribution curves, while a low kurtosis indicates flattened distribution curves (platykurtic).
The LOI was used to determine the organic and carbonate contents. For the LOI analysis, samples were dried and then grounded by hand to a homogenous texture. Then, 1 g of each sample was weighed and prepared in crucibles. A high-temperature furnace (Nabertherm® muffle furnace LE 6/11) heated the samples according to the protocol for LOI (Heiri et al., 2001). The OM content was measured first by heating at 550°C for 4 h, and then reweighing. After that, the same samples were heated at 950°C for 1 h and then reweighed to determine their carbonate content. Results are presented vertically from top to bottom (Figures 4–6).
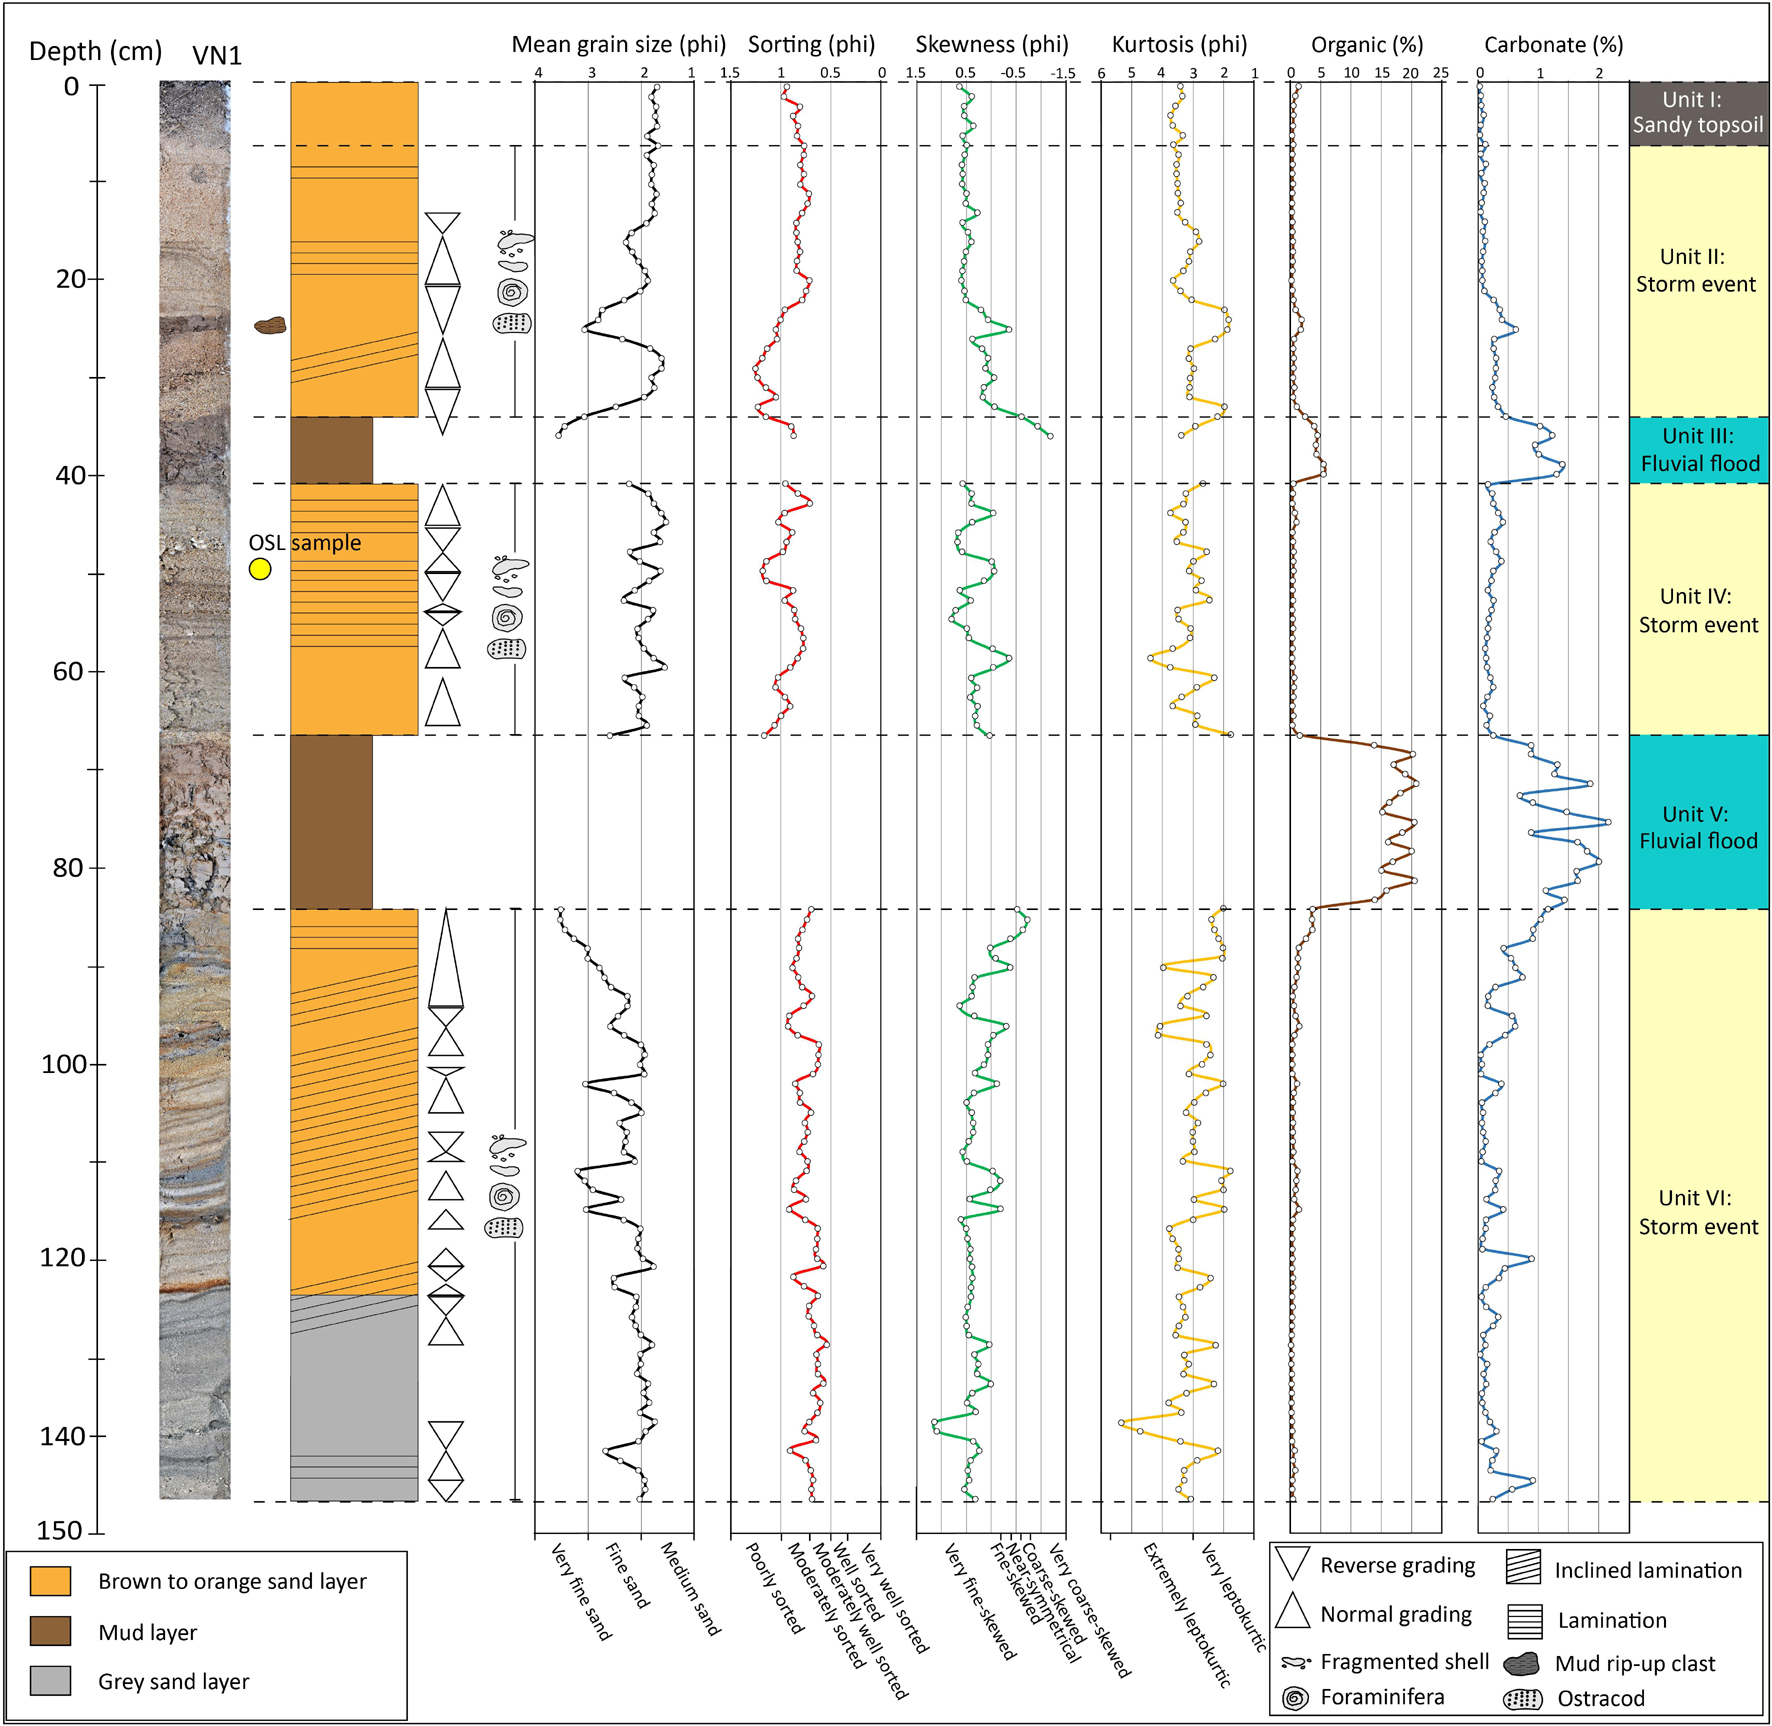
Figure 4. Stratigraphy of core VN1 with vertically plotted grain size parameters (mean, sorting, skewness, and kurtosis) and LOI (organic and carbonate contents) showing the unit of the storm and FF layers. Storm layers in Units II, IV, and VI mostly exhibited the set of normal and reverse grading with relatively low organic and carbonate contents, whereas the FF layer of Units III and V showed high organic and carbonate contents at 33–41-cm and 67–84-cm depths, respectively.
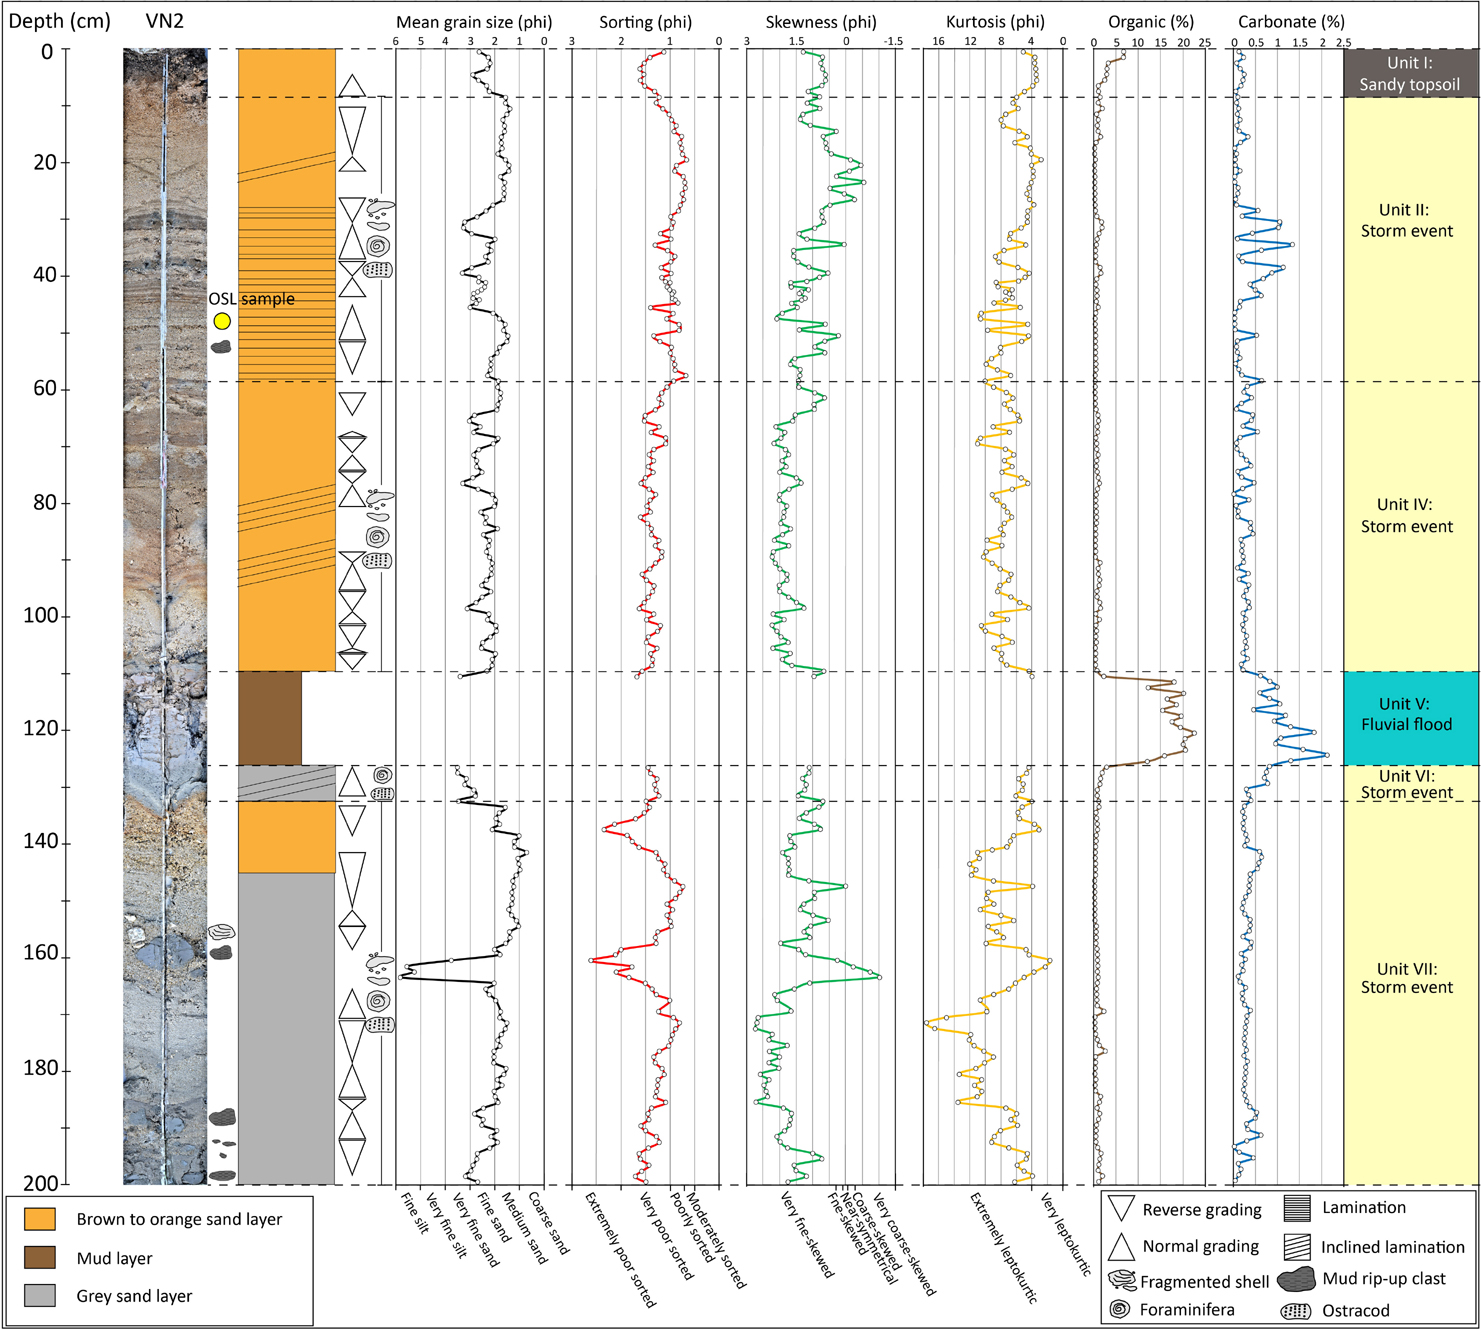
Figure 5. Stratigraphy of core VN2 with vertically plotted grain size parameters (mean, sorting, skewness, and kurtosis) and LOI (organic and carbonate contents) showing the unit of the storm and FF layers. Storm layers in Units II, IV, VI, and VII mostly exhibited the set of normal and reverse grading with relatively low organic and carbonate contents, whereas Unit V was interpreted as the FF layer and showed high organic and carbonate contents at a 110–127-cm depth.
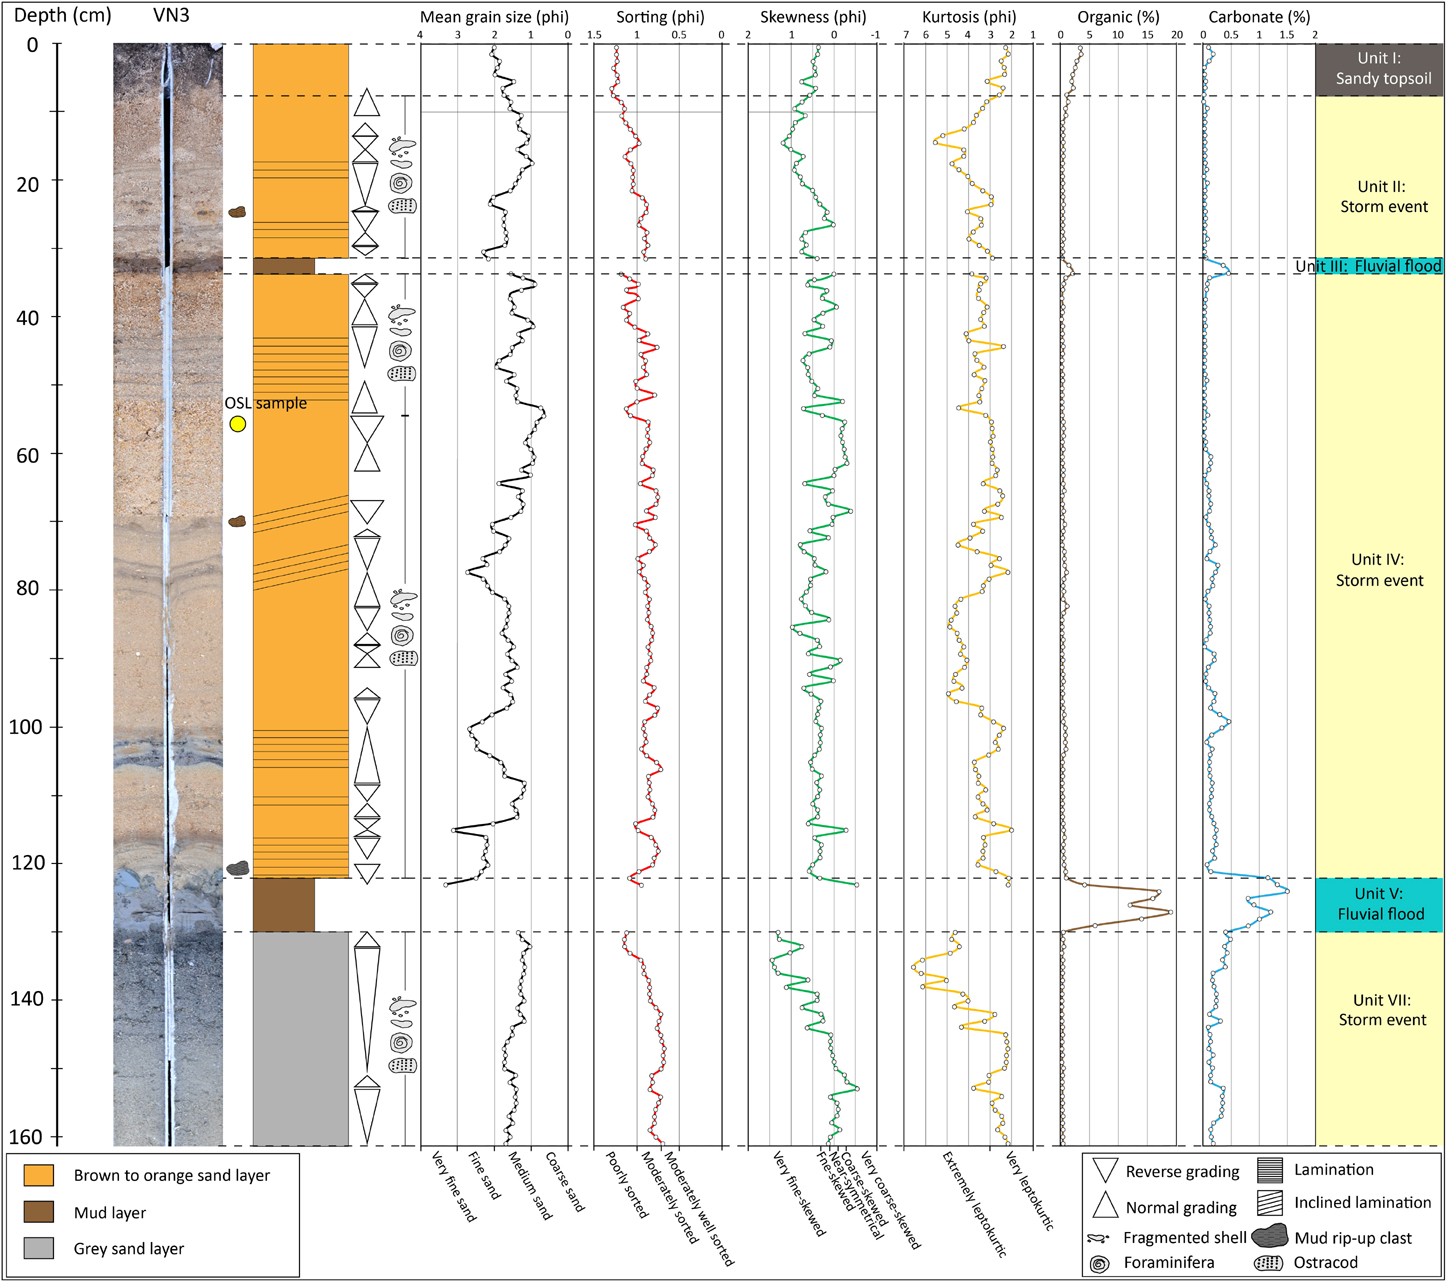
Figure 6. Stratigraphy of core VN3 with vertically plotted grain size parameters (mean, sorting, skewness, and kurtosis) and LOI (organic and carbonate content) showing the unit of the storm and FF layers. Storm layers in Units II, IV, VI, and VII mostly exhibited the sets of normal and reverse grading with relatively low organic and carbonate contents, whereas the FF layer of Units III and V showed high organic and carbonate contents at 32–34-cm and 123–130-cm depths, respectively.
Optically Stimulated Luminescence Dating
Three lines of OSL sampling points were aligned on the barrier perpendicular to the shoreline (Figure 1C). All OSL samples were collected at 50 cm depth using protected-light plastic tubes for equivalent dose samples (De), except for ST8-1, which was collected at 30 cm depth. About 290 g of annual rate dose samples surrounding the equivalent dose samples were collected in plastic bags. The first line consisted of three OSL samples (ST1, ST2, and ST3), as did the second (ST4, ST5, and ST6) and third (ST7, ST8, and ST8-1) lines. The OSL samples of ST8 and ST8-1 were collected in the same profile but at different depths. Note that the positions of three OSL samples (ST4, ST5, and ST6) are consistent with the positions of cores VN1, VN2, and VN3, respectively. The remaining OSL samples from nearby locations were collected in order to cross-check.
A small amount of each dose rate sample was separated to measure its water content by weighing before and after drying at 105°C. Another part was dried in the oven and sieved through an 841-μm sieve (mesh 20) pan. The amount of the dose rate sample in the pan was weighed (290 g) and packed in a suitable container for at least 1 month. Later, the natural radioisotope concentration was measured using high-resolution gamma spectrometry (Canberra).
For De determination, sample preparation was done in a room with subdued red light (to avoid light exposure) at the Sedimentological Lab, Chulalongkorn University. The sediments were wet-sieved and cleaned through a 125-μm sieve (mesh 120) and a 180-μm sieve (mesh 80) to obtain a sand fraction in the range of 125–180 μm. To remove carbonates, the samples were then treated in 10% (v/v) HCL until the chemical reaction (bubbles) ended and subsequently rinsed three times with clean water. To eliminate organic matter, the samples were treated with 30% (v/v) H2O2 overnight, rinsed three times with clean water, etched by 40% (v/v) HF for 60 min to dissolve feldspar minerals, and then cleaned and rinsed three times with clean water. The De samples were dried in the oven at 40°C for 48 h and packed in sunlight-proof containers. Subsequently, an iso-dynamic magnetic separator was applied to the dried-aliquot samples to remove ferro-minerals.
The derived quartz grains were placed on stainless steel discs of 10 mm diameter coated with silicon oil (2 mm stamps). The luminescence of the samples was measured using a Risø TL/OSL-DA-15C/D reader equipped with an internal 90Sr/90Y beta source (ca.0.102 Gys–1) and a bialkali EMI photomultiplier. Blue diodes emitting at 470 nm and 7.5-mm-thick Hoya U-340 filters were used for the measurement. A single-aliquot regenerative dose protocol with three dose points was applied to all samples (Murray and Wintle, 2000). Before measuring, a preheat plateau test was run to identify the most suitable preheat setting (220°C for 10 s prior to all OSL measurements).
For De determination, between 40 and 54 aliquots were measured per sample and analyzed using the Analyst.V4.31.7 software. An individual De value was accepted under the criteria of recuperation < 5%, recycling ratio within 10%, test dose error < 10%, IR depletion ratio within 10% of unity, the adequate fit of the growth curve, and enclosure of De by regenerative doses. Between 1 and 10 aliquots had to be rejected per sample for not meeting one or more of these criteria. The mean De was calculated either using the Central Age Model or the Minimum Age Model (MAM) (Galbraith et al., 1999). The MAM was applied when the De distribution showed overdispersion >0.25 and positive skewness. The dose rate and age were determined using the ADELEv2017 software (Degering and Degering, 2020) using the measured sediment moisture (± 10%) and calculating the cosmic dose rate according to Prescott and Hutton (1994).
Results
Sediment Characteristics of Modern Beach Deposits
The recent beach samples b1 and b4 (see Figure 1C for location) were collected to examine the shore-normal processes. These were classified as coarse-grained sand (0.73 and 0.92 phi, respectively), while the mean grain sizes of b2 and b3 indicate a medium-grained sand composition (1.50 and 1.16 phi, respectively). Sorting values of all shore-normal process samples (b1, b2, b3, and b4) were slightly different (Supplementary Table 1), where b1 was a moderately sorted sand (0.74 phi), b2 was a well-sorted sand (0.46 phi), and b3 and b4 were moderately well-sorted sand (0.52 and 0.64 phi, respectively). The skewness of b1 was −0.23 phi, which is very coarse skewed. Samples b2 and b3 were 0.27 and 0.22 phi, respectively, which identifies them as fine skewed. Sample b4 had a phi value of −0.05, which is nearly symmetrical. Kurtosis values of the shore-normal process samples b1, b2, b3, and b4 were 2.99, 2.38, 2.80, and 2.98 phi, respectively, which are all very leptokurtic. Organic (0.23–0.86%) and carbonate (0.44–0.69%) contents were relatively low and varied little across the four samples (Supplementary Table 1).
Shore-normal process sediment samples b1, b2, b3, and b4 were composed of quartz, rock fragments, heavy minerals, fragmented shells, and microfossils (such as foraminifera). No ostracods were found in the recent beach samples. Quartz is the major component, forming up to 96% of the samples (Supplementary Table 1). Rock fragments, shell fragments, and marine microfossil contents were all relatively low, at around 1% (w/w) each. The number of foraminifera was low too. At least three species of foraminifera were present in each sample, mainly Quinqueloculina auberiana and Cellanthus craticulatus. The sphericity of these samples was relatively similar, with b1 and b3 being characterized as high sphericity, while b2 and b4 were characterized as low sphericity. Roundness was also similar across all the samples, with subangular, subrounded, and rounded grains.
Stratigraphical Correlations
The three percussion cores (VN1, VN2, and VN3) collected from the Hoa Duan barrier were used to establish lithological correlations with reference to the stratigraphy, lithology, color, sedimentary structures, type of sediment, grain size, grading, and percentage of organic, carbonate, and microfossil contents (Figure 3). Core VN1, taken from the seaward side behind a sandy ridge about 100 m from the sea, was 147-cm long, whereas VN2, the longest core (200 cm), was taken from the center of the barrier, around 50 m from VN1 and provided the clearest picture of several events in the Hoa Duan area. Core VN3 (162-cm long) was taken from the landward side of the barrier, adjacent to the lagoon.
Following stratigraphic correlation, deposition in Hoa Duan can be divided into seven units as follows (Figure 3): Unit I: sandy topsoil; Unit II: storm layer; Unit III: FF; Unit IV: storm layer; Unit V: FF; Unit VI: storm layer, and Unit VII: storm layer. A more detailed description is given below. The composition, LOI, roundness, sphericity data, and the values of the statistical parameters (mean, sorting, skewness, and kurtosis) are presented in Supplementary Table 1.
Interpretation and Characteristics of Each Unit From Cores
Unit I: Sandy Topsoil
The sandy topsoil of each core was limited by a black organic sand layer of 0–9 cm (Figures 3–6), with a gradational contact at 9 cm in VN2 and at 8 cm in VN3, respectively. Internal structures, such as normal and reverse grading, were present in VN2. The thickness of the sandy topsoil in VN1, VN2, and VN3 was 7, 8, and 7 cm, respectively. The mean grain size of the sandy topsoil was between 1.47 and 2.89 phi, classified as medium- to fine-grained sand. This layer was moderate to poorly sorted, from 0.92 to 1.60 phi, and the skewness varied between −0.74 and 1.60 phi. All samples were very fined skewed, except for two samples in VN1, one of which was very coarse skewed (−0.74 phi), and the other was finely skewed (0.24 phi). Kurtosis of Unit I ranged from 2.09 to 5.10 phi, and so was very to extremely leptokurtic. The organic and carbonated content of this unit ranged from 0.67 to 6.68% and 0.01 to 0.24%, respectively.
Unit I (Sandy topsoil) is the uppermost layer, and so was regarded as the most recent. This topsoil layer was comprised of quartz, rock fragments, and heavy minerals covered with the remains of leaf litter. There were no bioclasts, such as fragmented shells, marine fossils, or microfossils (foraminifera and ostracods) in this unit. Quartz was the main component, accounting for up to 97%, with rock fragments and heavy minerals, making up the remaining 1 to 3%. Most samples had a low to high sphericity, except for one from VN3, which showed low sphericity. Roundness ranged from angular to well-rounded grains, except for VN1, which did not have rounded or well-rounded grains.
Unit II: Storm Layer
This layer mainly consisted of quartz, bioclasts (fragmented shells, foraminifera, and ostracods), rock fragments, and heavy minerals. Quartz was still the main component of this unit, similar to Unit I, with up to 90% quartz, while 1 to 5% of bioclast was present and was classified as several species of foraminifera in high concentrations (∼2,335 counts) with a low number of ostracods (∼41 counts). Bivalves and gastropods were also observed in this unit. Rock fragments and heavy minerals accounted for 1 to 2%. The sphericity ranged from low to high, with low sphericity in VN2 and VN3 and no high sphericity in VN1. Roundness ranged from very angular to well-rounded grains, the majority of which were angular to subrounded. Very angular grains were present in VN2 and VN3, while well-rounded grains were only found in VN2.
A layer of light brown to orange sand was observed at 8- to 33-cm depth in VN1, 9–59 cm in VN2, and 8–32 cm in VN3 (Figures 3–6). The thicknesses of these layers in VN1, VN2, and VN3 were 25, 50, and 26 cm, respectively. In VN1 and VN3, this layer contained a cobble-sized MRC at 26- to 27-cm depth and 23- to 25-cm depth, respectively. Mud laminae were present in VN2 at 30- to 46-cm depth. Cross and parallel lamination with fragmented shells was found in VN1, VN2, and VN3 at 16–30, 19–23, and 18–29 cm, respectively. Note that VN1 seemed to have two mud layers at 22- to 23-cm and 33- to 42-cm depth, but, actually, the top mud layer was part of the eroded mud layer of Unit III (Figure 3). The contacts of this layer with the topsoil layer above were gradational. Sharp erosional contacts with the mud layer below were found at the base of Unit II. The mean grain sizes in this unit ranged from 0.96 to 3.32 phi, indicating medium to fine to very fine sand. This unit was poorly sorted, moderately sorted, and moderately well sorted, ranging from 0.66 to 1.40 phi. Grain size distributions were very fine skewed, fine skewed, near symmetrical, coarse skewed, and very coarse skewed, ranging between −0.53 and 2.07 phi. Kurtosis was between 1.83 and 10.63 phi, and so very to extremely leptokurtic. Organic and carbonate contents were 0.32–1.92 and 0.01–1.33%, respectively.
Unit III: FF
A dark brown mud layer was observed at a depth of 33–41 cm in VN1 and 32–34 cm in VN3 (Figures 3, 4, 6, 7), but was not present in VN2. The layer was 8- and 2-cm thick in VN1 and VN3, respectively. Its sedimentary structures were limited to sharp erosional contacts between the coarser-grained sediments of Units II and IV. Although this layer mainly contained mud throughout its entire thickness and could be visually classified, some small parts of this layer, especially at the top of the layer, were composed of sand. The sandy sediment was comprised of quartz, rock fragments, and heavy minerals, at 94–97, 2–5, and 1%, respectively. The sphericity was low to high, and the roundness ranged from angular to rounded. Mean grain sizes of this sand were between 3.1 and 3.71 phi, indicating very fine sand. Sorting values varied between 0.73 and 1.15 phi, indicating poorly sorted and moderately sorted sand. Skewness ranged from -1.26 to -0.6 phi, showing very coarse-skewed distributions, while the Kurtosis ranged from 2.10 to 3.59 phi, reflecting very to extremely leptokurtic distributions. The organic and carbonate content of this unit varied from 0.35–5.49 to 0.05–1.41%, respectively.
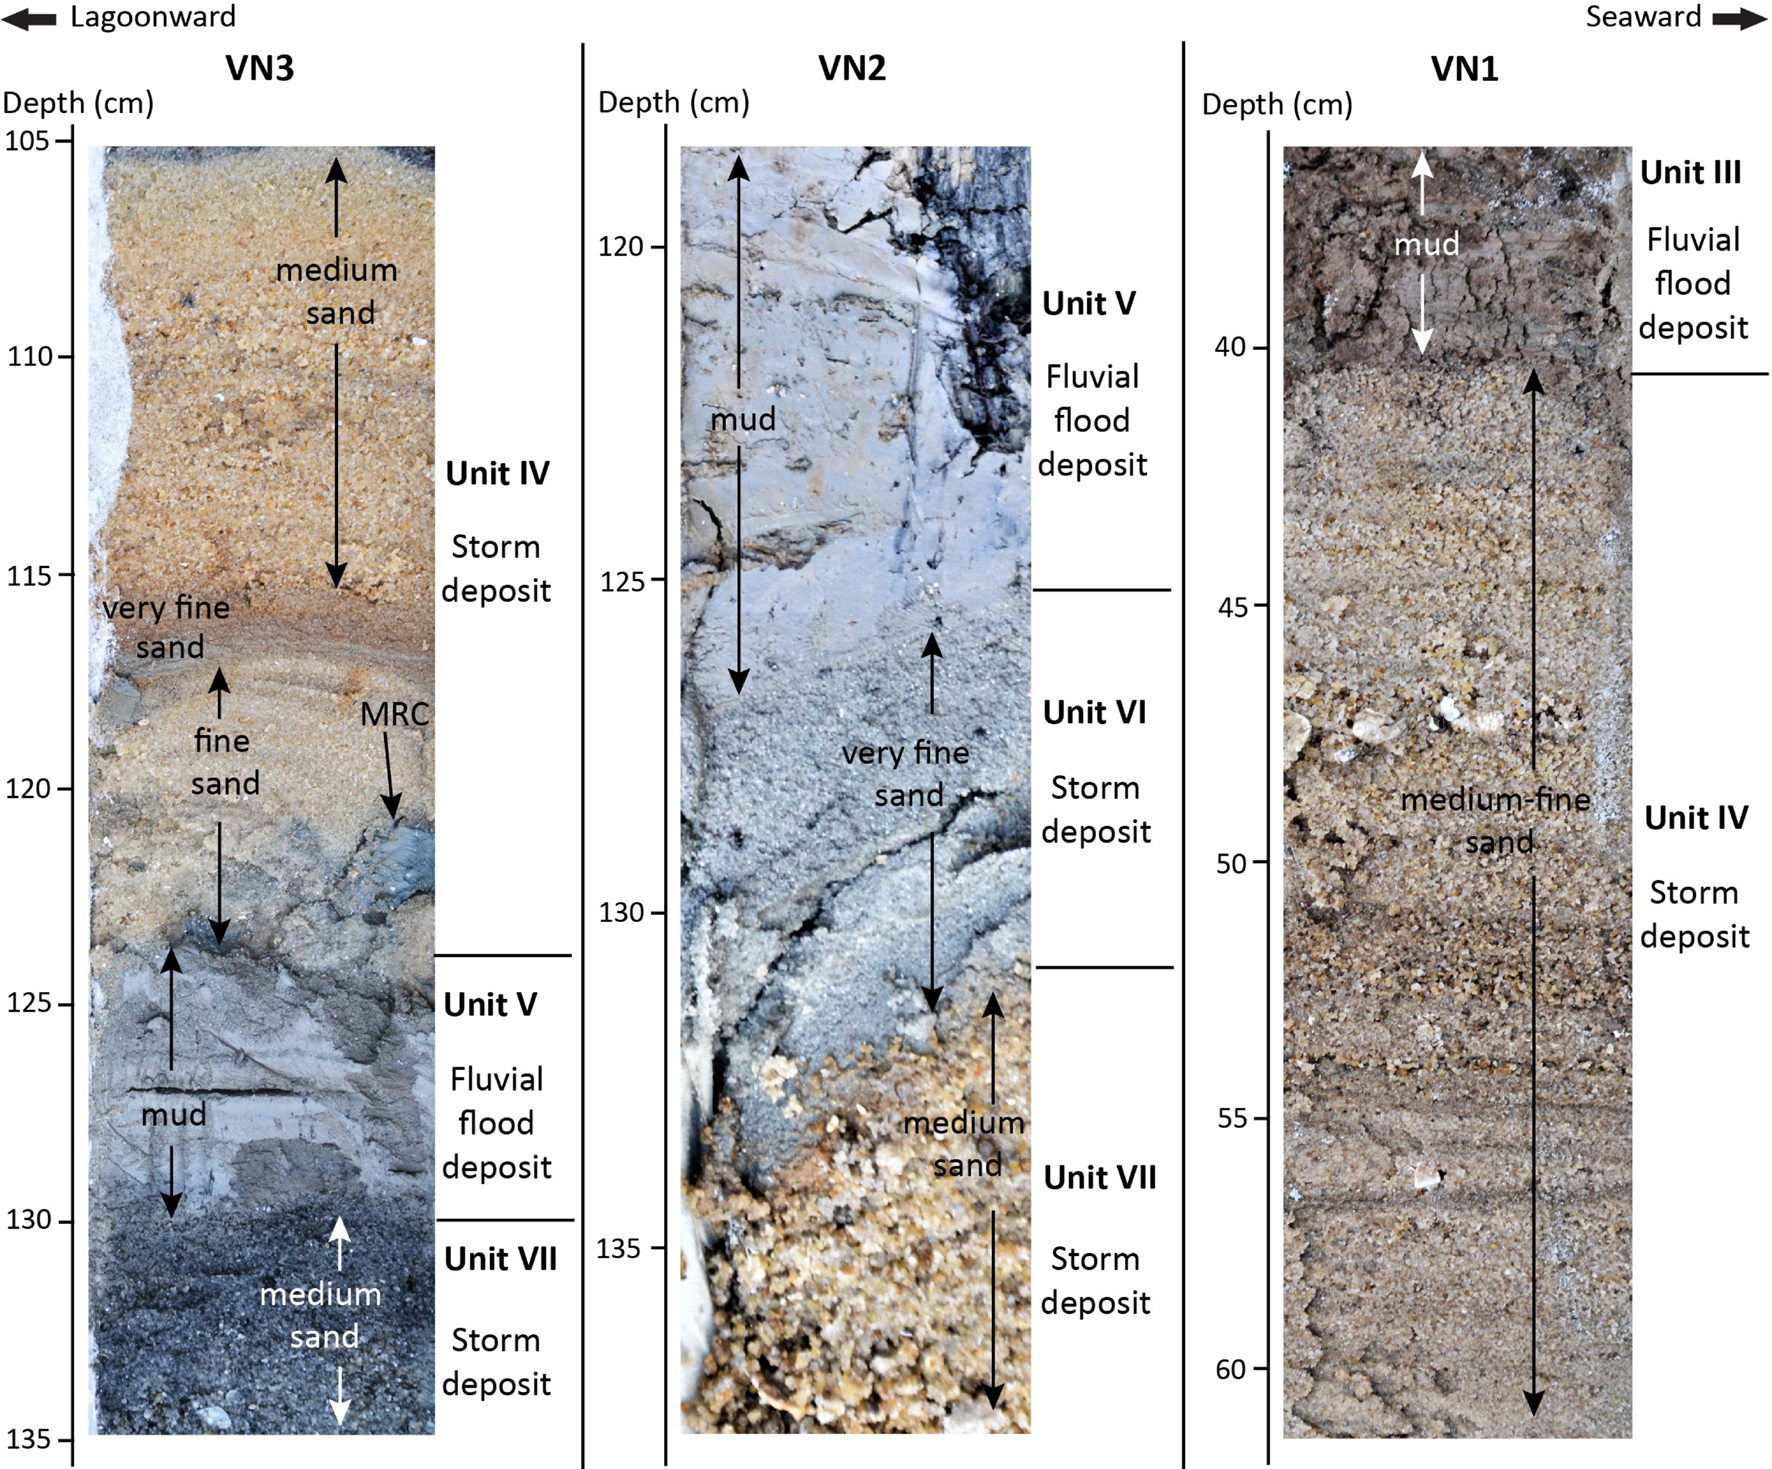
Figure 7. Close-up of the internal sedimentary structures of storm deposits and FFDs from cores VN1, VN2, and VN3. In core VN1, a dark-brown mud layer with basal sharp contact was observed at 41-cm depth and parallel lamination of medium-fine sand with fragmented shells at 42–57-cm depth. In core VN2, a light-gray mud layer with basal sharp contact at 127-cm depth was deposited on a very fine sand layer. Then, medium sand with a sharp erosional top contact with a very fine sand layer was observed at a 133-cm depth. In core VN3, very-fine-to-medium sand with basal sharp contact and parallel lamination was observed at 115–118-cm depth plus an MRC at 121-cm depth, and then a light-gray mud with basal sharp contact deposited on a dark-gray color with medium-grained sand.
Unit IV: Storm Layer
The unit was comprised of quartz, bioclasts, rock fragments, and heavy minerals, which accounted for 94–98, 0–2, 1–2, and 1–2%, respectively. Marine fossils (bivalves and gastropod) and microfossils (foraminifera and ostracods) were also found in this unit. The sphericity of this unit covered the whole range (low and high sphericity), as did its roundness (very angular to well-rounded grains).
A dark to light brown sand layer was present at a depth of 41–67 cm in VN1, 59–110 cm in VN2, and 34–123 cm in VN3 (Figures 3–6), and was characterized as fine- to coarse-grained sand. The thicknesses of this layer in VN1, VN2, and VN3 were 26, 51, and 89 cm, respectively. The sedimentary structures inside consisted of parallel and incline lamination with fragmented shells at 42–57-cm depth in VN1 (Figure 7), 92–97 cm in VN2, and 43– 52-, 70– 80-, and 100–122-cm depth in VN3. Moreover, a plastic bag fragment was recognized in VN2 at 63-cm depth. A pebble-sized MRC was visually identifiable at the base of this sand layer in VN3 at 122-cm depth with sharp erosional contacts.
Internal structures, such as coarsening and upward finning, were also observed. Mean grain sizes ranged from 0.64 to 3.30 phi, indicating coarse, medium, fine, and very fine sand. Sorting values were between 0.60 and 1.62 phi, in the range of poorly, moderately, and moderately well-sorted sand. Distributions were very coarse skewed, fine skewed, very fine skewed, and near symmetrical, ranging between -0.38 and 2.24 phi. Kurtosis varied between 1.81 and 10.97 phi. Organic and carbonate contents were relatively low, varying from 0.20 to 1.54% and 0.01 to 1.15%, respectively.
Unit V: FF
A dark-brown to dark-gray mud layer was found at 67–85-cm depth in VN1, 110–127 cm in VN2, and 122–130 cm in VN3 (Figures 3–7). The thicknesses of this layer in VN1, VN2, and VN3 were 18, 17, and 8 cm, respectively. It had sharp erosional contacts with the sand layers, both above and below.
This layer was similar to the layer of Unit III, which was mainly contained mud throughout, but some small part of this layer, especially at the top, was composed of sand. The sand contained quartz, rock fragments, and heavy minerals, at 96–97, 2–3, and 2%, respectively. The sphericity was low, and the roundness varied from very angular to subrounded grains. Mean grain sizes were between 3.32 and 3.39 phi, indicating very fine sand. Sorting values ranged from 0.85 to 1.67 phi, indicating poorly and moderately sorted sand. Skewness ranged from -0.51 to 0.96 phi, indicating very fine-skewed and very coarse-skewed distributions. Kurtosis ranged from 2.16 to 3.98 phi, indicating very to extremely leptokurtic distributions. Organic and carbonate concentrations were relatively high, ranging from 2.27 to 22.51% and 0.45 to 2.14%, respectively.
Unit VI: Storm Layer
The unit was composed of quartz, bioclasts, rock fragments, and heavy minerals. The sphericity of this layer was low to high. There were only three samples in VN2 with low sphericity. All classes of roundness were present, but the majority of samples were in the subangular to the subrounded range.
This unit was colorful, especially in VN1, with orange, brown, white, and gray shades. It was recognized only in VN1 (85–147 cm) and VN2 (127–133 cm), respectively (Figures 3–5, 7), and did not appear in VN3. The thickness of the layer was 61 cm in VN1 and 6 cm in VN2, and so likely got thinner and finer landwards. Sedimentary structures were striking inclined laminations and could be observed throughout the unit, especially in VN1. The sharp erosional top contact with the muddy layer of Unit V was observed in VN1 and VN2, while a sharp bottom contact (in grain size) with a coarser sand layer was found in VN2. Mean grain size ranged from 1.76 to 3.55 phi, indicating medium, fine, and very fine sand. Sorting values were between 0.54 and 1.47 phi, indicating moderately sorted, moderately well-sorted, and poorly sorted sand. Skewness varied between -0.71 and 1.44 phi, indicating very coarse-skewed, coarse-skewed, near-symmetrical, fine-skewed, and very fine-skewed distributions. Kurtosis was between 1.78 and 6.13 phi, in the range of very and highly leptokurtic distributions. Organic and carbonate contents varied from 0.09–3.89 to 0.02–1.12%, respectively.
Unit VII: Storm Layer
The layer was composed of quartz, bioclasts, rock fragments, and heavy minerals. Its sphericity covered the whole range, from low to high. However, most samples had low sphericity. Roundness ranged from angular to well-rounded, but most samples had angular to subrounded grains.
Predominantly dark- to light-gray sand was observed in VN2 and VN3 at a depth of 136–200 cm and 130–162 cm, respectively. A small part of this unit was orange to light-gray sand, as observed at the top in VN2 (Figure 7). The thicknesses of the unit were 55 cm in VN2 and 33 cm in VN3, respectively. A pebble-sized MRC was present in VN2 at 158- to 161-cm depth, together with an oyster valve. The contacts of this layer were a sharp erosional top with very fine sand in VN2 and a muddy layer in VN3. Mean grain sizes were between 0.69 and 3.20 phi, indicating coarse to very fine sand. Sorting values ranged from 0.55 to 2.34 phi, indicating poorly sorted, moderately sorted, and moderately well-sorted sand. Skewness was −0.53 to 2.70 phi, ranging through very coarse-skewed, coarse-skewed, near-symmetrical, fine-skewed, and very fine-skewed distributions. Kurtosis varied from 2.17 to 17.58 phi, including very and extremely leptokurtic distributions. Organic and carbonate contents ranged from 0.21 to 2.58 and 0.01 to 0.63%, respectively. Moreover, four samples of the mud ball found in VN2 were sedimentologically analyzed. Their mean grain size ranged between 3.75 and 5.8 phi, indicating very fine sand and medium silt. Sorting values ranged from 1.77 to 2.62 phi, reflecting poorly sorted and very poorly sorted sand. Skewness ranged from −0.26 to −0.97 phi, indicating fine-skewed, coarse-skewed, and very coarse-skewed distributions. Kurtosis ranged from 1.65 to 4.96 phi, including very and extremely leptokurtic distributions.
Comparison of Grain Size Distribution Curves
Comparisons of the grain size distribution curves of the shore-normal beach sediment and each unit found in Hoa Duan stratigraphy are presented in Figure 8. The comparative graphs of the grain size distribution curves indicated different sources from which the sediment was transported to each environmental zone. Grain size curves of the recent beach sediment clearly showed a unimodal distribution in the range of coarse to medium sand. Grain size distributions of topsoil sediments were unimodal and bimodal. The distribution of grain size curves in all samples of storm sediment (Units II, VI, and VII) and fluvial sediments (Units III and V) displayed unimodal distributions. A comparison of the grain size distribution of the shore-normal beach and other units is discussed in see section “Age of Depositional Events.”
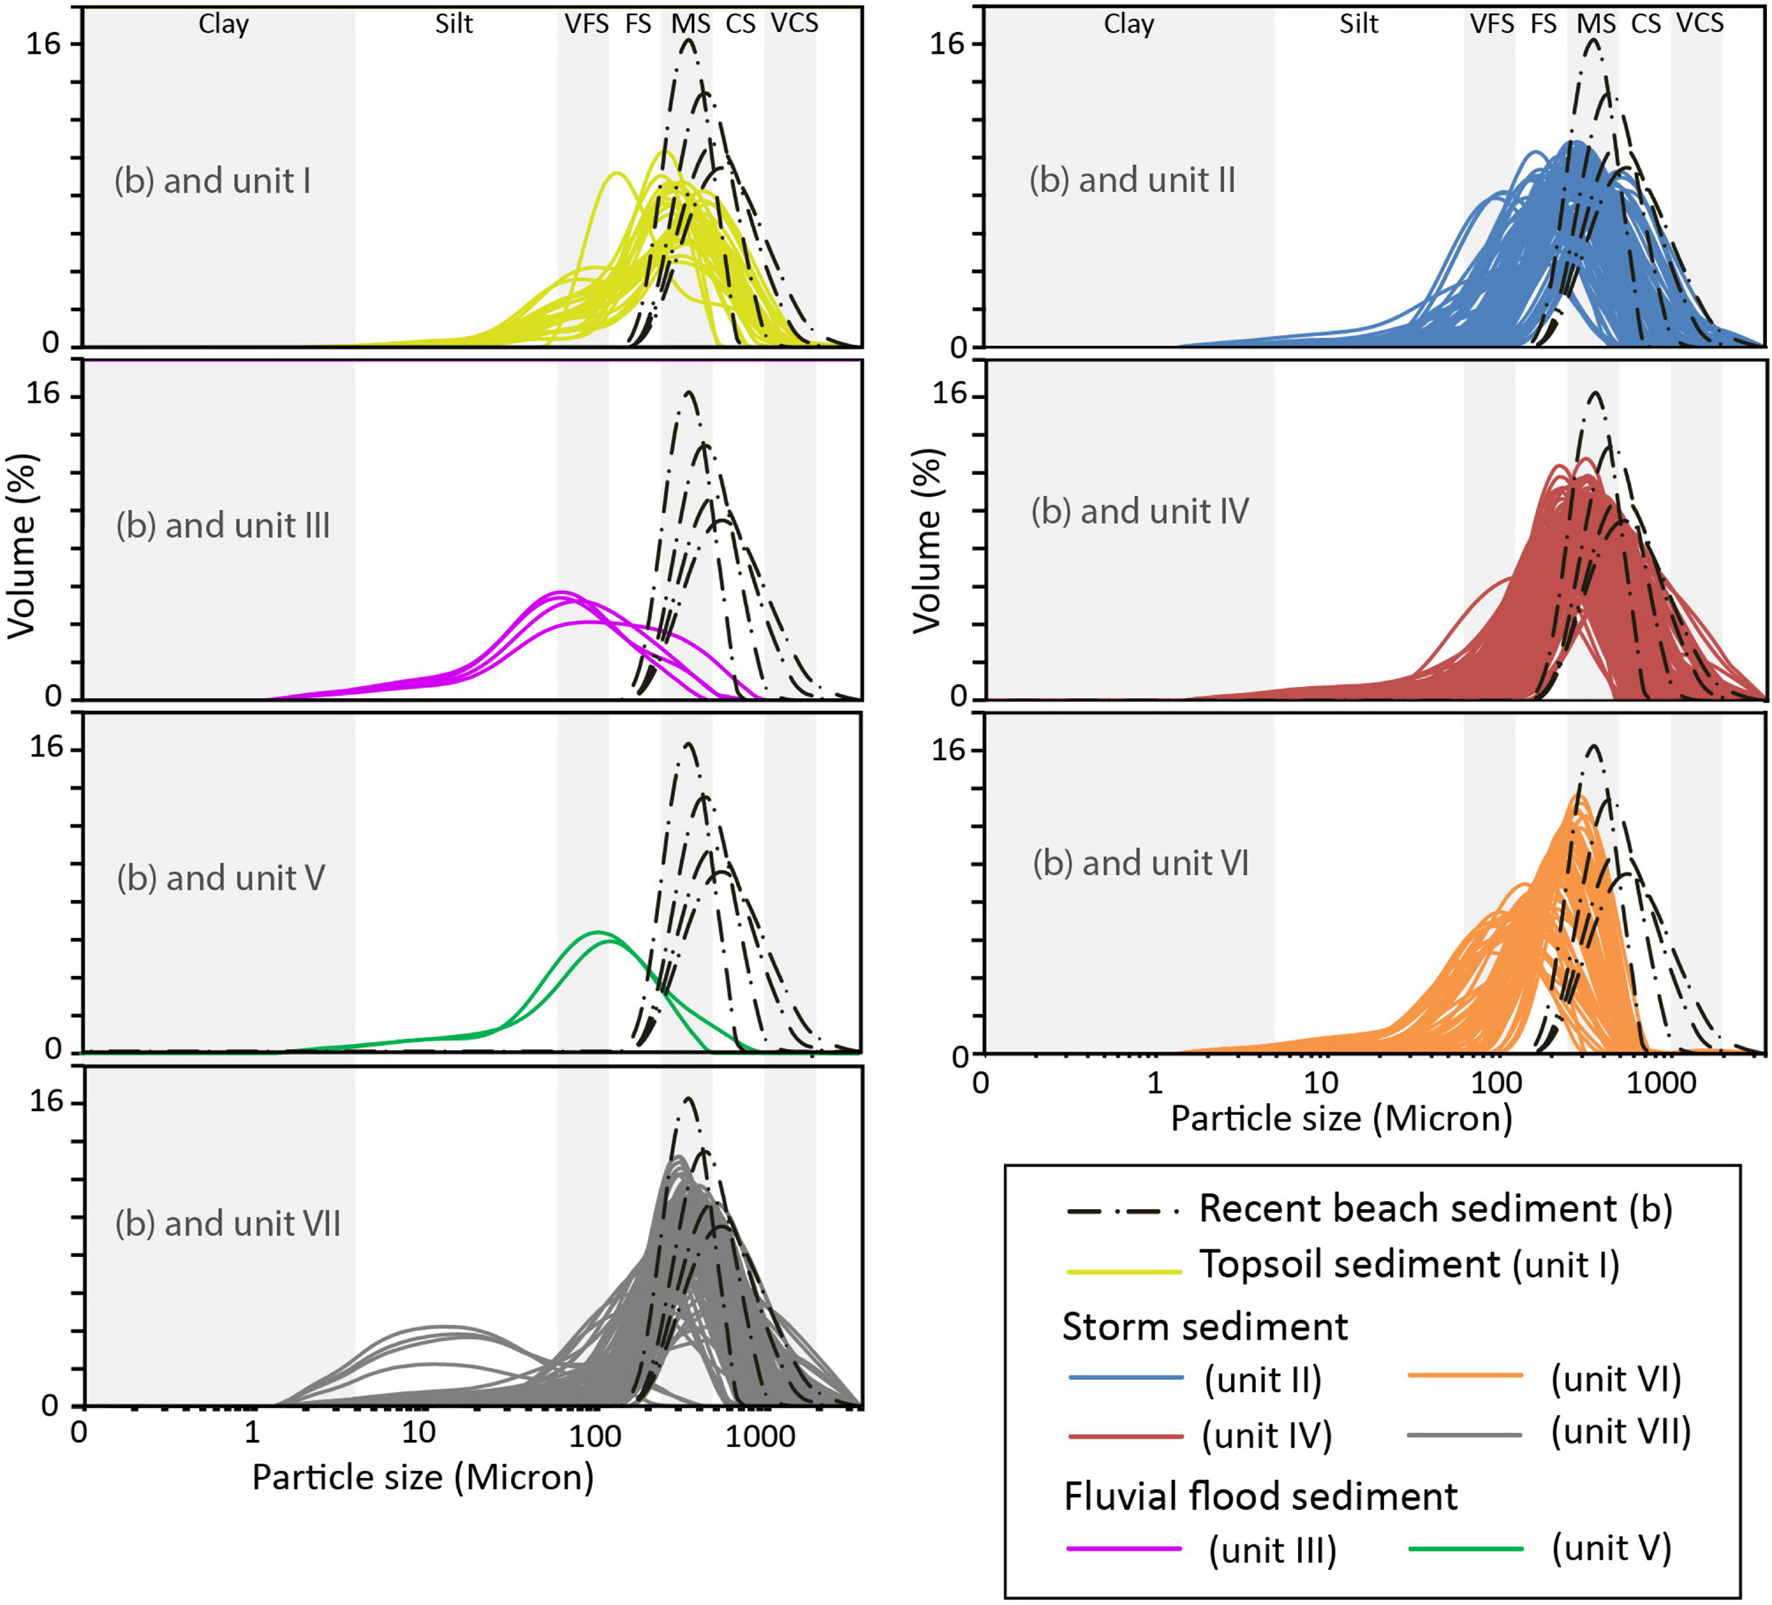
Figure 8. Plots of the grain size distribution curves of Units I–VII in comparison with the shore-normal beach deposits (b) (location in Figure 1C). The number of grain size distribution curves in each unit is as follows: recent beach (n = 4), Unit I (n = 27), Unit II (n = 97), Unit III (n = 4), Unit IV (n = 177), Unit V (n = 2), Unit VI (n = 69), and Unit VII (n = 94). The characteristic of the grain size distribution of the storm sediments shows curves that are consistent with the curves of the shore-normal recent beach sediments in the range of coarse-to-medium sand, whereas the grain size curves of the FF sediments are different, being distributed in the range of very-fine sand to silt.
Optically Stimulated Luminescence Dating
The studied samples showed relatively bright OSL signals and excellent performance during the SAR protocol (Figures 9A,B). However, for three samples, the level of the natural OSL signal was too low to allow for a precise determination of the age. For these samples, we received mean De values of 0.02 ± 0.01 Gy (ST1), 0.03 ± 0.02 Gy (ST4), and 0.04 ± 0.02 Gy (ST5), with associated uncertainties of 50% or more. Hence, we regard these samples to be of “modern” (close to zero) age. Considering the dose rates observed, the age can securely be attributed to being younger than 100 years. For core VN1 and VN3, the OSL samples (ST4 and ST6) were collected at the storm layer of Unit IV, which provided an age of modern and 130 ± 10 yr, respectively. In core VN2, the OSL sample (ST5) was collected from the storm layer of Unit II, and has a modern age (Figures 2E, 3). For all the other samples, ages range between 130 ± 10 and 520 ± 25 years (Table 1). The implications of this are discussed in see section “Dynamic and Evolution of the Hoa Duan Sand Barrier.”
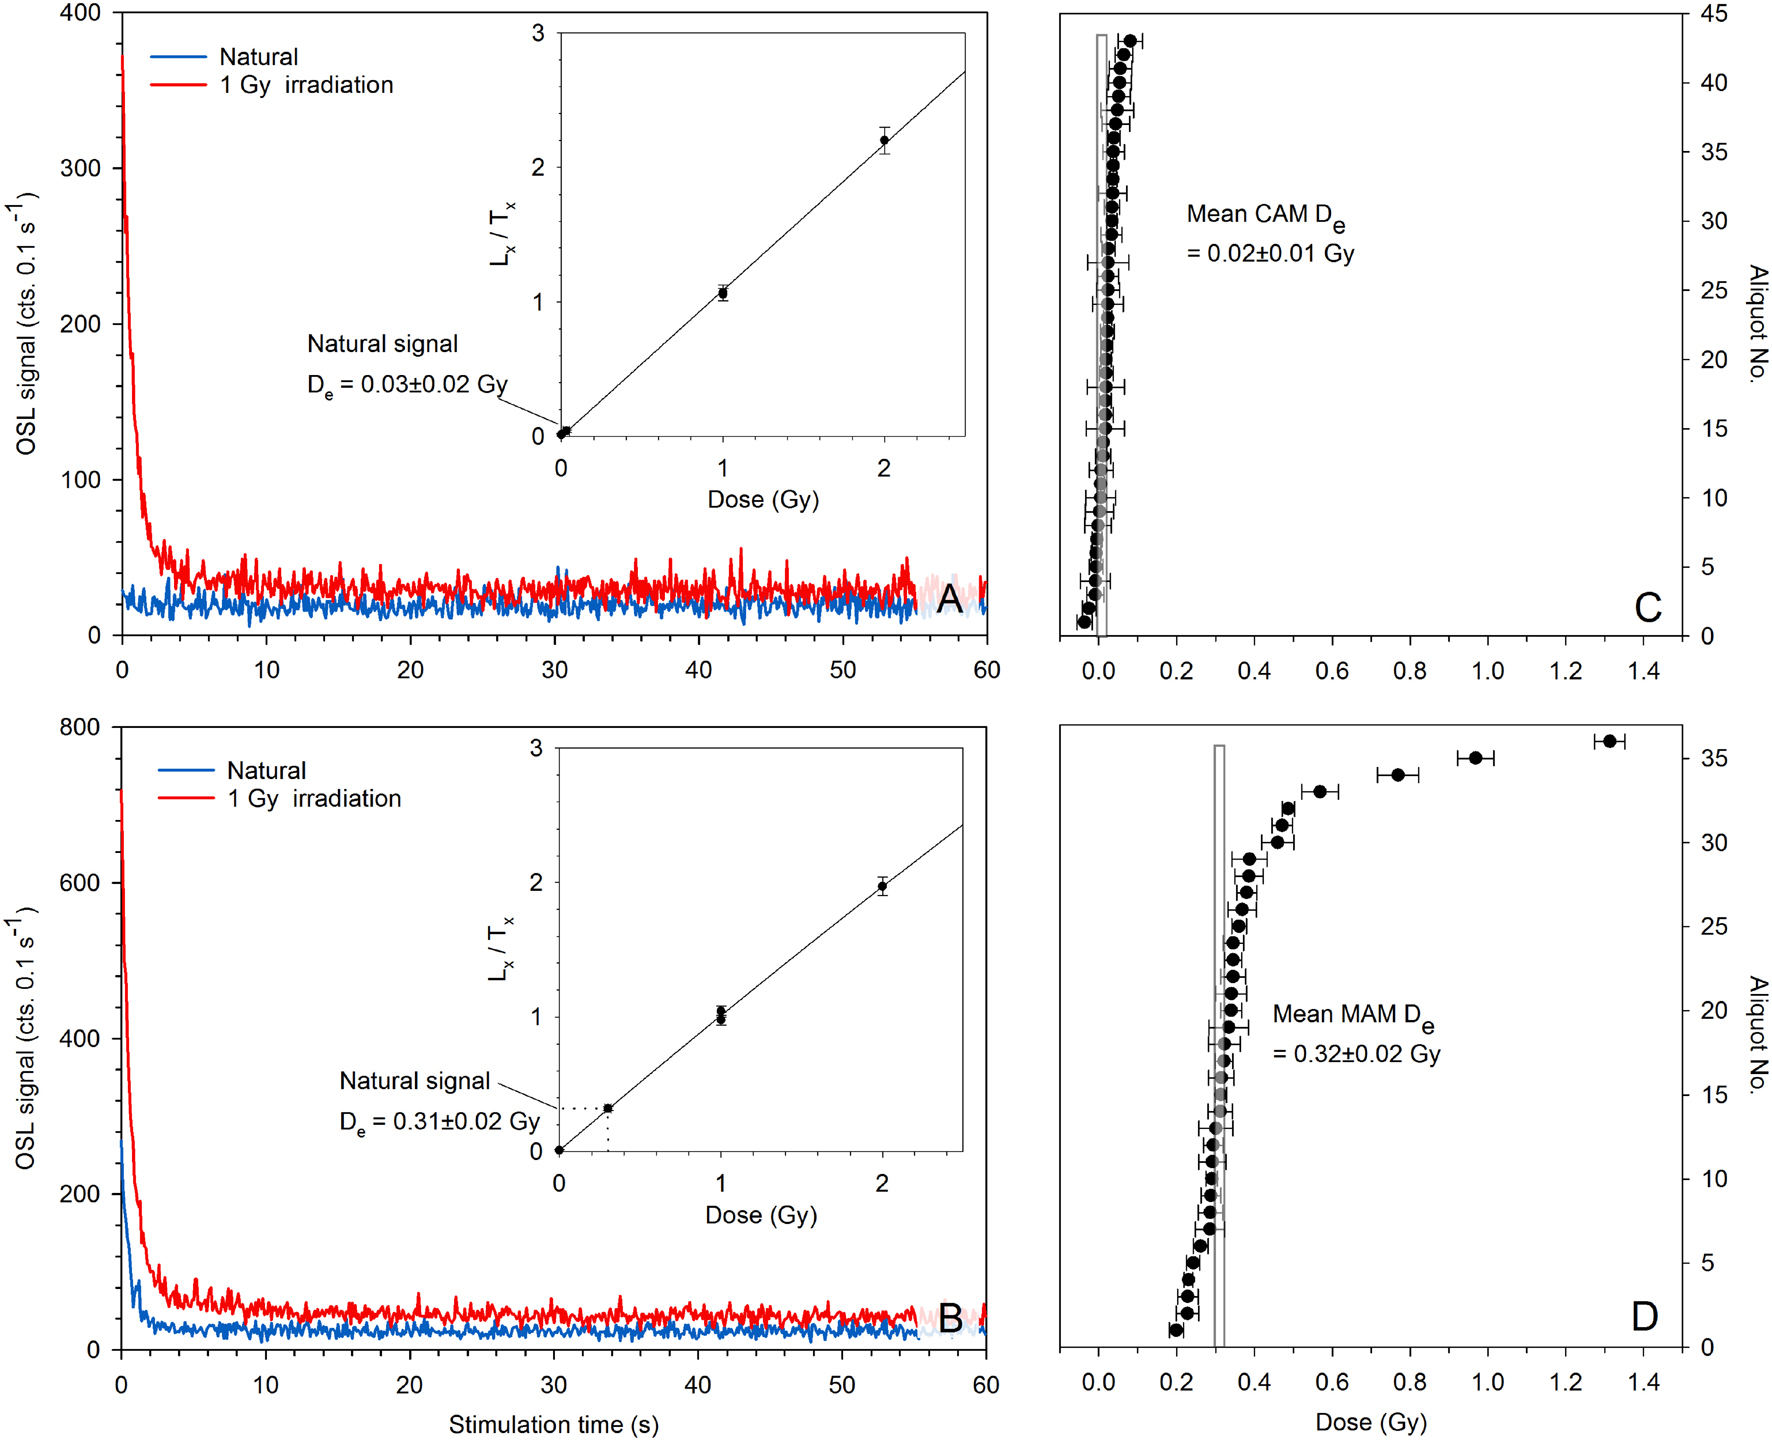
Figure 9. Examples of OSL decay curves for representative aliquots of (A) a modern (ST1) and (B) an older (ST3) sample. This graph shows that the natural signal in the modern sample is too low for proper age determination. The inset displays the dose-response curve of the respective aliquot. Also shown are the dose distribution plots of (C) the modern and (D) the older example. For the latter, the positively skewed spread and high overdispersion of the De values call for the application of the Minimum Age Model.
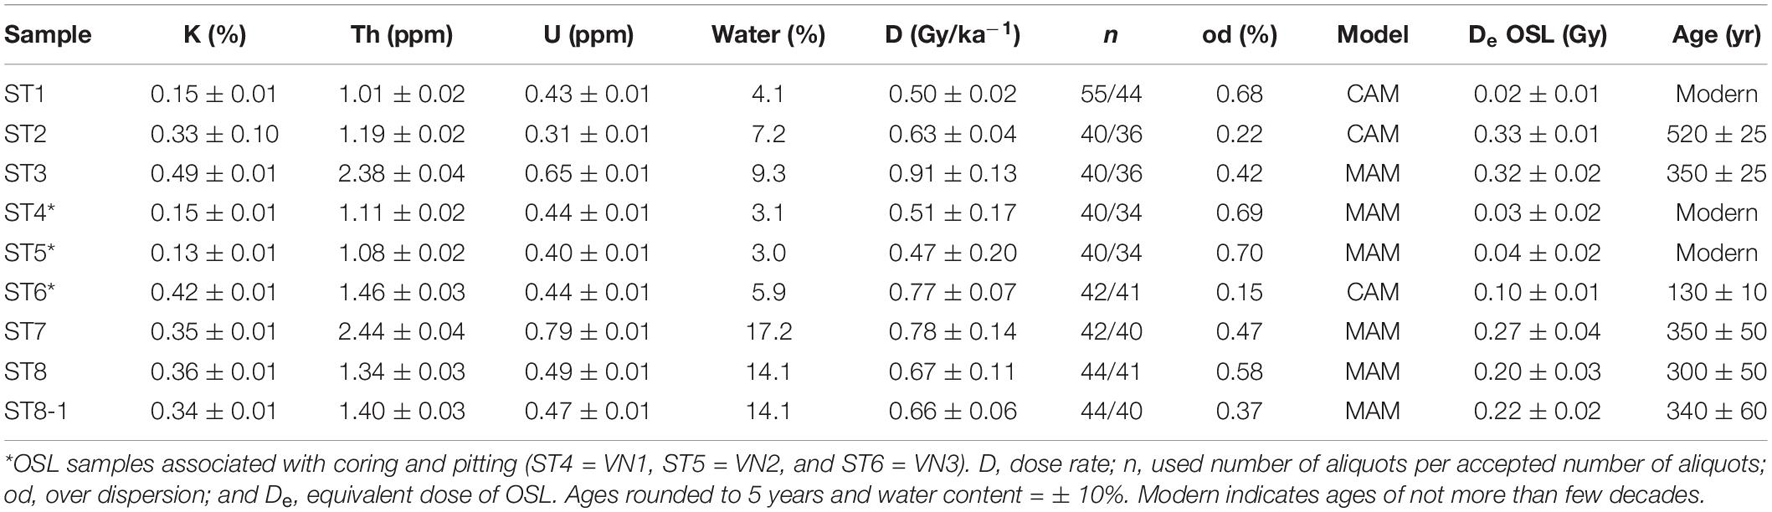
Table 1. Summary data of OSL dating with the concentration of dose-relevant elements (K, Th, and U), measured sediment moisture, total dose rate (D), observed overdispersion, the applied age model (CAM = central age model; MAM = minimum age model), mean De, and resulting age.
Discussion
Identification of Storm Deposits
Units II, IV, VI, and VII were classified as storm layers as they contained typical sedimentary structures: sharp top and bottom contacts, MRCs, laminated and inclined laminated sand, and marine fossils, and microfossils. For example, the presence of MRCs in Unit II of VN1 and VN3 (Figure 3) was very clear evidence of intense wave energy during storms. Building erosional traces on the preexisting surface (Unit III) by forming observable erosional contacts and pebble-sized MRC at the base of Unit II cannot be formed by normal waves during fair weather. Although the distance between core VN1 and the present sea level (psl) is relatively short (approximately 120 m), the relatively high ridge crest (2.5-m amtl) would serve as a buffer to protect the site from wave flooding during a high tide (0.4-m amtl) and monsoon waves (Figure 2E). As the field work was conducted just after the typhoon season, erosional marks were observed, such as beach scarps along the coastline at 1-m amtl (Figures 2A,B). Annual monsoon waves were certainly unable to top the crest of the barrier ridge (Dastgheib et al., 2016; Thuy et al., 2017). Therefore, wave processes topping the ridge crest from high tide and monsoon waves can be ruled out. Waves generated by typhoons are much stronger than the usual fair-weather waves. These waves are strong and high enough to top the barrier ridge and deposit on its landward side.
The parallel-laminated, inclined-laminated sand, and normal and reverse grading found in Units II, IV, and VI (Figures 3, 7) are additional important evidence of storms, similar to previous studies (Leatherman and Williams, 1983; Sedgwick and Davis, 2003; Phantuwongraj et al., 2013; Kongsen et al., 2021). However, although foreset bedding, which is often recognized in storm deposits (Nanayama et al., 2000; Phantuwongraj et al., 2013; Kongsen et al., 2021), was not observed in the storm deposit of this area, the presence of laminated sand indicates wave pulses that carried sediments that were then deposited after the dissipation of each pulse.
Slope wash and mass wasting can be eliminated from the range of the sedimentation processes in this area because the elevation and the degree of the slopes of the Hoa Duan barrier are too low to slide or slump landwards during heavy rainfall. Based on cross-section topography (Figure 2E), the highest point of the barrier crest was approximately 2.5 m, while the topographic heights of core positions VN1, VN2, and VN3 were approximately 0.9, 0.5, and 0.2 m, respectively. When considering the height and slope degree between the barrier crest and core positions, slumping and sliding of the sand mass should occur around the seaward area (from ridge crest to beach), but not in the area behind the crest. If the sand mass had slumped and/or slid landwards in the location of the cores, the stratigraphy discovered in the Hoa Duan area would contain a sharp contact without erosional contact between the preexisting layer surface and the overlaid sand mass with a difference in sand color (black and orange), but this kind of stratigraphy was not found here.
Furthermore, the sand layers are unlikely to have been formed by a tsunami. Although there are reports of prehistorical tsunami deposits preserved in the Dien Chau district (Figure 1A), about 420 km northwest of Hoa Duan (Rogozhin, 2016; Trieu et al., 2017), the preservation potential for prehistorical tsunamis may not be possible at this study site because the topographic condition was different from that reported at Hoa Duan. Rogozhin (2016) observed a sand layer with mollusk shells, with their fragments deposited 200 m from the recent shoreline on a coastal sand dune at 10–15 m above the (a)psl, indicating the occurrence of a tsunami deposit in Dien Chau approximately 650 years ago. Trieu et al. (2017) deduced three paleotsunami events at Dien Chau dating to 4,500–4,300, 4,100–3,900, and 900–600 years ago by abundantly discovering mounds of marine fossils of Arca granosa mixed with Placuna placenta near the mountain side at an elevation of 5–10 m. The marine fossils were discovered on the coastal plain at a distance of 2 and 7 km from the present shoreline. However, the average height of topography behind the sandy ridge on the barrier island here is 0.8-m apsl. Such a height is too low to preserve the ancient tsunami sediments compared with the well-preserved one on the sand dune at 10 to 15 m apsl (Rogozhin, 2016) and on the coastal plain at 5 to 10 m apsl (Trieu et al., 2017). Therefore, the topography here may not be suitable for preserving prehistoric tsunamis due to its exposure to floods and storm surges that can erode and sweep away prior to tsunami sediments. Furthermore, we did not find any evidence of those marine species reported in the Hoa Duan barrier (Trieu et al., 2017).
The tsunamigenic earthquake that occurred on January 5 1992 near the center of Tonkin Bay (Figure 1A) is regarded as the closest event to Thua Thien Hue, Hoa Duan. The estimated magnitude of the earthquake that triggered this tsunami was approximately 3.7, generating a 0.8-m-high wave and causing no causalities (Nguyen et al., 2012). There is no record of tsunami floods affecting inland central Vietnam. However, although there was a flooding of the tsunami on January 5, 1992, in the coastal areas of central Vietnam, Hoa Duan was probably not affected because the relatively low wave height (0.8 m) would not have been able to top the 2-m barrier crest. Moreover, investigations of satellite images using the Google Earth Timelapse can confirm that there was no geomorphological change in both the Thuan An and Hoa Duan areas during 1991–1993.
Identification of FF Deposits
Units III and V were classified as layers deposited by fluvial floods. The unique sedimentary structures found in the Hoa Duan area only consisted of sharp and erosional contacts (Figure 7). Although these sedimentary structures were similar to the storm deposits (sharp erosional contacts), and some literature did not mention the sharp erosional contact that was created by the FFDs (e.g., Nanayama et al., 2000; Khan et al., 2013; Matsumoto et al., 2016; Yao et al., 2019), the different colors and sediment types are shown in the lithology are very clear, indicating transported sediments. Basically, the sediment color in each environmental zone is different. For example, in the Hoa Duan stratigraphy, orange indicates beach processes in the barrier sand, similar to the color of the beach that we observed. The water table makes the sand color different due to redox reactions. Therefore, dark-brown mud, which contains a minority amount of sand (Units III and V) in the Hoa Duan stratigraphy must have been deposited by transport processes that were not shore-normal.
In addition to the sand color variations in the barrier deposition, the sediment types in the stratigraphy were clearly different themselves. That is to say, based on sediment settlement, coarse-grained sediment (sand and gravel) reflects high-energy deposition conditions, indicating transportation media, such as waves, streams, and currents. Therefore, coarse-grained sediment is common and consistent with barrier formation here, where waves and the tide play a role. In contrast, fine-grained deposits (silt and clay) reflect low-energy sedimentation processes, which are often naturally occurring under still water environments, such as lakes, lagoons, and swamps (Liu, 2004).
In this research, although the Thanh Lam lagoon is located at the back of the Hoa Duan barrier (Figures 1B,C), the deposition of fine-grained sediments by the fluctuation of the lagoon water is impossible and can be ruled out. Because the elevation between the barrier and lagoon is different, especially compared to the fine-grained sediment layer of Units III and V to the lagoon floor level (Figures 2E, 3), the flow velocity of the lagoon water is relatively low. Apart from fine-grained deposits that existed in the low-energy environment, they are the main suspended materials that were carried in the water column of the fluvial process (Owens et al., 2005).
However, the sediment influx of a river discharge would be mostly constrained in the lagoon area and drained to the open sea through the Thuan An inlet (Figure 1B). The flow velocity of the flood in November 1999 in the Thuan An inlet and the lagoon has been recently computed (Lam et al., 2007). The maximum flow velocity of Thuan An inlet and lagoon during the flood in November 1999 was 3.7 m/s and approximately 2.7 m/s, respectively, whereas the flow velocity in the normal situation fluctuated between 0 and 0.5 m/s. Moreover, flooding in November 1999 inundated the Hoa Duan barrier (Lam et al., 2007). The existence of a muddy layer in the Hoa Duan barrier and a high concentration of coarse-grained sediment indicate an anomalous process that could transport these fine-grained sediments seawards and deposited here under a calm water circumstance. Thus, considering the boundary between the present river, lagoon, and Hoa Duan barrier, the FFs are the only reasonable candidates for the origin of fine-grained deposits.
The LOI results helped to confirm FFs as the source of these two layers (Units III and V), which contained high percentages of organic and carbonate matter, markedly different from the topsoil and storm deposits (Figures 4–6 and Supplementary Table 1). For instance, the ranges of organic and carbonate contents of Unit V of VN2 were 2.27–25.51 and 0.45–2.12%, respectively, while the ranges of organic and carbonate contents of the topsoil, storm deposits, and beach sediments were 1–6.68% and 0.07–0.24, 0.21–2.58, and 0.02–0.63, and 0.2–0.8% and 0.4–0.6%, respectively. In principle, the organic components of sediments can include plants, animal detritus, cells, tissue, and substances derived from microbial synthesis (Brady and Weil, 1999).
Despite the coastal ecology of Hoa Duan being a potential source of these kinds of OM, the LOI supports that the retained OM content here is low as considered from topsoil sediments. However, Units III and V were classified as FFDs because there was no OM source that was higher than the fluvial origin in this case, which served as the potential source of the OM. Although they contained a relatively high carbonate content, there were no marine fossils (bivalves and gastropods) or microfossils (foraminifera and ostracods). Hence, the carbonate content of these FFDs was more likely to have been transported from the lagoon, which has a high-carbonate content (Cooper, 1989; Kontopoulos and Bouzos, 2011; Avramidis et al., 2013) during flooding seaward compared with the carbonate content of the shore-normal beach sediments (0.44–0.69%) and storm layers of the other units (Supplementary Table 1). However, the carbonate content of the storm layer in Unit II of VN2 (Figure 5) was relatively high at 0.08–1.33%. Clearly, the high OM content in Unit II of VN2 was associated with the mud laminae at a depth of 29–44 cm (Figure 5). According to the absence of the mud layer in Unit III of VN2, it can be assumed that the mud layer (Unit III) had existed before the advent of the storm and then was eroded by a storm in Unit II and redeposited as the mud laminae. This assumption is supported by the existence of cobble-sized MRC in Unit II of Pit 3 (Figure 3), which indicated the very strong erosion energy of the storm that formed Unit II. Thus, the formation of a mud layer in Units III and V by a storm can be ruled out and refuted from the percentage carbonate content. If the mud layers (mud cap) in Units III and IV were formed by the still water of a storm, their carbonate contents between the mud and sand layers can be correspondent and/or slightly different, not sharply different, and the contact should be gradational, not sharp erosional (Figures 4–6).
Flow Behavior of the Storm and FF Deposits
Based on stratigraphic correlations, the flow mechanisms of storms and FFDs can be identified (Figures 2E, 3). To begin with storm deposits, the sedimentary structures involved in Units VII, VI, IV, and II are both similar and different. The storm layers of Units VI, IV, and II show parallel and landward-inclined lamination. Thinner and finer landward deposits (wedge-shaped profiles) are found only in the storm layer of Unit VI (VN1 to VN2), while, in Units IV and II, the storm sediment layer seems to show a thicker landward deposit. The MRCs are only present in Units VII, IV, and II. Sharp and erosional contact and normal and reverse grading are presented in every storm layer. Unit VII of VN2 shows erosional top contact with the storm layer of Unit VI, whereas Unit VII of VN3 exhibits sharp erosional contact with overlying fine-grained sediment of the FF layer (Unit V). Similarly, Unit IV of VN1 and VN3 displays sharp erosional contact with the overlying and underlying fine-grained sediment of the FF layers (Units V and III), while Unit VI of VN2 shows erosional top contact with the storm layer of Unit II. In principle, the deposition of storm sediments is associated with the wave action generated from strong winds. As mentioned earlier about the sedimentary structures of the storm deposit in each unit, the storm impact scale proposed by Sallenger (2000) has four main regimes (swash, collision, overwash, and inundation) that can be used to explain storm deposition. All units of storm deposit discovered in this paper showed evidence of overwash and inundation regimes (Sallenger, 2000; Morton and Sallenger, 2003; Masselink and Heteren, 2014; Goslin and Clemmensen, 2017). The other two regimes (swash and collision) can be eliminated because they cannot deposit inland.
Parallel lamination and landward-inclined sand in the internal structures of multiple sets of normal and reverse grading were recognized in Units II, IV, and VI (Figures 4–6). This might indicate the flowing of storm waves and tackling of sediments by surge pulses in the time of deposition associated with local topography, shear velocity, and size of sediment (Bridge, 1978, 1984) that developed from an upper flow regime and an upper plane bed (Allen, 1984; Cheel, 1990; Fielding, 2006). In addition, MRCs in the storm layer (Units VII, IV, and II) reflect the flowing of storm waves under shear stress and frictional force, eroding preexisting layers and redepositing them with clasts of finer-grained sediment (Williams et al., 2016; Kongsen et al., 2021).
Moreover, thinner and finer landward deposits (wedge-shaped patterns) are present in Unit VI of VN1 and VN2. This indicates storm flooding from the direction of the sea under overwash and inundation regimes (Sallenger, 2000), which forms the continuity of the storm layers. The landward thinning wedge is generally thicker in cores taken closer to the sea. Core VN1 (Unit VI), closest to the sea, contained the thickest layer of storm sediments with coarser-grain sand, while VN2 (Unit VI) contained a thinner layer with finer-grained sediment landward as a result of the diminished energy of storm waves (Liu and Fearn, 1993, 2000a, b; Liu, 2004). However, there is no wedge shape in the storm layer of Units IV and II, excluding Unit VII due to the lack of information on the layer thickness. This can be explained by the topography before the storm layer of Unit IV was deposited, and the intensity of the storm at that time. The storm sediment layers in VN3 are thicker than in VN1 and VN2 (Figure 3). The topography around VN3 probably caused stronger inundation by storm waves than at other locations, trapping water and suspended material in such a way that more of it could settle evenly. Otherwise, the intensity of the storms depositing Units II and IV was very strong until they flooded across all areas of the barrier and deposited in the lagoon.
The features of Units V and III show they were deposited by FFs that result from excessive and torrential rainfall at high altitudes, which drain downstream into coastal lowlands. Units V and III contained only sharp and erosional contacts with the storm-deposited sand layers both above and below (Figure 3). Due to the wide space between the Thanh Lam lagoon and the Hoa Duan barrier, it can be assumed that, when FFs occurred, the water column was strong and high enough to propagate across the lagoon basin. Normally, the sediments of FFs are suspended material (silt and clay) from terrestrial OM sources (Owens et al., 2005). These sediments were then combined with lagoon sediment and water (a source of organic and carbonate content) under turbulent (Cheel, 1990; Fielding, 2006) and hyperpycnal flows (Zavala and Pan, 2018), and then transported seawards and deposited on the sandy barrier. Under these flows, FFs could have disturbed the bed sediment in the lagoon (silt and clay), dispersing and suspending them in the flood waters.
However, the continuity of FF layers in Unit III of core VN2 is absent because this layer was eroded and scoured by the storm flooding of Unit II, as indicated by the MRCs in VN1 and VN3, and Pits 1 and 3 of Unit II. If this was the case, the FF layer should have a wedge-shaped profile getting thicker and finer seaward. It is possible that fluvial flooding was wider than storm inundation, propagating to the open sea (not limited to the barrier area) until it weakened and was calm enough to deposit the fine-grained sediments as Units III and V. Thus, the thickness of the FF during the deposition layers is dependent on the local topography.
Moreover, some parts of the FFDs include sand-sized materials, which indicate reworking of preexisting sediment in the barrier area, redeposited by the flood itself. Although some FF sedimentation contains sand-grained sediment similar to storm deposits, geochemical data from LOI indicate a substantial shift in the organic and carbonate contents toward the overlying and underlying layers (Figures 4–6). These shifts appear in peaks between the storm and FFDs, suggesting different flow directions; that is, storm floods flowed landward, transporting sediments from the sea, while FFs flowed seawards, carrying terrestrial and marine (lagoon) sediments.
Relevance of Grain Size Parameters for Classification
Mean grain size, sorting, skewness, and kurtosis were used to characterize each unit in the cores (Units I–VII) and shore-normal process samples (recent beach sediment). These grain parameters have also been analyzed by others in sediments from various zones of coastal environments, such as beaches, dunes, berms, and rivers, which are affected by significantly different natural dynamic processes (e.g., Folk and Ward, 1957; Mason and Folk, 1958; Friedman, 1961, 1967; Bagnold, 1963). The scatter plot of the mean grain size against the sorting showed the differentiation of beach sediment, storm sediments, and FF sediments quite clearly (Figure 10). Other plots that demonstrated a trend are presented in Supplementary Figure 1.
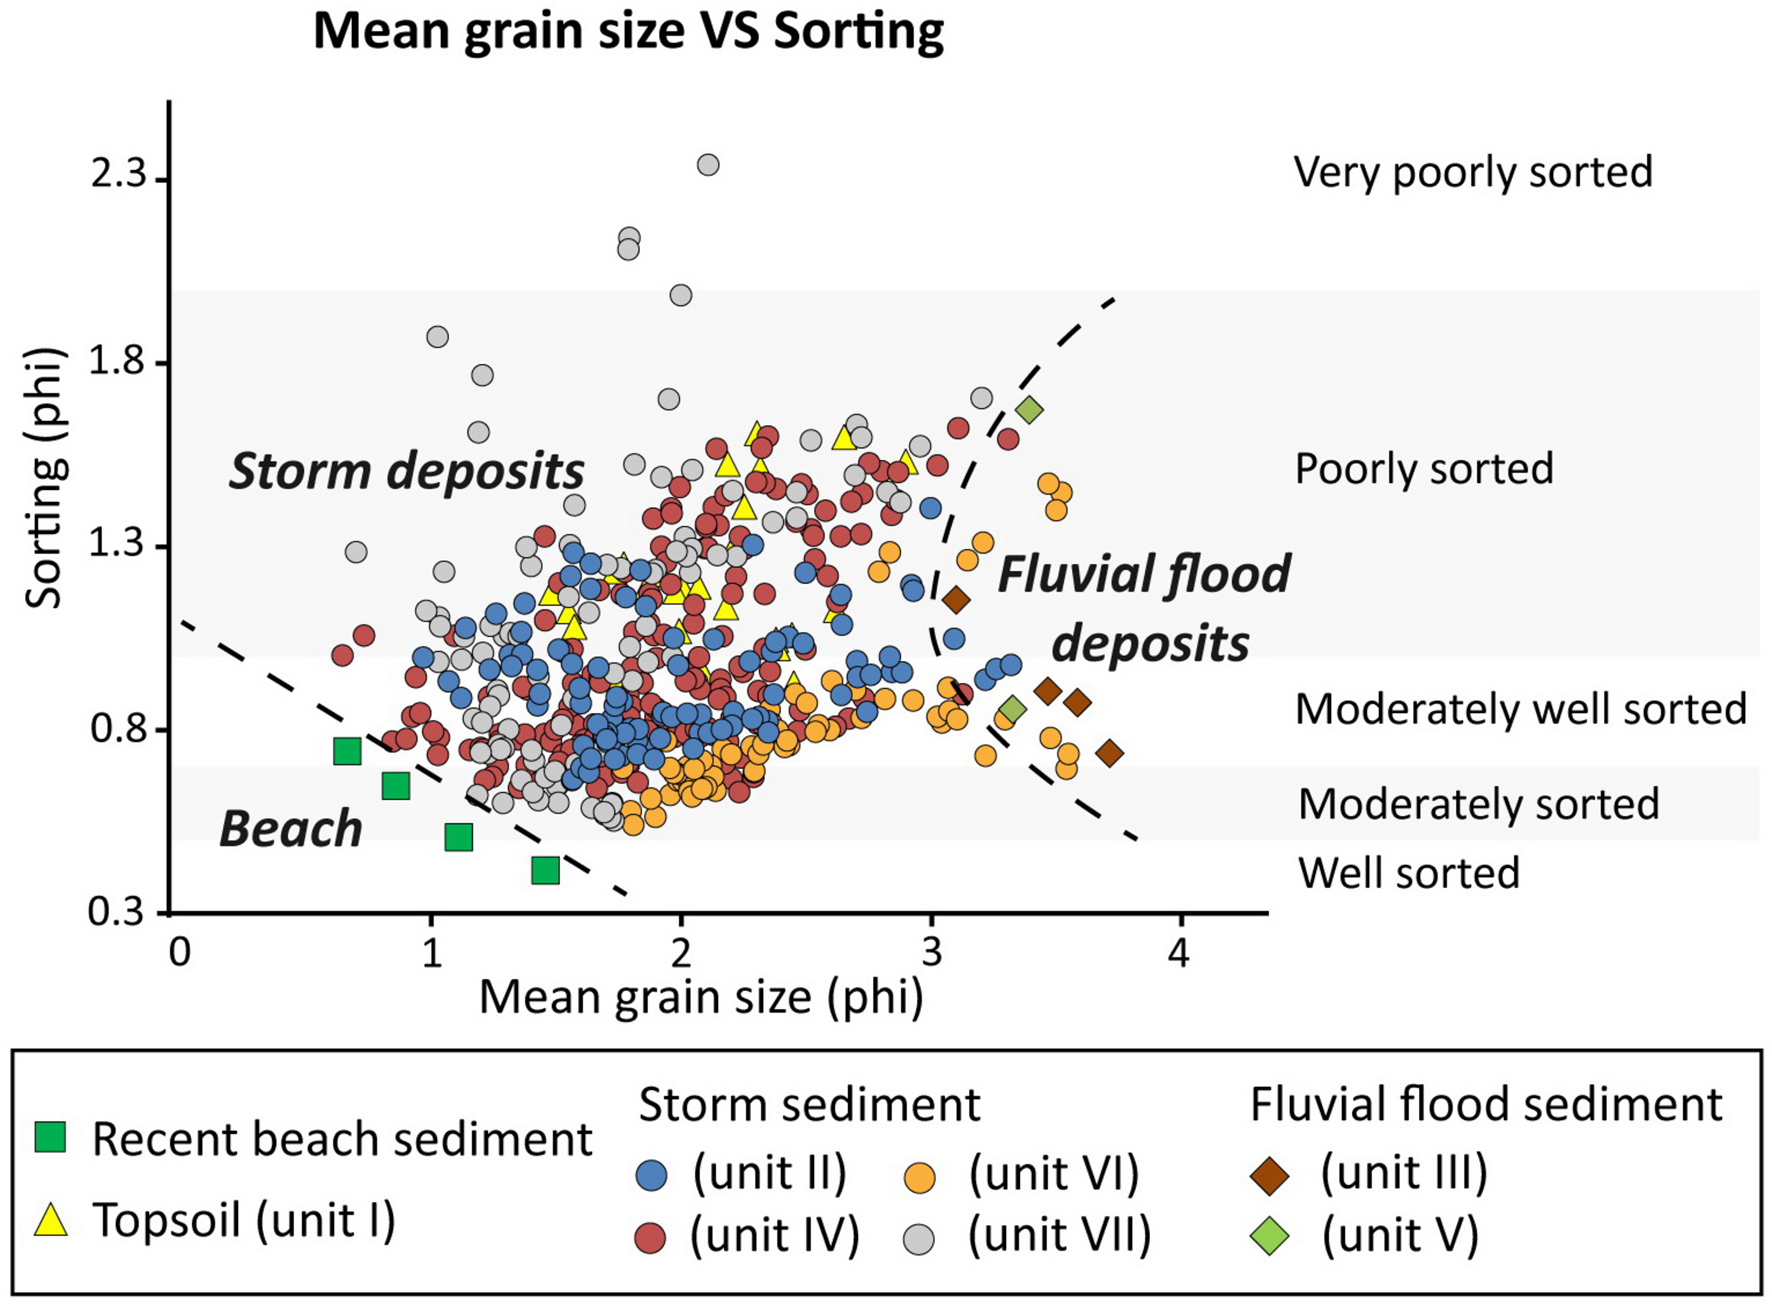
Figure 10. Plotting statistical values of the mean grain size versus sorting. The number of sediments plotted is as follows: recent beach (n = 4), Unit I (n = 27), Unit II (n = 97), Unit III (n = 4), Unit IV (n = 177), Unit V (n = 2), Unit VI (n = 69), and Unit VII (n = 94). The dashed line divides the zone of a statistical distribution pattern of beach sediment, storm sediment, and FF sediment.
When comparing the mean grain size and sorting (Figure 10), the recent beach sediments had coarse to medium sand and were moderate to well-sorted, while the storm sediments had medium to very fine sand and were moderate to moderately well sorted, although some parts were poorly sorted. The topsoil sediment (Unit I) seemed to be distributed in similar patterns to the storm sediment (Units II, IV, and VII), which implied that a storm deposited the topsoil. In Units III and V, FFD sediments had very fine sand and tended to have lower skewness phi values and higher mean grain size phi values than the storm sediments (Units II, IV, VI, and VII), shore-normal beach, and topsoil sediment (Unit I) (Figure 10; Supplementary Figure 1; Supplementary Table 1).
Comparisons between the grain size distribution curves and plotted grain size parameters (Figures 9, 10) revealed that the majority of storm sediments were transported from beaches. This is based on the mixing and overlapping in the plots, which is consistent with the grain size distribution curves of the recent beach sediment. Furthermore, reworking and redepositing of the preexistent storm layers were also identified in Unit II of core VN2. It is also possible that both units were reworked and redeposited during the next storm event (Williams, 2011). Topsoil sediments had predominantly bimodal distributions, while storm sediments in Unit II exhibited a unimodal distribution. However, it is reasonable to assume the topsoil sediments of Unit I were part of the storm sediments in Unit II because of their similar grain size distribution curves, which both indicated medium to fine sand. Thus, the very fine sand in the topsoil sediment possibly originated from transportation during rainfall. All of this is also demonstrated by the similarity in physical properties (composition, roundness, and sphericity) of storm deposits, topsoil sediments, and recent beach sediments (Supplementary Table 1).
The comparison of grain size distribution curves (Figure 8) revealed that there was no finer-grained sediment (silt and clay) in the recent beach and storm deposits, especially in Units II, VI, and VI. Note that the grain size distribution curves of the silt and clay in the storm sediment of Unit VII are the distribution curves of MRCs. The absence of silt-sized and/or clay-sized sediments in the storm deposits is common, especially in surf zones and/or breaker zones, because most grains smaller than 0.140 mm remain suspended or are washed away by waves (Friedman, 1967). Usually, fine-grained particles smaller than 0.150 mm (>2.75 phi) influenced by oscillatory water movement are swept up by waves, dispersed in the water column, and then transported offshore (Bagnold, 1963; Ingle, 1966). However, finer-grained sediments in the range of silt and clay were found in the grain size distribution curves of the FF sediments (Units III and V; Figure 8). This supports the difference in the grain size distribution curves between the storm and FF sediments.
Age of Depositional Events
In principle, the Hoa Duan barrier would have accumulated from the transportation of longshore currents, of which we do not know the exact age or origin point. Based on the OSL dating (Table 1; see the location of the sample point in Figure 1C) of sediments from ST2 at 50-cm depth from the surface, the depositional age of the sand barrier can be estimated. Sample ST2 was the oldest and was deposited around 520 ± 25 years ago, while the OSL dates of the nearby ST3 and ST7 at 50 cm depth and ST8 and ST8-1 at 30 m and 50 cm depth, respectively, have ages of 350 ± 25, 350 ± 50, 340 ± 60, and 300 ± 50 years, respectively. We can conclude that the barrier in this area has been accumulating for a long time, starting earlier than 520 ± 25 years ago, then stopping somewhere between 350 ± 50 and 300 ± 50 years ago. This assumption matches a historical French map, which confirms the existence of this barrier and lagoon in the late seventeenth century (Schweyer, 2018; Tana, 2019). However, it is peculiar that OSL dating of the investigated transect (ST4, ST5, and ST6) returned ages younger than other locations: modern, modern, and 130 ± 10 yr, respectively, which is similar to the modern age of ST1 (see the location of the sample point in Figure 1C). With the difference in the OSL ages in this area, we discuss more on the issues of the evolution of the barrier formation, the disastrous events (both storm and FF), and the historical data in see section “Dynamic and Evolution of the Hoa Duan Sand Barrier.”
Dynamic and Evolution of the Hoa Duan Sand Barrier
The closing and opening of the Hoa Duan inlet tended to rework the sand barrier sediments. The morphological change in the Hoa Duan barrier was chronologically observed in the Google Earth Timelapse (Supplementary Figure 2). Based on Lam et al. (2007), in 1952, the barrier formation here tended to grow gradually from southeast to northwest direction. The location of the Thuan An inlet was different and then from its present location because it was blocked from the sand body of the barrier (Supplementary Figure 2A). Similarly, comparing the location of the study area from 1952 to 1999, the shape of the Hoa Duan barrier was narrower than in the present. The satellite images indicate that the Hoa Duan barrier (study area) was relatively stable between 1952 and 1999 before a strong FF in November 1999. In 2000, the satellite image showed the Hoa Duan barrier had been affected by the FF in November 1999, resulting in a dramatic morphological change that breached and scoured the sediment of the barrier seawards, contributing to an ephemeral inlet. After that, the Hoa Duan barrier recovered during 2000–2003.
In terms of the recovery process, the observable recovery of the Hoa Duan barrier was relatively rapid, being filled up with sand materials within 3 years after the destructive flood of November 1999. Before the flood, the Hoa Duan barrier was a stable barrier formation with sediment accumulation in the northwest direction, as shown in Supplementary Figure 2A. After the flood in November 1999, breaching of the Hoa Duan barrier until lit became an ephemeral inlet (Hoa Duan inlet), which created the large accommodation space suitable for the rapid rate of deposition (Choowong et al., 2009) by trapping the sediment materials of the northwestward longshore current and depositing it laterally and vertically within the Hoa Duan inlet. Later, the closing of the Hoa Duan inlet occurred in 2001, and the rate of the deposition then seems to have decreased from 2001 to 2003 due to the reduction of accommodation space, whereas the beach zone remained stable. In 2003, the accommodation space greatly decreased and the barrier formation almost returned to the normal state, but the shape of the barrier had become wider than it was in 1999 before the flood event. The Hoa Duan barrier has remained stable until the present day.
There have been 37 tropical storms and 26 typhoons recorded in central Vietnam from 1951 to 2019 (Supplementary Table 2), and so it is possible that increasing barrier sedimentation, as observed from the crest of the barrier height up to 2-m amtl (Figure 2E), might have been generated from storm waves that created the upward deposition of sediments (Otvos, 2000; Snedden et al., 2011; Nott, 2015; Tamura et al., 2017) under the overwash regime (Sallenger, 2000). Although it is relatively difficult to confirm the depositional process for the whole barrier and the known flood and storm event due to the complexity of its formation and the lack of reliable records, the OSL dates of ST4, ST5, and ST6 at a 40-cm depth from the surface can serve as a cut-off point and indicate 130 ± 10 years ago to present. Thus, more than 130 ± 10 years ago, there were two storms (Units VI and VII) and one FF (Unit V) that deposited sediment on the barrier, and there were two storms (Units IV and II) and one FF (Unit III), depositing from 130 ± 10 years ago to present. The presence of sedimentary layers from prior natural hazard events in this sand barrier emphasized the necessity for coastal communities to initiate adapting measures in order to mitigate the loss from upcoming natural hazards.
Conclusion
Sedimentary records of past storm surges and FF events found on the Hoa Duan barrier island revealed the episodic natural hazard events at the Thua Thien Hue province, central Vietnam. Four layers of storm deposits and two layers of FFDs from three cores were recognized. Sedimentary characteristics, grain size statistic parameters, and OSL dating were used to define the storm surge and FF events in the past centuries.
Storm sediments were characterized by having coarser grain sizes, with a low organic and carbonate content, containing sedimentary structures, including parallel and inclined landward lamination, multiple sets of normal and reverse grading, MRCs, and sharp and erosional contacts (both top and bottom), with finer-grained layers. Conversely, FFDs contained only fine to very-fine sand, strikingly high organic and carbonate contents, and only sharp erosional top and bottom contacts with coarser-grained layers.
Comparisons between grain size distribution curves of the storm and fluvial sediments indicated that they both had a unimodal distribution but differed in sediment size. Comparing grain size parameters (mean, sorting, skewness, and kurtosis) revealed the clearest differentiation between storms and FFs is the plot of mean grain size against sorting. These sedimentological analogs can also be used as a diagnostic key for storm deposits and FFDs in places with similar geomorphological conditions. Based on the OSL results, we suggest that before 130 ± 10 years ago, two storms (Units VI and VII) and one FF (Unit V) deposited sediment on the barrier, and, from 130 ± 10 years ago to the present, deposits were made by two storms (Units II and IV) and one FF (Unit III).
These sedimentary records indicate natural events that affected people and property locally and in the wider region. Although no tsunami deposits have been recognized in this study site, the characteristic of storms and flood deposits from this analysis, more or less, confirms the frequency of these two catastrophic events. A diagnostic sedimentary key of these two hazards can help improve the understanding of the geomorphological evolution of the studied site and other parts of this coastal region to remind the coastal community to prepare well for future coastal hazards.
Data Availability Statement
All datasets generated for this study are included in the article/Supplementary Material.
Author Contributions
MC led the research. SK, MC, SP, NC, and SF designed and planned the study. SK, NC, SF, DV, and DT carried out the fieldwork. SK performed the sedimentological analyses and LOI. SK and FP carried out the OSL dating. SK, MC, and SP wrote the manuscript and drew the graphics and tables. MC and SC involved an essentially intellectual contributor and planned necessary fieldwork logistics and funding acquisition. MC, SP, SC, and FP provided critical discussions and contributions to the manuscript. All authors contributed to the article and approved the submitted version.
Funding
The Royal Golden Jubilee Ph.D. program (Grant No. PHD/0198/2560) (3.G.CU/60/B.1) supported to SK financially.
Conflict of Interest
The authors declare that the research was conducted in the absence of any commercial or financial relationships that could be construed as a potential conflict of interest.
Publisher’s Note
All claims expressed in this article are solely those of the authors and do not necessarily represent those of their affiliated organizations, or those of the publisher, the editors and the reviewers. Any product that may be evaluated in this article, or claim that may be made by its manufacturer, is not guaranteed or endorsed by the publisher.
Acknowledgments
The MESA Research Unit of the Department of Geology, Chulalongkorn University, and the Institute of Earth and Environmental Sciences, University of Freiburg, Germany, are acknowledged for logistics and laboratory works. The authors express their gratitude to the Google Earth Timelapse (https://earthengine.google.com/timelapse/) for providing free access to all satellite images used in this study. Special thanks also go to Alexander Fülling and Jenny Wolff for support with De sample preparation, and measurements. Johannes Miocic is acknowledged for their valuable guidance and constructive comments. The authors are thankful to the reviewers and editor for their comments that greatly improved the quality of the manuscript.
Supplementary Material
The Supplementary Material for this article can be found online at: https://www.frontiersin.org/articles/10.3389/fevo.2021.746143/full#supplementary-material
References
Allen, J. R. L. (1984). Parallel lamination developed from upper-stage plane beds: A model based on the larger coherent structures of the turbulent boundary layer. Sediment. Geol. 39, 227–242. doi: 10.1016/0037-0738(84)90052-6
Avramidis, P., Bekiari, V., Kontopoulos, N., and Kokidis, N. (2013). Shallow coastal lagoon sediment characteristics and water physicochemical parameters – Myrtari lagoon, Mediterranean Sea, western Greece. Fresenius Environ. Bull. 22, 1628–1635.
Bagnold, R. A. (1963). “Mechanics of marine sedimentation,” in The Sea: Ideas and Observations on Progress, Vol. 3, ed. M. L. Hill (New York, NY: Interscience), 507–528.
Beckman, M., An, L. V., and Bao, L. Q. (2002). Living with the Floods: Coping and Adaptation Strategies of Households and Local institutions in Central Vietnam. Stockholm: Stockholm Environmental Institution, 1–52.
Bevacqua, A., Yu, D., and Zhang, Y. (2018). Coastal vulnerability: Evolving concepts in understanding vulnerable people and places. Environ.Sci. Policy 82, 19–29. doi: 10.1016/j.envsci.2018.01.006
Blott, S. J., and Pye, K. (2001). GRADISTAT: a grain size distribution and statistics package for the analysis of unconsolidated sediment. Earth Surf. Process. Landforms 26, 1237–1248. doi: 10.1002/esp.261
Brady, N. C., and Weil, R. R. (1999). The Nature and Properties of Soils. Upper Saddle River, N J: Prentice Hall, Inc.
Bridge, J. S. (1978). “Planar and parallel lamination,” in Encyclopedia of Sediments and Sedimentary Rocks, eds G. V. Middleton and M. Coniglio, and Hardie (Berlin: Springer), doi: 10.1007/978-1-4020-3609-5_161
Bridge, J. S. (1984). Large-scale facies sequences in alluvial overbank environments. J. Sediment. Petrol. 54, 583–588. doi: 10.1306/212F8477-2B24-11D7-8648000102C1865D
Cadigan, R. A. (1961). Geologic interpretation of grain-size distribution measurements of Colorado Plateau sedimentary rock. J. Geol. 69, 121–144. doi: 10.1086/626724
Cheel, C. R. (1990). Horizontal lamination and the sequence of bed phases and stratification under upper-flow-regime conditions. Sedimentology 37, 517–529. doi: 10.1111/j.1365-3091.1990.tb00151.x
Choowong, M., Phantuwongraj, S., Charoentitirat, T., Chutakositkanon, V., Yumuang, S., and Charusiri, P. (2009). Beach recovery after 2004 Indian Ocean tsunami from Phang-nga, Thailand. Geomorphology 104, 134–142. doi: 10.1016/j.geomorph.2008.08.007
Cooper, J. A. G. (1989). Fairweather versus flood sedimentation in Mhlanga Lagoon, Natal: implications for environmental management. S. Afr.J.Geol. 92, 279–294.
Cui, L., Ge, Z., Yuan, L., and Zhang, L. (2015). Vulnerability assessment of the coastal wetlands in the Yangtze Estuary, China to sea-level rise,Estuar. Coast. Shelf Sci. 156, 42–51. doi: 10.1016/j.ecss.2014.06.015
Dastgheib, A., Reyns, J., Thammasittirong, S., Weesakul, S., Thatcher, M., and Ranasinghe, R. (2016). Variation in the Wave Climate and Sediment Transport Due to Climate Change along the Coast of Vietnam. J. Mar. Sci. Eng. 86, 1–20. doi: 10.3390/jmse4040086
Day, J. W. Jr., Cable, J. E., Lane, R. R., and Kemp, G. P. (2016). Sediment deposition at the Caernarvon crevasse during the Great Mississippi Flood of 1927: Implications for coastal restoration. Water 38, 1–12. doi: 10.3390/w8020038
Degering, D., and Degering, A. (2020). Change is the only constant - time-depentdent dose rates in luminescence dating. Quat. Geochronol. 58, 1–14. doi: 10.1016/j.quageo.2020.101074
Donnelly, J. P. (2005). Evidence of past intense tropical cyclones from back barrier Salt Pond sediment: a case study from Isla de Culebrita Puerto Rico, USA. J. Coast. Res. 42, 201–210.
Donnelly, J. P., Roll, S., Wengren, M., Butler, J., Lederer, R., and Webb, I. I. I. (2001). Sedimentary evidence of intense hurricane strikes from New Jersey. Geology 29, 615–618.
Fielding, C. R. (2006). Upper flow regime sheet, lenses, and scour fills: extending the range of architect elements for fluvial sediment bodies. Sediment. Geol. 190, 227–240. doi: 10.1016/j.sedgeo.2006.05.009
Folk, R. L., and Ward, W. C. (1957). Brazos River bar: A study in the significance of grain size parameters. J. Sediment. Petrol. 27, 3–26. doi: 10.1306/74d70646-2b21-11d7-8648000102c1865d
Friedman, G. M. (1961). Distinction between dune, beach, and river sands from their textural characteristics. J. Sediment. Petrol. 31, 514–529. doi: 10.1306/74D70BCD-2B21-11D7-8648000102C1865D
Friedman, G. M. (1967). Dynamic processes and statistical parameters compared for size frequency distribution. J. Sediment. Petrol. 37, 327–354. doi: 10.1306/74D716CC-2B21-11D7-8648000102C1865D
Fritz, W. J., and Moore, J. N. (1988). Basics of physical stratigraphy and sedimentology. New York, NY: John Wiley, 371.
Galbraith, R. F., Robert, R. G., Lasleft, G. M., Yoshoda, H., and Olley, J. M. (1999). Optical dating of single and multiple grains of quartz from Jinmium rock shelter, northern Australia: Part I, experimental design and statistical models. Archaeometry 41, 339–364. doi: 10.1111/j.1475-4754.1999.tb00987.x
Gornitz, V. (1991). Global coastal hazards from future sea level rise. Palaeogeogr. Palaeoclimatol. Palaeoecol. 89, 379–398. doi: 10.1016/0031-0182(91)90173-O
Goslin, J., and Clemmensen, L. B. (2017). Proxy records of Holocene storm events in coastal barrier systems: Storm-wave induced markers. Quat. Sci. Rev. 174, 80–119. doi: 10.1016/j.quascirev.2017.08.026
Heiri, O., Lotter, A. F., and Lemcke, G. (2001). Loss on ignition as a method for estimating organic and carbonate content in sediments: reproducibility and comparability of results. J. Paleolimnol. 25, 101–110. doi: 10.1023/A:1008119611481
Hemer, M., Fan, Y., Mori, N., Semedo, A., and Wang, X. L. (2013). Projected changes in wave climate from a multi-model ensemble. Nat. Clim. Chang. 3, 471–476.
Hirai, Y., Lap, N. V., and Oanh, T. T. K. (2008). Assessment of Impacts of Sea Level Rise on Tam Giang-Cau Hai Lagoon Area Based on a Geomorphological Survey Map. Regional Views 21, 1–8.
Imamura, F., and To, D. V. (1997). Flood and Typhoon Disasters in Viet Nam in the Half Century Since 1950. Nat. Hazards 15, 7–87. doi: 10.1023/A:1007923910887
IPCC (2014). “Summary for policymakers.In: Climate Change 2014: Impacts, Adaptation, and Vulnerability. Part A: Global and Sectoral Aspects,” in Contribution of Working Group II to the FifthAssessment Report of the Intergovernmental Panel on Climate Change, eds C. B. Field, V. R. Barros, D. J. Dokken, K. J. Mach, M. D. Mastrandrea, T. E. Bilir, et al. (Cambridge.: Cambridge UniversityPress), 1–32.
Khan, N. S., Horton, B. P., McKee, K. L., Jerolmack, D., Falcini, F., Enache, M. D., et al. (2013). Tracking sedimentation from the historic A.D. 2011 Mississippi River flood in the deltaic wetlands of Louisiana. Geology 41, 391–394. doi: 10.1130/G33805.1
Kleinen, J. (2002). Historical perspectives on typhoons and tropical storms in the natural and socio-economic system of Nam Dinh (Vietnam). J. Asian Earth Sci. 29, 523–531. doi: 10.1016/j.jseaes.2006.05.012
Kongsen, S., Phantuwongraj, S., and Choowong, M. (2021). Distinguishing Late Holocene storm deposit from shore-normal beach sediments from the Gulf of Thailand. Front. Earth Sci. 9:1–18. doi: 10.3389/feart.2021.625926
Kontopoulos, N., and Bouzos, N. (2011). The sedimentology of the modern lagoons in the Western Paloponnesus. Bull. Geol. Soc. Greece 44, 1–18. doi: 10.12681/bgsg.11144
Lam, N. T., Stive, M. J. F., Verhagen, H. J., and Wang, Z. B. (2007). Morphodynamics of Hue tidal inlets, Vietnam. Asian and Pacific Coast 2007. September 21-24, 2007. Nanjing: China.
Larson, M., Hung, N. M., Hanson, H., Sundstrom, A., and Sodervall, E. (2014). “Impacts of Typhoons on the Vietnamese Coastline: A Case Study of Hai Hau Beach and Ly Hoa Beach,” in Coastal Disasters and Climate Change in Vietnam: Engineering and Planning Perspectives, eds N. D. Thao, H. Takagi, and M. Esteban (London: Elsevier), 422. doi: 10.1016/B978-0-12-800007-6.00002-2
Leatherman, S. P., and Williams, A. T. (1983). Vertical sedimentation units in a barrier island washover fan. Earth Surf. Process. Landf. 8, 141–150. doi: 10.1002/esp.3290080205
Lee, C.-S., Lin, Y.-L., and Cheung, K. K. W. (2006). Tropical Cyclone Formation in the South China Sea Associated with the Mei-Yu Front. Mon. Weather Rev. 134, 2670–2687. doi: 10.1175/MWR3221.1
Liu, K. B. (2004). “Paleotempestology: Geographic Solutions to Hurricane Hazard Assessment and Risk Prediction,” in WorldMinds: Geographical Perspectives on 100 Problems, eds D. Janelle, B. Warf, and K. Hansen (Dordrecht: Springer), 443–448. doi: 10.1007/978-1-4020-2352-1_72
Liu, K. B. (2007). “Paleotempestology,” in Encyclopedia of Quaternary Science, ed. S. Elias (Amsterdam: Elsevier), 1978–1986.
Liu, K. B., and Fearn, M. L. (1993). Lake-sediment record of late Holocene hurricane activities from coastal Alabama. Geology 21, 793–796. doi: 10.1130/0091-76131993021<0793:LSROLH<2.3.CO;2
Liu, K. B., and Fearn, M. L. (2000a). “Holocene history of catastrophic hurricane landfalls along the Gulf of Mexico coast reconstructed from coastal lake and marsh sediments,” in Current stresses and potential vulnerabilities: implications of global change for the Gulf Coast Region of the United States, eds Z. H. Ning and K. K. Abdollahi (Baton Rouge: Gulf Coast Region Climate Change Council and Franklin press), 38–47.
Liu, K. B., and Fearn, M. L. (2000b). Reconstruction of prehistoric landfall frequencies of catastrophic hurricanes in northwestern Florida from lake sediment records. Quat. Res. 54, 238–245. doi: 10.1006/qres.2000.2166
Luijendijk, A., Hagenaars, G., Ranasinghe, R., Baarr, F., Donchyts, G., and Aarninkhof, S. (2018). The State of the World’s Beaches. Sci. Rep. 8:6641. doi: 10.1038/s41598-018-24630-6
Maanan, M., Maanan, M., Rueff, H., Adouk, N., Zourarah, B., and Rhinane, H. (2018). Assess the human and environmental vulnerability for coastal hazard by using a multi-criteria decision analysis.Hum.Ecol. Risk Assess 24, 1642–1658. doi: 10.1080/10807039.2017.1421452
Mason, C. C., and Folk, R. L. (1958). Differentiation of beach, dune, and aeolian flat environments by size analysis, Mustang Island, Texas. J. SedimentPetrol. 28, 211–226. doi: 10.1306/74D707B3-2B21-11D7-8648000102C1865D
Masselink, G., and Heteren, S. (2014). Response of wave-dominated and mixed-energy barriers to storms. Mar. Geol. 352, 321–347. doi: 10.1016/j.margeo.2013.11.004
Mathers, S., and Zalasiewicz, J. (1999). Holocene Sedimentary Architecture of the Red River Delta, Vietnam. J. Coast. Res. 15, 314–325.
Matsumoto, D., Sawai, Y., Yamada, M., Namegaya, Y., Shinozaki, T., Tekeda, D., et al. (2016). Erosion and sedimentation during the September 2015 flooding of the Kinu River, central Japan. Sci. Rep. 6, 1–10. doi: 10.1038/srep34168
McGranahan, G., Balk, D., and Anderson, B. (2007). The rising tide: assessing the risks of climate change and human settlements in low elevation coastal zones. Environ. Urbaniz. 19, 17–37. doi: 10.1177/0956247807076960
Morton, R. A., Gelfenbaum, G., and Jaffe, B. E. (2007). Physical criteria for distinguishing sandy tsunami and storm deposits using modern examples. Sediment. Geol. 200, 184–207. doi: 10.1016/j.sedgeo.2007.01.003
Morton, R. A., and Sallenger, A. H. Jr. (2003). Morphological impacts of extreme storms on Sandy Beaches and Barriers. J. Coast. Res. 19, 560–576.
Murray, A. S., and Wintle, A. G. (2000). Luminescence dating of quartz using an improved single-aliquot regenerative-dose protocol. Radiat. Meas. 32, 57–73.
Nanayama, F., Shigeno, K., Satake, K., Shimokawa, K., Koitabashi, S., Miyasaka, S., et al. (2000). Sedimentary differences between the 1993 Hokkaido-nansei-oki tsunami and the 1959 Miyakojima typhoon at Taisei, southwestern Hokkaido, northern Japan. Sediment. Geol. 135, 255–264. doi: 10.1016/s0037-0738(00)00076-2
Nerem, R. S., Beckley, B. D., Fasullo, J. T., Hamlington, B. D., Masters, D., and Mitchum, G. T. (2018). Climate-change–driven accelerated sea-level rise detected in the altimeter era. Proc. Nat. Acad. Sci. U.S.A. 115, 2022–2025. doi: 10.1073/pnas.1717312115
Nga, P. H., Takara, K., and Van, N. C. (2018). Integrated approach to analyze the total flood risk for agriculture: The significance of intangible damages – A case study in Central Vietnam. Int. J. Disaster Risk Reduct. 31, 862–872. doi: 10.1016/j.ijdrr.2018.08.001
Nghiem, T. L., Stive, M. J. F., Verhagen, H. J., and Wang, Z. B. (2007). Morphodynamics of Hue tidal inlets, Vietnam. Proceedings of the Fourth International Conference on Asian and Pacific Coasts. Nanjing: China Ocean Press, 692–705.
Nguyen, P. H., Bui, Q. C., and Nguyen, X. D. (2012). Investigation of earthquake tsunami source, capable of affecting Vietnamese coast. Nat. Hazards 64, 311–327. doi: 10.1007/s11069-012-0240-3
Nguyen Huu, N., and Duong, Q.-N. (2015). “Situation of erosion, accretion in Thua Thien Hue province and countermeasure,” in Vietnam-Japan Workshop on Estuaries, Coasts and Rivers 2015 (Hoi An), 2–7.
Nott, J. F. (2015). “Chapter 5 – Palaeostorm Surges and inundations,” in Coastal and Marine Hazard, Risk, and Disaster, eds J. F. Shroder, J. T. Ellis, and D. J. Sherman (Amsterdam: Elsevier), 129–152. doi: 10.1016/B978-0-12-396483-0.00005-4
Otvos, E. G. (2000). Beach ridges – definitions and significance. Geomorphology 32, 83–108. doi: 10.1016/S0169-555X(99)00075-6
Owens, P. N., Batalla, R. J., Collins, A. J., Gomez, B., Hicks, D. M., Horowitz, A. J., et al. (2005). Fine-grained sediment in river systems: environmental significance and management issues. River Res. Appl. 21, 693–717. doi: 10.1002/rra.878
Phantuwongraj, S., and Choowong, M. (2012). Tsunami versus storm deposits from Thailand. Nat. Hazards 63, 31–50. doi: 10.1007/s11069-011-9717-8
Phantuwongraj, S., Choowong, M., Nanayama, F., Hisada, K., Charusiri, P., Chutakositkanon, V., et al. (2013). Coastal geomorphic conditions and styles of storm surge washover deposits from Southern Thailand. Geomorphology 192, 43–58. doi: 10.1016/j.geomorph.2013.03.016
Powers, W. C. (1953). A new roundness scale for sedimentary particle. J. Sediment. 23, 117–119. doi: 10.1306/D4269567-2B26-11D7-8648000102C1865D
Prescott, J. R., and Hutton, J. T. (1994). Cosmic ray distributions to dose rates for luminescence and ESR dating: large depths and long-term variations. Radiat. Measur. 23, 497–500.
Rogozhin, E. A. (2016). Traces of Ancient Tsunamis in the Coastal Parts of South China Sea. Izv. Atmos. Ocean. Phy. 52, 683–696. doi: 10.1134/S0001433816070070
Rosenthal, Y., Holbourn, A. E., Kulhanek, D. K., Aiello, I. W., Babila, T. L., Bayon, G., et al. (2018). “Expedition 363 methods,” in Proceedings of the International Ocean Discovery Program (College Station, TX), 363. doi: 10.14379/iodp.proc.363.102.2018
Rothwell, R. G. (1989). Minerals and Mineraloids in Marine Sediments: An Optical Identification Guide. London: Elsevier.
Rubin, D. M., Nelson, J. M., and Topping, D. J. (1998). Relation of inversely graded deposits to suspended-sediment grain-size evolution during the 1996 flood experiment in Grand Canyon. Geology 26, 99–102. doi: 10.1130/0091-76131998026<0099:ROIGDT<2.3.CO;2
Schweyer, A. V. (2018). “Exploitation of a historical geographic information system (GIS) in the Thua Thiên-Hue and Quang Tri provinces, Central Vietnam,” in Selected Papers from the Second SEAMEO SPAFA International Conference on Southeast Asian Archaeology, ed. N. H. Tan (Bangkok: SEAMEO SPAFA), 227–235.
Sedgwick, P. E., and Davis, R. A. (2003). Stratigraphy of washover deposits in Florida: implicationsfor recognition in the stratigraphic record. Mar. Geol. 200, 31–48. doi: 10.1016/S0025-3227(03)00163-4
Snedden, J. W., Tillman, R. W., and Culver, S. J. (2011). Genesis and Evolution of a Mid-Shelf, Storm-Built Sand Ridge, New Jersey Continental Shelf, U.S.A. J. Sediment. Res. 81, 534–552. doi: 10.2110/jsr.2011.26
Tamura, T., Nicholas, W. A., Oliver, T. S. N., and Brooke, B. P. (2017). Coarse-sand beach ridges at Cowley Beach, north-eastern Australia: Their formative processes and potential as records of tropical cyclone history. Sedimentology 65, 721–744. doi: 10.1111/sed.12402
Tana, L. (2019). The Changing Landscape of the Former Linyi in the Provinces of Quang Tri and Thua Thiên-Hue. NSC Working Paper No.30. Singapore: ISEAS – Yusof Ishak Institute.
Thuy, N. B., Kim, S., Chien, D. D., Dang, V. H., and Hole, L. R. (2017). Assessment of storm surge along the coast of central Vietnam. J. Coast. Res. 33, 518–530. doi: 10.2112/JCOASTRES-D-15-00248.1
Trieu, C. D., Dung, L. V., Bach, M. X., Hung, P. N., Trong, C. D., Tuan, T. A., et al. (2017). Some preliminary results of paleo-tsunami study in the coastal region of the Nghe An province, Vietnam. J. Mar. Sci. Tech. 17, 108–114. doi: 10.15625/1859-3097/17/4B/12998
Vousdoukas, M. I., Ranasinghe, R., Mentaschi, L., Plomaritis, T. A., Athanasiou, P., Luijendijk, A., et al. (2020). Sandy coastlines under threat of erosion. Nat. Clim.Change. 10, 260–263. doi: 10.1038/s41558-020-0697-0
Vu, T. T., and Ranzi, R. (2017). Flood risk assessment and coping capacity of floods in central Vietnam. J. Hydro-eviron. Res. 14, 44–60. doi: 10.1016/j.jher.2016.06.001
Wang, G., Su, J., Ding, Y., and Chen, D. (2007). Tropical cyclone genesis over the south China sea. J. Mar. Syst. 68, 318–326. doi: 10.1016/j.jmarsys.2006.12.002
Wentworth, C. K. (1922). A scale of grade and class terms for clastic sediments. J. Geol. 30, 377–392.
Williams, H. (2010). Storm surge deposition by Hurricane Ike on the McFadden National Wildlife Refuge, Texas: implication for paleotempestology studies. J. Foramin.Res. 40, 210–219.
Williams, H. (2011). Stratigraphic record of Hurricanes Audrey, Rita and Ike in the Chenier Plain of southwest Louisiana. J. Coast. Res. 64, 1921–1926.
Williams, H. (2013). 600-year sedimentary archive of hurricane strikes in a prograding beach ridge plain, southwestern Louisiana. Mar. Geol. 336, 170–183.
Williams, H., Choowong, M., Phantuwongraj, S., Surakietchai, P., Kongsen, S., and Simon, E. (2016). Geologic records of Holocene Typhoon Strikes on the Gulf of Thailand coast. Mar. Geol. 372, 66–78.
Williams, H., Hoang, L. V., Elliott, P., Nguyen, H. H., and Manh, H. (2019). A Tentative Record of Mid-Holocene Sea-Level Highstand and Barrier Overwash from Cam River Mount, Vietnam. J. Coast. Res. 35, 852–860. doi: 10.2112/JCOASTRES-D-18-00126.1
Yamada, M., Fujino, S., Goff, J., and Chague-Goff, C. (2016). Large-scale erosion and overbank deposition caused by the July 2013 flood of the Abu River, Yamaguchi City, Japan. Isl. Arc 25, 386–399. doi: 10.1111/iar.12162
Yamashita, S., Nakajo, T., Nishida, N., and Naruse, H. (2011). Characteristics and depositional pattern of fluvial-flooding event at 2009 in the Kushida River Delta, Ise bay, central Japan. J.Sediment. Soc. Jap. 70, 81–92. doi: 10.4096/jssj.70.81
Yao, Q., Liu, K. B., Williams, H., Joshi, S., Bianchette, T. A., Ryu, J., et al. (2019). Hurricane Harvey Storm Sedimentation in the San Bernard National Wildlife Refuge, Texas: Fluvial Versus Storm Surge Deposition. Estuar. Coast 43, 971–983. doi: 10.1007/s12237-019-00639-6
Zavala, C., and Pan, S. (2018). Hyperpycnal flows and hyperpycnites: Origin and distinctive characteristics. Lithologic Reservoirs 30, 1–27. doi: 10.3969/j.issn.1673-8926.2018.01.001
Keywords: storm deposit, fluvial flood deposit, OSL dating, barrier island, Vietnam
Citation: Kongsen S, Phantuwongraj S, Choowong M, Chawchai S, Chaiwongsaen N, Fuengfu S, Vu DTA, Tuan DQ and Preusser F (2021) Barrier Island Sediments Reveal Storm Surge and Fluvial Flood Events in the Past Centuries at Thua Thien Hue, Central Vietnam. Front. Ecol. Evol. 9:746143. doi: 10.3389/fevo.2021.746143
Received: 23 July 2021; Accepted: 04 October 2021;
Published: 09 November 2021.
Edited by:
Pedro J. M. Costa, University of Coimbra, PortugalReviewed by:
Hajar E. L. Talibi, Abdelmalek Essaâdi University, MoroccoSelvaraj Kandasamy, Xiamen University, China
Copyright © 2021 Kongsen, Phantuwongraj, Choowong, Chawchai, Chaiwongsaen, Fuengfu, Vu, Tuan and Preusser. This is an open-access article distributed under the terms of the Creative Commons Attribution License (CC BY). The use, distribution or reproduction in other forums is permitted, provided the original author(s) and the copyright owner(s) are credited and that the original publication in this journal is cited, in accordance with accepted academic practice. No use, distribution or reproduction is permitted which does not comply with these terms.
*Correspondence: Sumet Phantuwongraj, cGhhbnR1d29uZ3Jhai5zQGdtYWlsLmNvbQ==; Montri Choowong, TW9udHJpLmNAY2h1bGEuYWMudGg=