 Genevieve Diedericks
 Chris Broeckhoven3
 Sophie von der Heyden
 Cang Hui
- 1Centre for Invasion Biology, Department of Botany and Zoology, Stellenbosch University, Stellenbosch, South Africa
- 2Evolutionary Genomics Group, Department of Botany and Zoology, Stellenbosch University, Stellenbosch, South Africa
- 3Department of Biology, Laboratory of Functional Morphology, University of Antwerp, Antwerp, Belgium
- 4Centre for Invasion Biology, South African Institute for Aquatic Biodiversity, Makhanda, South Africa
- 5Centre for Invasion Biology, Department of Mathematical Sciences, Stellenbosch University, Stellenbosch, South Africa
- 6Mathematical Biosciences Group, African Institute for Mathematical Sciences, Cape Town, South Africa
Dispersal is an essential life-history trait crucial to species persistence and diversification. This is particularly important in spatiotemporal fluctuating environments such as freshwater habitats, where species movement is confined to the dendritic network and wetted boundaries. To persist in such fluctuating environments, a species can modify, adaptively and plastically, its phenotypic variation to better match the environment or escape via directed dispersal to a more suitable habitat (i.e., matching habitat choice). We use the invasive smallmouth bass, Micropterus dolomieu, sampled at 10 km intervals, to assess the effect of directed dispersal on the fine scale genetic and phenotypic variation in populations of M. dolomieu along a river course. Gene flow was used as a proxy for dispersal. By comparing population genetic structure, morphological variation (of linear traits and geometric landmarks), and environmental heterogeneity, we discovered a clear correlation between environmental variation and morphological traits. Although isolation by distance seemed to have shaped the overall genetic pattern detected among the populations, the strong genetic structuring observed within the Ratel tributary appeared to be non-random. These results provide novel insights into the potential mechanisms promoting the spread and establishment of invasive species and the possible influence multiple introductions may have on fine scale genetic structuring.
Introduction
Dispersal is a life-history trait essential to the persistence, diversification and evolution of species (Edelaar and Bolnick, 2012; Saastamoinen et al., 2018). Although exchange of individuals between populations has typically been considered to occur at random (Patterson et al., 2008; Clobert et al., 2009), a paradigm shift is changing the way dispersal is perceived. No longer thought to occur at random, active dispersal can reflect the response of individual phenotypes to the surrounding environment (Bowler and Benton, 2005; Edelaar et al., 2008; Clobert et al., 2009; Edelaar and Bolnick, 2012; Hui et al., 2012; Jacob et al., 2015). As many environments are known to be both spatially heterogeneous and temporally variable (Bonte and Dahirel, 2017), individuals need to sample and compare different environments while making decisions on their next move (Edelaar et al., 2008; Zhang and Hui, 2014). Dispersing away from core populations not only benefits individuals with reduced competition intensity (Dytham, 2009; Rubenson and Olden, 2017) but may also provide opportunistic niches and resources for survival (Ronce, 2007; Clobert et al., 2009).
As a phenotype-environment mismatch is bound to occur in any heterogeneous environment, species could mitigate the mismatch by fine-tuning its phenotypic variation or simply preserving a general-purpose phenotype via phenotypic plasticity or local adaptation (Richards et al., 2006). Individuals can also move into more suitable environments via matching habitat choice (Edelaar et al., 2008; Edelaar and Bolnick, 2012; Camacho and Hendry, 2020). Matching habitat choice, as proposed by Edelaar et al. (2008) states that individuals will select and settle in environments that complement their phenotype, and in doing so drive directed dispersal. All three mechanisms can jointly affect local performance, population structure and genetic diversity (Arendt, 2015; Nicolaus and Edelaar, 2018). For instance, increasing the rate of random dispersal can genetically homogenize populations, by reducing genetic differentiation between populations (Haldane, 1948; Endler, 1973; Slatkin, 1985) and potentially limiting local adaptation (Edelaar and Bolnick, 2012; Jacob et al., 2015) and even speciation (Lucek et al., 2013). In contrast, directed dispersal (associated with matching habitat choice) is thought to promote genetic differentiation and potentially local adaptation when coupled with natural selection (Benkman, 2016), ultimately increasing local population genetic structure (Edelaar et al., 2008; Edelaar and Bolnick, 2012). Indeed, in a recent simulation study by Nicolaus and Edelaar (2018), incorporating both neutral and functional traits in addition to mild environmental fluctuations, the authors observed random dispersal to erode population genetic structuring, while non-random dispersal maintained strong population differentiation with little within-population variance. However, despite directed dispersal receiving increased attention, few empirical studies have sought to test matching habitat choice (Benkman, 2016; Camacho et al., 2020), especially for introduced species in their invaded ranges.
Lotic systems in hydrologically diverse regions are characterized by extensive spatiotemporal fluctuations in both biotic and abiotic conditions (Winemiller et al., 2010). Thus, fish that inhabit such environments are expected to match their environment and adapt swiftly to these pressures by maximizing their locomotive capabilities essential for feeding, spawning and predator avoidance (Via et al., 1995), which may be of particular importance in the face of climate change and anthropogenic activities. Nevertheless, most freshwater fishes often face movement constraints, as dispersal is limited to the wetted boundaries, and in riverine environments, the dendritic network (Garant et al., 2007; Olden et al., 2010). In this regard, numerous studies on freshwater fishes have revealed the correlation between functional traits and environmental variations (e.g., swimming and feeding performance; Keast and Webb, 1966; Vogel, 1994; Langerhans et al., 2003; Langerhans, 2008; Langerhans and Reznick, 2010). Indeed, Drakou et al. (2009) demonstrated that dispersal limitations play a bigger role in structuring fish communities than habitat heterogeneity.
Within freshwater ecosystems, invasive fish have been particularly favored as model organisms due to their superior dispersal abilities, essential for invasion success, when compared to native fishes (Lodge et al., 1998; Sala et al., 2000; Beisel, 2001; Rubenson and Olden, 2017). Moreover, it has been shown that dispersal opportunities, rather than species composition or favorable abiotic conditions of the recipient community, are an important component mediating aquatic invasions (Ricciardi and MacIsaac, 2000). This is likely because introduced fish are often from mixed genetic stock (Diedericks et al., 2018a,b), and unlikely to exhibit fine genetic structuring or matching habitat choice, as one would expect for native fish.
One such freshwater invader is the smallmouth bass, Micropterus dolomieu. Native to the east-central parts of the United States of America and two Canadian provinces, M. dolomieu is currently recognized as an invasive species in at least 12 countries worldwide, including South Africa (Loppnow et al., 2013). Although M. dolomieu has been described as a sedentary species when inhabiting riverine environments, establishing and guarding home ranges (Todd and Rabeni, 1989; Ridgway and Shuter, 1996), studies have observed remarkable fluctuations in dispersal behaviors when populations are subjected to environments with fluctuating habitat suitability, often leading to extensive movement in an attempt to colonize new habitats (Lyons and Kanehl, 2002; Hui and Richardson, 2017; Rubenson and Olden, 2017). Moreover, in a recent study by Diedericks et al. (2018a), significant population genetic structure was detected for M. dolomieu across the invaded South African range. However, little is known about the species’ genetic diversity and phenotypic variability at fine spatial scales, both essential components to the successful establishment and spread of an invasive species (Prentis et al., 2008).
Considering the aforementioned, we investigate the fine scale genetic- and phenotypic variation in populations of M. dolomieu within an invaded river system in South Africa. Following the matching habitat choice hypothesis, we predict: (1) M. dolomieu to display strong genetic population structuring with little within-population variance; and (2) a strong correlation between phenotype and environment along the river course. In contrast, should dispersal occur at random, we would expect homogenous genetic population structure across sampled populations and no phenotype-environment correlation. Understanding the interplay between morphology, genetics and the environment and how species movement may affect it, is of fundamental importance when considering future range expansions of invasive species.
Materials and Methods
Study System and Sampling
The Olifants River is one of the largest river systems within the Western Cape (WC) Province of South Africa, with an approximate length of 285 km and a catchment area of 46,220 km2. The WC has a Mediterranean climate, with the Olifants River catchment receiving ∼ 90% of its rainfall in the winter months (Soderberg, 2003). In addition, the rain shadow effect sees the Cederberg Mountains to the East of the Olifants River receive double the amount of rain when compared to the main river valley (Soderberg, 2003; Figure 1). Extensive agricultural development and farming activities has occurred within the valley, leading to an increase in alien invasive vegetation and sedimentation, modified river bed, and reduced water quality (DWA, 2006; Supplementary Figure 1). Moreover, due to large amounts of water being used for irrigation in the middle reaches of the Olifants, large stretches of the main stem often dry up entirely during the summer months (DWA, 2006; Supplementary Figure 1). Despite the dire state of the Olifants River main stem, the tributaries and upper reaches still harbor near-pristine ecosystems (DWA, 2006). Two mainstream impoundments, namely Bulshoek and Clanwilliam Dam, constructed in 1919 and 1935, respectively, are situated within the Olifants River (Figure 1). Clanwilliam Dam possesses sluice gates and as such, prohibits upstream fish movement. Micropterus dolomieu, initially introduced for recreational fishing purposes, was released into the upper reaches of the Olifants River system in 1943 and 1945 (from the same breeding stock) and has since successfully invaded and established itself throughout the Olifants River system and its tributaries, including the two impoundments (Van der Walt et al., 2016). Although only one introduction event was historically recorded for M. dolomieu, Diedericks et al. (2018a) propose that multiple introductions offer a more likely scenario.
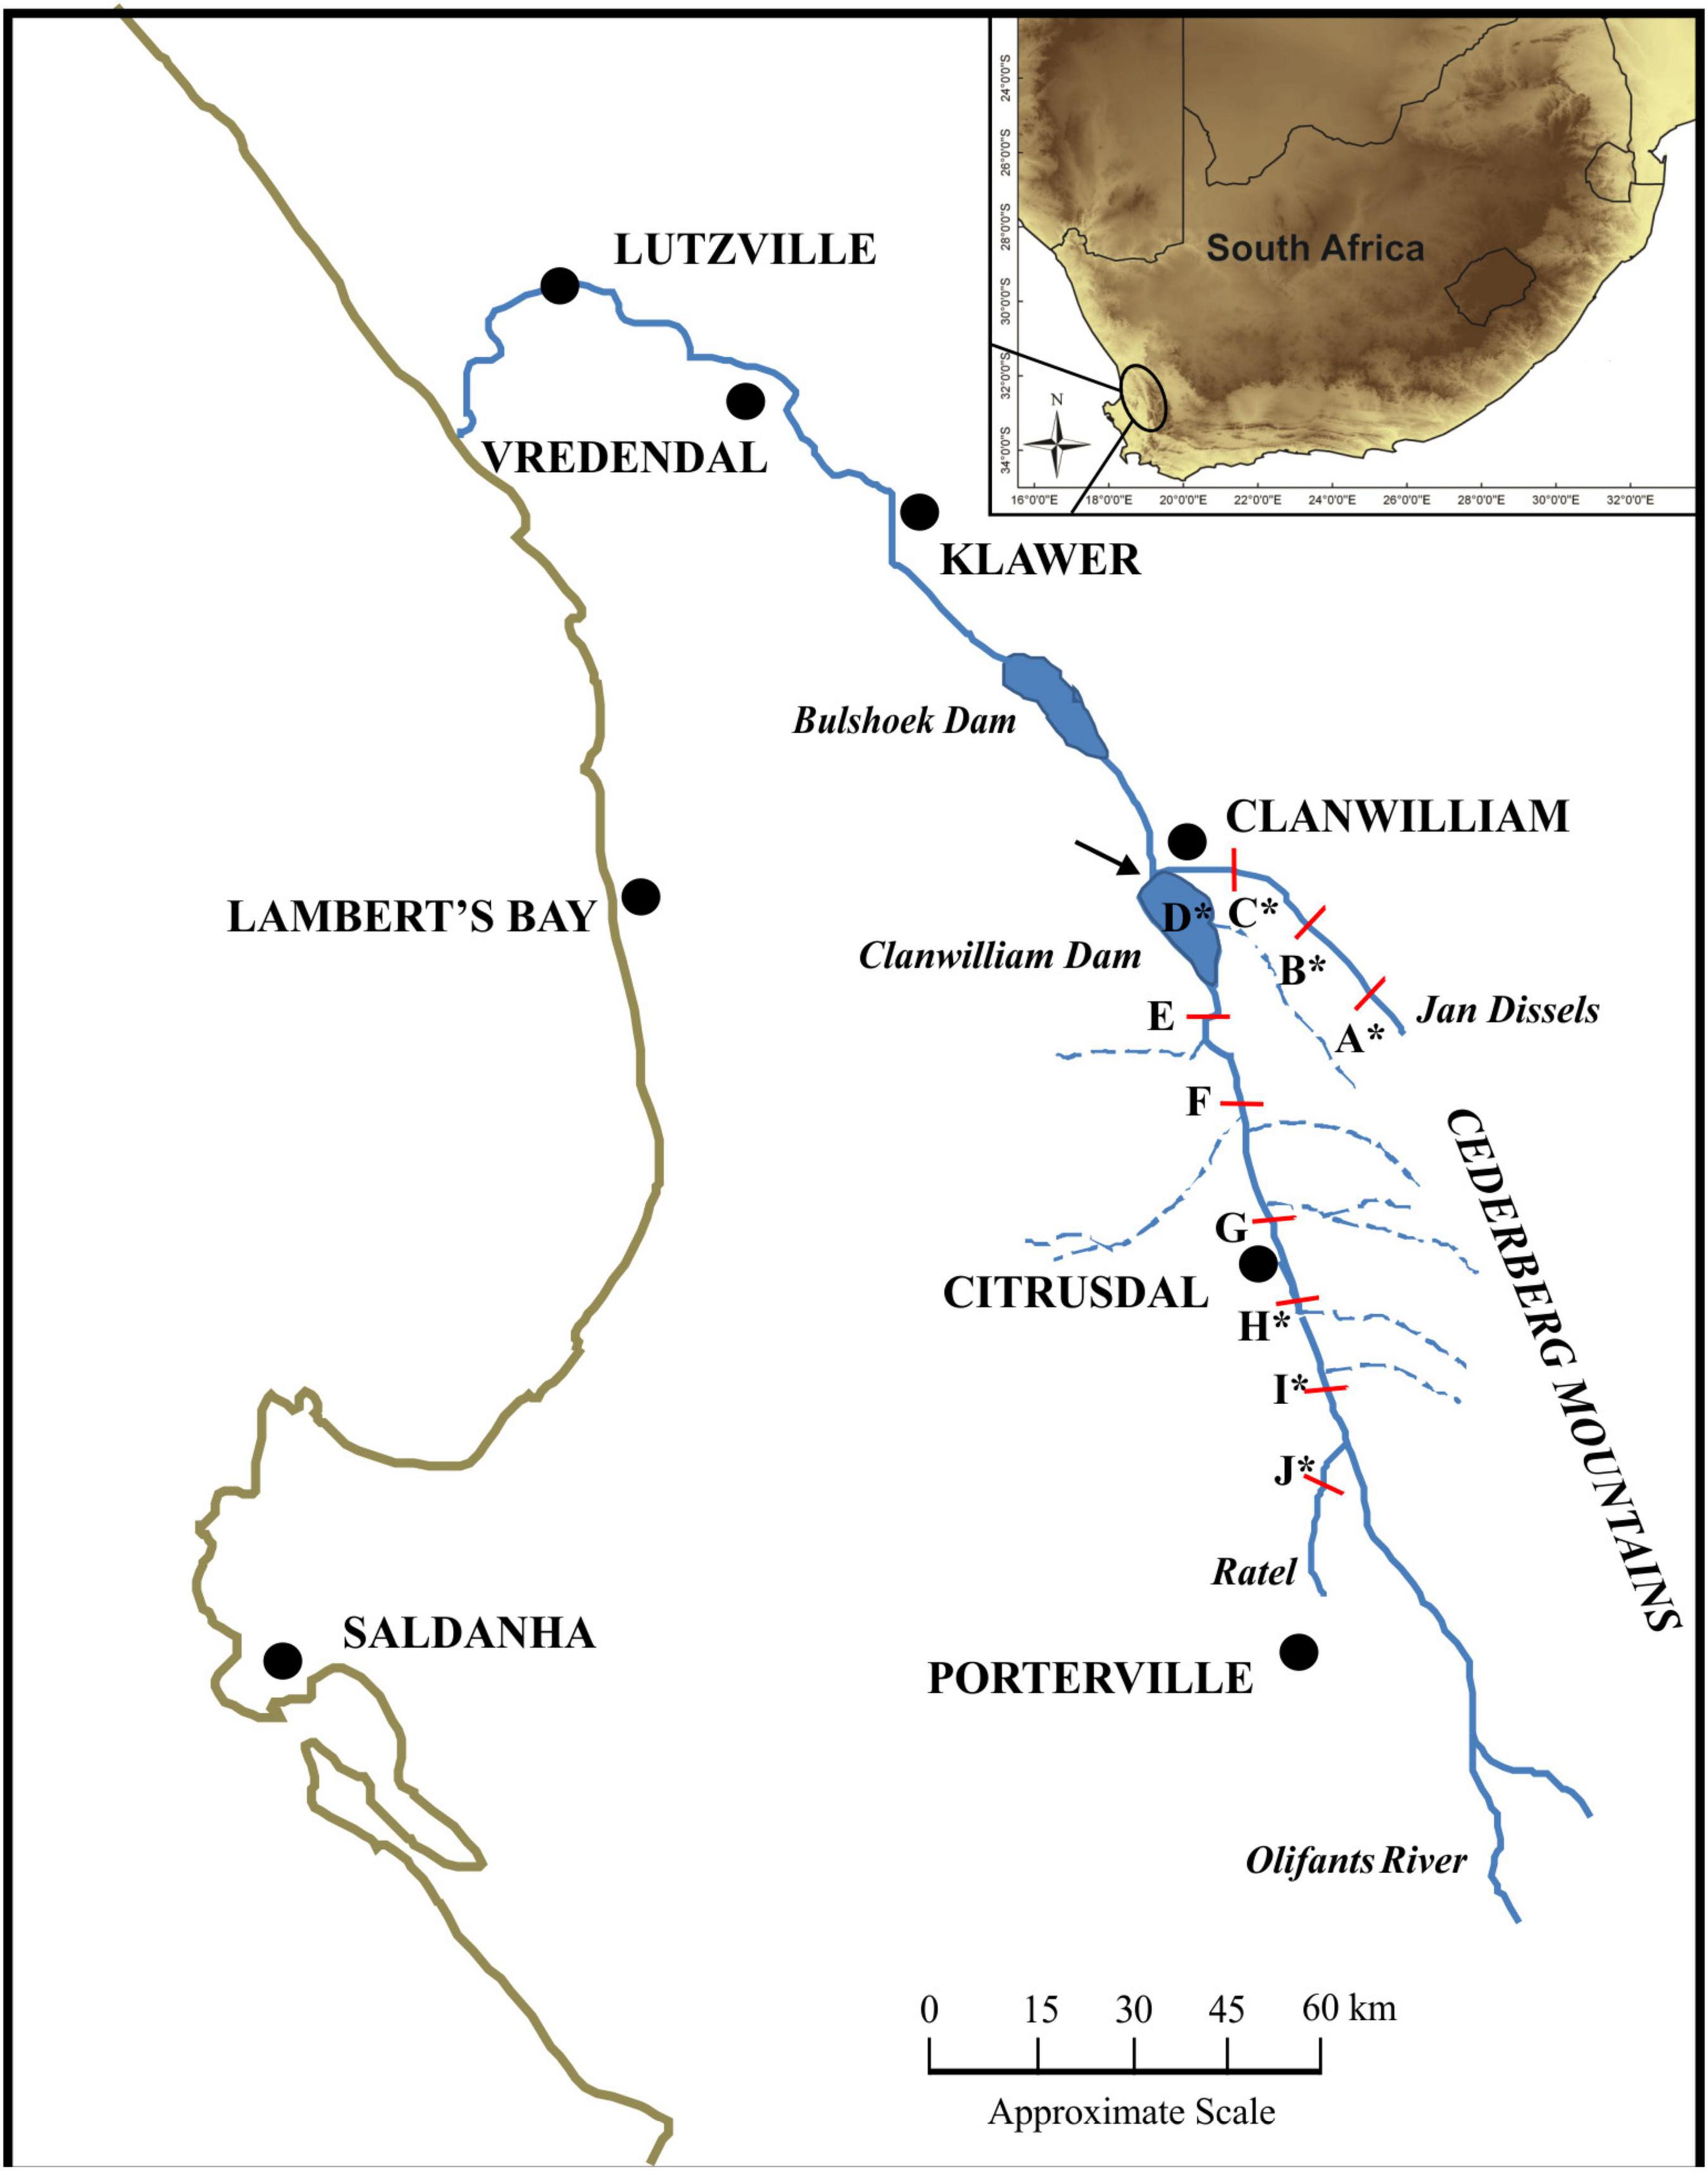
Figure 1. The sampling localities within the Olifants River system of the Western Cape, South Africa. All letters (A – J) represent sampled localities used for the linear and geometric morphometric measures, while localities sampled for the genetic analyses are indicated with an asterisk (*). Localities A – C represent those sampled in the Jan Dissels River tributary, while locality D represents the Clanwilliam Dam. Localities E – I represent sampled localities situated within the mainstem of the Olifants River and locality J represents the Ratel River tributary. The Clanwilliam Dam sluice gates are indicated with an arrow.
Approximately 20 M. dolomieu specimens were collected from ten localities spanning ∼100 km (total sample size, n = 203) in the austral summer (January – March) of 2015. Sampling occurred at approximately 10 km intervals and encompassed two tributaries, the Jan Dissels River (localities A-C) and the Ratel River (locality J) as well as the main stem of the Olifants River, including the Clanwilliam Dam (localities D-I; Figure 1). All specimens were collected by angling (CapeNature permit number: 0056-AAA043-00004) using standardized lure sizes, before being euthanized with clove oil (Ethical clearance reference number SU-ACUM14-00011, Stellenbosch University). A piece of muscle tissue was excised from the abdomen and stored in 70% ethanol for DNA extraction.
Environmental Data
Data characterizing the river topology, soil classification and hydroclimate for the Olifants River system were obtained from a near-global data set consisting of freshwater environmental variables (in a standardized 1 km grid) derived by Domisch et al. (2015). Given the potentially large spatial and temporal variation (Soderberg, 2003), and consequently large measurement error, localized environmental variables (e.g., pH, dissolved oxygen, salinity, etc.) were omitted. For each sampling locality, 16 variables (Supplementary Data Sheet 1) were extracted using the R packages RASTER 2.5-8 (Hijmans, 2016) and SP 1.2-4 (Pebesma, 2016). Firstly, four variables related to river topography were calculated. These include (1) average elevation across sub-catchment – “ELE,” (2) average river slope across sub-catchment – “RS,” (3) flow length (i.e., the number of upstream stream grid cells) – “FL” and (4) flow accumulation (i.e., the total number of upstream grid cells) – “FA.” Second, four variables that classify the soil type were obtained, including (5) sand content mass fraction across sub-catchment – “SNDPPT,” (6) silt content mass fraction across sub-catchment – “SLTPPT,” (7) clay content mass fraction across sub-catchment – “CLYPPT” and (8) coarse fragments (>2 mm fraction) volumetric across sub-catchment – “CFRVOL.” Lastly, we extracted eight bioclimatic variables, four characterizing air temperature and four describing precipitation averaged across sub-catchment, which were derived from the WorldClim database (Hijmans et al., 2005). Bioclimatic variables comprised (9) annual mean temperature – “BIO1,” (10) maximum temperature of warmest month – “BIO5, (11) temperature annual range – “BIO7,” (12) mean temperature of warmest quarter – “BIO10,” (13) annual precipitation – “BIO12,” (14) precipitation of wettest month – “BIO13,” (15) precipitation seasonality (i.e., coefficient of variation) – “BIO15” and (16) precipitation of wettest quarter – “BIO16” (Domisch et al., 2015). As Domisch et al. (2015) showed a strong correlation between water- and air temperature, the latter was used as a proxy for water temperature. Due to the highly correlated nature of the environmental variables, a principal component analysis (PCA) was conducted to avoid potential problems associated with multicollinearity. The PCA reduced the dataset to a smaller number of independent PC scores (hereafter referred to as “PCENVIRONMENT”), which were used in subsequent analyses.
Morphometric Measurements
Both linear and geometric measurements of morphometrics were employed to test for a correlation between phenotype and environment. All measurements were taken on fresh, unpreserved specimens. Firstly, a standardized photograph of the left lateral side of each fish was taken with a digital Sony DSC-HX100V camera. To ensure standardized images, the unpreserved specimens were pinned to laminated graph paper and a tripod, set to a standard height, was used. To quantify and visualize the body shape change between localities, 12 unambiguous and homologous landmarks were digitized using tpsDig2 version 2.17 software (Rohlf, 2013; Figure 2 and Supplementary Data Sheet 1). Twenty-five linear morphological characters, representing both swimming and feeding traits (Winemiller, 1991; Table 1, Figure 2, and Supplementary Data Sheet 1), were measured on site using digital calipers (model IP67, Mitutoyo Ltd., Japan) with a precision of 0.01 mm. In addition, an otolith from each fish was removed, cleaned and stored for aging analysis. Following the procedure described by Taylor and Weyl (2013), each otolith was sectioned and the growth rings counted to determine the age of each specimen. To ensure accurate age estimation, the specimens were aged by two of the authors (GD and OW) independently.
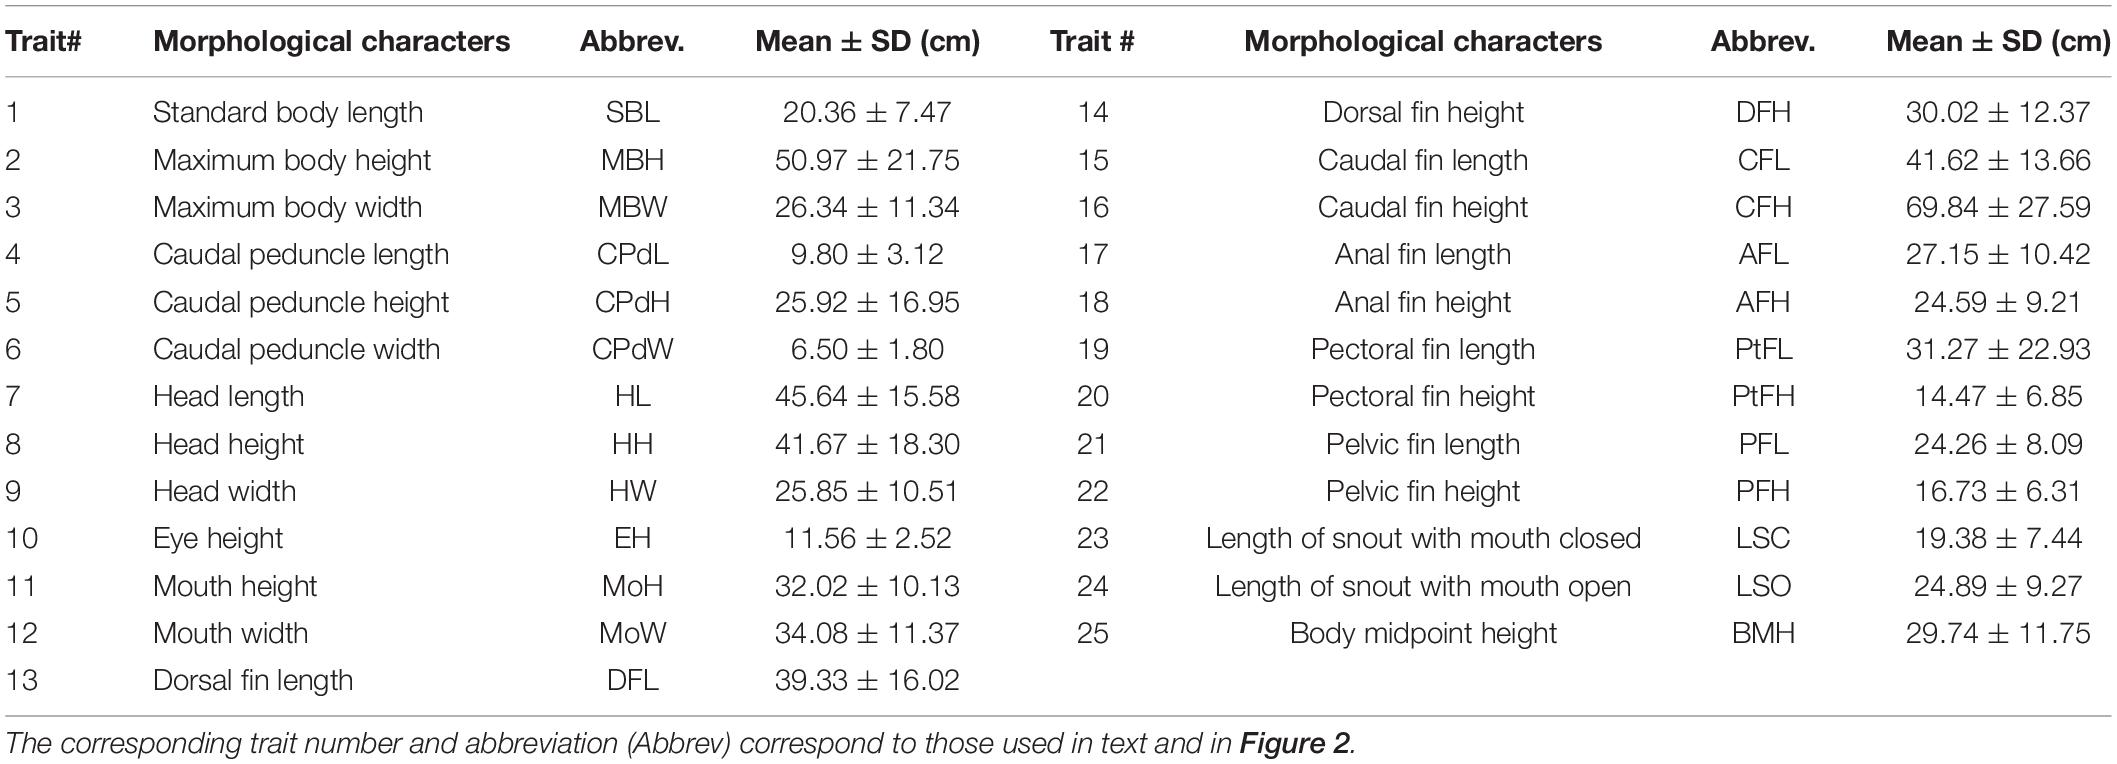
Table 1. Mean and standard deviation for each of the linear morphometric measurements.
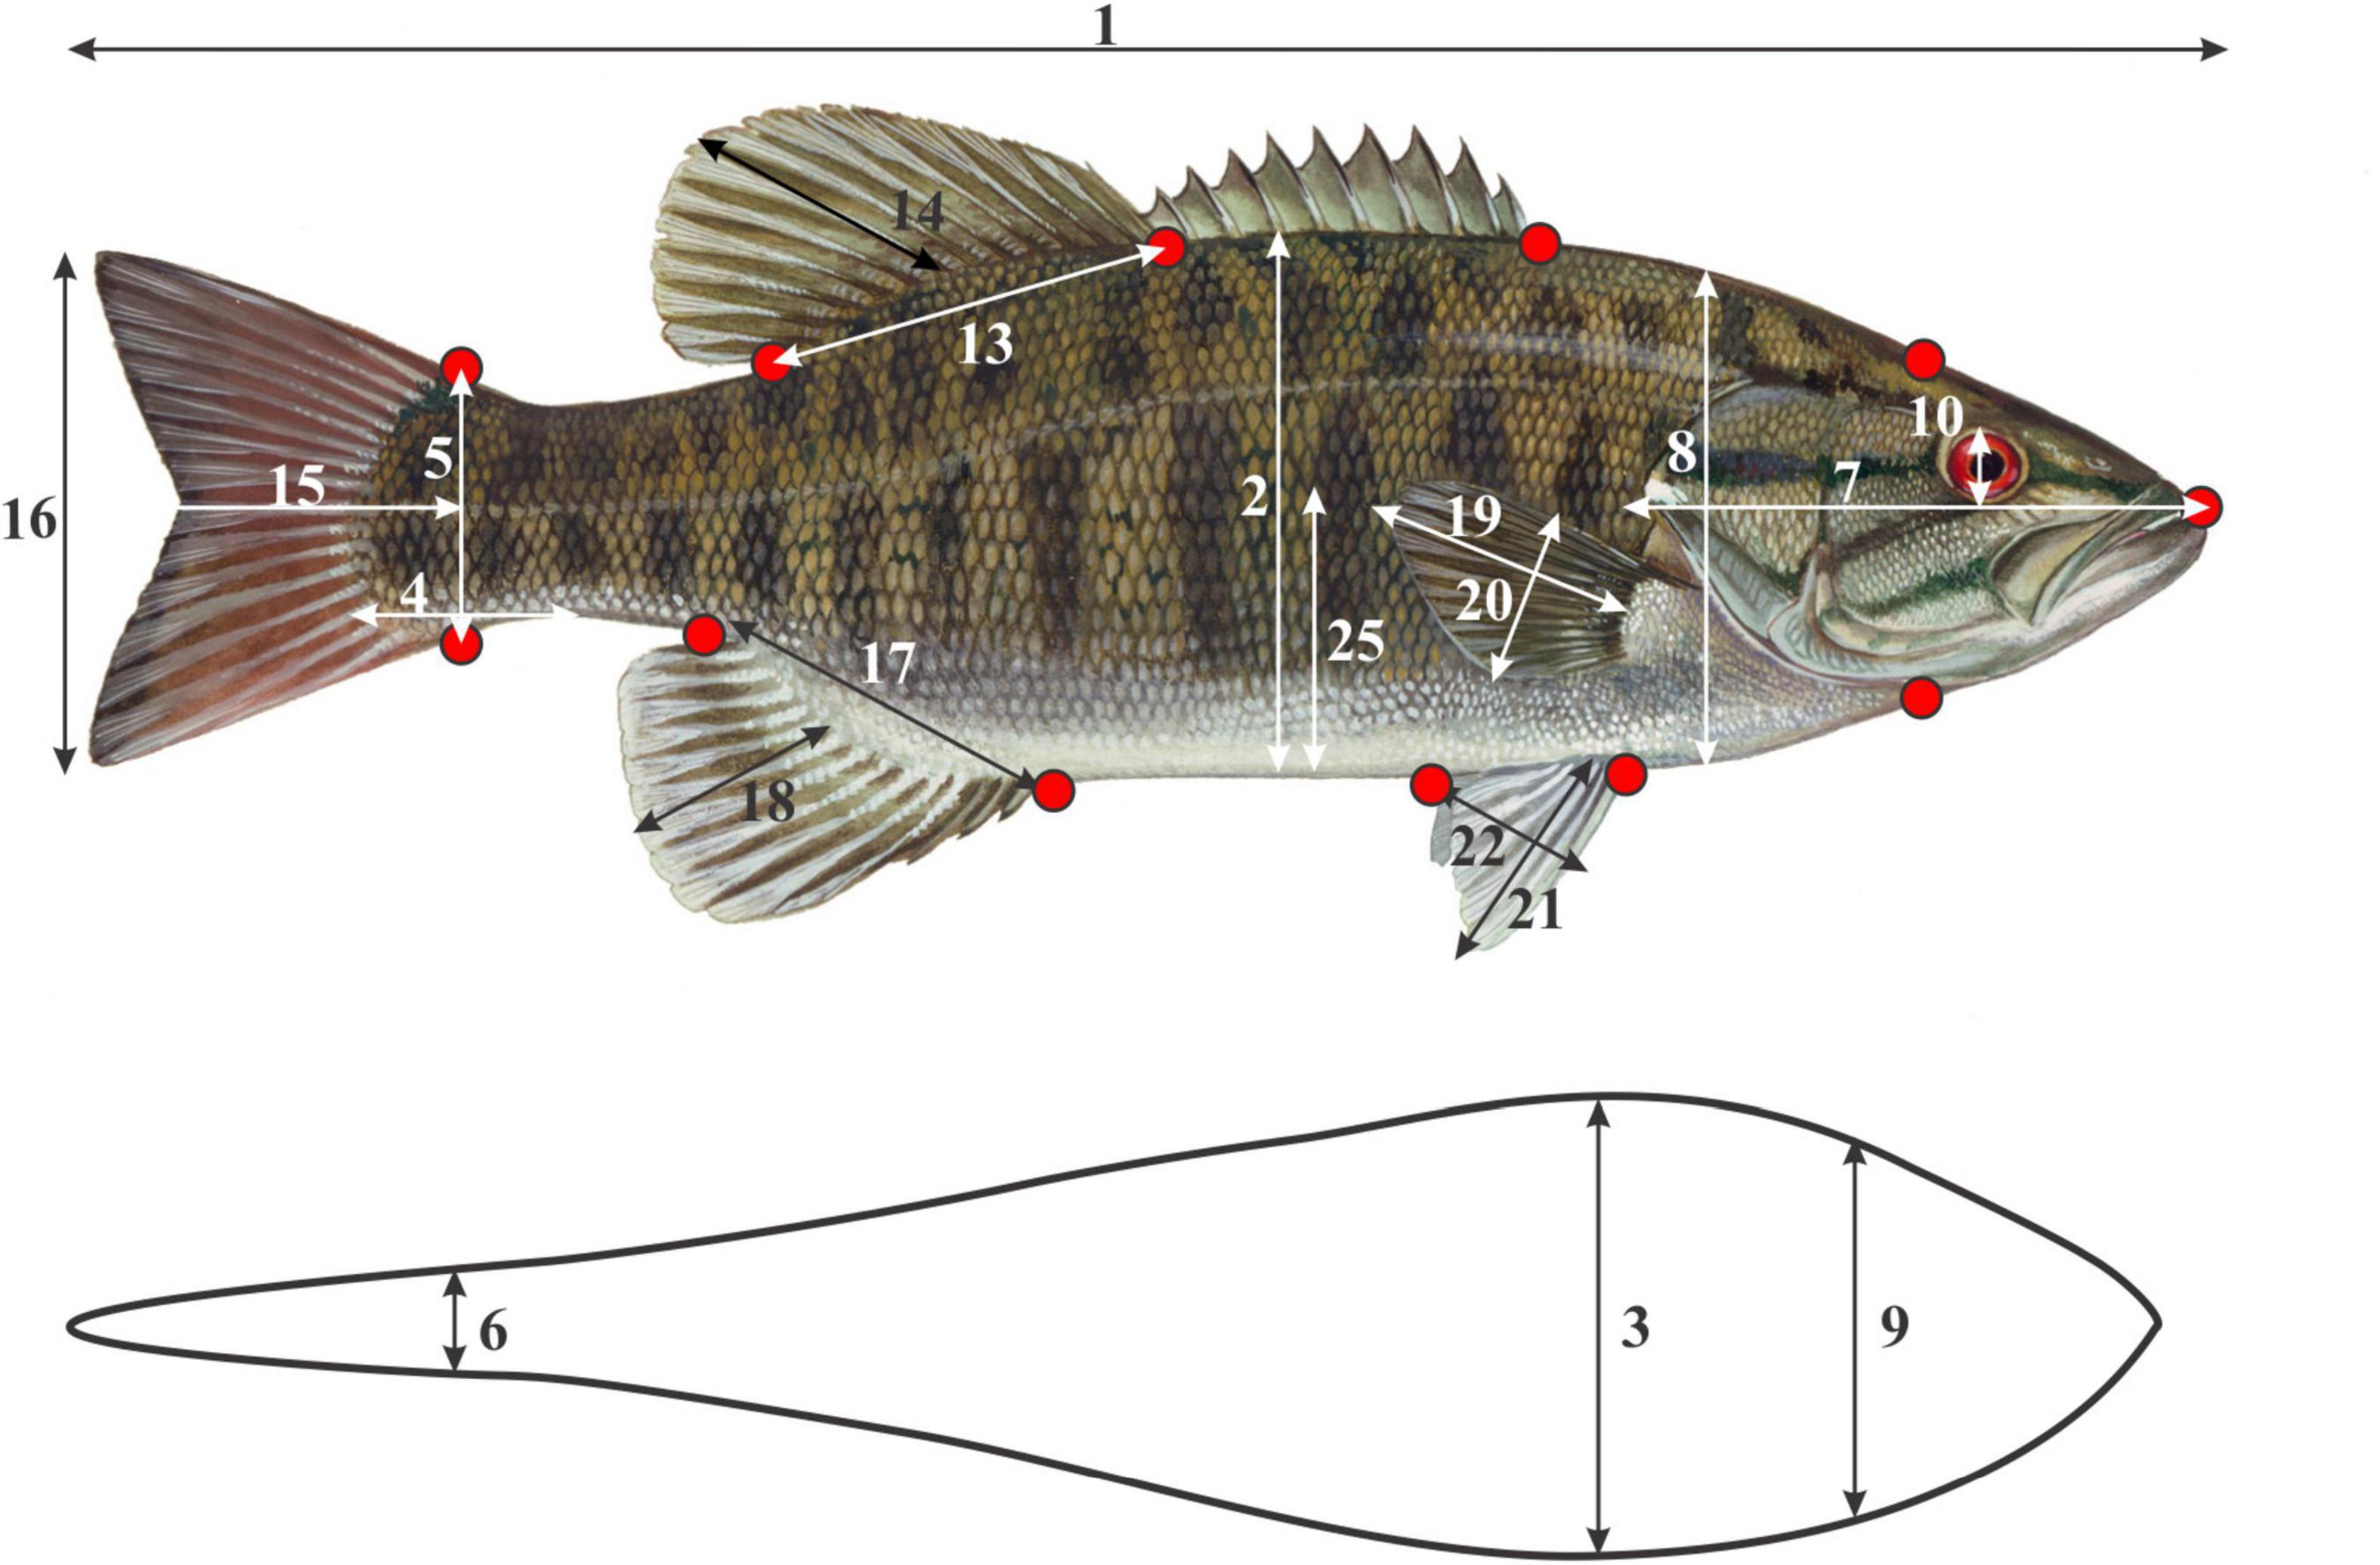
Figure 2. The 12 geometric morphometric landmark positions ( ) and 21 of the 25 linear morphometric measurements taken for each specimen. The four linear measurements associated with the mouth (mouth height – MoH, mouth width – MoW, Length of snout with mouth open – LSO and Length of snout with mouth closed – LSC, are not illustrated. Linear morphometric measurement numbers correspond to those in Table 1.
A PCA conducted on all the linear morphometrics revealed one axis, coined “body size,” which explained 92.8% of the total variation (Eigenvalue = 23.2). To correct for size variation among populations, each linear morphometric variable was regressed against body size. The resulting residuals were kept for further analyses. Subsequently, a PCA was conducted on these residuals, retaining the most significant PC axes (hereafter referred to as “PCLINEAR”). The PCLINEAR axes were also compared between the localities using univariate F-tests, with age as covariate and the interaction effect of age*locality included. Bonferroni post hoc analyses were conducted to identify differences between localities.
To analyze the geometric landmark coordinates representing body shape variation, MorphoJ (Klingenberg, 2011) was employed. Firstly, a Procrustes superimposition was performed on the “raw” coordinates to remove orientation, size and position biases from the data (Klingenberg, 2011). The resulting Procrustes coordinates were regressed against centroid size (CS) to obtain size corrected residuals for each of the landmark coordinates. These residuals were then used to construct a covariance matrix, before a PCA was performed to reduce the dimensionality of the data (hereafter referred to as “PCSHAPE”). Furthermore, univariate F-tests were employed to compare the PCSHAPE axes between localities, with age and the interaction effect of age*locality included as covariates. Successive Bonferroni post hoc tests were conducted to determine differences in body shape between localities.
A generalized linear model was used to test for the effects of environment on morphology, with PCLINEAR and PCSHAPE scores as dependent variables and PCENVIRONMENT as independent variables. Statistical analyses were conducted in SPSS STATISTICS v. 20.0.0 (SPSS Inc., Chicago, IL, United States).
Genetic Analyses
For the genetic analyses, seven of the ten localities were included (n = 139) and encompassed the four populations in the two tributaries (localities A-C: Jan Dissels River; locality J: Ratel River), Clanwilliam Dam (locality D), and two main stem populations (localities H – I; Figure 1). Total genomic DNA was extracted from M. dolomieu muscle tissue using the NucleoSpin Tissue extraction kit (MACHEREY-NAGEL, Separations, Cape Town, South Africa) following the manufacturers protocol. All DNA extractions were kept at −20°C. To confirm that the collected individuals do not include hybrids of smallmouth x largemouth bass (see Diedericks et al., 2018b), two partial mitochondrial (mtDNA) gene regions [cytochrome oxidase subunit I (COI) and cytochrome b (cytb)] were sequenced. PCR reactions and cycling conditions followed those in Diedericks et al. (2018b).
To characterize genetic variation, population structure and gene flow among the sampled populations, individuals were genotyped using nine nuclear microsatellite markers (Mdo3, Mdo4, Mdo5, Mdo7, Mdo8, Mdo9, Mdo10, Mdo11, Lma21; Colbourne et al., 1996; Malloy et al., 2000). Three multiplex reactions were used to amplify the loci and followed the protocol described in Diedericks et al. (2018a,b); Supplementary Data Sheet 1. Microsatellites were genotyped on an automated sequencer (ABI 3730 XL DNA Analyzer, Applied Biosystems, CAF, Stellenbosch, South Africa) before being visually inspected, aligned and scored in Geneious® 10.0.2 (Biomatters, Auckland, New Zealand).
To evaluate the dataset for amplification errors associated with stuttering and large allele drop-out, Microchecker 2.2.3 (Van Oosterhout et al., 2006) was used. Genepop 4.2.1 (Rousset, 2008), employing the Bonferroni method to correct for multiple comparisons (Rice, 1989), was used to assess all loci for deviations from Hardy-Weinberg equilibrium (HWE) and linkage disequilibrium. As most of the populations deviated from HWE, the EM algorithm (Dempster et al., 1977) implemented in FreeNA 1.2 (Chapuis and Estoup, 2007), was utilized to check for the presence of null alleles. Nuclear genomic variability within sampled populations was assessed as allelic richness (AR), number of alleles (Na), observed heterozygosity (HO), expected heterozygosity (HE), and Wright’s inbreeding coefficient (FIS), calculated in FSTAT 2.9.3.2 (Goudet, 1995), Genepop 4.2.1 and Arlequin 3.5.2.2 (Excoffier and Lischer, 2010). The statistical significance of FIS was determined after 1,000 permutations in FSTAT 2.9.3.2.
Genetic population structure was investigated using a five-pronged approach. Firstly, FSTAT 2.9.3.2 was used to calculate FST to assess genetic differentiation between sampled localities. Statistical significance was calculated using a Bonferroni correction. Secondly, an analysis of molecular variance (AMOVA), implemented in Arlequin 3.5.2.2 and statistical significance ascertained using 10,000 permutations, was conducted to reveal the extent of population subdivision among sampled populations. Thirdly, using allele frequencies we explored the genetic associations within and among the sampled localities with a PCA, conducted in the R package Adegenet 1.3.1 (Jombart and Ahmed, 2011). Fourthly, the Bayesian clustering approach, as implemented in STRUCTURE 2.3.4 (Pritchard et al., 2000), was used to identify and visualize the spatial population structuring along the river. Simulations employing the admixture model and assuming correlated allele frequencies, were run five times for each K (1 < K < 10). The initial burn-in was set to 70,000 Markov Chain Monte Carlo (MCMC) generations, followed by 300,000 MCMC iterations. The results were collated and the most probable K determined using the Evanno method (Evanno et al., 2005), as implemented in Structure Harvester 0.6.94 (Earl, 2012). Finally, Clumpp 1.1.2 (Jakobsson and Rosenberg, 2007) and Distruct 1.1 (Rosenberg, 2004) were used to generate and visualize the final results. Lastly, as the underlying STRUCTURE model assumes HWE and, according to the STRUCTURE manual, may not be suited to spatially distributed data with localized dispersal (Pritchard et al., 2010), we tested for spatial autocorrelation within our dataset, as suggested by Schwartz and McKelvey (2009). Spatial autocorrelation (r) investigates the spatial genetic structure among sampled individuals, using pairwise genetic distances over a given geographic distance (i.e., watercourse distance, km) (Smouse and Peakall, 1999). GenAlEx 6.5 (Peakall and Smouse, 2006) was used to assess the spatial autocorrelation among sampled individuals, analyzing the data at two different distance classes, i.e., (a) five classes of 20 km and (b) 10 classes of 10 km, with 9,999 permutations. This was done (a) to ensure large enough sample sizes for statistical power and (b) to prevent failure to detect fine scale genetic structure. Bootstrap re-sampling (10,000) was run to calculate the 95% confidence interval.
Connectivity and Dispersal
To test for isolation by distance (IBD) among populations, a Mantel test (Mantel, 1967) was conducted in GenAlEx 6.5. Significance was assessed using 10,000 permutations. Assignment tests have great power when wanting to detect migrants using multilocus genotypes (Manel et al., 2005). As such, two Bayesian approaches, both implemented in Geneclass 2.0 (Piry et al., 2004), were used to estimate connectivity and migration between sampled populations. Geneclass uses both genetic distance and allele frequencies, in conjunction with a MCMC resampling algorithm, to identify migrants (Piry et al., 2004; Putman and Carbone, 2014). Firstly, an assignment test (Cornuet et al., 1999), using the Bayesian criterion of Rannala and Mountain (1997), was conducted to determine whether all specimens originated from the localities in which they were sampled. This was done by comparing each individuals’ genotype to a simulated dataset. The simulation algorithm by Paetkau et al. (2004) was selected, as this method has been shown to accurately detect dispersing individuals even when all potential source populations were not sampled (Cornuet et al., 1999; Paetkau et al., 2004). The Type I error was set to 0.01 and 10,000 individuals were simulated. Secondly, to assess the dispersal of M. dolomieu within the Olifants River system, we used the “detect migrant” function in Geneclass 2.0 with the Bayesian criterion defined by Rannala and Mountain (1997). This method explicitly seeks and identifies first generation (“direct”) migrants (Paetkau et al., 2004; Piry et al., 2004), i.e., individuals originating from a population other than the one they were sampled from. As not all potential source populations may have been sampled, we selected the L_home/L_max likelihood computation method (Paetkau et al., 2004). The simulation algorithm (Paetkau et al., 2004), number of simulations (10,000) and the type I error (0.01) mimicked those used in the assignment test.
Lastly, to ascertain the effect of genetic variation and dispersal on the morphology-environment relationship, four canonical correspondence analyses (CCA) were run. All analyses were conducted at the individual level and comprised the residual linear morphometric values. Due to the correlated nature of the environmental variables, five variables were chosen to represent the river topology, soil classification and hydroclimate; annual mean temperature – BIO1, annual precipitation – BIO12, average river slope – RS, flow accumulation – FA, coarse fragments volumetric across sub-catchment – CFRVOL. The first CCA was used to explore the correlation between the morphological traits and the environmental variables (Supplementary Data Sheet 1). The second, third and fourth analyses, all partial CCA’s, investigated the same morphology-environment relationship, but considered the additional influence of genetic variation, dispersal and a combination of genetic variation and dispersal, respectively (Supplementary Data Sheet 1). Individual allele frequencies were used to represent the genetic variation, while the probabilities associated with the assignment test (i.e., probability of an individual originating from the sampled locality versus other localities) were used as a proxy for dispersal. Analyses were conducted using the “vegan” R package (Dixon, 2003), while the significance of these associations was calculated using the anova.cca function (Dixon, 2003) with 999 permutations.
Results
Fish Morphology
Significant variation in size (ANOVA; F9,191 = 38.37, P < 0.001) and age (ANOVA; F9,191 = 14.03, P < 0.001) was observed among localities. Specimens collected at locality D were approximately twice the size of specimens from other localities (Bonferroni post hoc tests, all P < 0.001). Size variation was rather limited after excluding specimens from locality D (15.1 – 21.8 cm SBL). Fish belonging to locality A and D were significantly older (Bonferroni post hoc tests, all P ≤ 0.03) than those of the other localities (Supplementary Figure 2), although no significant difference in age was observed among the other populations.
The PCA conducted on the Procrustes coordinates provided four PCSHAPE axes (eigenvalues PCSHAPE 1 = 4.90; PCSHAPE 2 = 1.64, PCSHAPE 3 = 1.41, PCSHAPE 4 = 1.21), jointly explaining 67% of the variation, which were retained for the geometric morphometric data analyses. Shape PC1 (PCSHAPE 1) corresponds to a dorsal to ventral redistribution in body shape, while PCSHAPE 2 corresponds to rounded bodies in addition to shortened caudal peduncles (Figure 3). Similarly, PCSHAPE 3 represented fish with wider bodies, while PCSHAPE 4 denoted slender fish with large heads and shortened caudal peduncles (Supplementary Figure 3). The univariate F-tests revealed significant differences in PCSHAPE 1, 2, 4 among localities, although a statistically significant interaction effect age*locality was present in PCSHAPE 2–3 (Supplementary Table 1). Bonferroni post hoc tests indicated that fish from locality A had higher bodies (PCSHAPE 1) than the other populations, with only marginal variation being observed with regards to locality B and D (Figure 3).
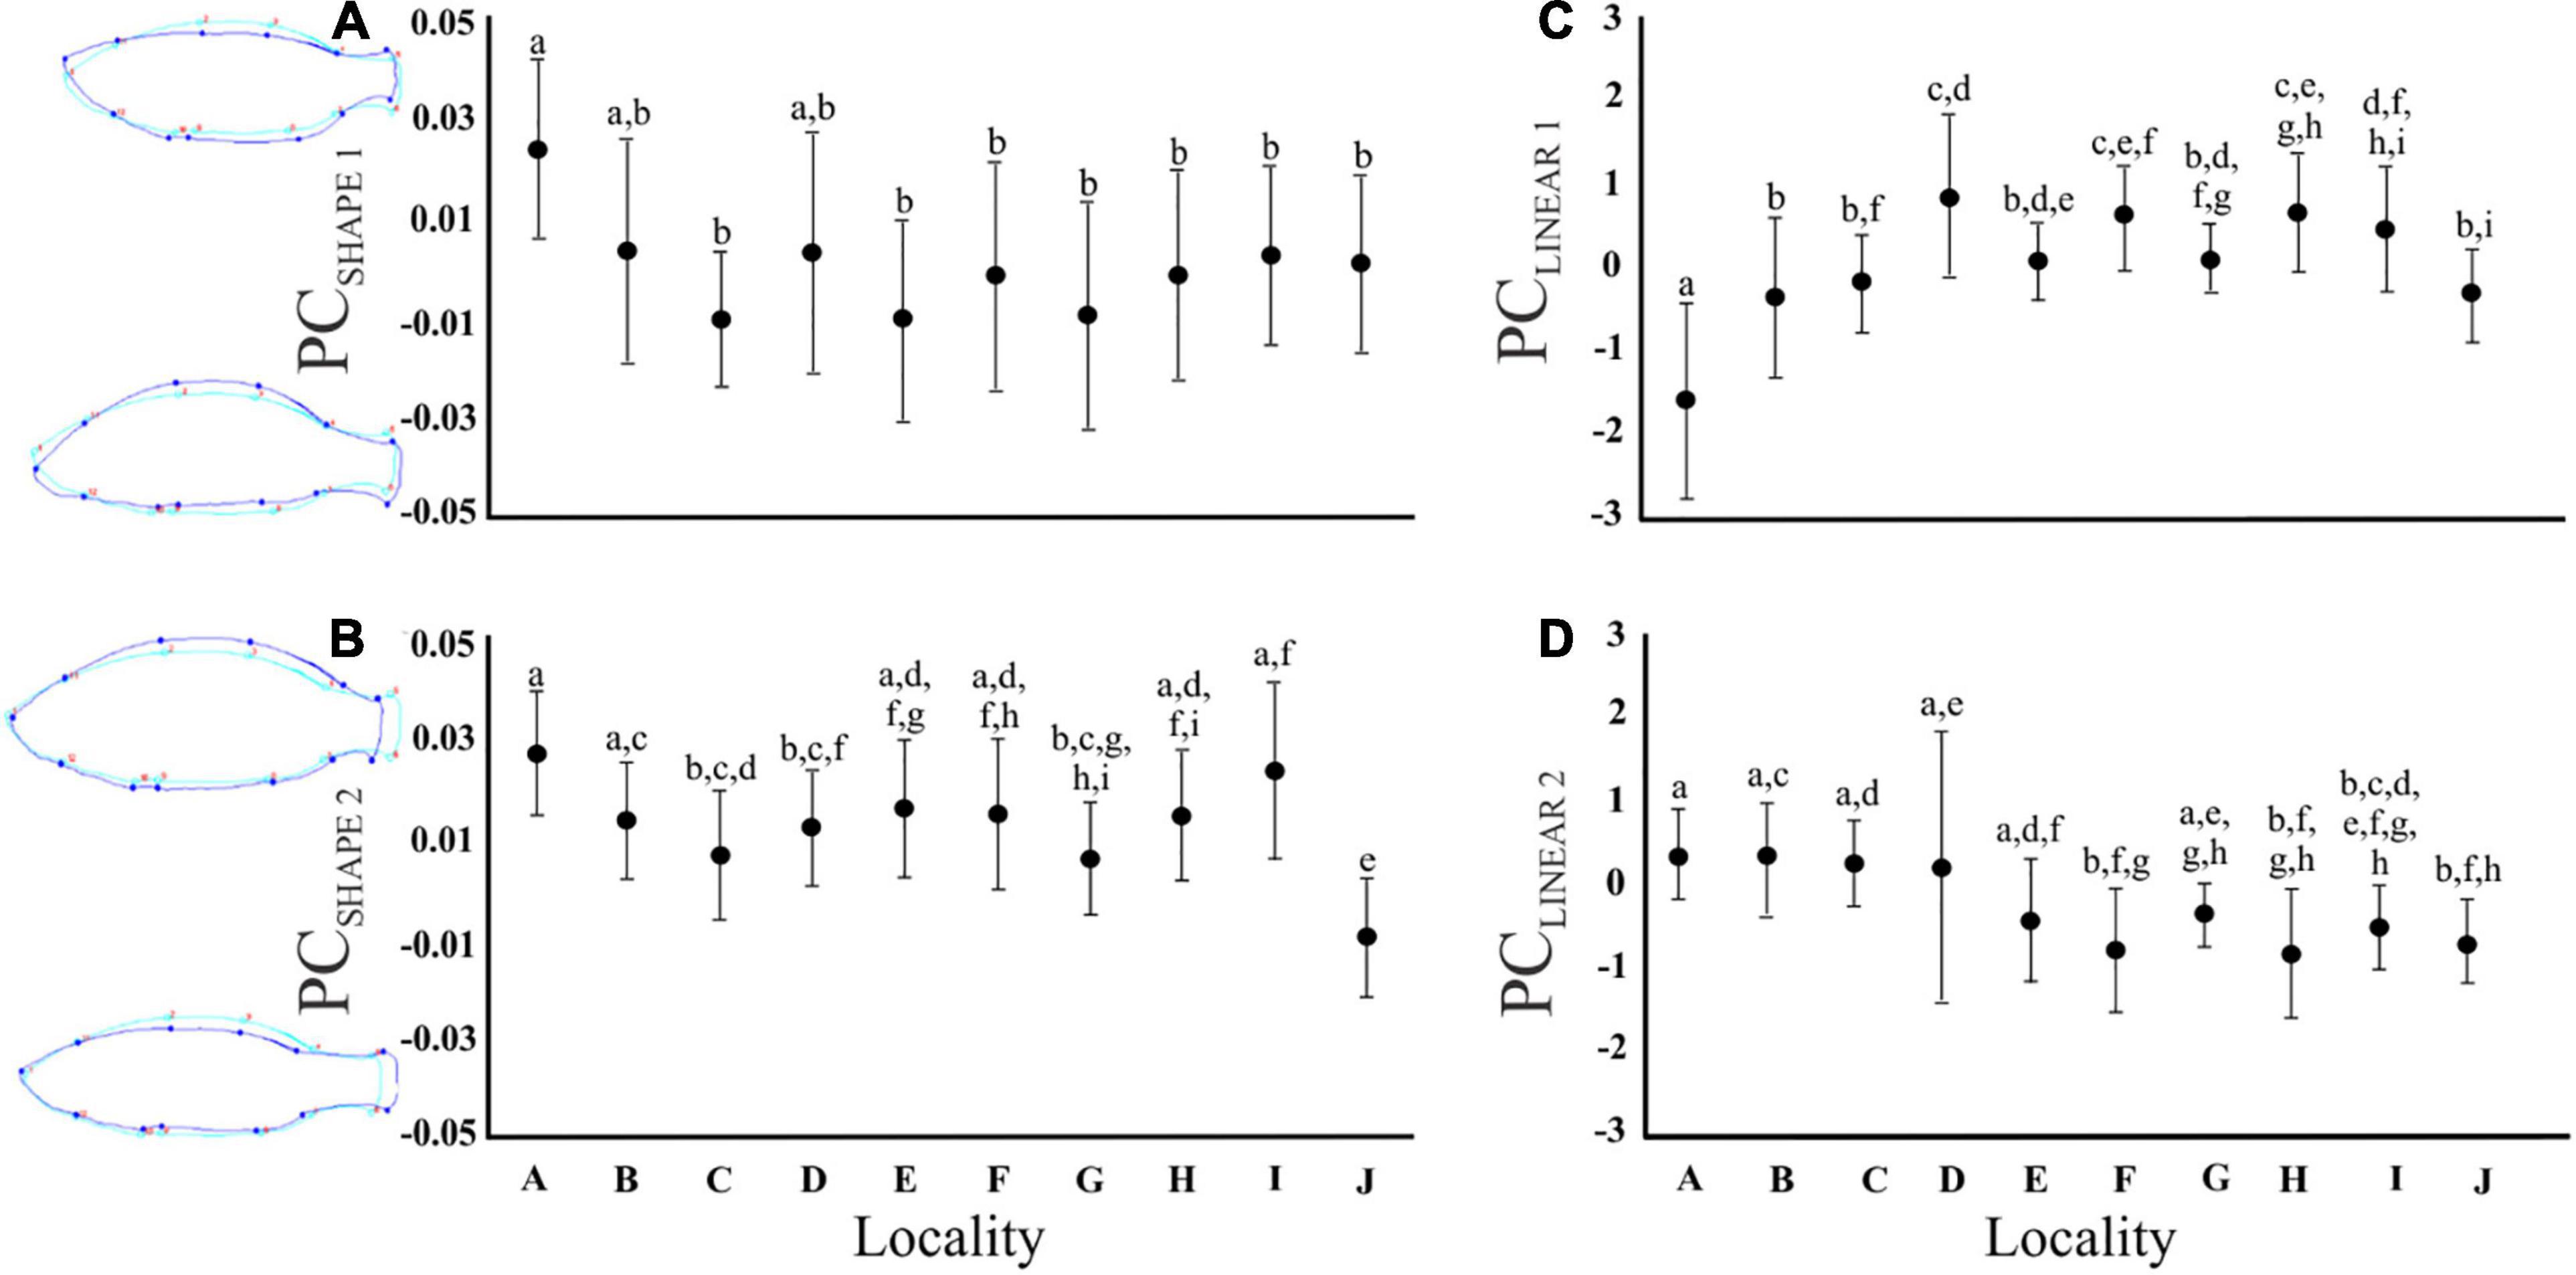
Figure 3. Graphs illustrating the mean and standard deviation for each locality with regards to (A) PCSHAPE 1 (dorsal-ventral redistribution), (B) PCSHAPE 2 (rounded bodies, shortened caudal peduncle), (C) PCLINEAR 1 (body depth), and (D) PCLINEAR 2 (gape size). Different alphabetical letters above the bars indicate values with statistically significant differences (Bonferroni post hoc test; P < 0.05), while identical letters indicate no significant differences among means. The fish outline drawings on the left of graph (A,B) depict the variation in fish body shape for PCSHAPE 1 and PCSHAPE 2, respectively. The light blue line representing the average shape for all fish, while the dark blue line represents the upper and lower body shape extremity (scale factor set to 0.08 and – 0.08, respectively).
The PCA of the 25 linear morphometric measurements retained nine PC axes (PCLINEAR 1–9; Supplementary Table 2). Principal component 1 (PCLINEAR 1) represented fish with higher bodies (MBH), higher and narrower caudal peduncles (CPdH and CPdW, respectively), an increased head height (HH), and decreased eye height (EH), anal fin height (AFH) and pelvic fin length (PFL). Hence, PCLINEAR 1 represents fish with “deeper bodies” (Figure 3). Principal component 2 (PCLINEAR 2) corresponded to “gape size,” as the highest loading scores were related to mouth height and width (MoH, MoW; Supplementary Table 2). The univariate F-tests revealed differences in all PC axes among localities except PCLINEAR 9 (Supplementary Table 1). Bonferroni post hoc tests further revealed that locality A had less deep bodies when compared to the other localities (Bonferroni post hoc tests, all P < 0.05, Figure 3). However, for PCLINEAR 1–2 body depth differed between the age categories and a statistically significant interaction effect (Supplementary Table 1) was present between locality and age, indicating that the size-age relationship was locality specific.
The PCA of the 16 environmental variables retained two PC axes which explained 94.8% of the total variation. The first PC axis, PCENVIRONMENT 1, was negatively correlated with elevation, slope, percentage of coarse fragments and temperature, but positively correlated with flow length, flow accumulation, precipitation and clay content (Supplementary Table 3). Therefore, PCENVIRONMENT 1 represents a gradient from fast-flowing streams at high altitude to wide, slow-flowing rivers at lower altitude. PCENVIRONMENT 2 was positively correlated with percentage of sand, as well as air temperature across the sub-catchment, but negatively correlated with elevation and silt content (Supplementary Table 3). Environment (PCENVIRONMENT 1) had a significant effect on body depth (PCLINEAR 1; standardized β = 0.77; P = 0.01) and gape size (PCLINEAR 2; standardized β = −0.75; P = 0.01) (Figure 4) but not on the remaining size (PCLINEAR 3–9; standardized β = −0.28 – 0.35; all P ≥ 0.32) or shape measurements (PCSHAPE 1–4; standardized β = −0.26 – 0.46, all P ≥ 0.10). In contrast, PCENVIRONMENT 2 had no effect on size (PCLINEAR 1–9; standardized β = −0.28 – 0.54; P ≥ 0.11) and shape (PCSHAPE 1–4; standardized β = −0.45 – 0.07; P ≥ 0.19) measurements.
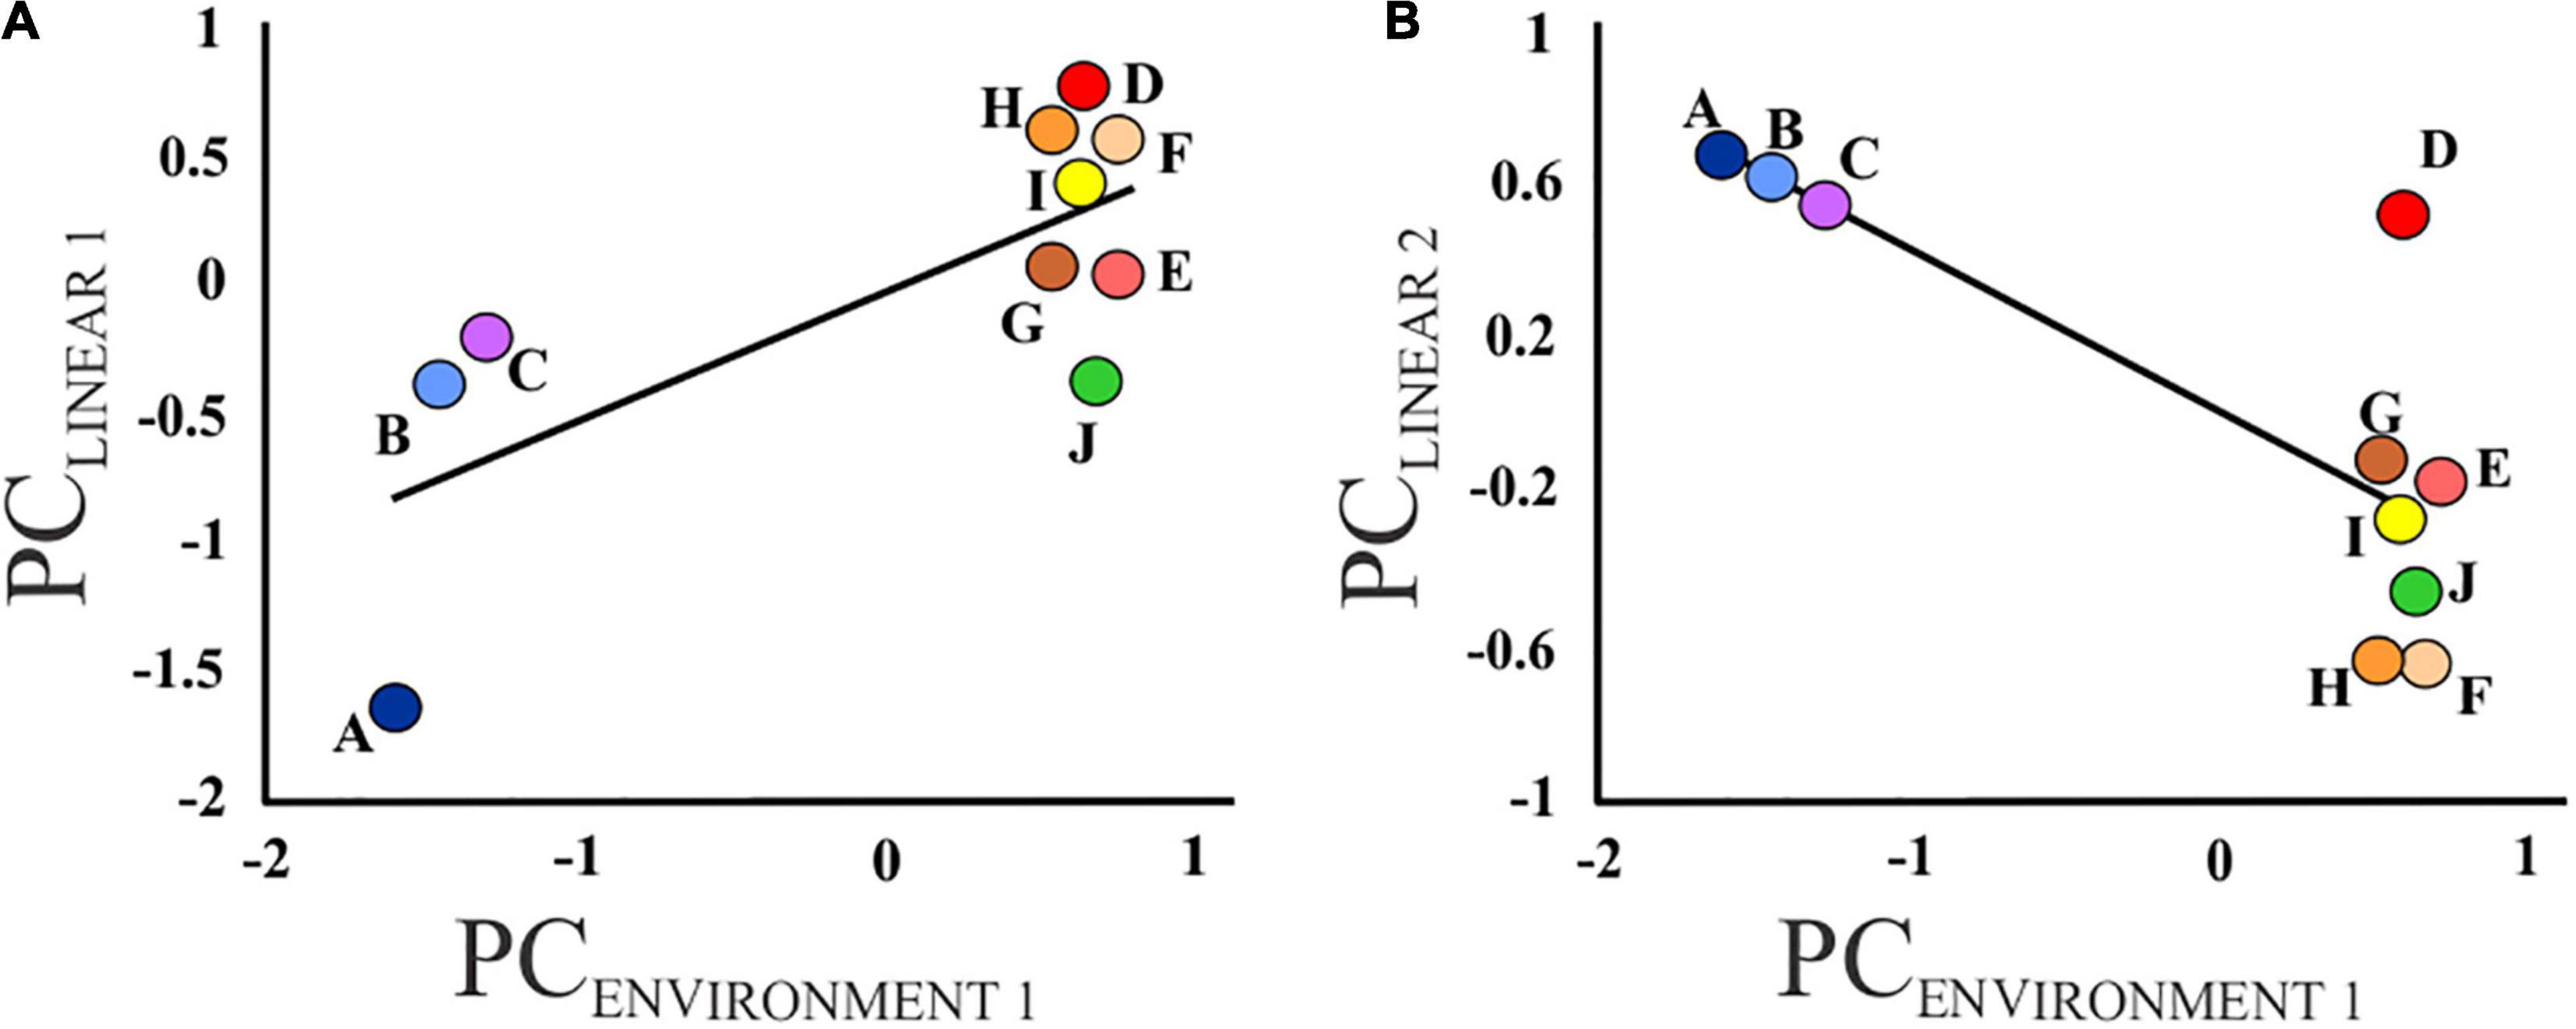
Figure 4. Graphs illustrating the relationship between (A) body depth (PCLINEAR 1) and (B) gape size (PCLINEAR 2) and the environmental variables (PCENVIRONMENT 1) for each sampled locality (A – J).
Genetic Diversity and Population Structure
A total of 139 specimens, collected from seven localities, were successfully sequenced (for cytb and COI) and genotyped at nine microsatellite loci. When comparing these sequences to the Diedericks et al. (2018b) alignment and NCBI BLAST results, no hybrid or introgressed individuals were obtained; hence all 139 specimens were used in subsequent analyses. No amplification errors (i.e., stuttering, large allele drop-out), linkage disequilibrium or null alleles were detected in the microsatellite dataset. The majority of loci and populations did, however, not conform to Hardy-Weinberg expectations, likely due to the significant heterozygote deficit associated with the high levels of inbreeding (FIS; Table 2). Observed heterozygosity (HO) ranged from 0.150 (locality D) to 0.950 (locality H) across all loci, while the expected heterozygosity (HE) ranged from 0.152 (locality A) to 0.756 (locality D). Marginally higher allelic richness values, based on a minimum of 15 specimens, was observed for the two mainstem localities (locality H and I) and the Ratel tributary (locality J; Table 2).
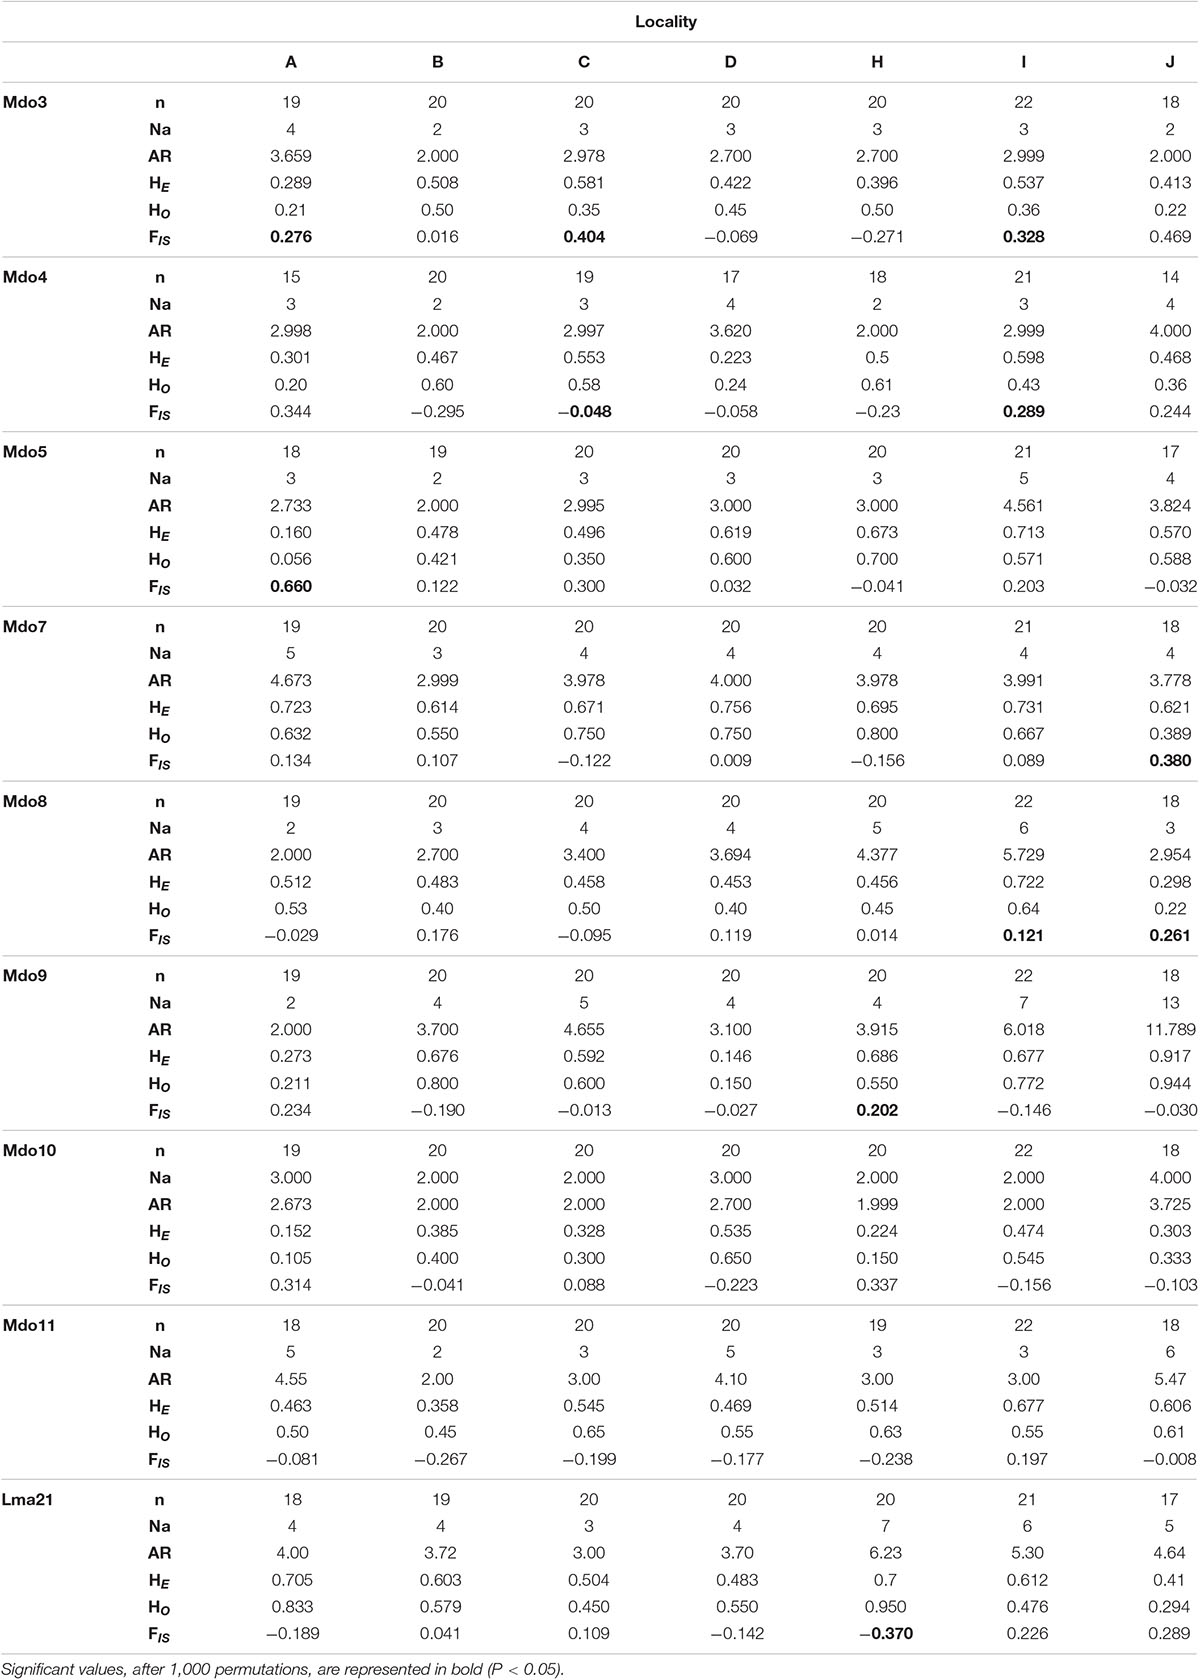
Table 2. Genetic diversity measures (n = number of genotyped individuals; Na = number of alleles; AR = allelic richness for a minimum of 15 individuals; HE = expected heterozygosity, HO = observed heterozygosity; FIS = inbreeding coefficient) for nine microsatellite loci amplified for each of the seven localities.
Pairwise FST values revealed varying levels of differentiation (FST = 0.0269 – 0.4320) between localities, with all but two comparisons statistically significant after Bonferroni correction (Supplementary Table 4). The AMOVA results assigned the largest amount of genetic variation to within each locality (78.98%), with limited variation being observed among tributaries (14.64%) or among localities within tributaries (6.38%). All three variance components were statistically significant (P < 0.001). The genetic PCA analysis, incorporating allelic frequencies, revealed two distinct clusters along the first axis (PC1 = 13.6%); the first cluster encompassing all specimens collected in the Ratel River tributary (locality J) and a small proportion of outlier individuals from locality C, H, and I, with the second cluster representing all other sampled localities (Supplementary Figure 4). Less variation was observed for the second axis (PC2 = 6.6%; Supplementary Figure 4). The Bayesian clustering method implemented in STRUCTURE identified two genetic clusters [K = 2, LnP(D) = −2461.26; Figure 5 and Supplementary Figure 5], one encompassing nearly all of the Ratel tributary specimens, and the other cluster representing all other localities, corroborating the genetic PCA results. Both spatial autocorrelation analyses revealed that M. dolomieu specimens displayed significantly more genetic structuring in the shortest distance classes (up to ∼18 km) than what is to be expected under the null model (Figure 6; all P < 0.007). In contrast, pairwise multilocus genotypes were significantly less genetically similar for all distance classes greater than 60 km (all P < 0.197; Figure 6). These results remained the same when removing locality J from the analyses (results not shown).
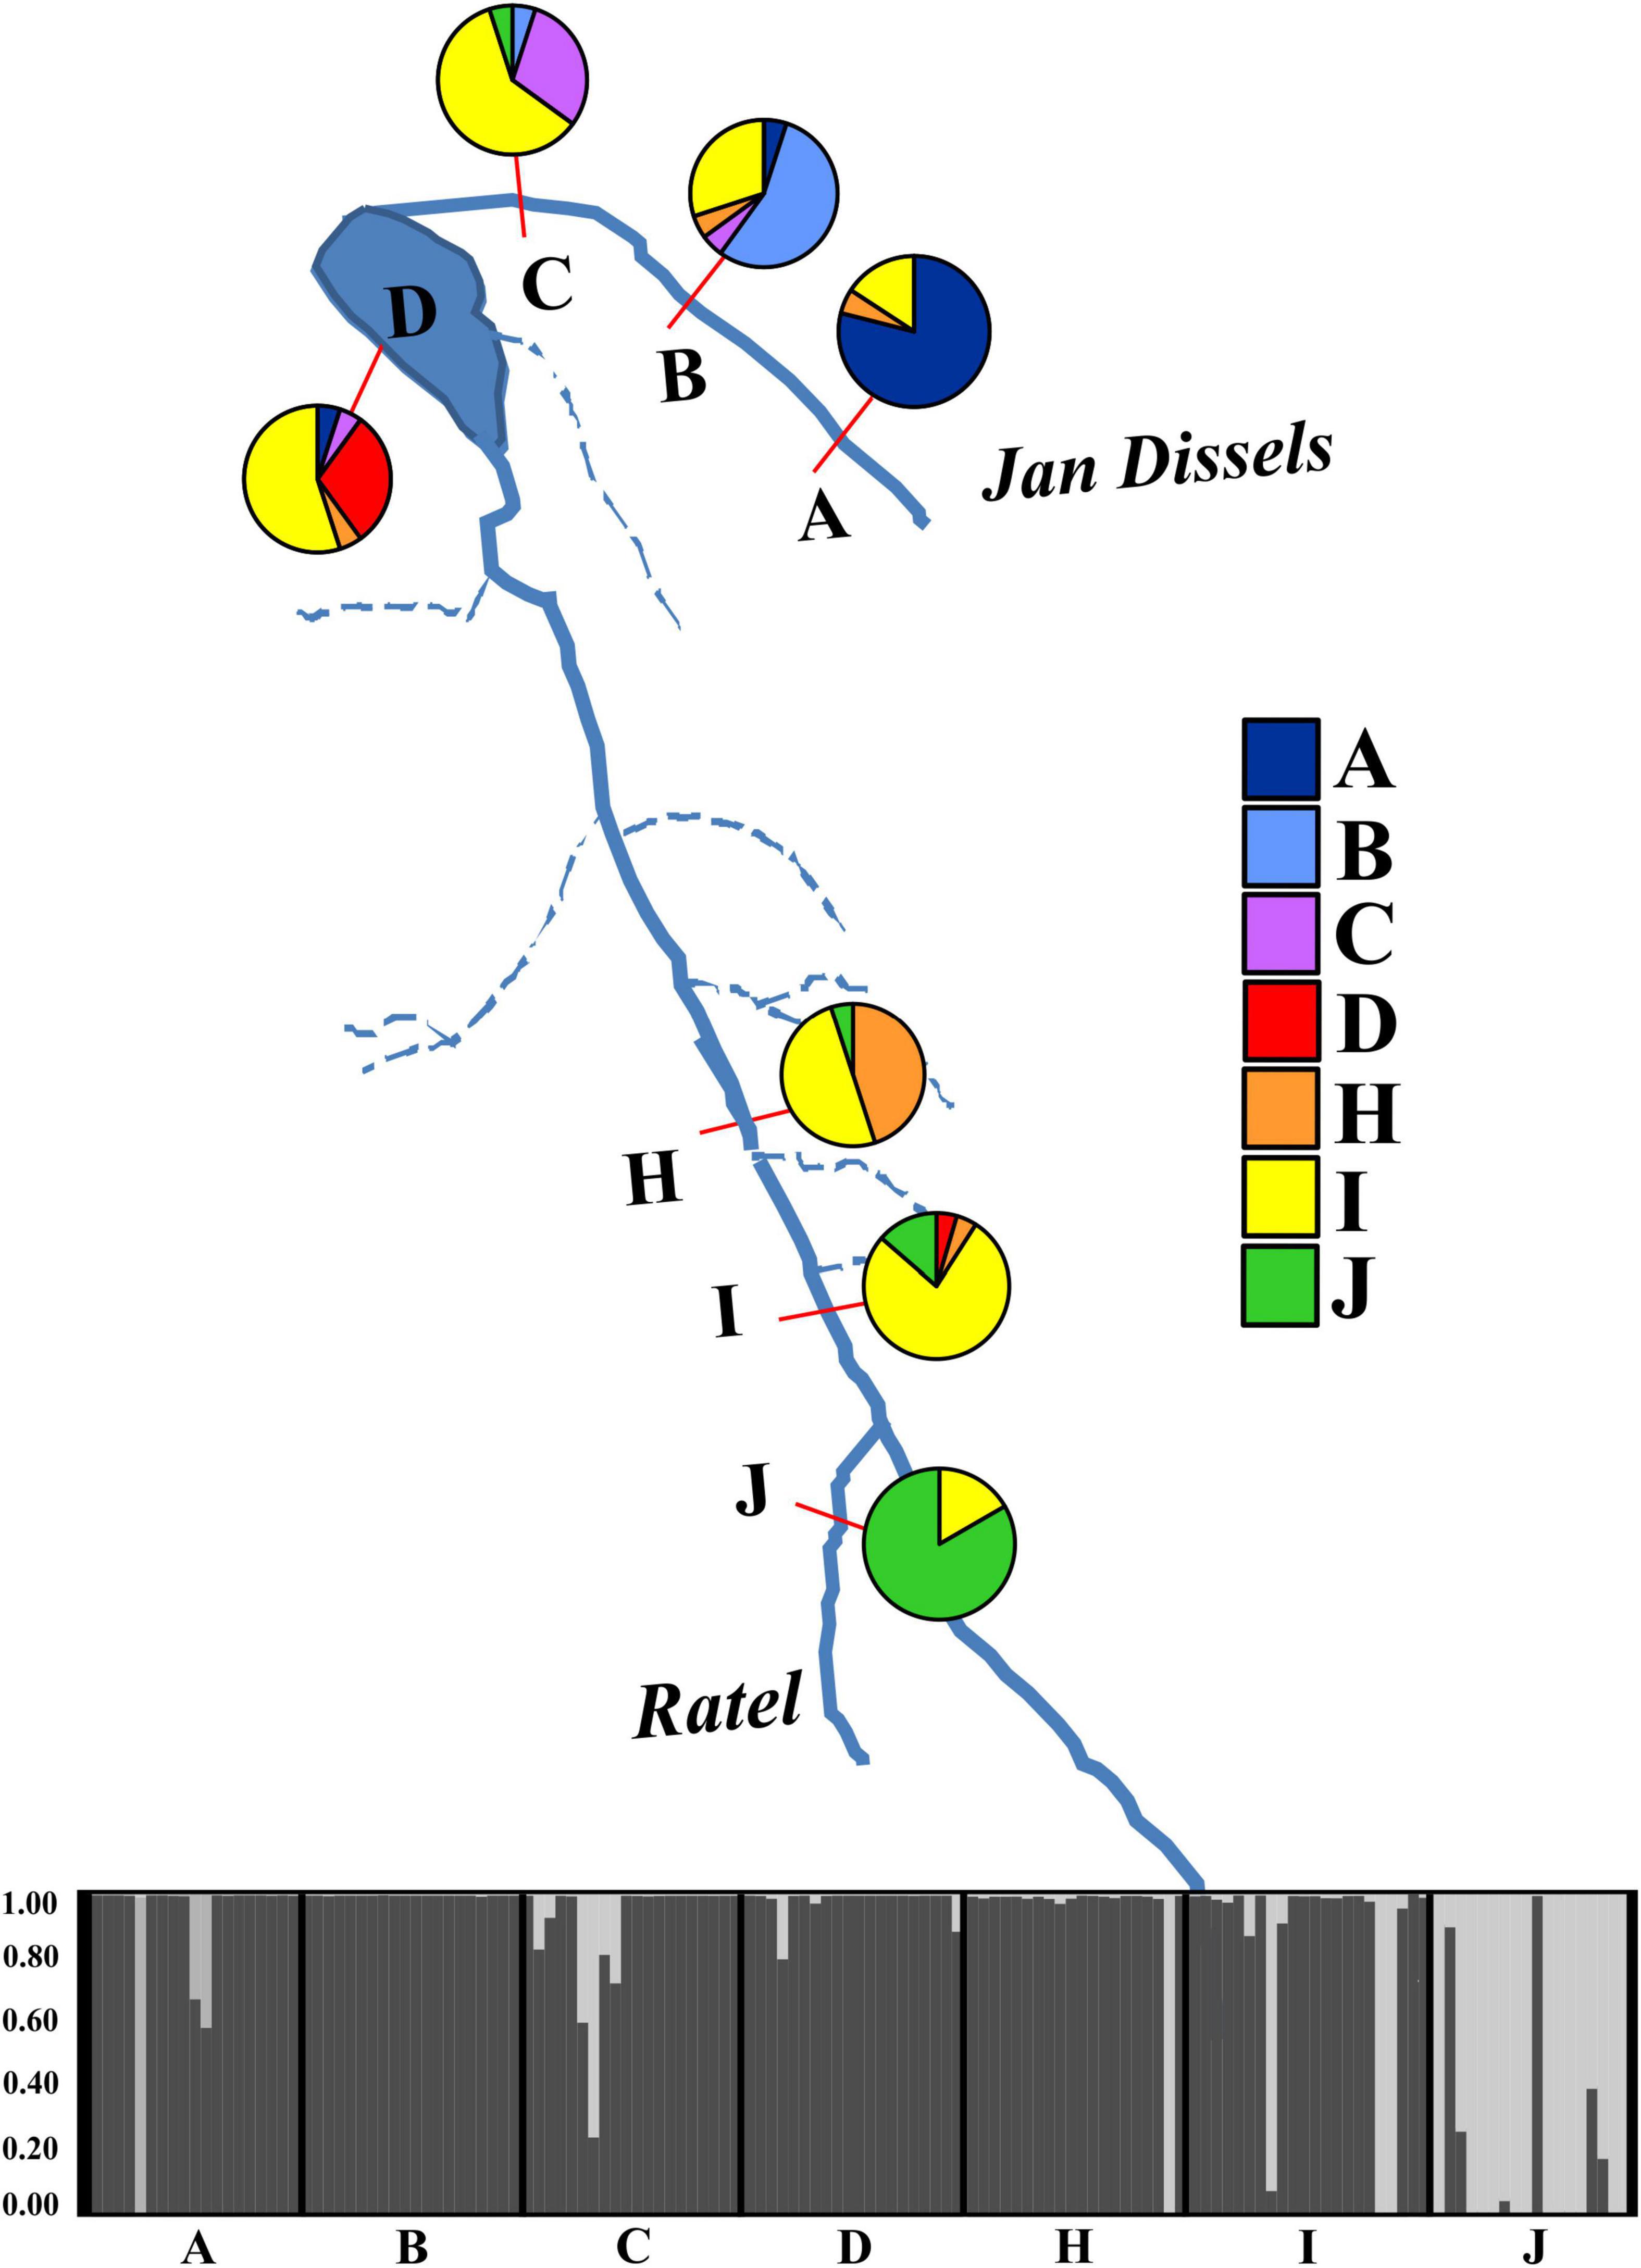
Figure 5. A graphical representation of the seven sampled localities used in the genetic analyses (A – D, H – J). The percentage correctly assigned individuals, obtained from GENECLASS 2.0, for each sampled locality is depicted with a pie chart, with colors corresponding to those in the legend on the right. The STRUCTURE plot represents all seven sampled localities, with each line in the plot corresponding to an individual within that sampled locality. Colors represent the proportion of an individual’s genotype assigned to a given genetic cluster (K = 2).
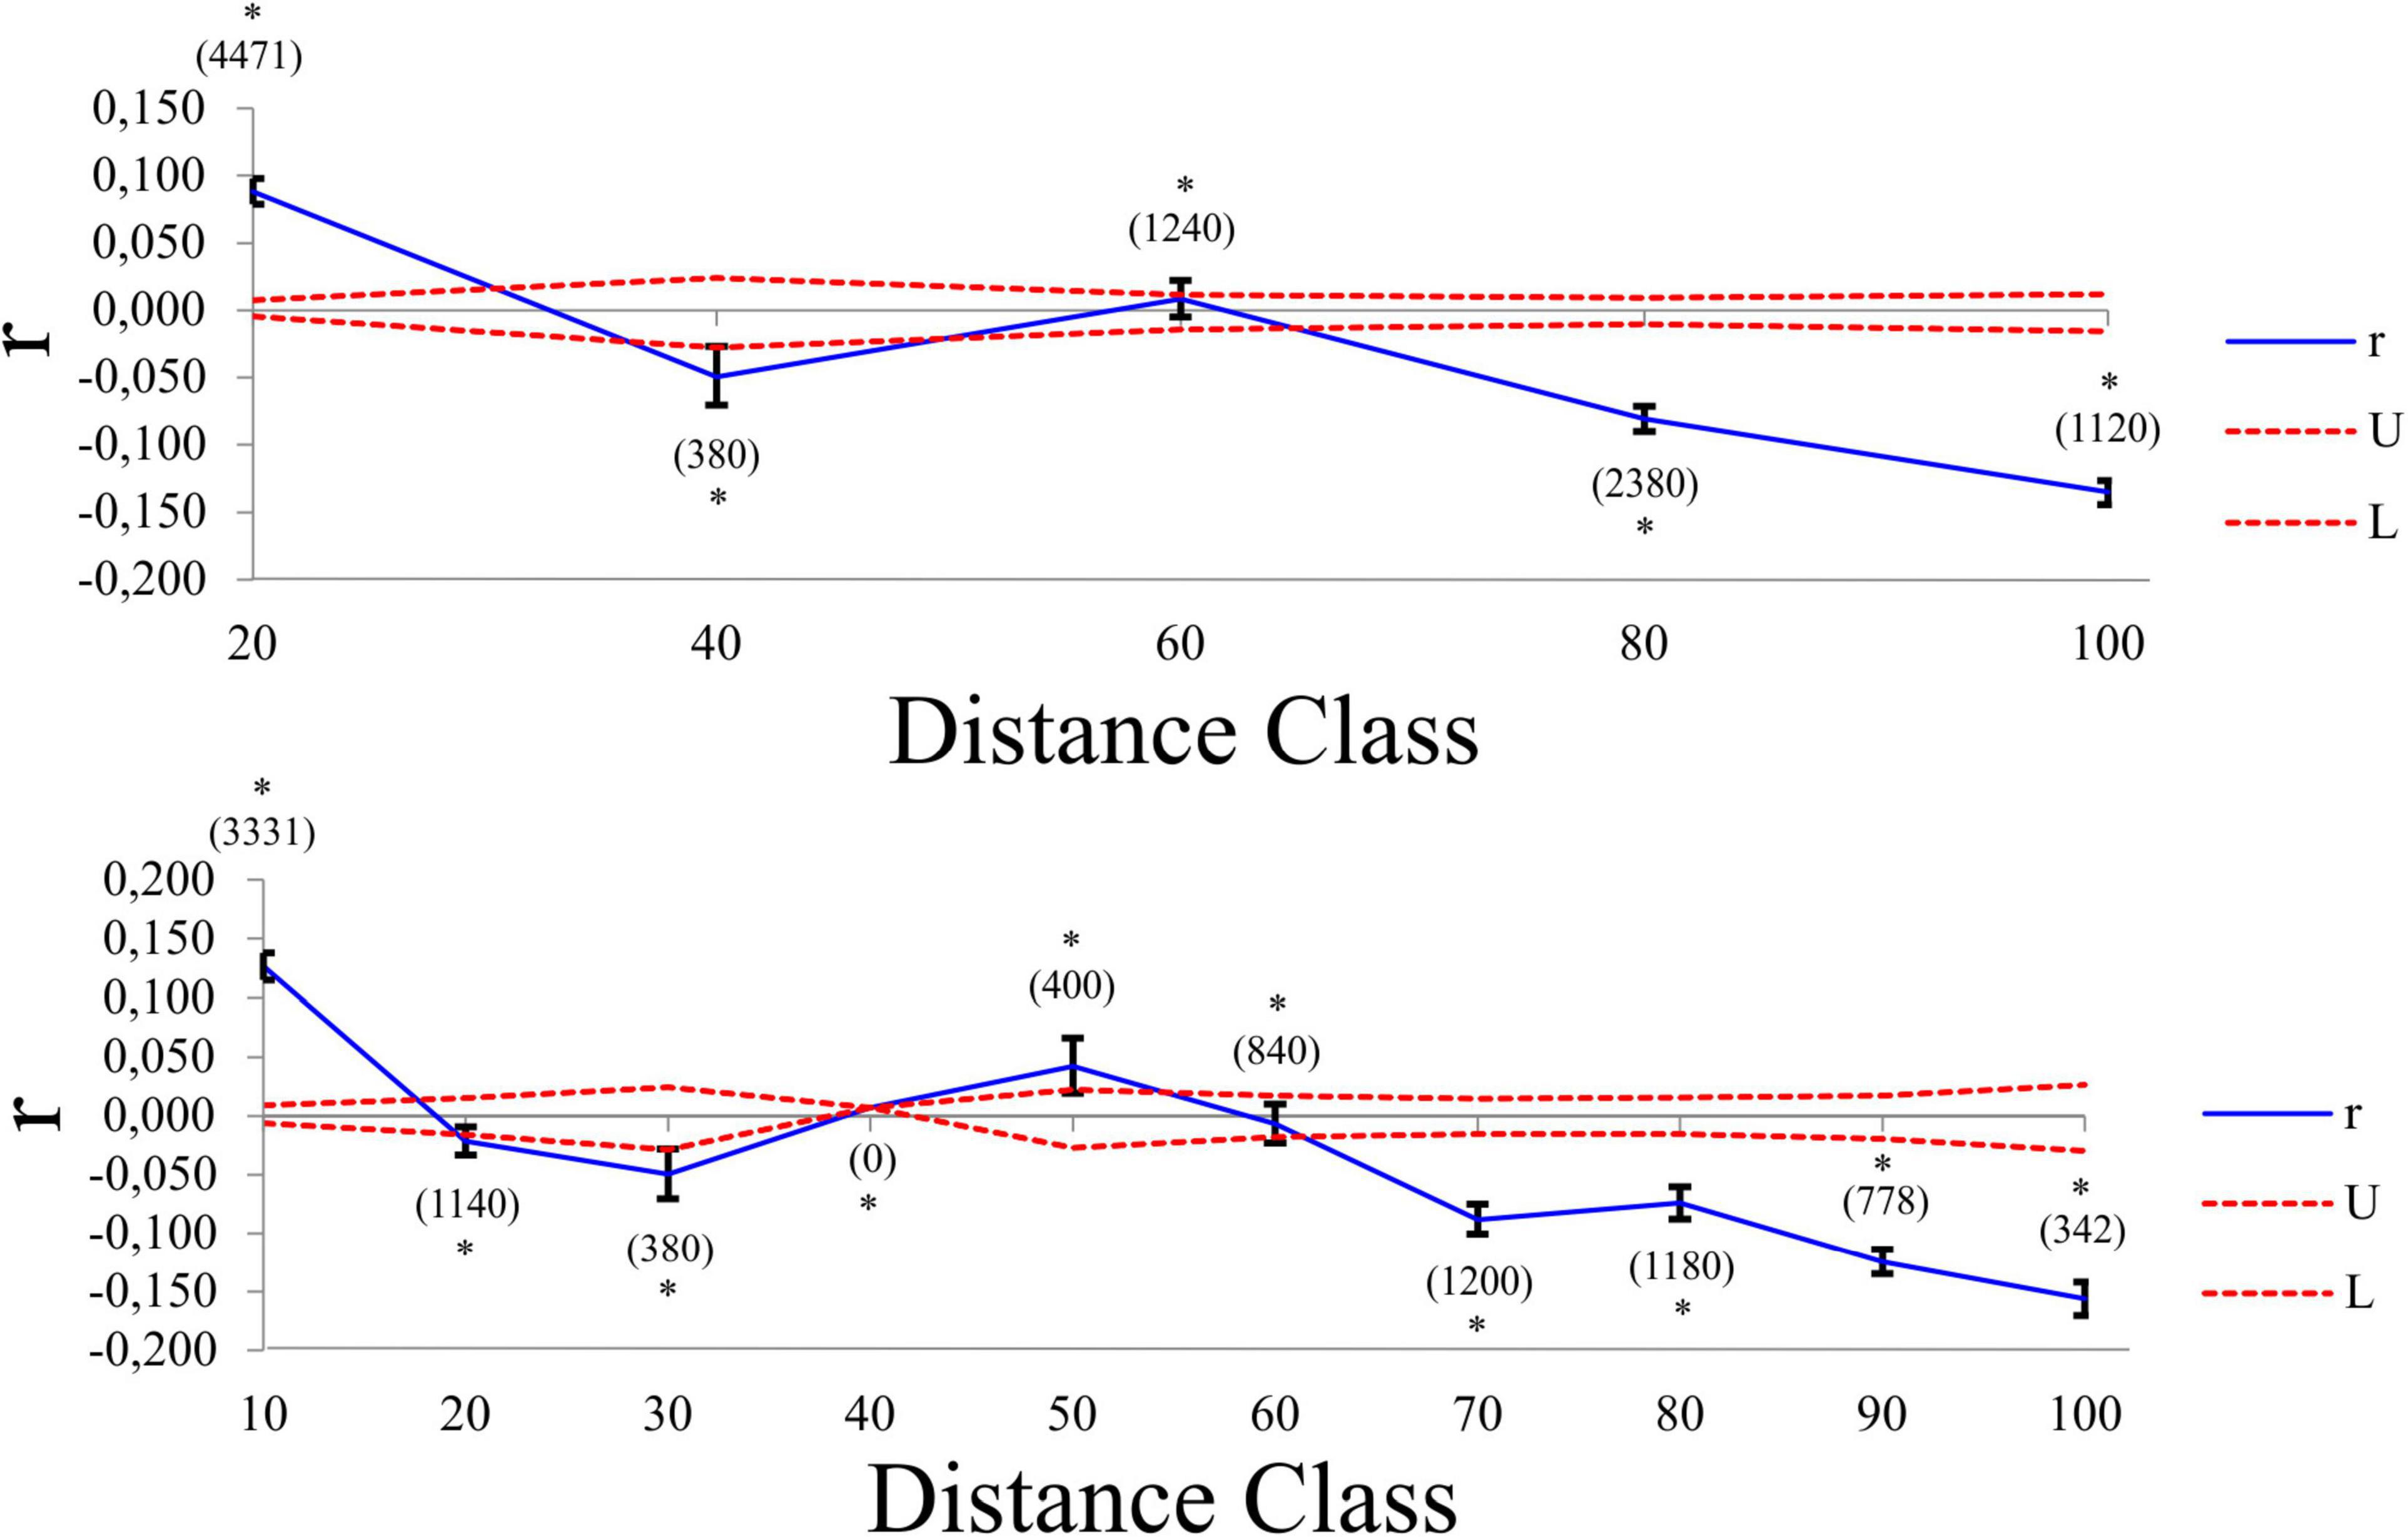
Figure 6. Multiallelic correlograms (blue line) showing the spatial genetic structure of M. dolomieu across two distance classes (10 and 20 km). The 95% null hypothesis confidence intervals are indicated by the red dotted lines. Positive values represent individuals more genetically similar than expected in a given distance class, while negative values imply that individuals in that distance class are less genetically similar than expected. The value in brackets denote the number of pairwise comparisons. The asterisk denotes the statistically significant pairwise relatedness in a specific distance class.
Connectivity and Dispersal Among Populations
A significant association (rxy = 0.462, P = 0.001, R2 = 0.214) between geographical distance and genetic divergence was observed across all sampled localities (Supplementary Figure 6). Nine first generation migrants were detected with GENECLASS 2.0; two each for localities A (A3, A9), I (I4, I5) and J (J9, J18) and one each for localities C (C14), D (D19) and H (H2). No migrant individuals were detected in locality B. The majority of these first-generation migrants were males (6/9), with 8/9 migrants belonging to the 2–3-year age class (Supplementary Data Sheet 1). All migrants originated from either locality H, I or J. The assignment test revealed that 54% of all individuals were correctly assigned when considering the locality of highest probability (Figure 5). The majority of misassigned individuals were collected from localities B, C, D, and H (Figure 5). All nine first generation migrants formed part of the misassigned individuals.
The first CCA revealed that the overall morphology corresponded significantly to environmental variation (F = 3.47, P = 0.001; Figure 7). River slope (RS: F = 10.39, P = 0.001), and to a lesser extent flow accumulation (FA: F = 2.45, P = 0.02) and annual mean temperature (BIO1: F = 2.50, P = 0.02) were statistically significant correlates of variation in morphology. The partial CCA, accounting for the additional effects of genetic variation, was once again statistically significant (F = 2.51, P = 0.001), but revealed less influence of climatic variation on morphology (RS: F = 6.67, P = 0.001; FA: F = 2.31, P = 0.03; BIO1: F = 1.95, P = 0.06; Figure 7), confirming the lack of genetic influence on the morphology. When accounting for the effect of dispersal and genetics*dispersal, however, the morphology-environment correspondence was no longer statistically significant (dispersal: F = 1.08, P = 0.30; genetics*dispersal: F = 0.93, P = 0.53; Figure 7). In these two partial CCAs the morphology-environmental correspondence became weak (dispersal – RS: F = 2.38, P = 0.02; FA: F = 0.82, P = 0.05; BIO1: F = 0.99, P = 0.35; genetics*dispersal – RS: F = 1.98, P = 0.04; FA: F = 0.81, P = 0.57; BIO1: F = 0.70, P = 0.68).
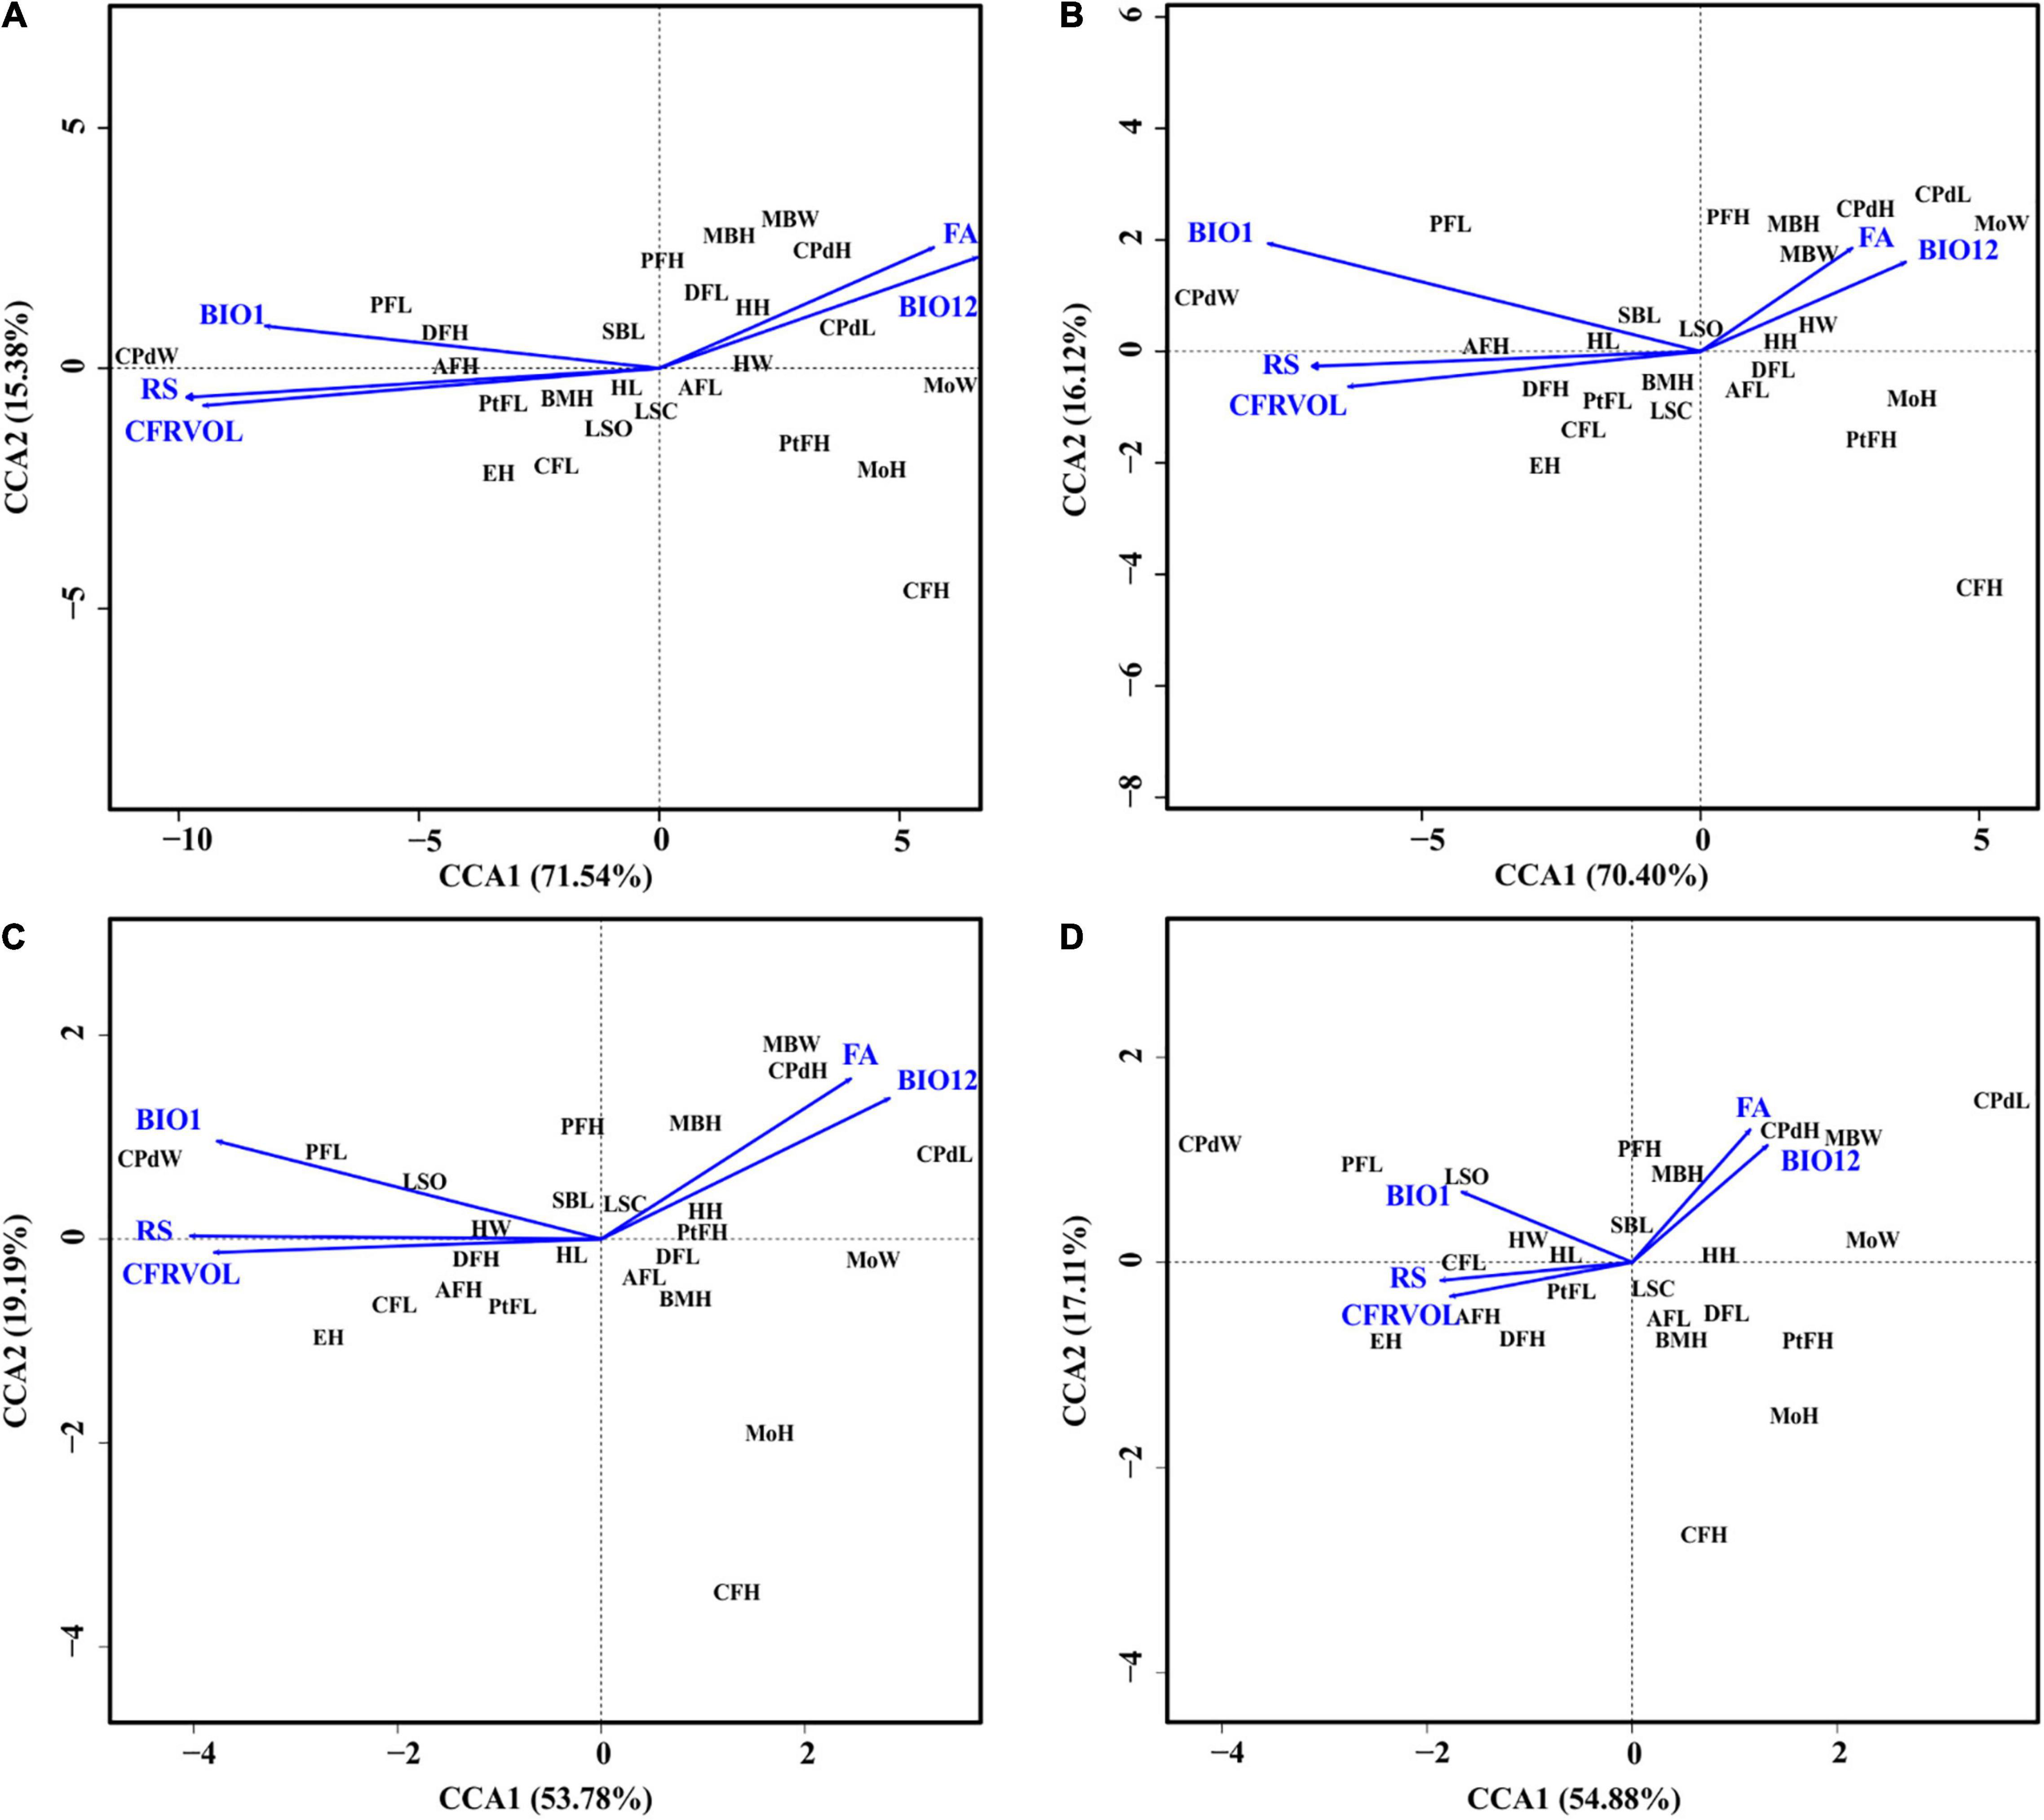
Figure 7. The canonical correspondence analysis biplots showing the relationship between morphological traits and environmental variables (A) without considering genetics, (B) taking genetic variation into account, (C) taking dispersal (via gene flow) into account, (D) considering both genetic variation and dispersal. Five environmental variables representing river topology, soil classification and hydroclimate were used, namely: annual mean temperature – BIO1, annual precipitation – BIO12, average river slope – RS, flow accumulation – FA, and coarse fragments volumetric across sub-catchment – CFRVOL. Morphological trait abbreviations correspond to those used in Table 1.
Discussion
Lotic systems in hydrologically diverse environments, such as in Mediterranean climate regions, are known to be spatially and temporally variable (Winemiller et al., 2010; Cooper et al., 2013). Thus, in order to persist in such changing environments, species either need to adapt or move to more suitable habitats when changes occur. However, despite directed dispersal gaining attention in the literature, few studies to date, particularly those concerning invasive species, have attempted to unravel the effect directed dispersal may have on fine scale genetic- and phenotypic variation among populations. In the present study, we used the invasive smallmouth bass, M. dolomieu, as study organism to investigate the influence of individual dispersal on the fine scale genetic- and phenotypic variation along a river course. Our results revealed a strong correlation between phenotype and environment, independent of genetic variation. Although significant genetic population differentiation was detected among populations, limited dispersal (as inferred from microsatellite data) suggests that matching habitat choice is unlikely to have contributed to the successfully establish of the smallmouth bass in the Olifants River.
Correlates in Morphological and Environmental Variation
Combining morphometric measures with environmental variables obtained from a near-global database, our results support the prediction that comparable environments will have similar phenotypes, particularly with reference to the linear morphometric measures, with both body depth (PCLINEAR 1) and gape size (PCLINEAR 2) being correlated to environmental variables (PCENVIRONMENT 1; Figure 4). Despite the significant interaction effect between locality and age, examination of the within population variation revealed that all individuals belonging to locality A had high scores for PCLINEAR1 regardless of age (Supplementary Figure 2). No significant correlation was, however, detected between any of the environmental variables and body shape (PCSHAPE 1–4), likely due to the large amount of within-locality variation. The arching of the body, as described by PCSHAPE 1, may have been due to slight differences in specimen posture during landmark capture, as shown by Valentin et al. (2008).
The Jan Dissels tributary (localities A – C) is characterized by high-flow environments, evident from the steeper slope and the higher percentage of pebbles and rocks (CFRVOL; Johnson, 2004). It is thus not surprising that M. dolomieu from locality A (and subsequently localities B and C) were significantly more streamlined when compared to the other populations (Figure 3), supporting the hypothesis of Langerhans (2008) stating that streamlined fish will be present in high-flow environments, as this body shape promotes steady swimming in fast flowing waters. Despite the distinct morphology of the fish collected in the Ratel tributary (locality J – PCSHAPE 2, and to a lesser extent PCLINEAR 1; Figure 3), no association could be made with habitat (Figure 4). This is likely because of the broad scale environmental variables (1 km2 grid) used in the present study and the close proximity of locality J to the main stem. Similarly, substantial variation between localities, though not statistically significant, was observed in gape size (PCLINEAR 2; Figure 3), with localities A – C, characterized by a relatively smaller gape size, clustering together. Relative gape size was found to decrease with a decrease in clay content mass (CLYPPT; Figure 4), and consequently an increase in coarse fragments. Invertebrates, especially crabs, are known to prefer coarse substrate habitats situated in pristine, high flow environments (Zimmerman and Covich, 2003; DWA, 2006), as present in the Jan Dissels tributary. A smaller gape and consequently stronger suction (Carroll et al., 2004; Wainwright et al., 2007; Day et al., 2015), might be advantageous in this environment as a stronger suction is required to feed on benthic prey items, such as crabs (Day et al., 2015). In contrast, a relatively large gape is better suited for ram feeding and predating on fish in the water column (Carroll et al., 2004; Wainwright et al., 2007; Day et al., 2015). This may well be the case in the mainstem of the Olifants River system, as numerous co-occurring fish species are present (Van der Walt et al., 2016). Moreover, the fact that M. dolomieu from the Jan Dissels tributary have more fusiform bodies compared to the other localities further supports this notion, as steady swimming is needed to get close enough to benthic prey (Sass and Motta, 2002; Higham, 2011). In contrast, thrust and maneuverability, associated with relatively deep bodies (as seen within localities D – J; Figure 4), provides M. dolomieu with a fast approach and attack, essential to capture prey in the water column (Sass and Motta, 2002; Tran et al., 2010).
Population Structuring and Connectivity Among Micropterus dolomieu Populations
In the present study, we predicted that, following directed dispersal, one would observe marked population structuring and little within population variance. Our results corroborate this to some extent, as significant population differentiation was detected. However, this was most likely a result of IBD (Supplementary Figure 6), with more genetic structuring than expected over short distances, and less genetic structuring than expected over large distances, as revealed by the spatial autocorrelation (Figure 6). Furthermore, the low number of first-generation migrants detected further support this notion. These findings are in line with previous work, describing riverine M. dolomieu inhabitants as sedentary, establishing and guarding home ranges and displaying nest site fidelity (Todd and Rabeni, 1989; Ridgway and Shuter, 1996). In contrast to our prediction, high levels of within locality variation were observed. This can potentially be explained by two alternative hypotheses, as suggested by Barluenga and Meyer (2005). Firstly, a large heterogenous lineage of smallmouth bass could have colonized the Olifants River, differentiating into several groups along the diverse river course. Secondly, multiple genetically diverse lineages of smallmouth bass colonized the Olifants River, homogenizing the gene pool post introduction. Considering M. dolomieu’s invasion history and the supposedly multiple introductions of smallmouth bass into South Africa, and likely the Olifants River system (Diedericks et al., 2018a), the latter hypothesis seems most probable. Moreover, the existence of a Wahlund effect (Wahlund, 1928), i.e., the presence of (cryptic) cohorts in what is believed to be one genetically homogeneous sample, further supports the hypothesis of multiple introductions. The underlying causes for a Wahlund effect are thought to be geographic barriers and genetic drift, although relatedness and inbreeding could also contribute (Castric et al., 2002). Several aspects of the current study system are in line with the characteristics of a Wahlund effect. Firstly, the presence of a dispersal barrier, the Clanwilliam Dam sluice gates, prohibits movement for fish from localities A – C to the main stem. Secondly, genetic drift could have been promoted through sudden immigration, as would be expected during an introduction event (Lee, 2002). Thirdly, as fish are known to shoal with kin (Brown and Brown, 1996; Gerlach et al., 2001; Castric et al., 2002; Dehais et al., 2010) it is highly probable that genetically related individuals were sampled in the present study, as suggested by the similarity in age classes within each locality (Supplementary Data Sheet 1). Lastly, the high levels of inbreeding detected could be ascribed to non-random mating, driven by nest site fidelity (Dehais et al., 2010), a trait displayed by smallmouth bass (Todd and Rabeni, 1989; Ridgway and Shuter, 1996). Despite the aforementioned, the Ratel tributary (locality J) was shown to be genetically distinct when compared to the rest of the individuals, as suggested by the STRUCTURE and genetic PCA results (Figure 5 and Supplementary Figure 4). Moreover, the assignment test showed limited dispersal from the Ratel to downstream populations despite the absence of any geographical barriers. Numerous studies have revealed similar patterns. For example, higher genetic differentiation was found in introduced smallmouth bass inhabiting the tributaries of the Susquehanna River basin compared to the main stem (Schall et al., 2017). In addition, Hendry et al. (2002) found high genetic divergence and little gene flow among stickleback populations inhabiting an inlet stream and a lake. Likewise, Carlsson et al. (1999) demonstrate fewer brown trout exchanges between a tributary and main stem than within the main stem itself. Tributaries are often ecologically differentiated thereby supporting locally adapted populations that rarely disperse into the main stream (Dehais et al., 2010). In contrast to the Ratel and Jan Dissels tributaries which sustain permanent water flow, individuals inhabiting the mainstem of the Olifants River face the risk of becoming trapped as sections of the river become disconnected and dry up during summer. This may force M. dolomieu to disperse either up- (locality J) or downstream (locality D and subsequently A-C if the sluice gates are opened) to other freshwater habitats with better environmental conditions (Whitledge et al., 2002; Westhoff et al., 2016), and could ultimately result in the limited population structuring within the main stem.
Conclusion
The results of our study reveal distinct genetic and morphological differences between populations of M. dolomieu. On the one hand, a strong correlation was found between morphological traits and environmental conditions, irrespective of the observed genetic variation among the populations. On the other hand, the populations were genetically differentiated due to isolation-by-distance (IBD). This IBD pattern suggests that gene flow, and thus dispersal, is more likely to occur between closely situated populations than those at greater spatial distances. Limited dispersal between habitats could result from matching habitat choice (Edelaar et al., 2008), provided individuals have the opportunity to select between different habitat types. In our study system, such instances appeared to be rare as habitats of neighboring localities were often very similar, or separated by a barrier (e.g., Jan Dissels). A notable exception is the Ratel tributary, which represents a morphological and genetically distinct population within the Olifants River. The strong genetic structuring observed within the tributary appears to be non-random (i.e., directed gene flow from the neighboring populations toward the tributary as revealed by the migrant analysis; Figure 5), reflecting the proposed genetic pattern suggested by the matching habitat choice hypothesis (Edelaar et al., 2008; Nicolaus and Edelaar, 2018).
In conclusion, our study highlights the importance of gene flow and dispersal in shaping the fine scale population genetic variation, particularly with reference to invasive species. The use of whole genome markers such as SNPs (Tiffin and Ross-Ibarra, 2014), coupled with more comprehensive spatial sampling schemes and detailed spatio-temporal environmental data, will be pivotal to understand the relative importance of directed dispersal, local adaptation, phenotypic plasticity and random genetic differentiation for trait variation.
Data Availability Statement
The datasets presented in this study can be found in the Supplementary Material.
Ethics Statement
The animal study was reviewed and approved by the Research Ethics Committee: Animal Care and Use (REC: ACU), Stellenbosch University.
Author Contributions
GD, SH, OW, and CH contributed to conception and design of the study. GD and CB conducted the sampling and took all the linear measurements. GD conducted all the genetic lab work and analyses, landmarked all specimens, and wrote the first draft of the manuscript. GD and OW aged the fish. CB performed all the statistical analysis. All authors contributed to manuscript revision, read, and approved the submitted version.
Funding
This work was supported by the Department of Science and Technology (DST) and National Research Foundation (NRF) of South Africa (CH: 89967 and 109244; OW: 110507 and 109015) and the DST-NRF Centre of Excellence for Invasion Biology (GD).
Conflict of Interest
The authors declare that the research was conducted in the absence of any commercial or financial relationships that could be construed as a potential conflict of interest.
Publisher’s Note
All claims expressed in this article are solely those of the authors and do not necessarily represent those of their affiliated organizations, or those of the publisher, the editors and the reviewers. Any product that may be evaluated in this article, or claim that may be made by its manufacturer, is not guaranteed or endorsed by the publisher.
Acknowledgments
In loving memory of OW who passed away on 14 November 2020 while chasing fish in mountain streams. We thank Liz Alter and Erika Rubenson for their useful comments and suggestions.
Supplementary Material
The Supplementary Material for this article can be found online at: https://www.frontiersin.org/articles/10.3389/fevo.2021.790829/full#supplementary-material
References
Arendt, J. D. (2015). Effects of dispersal plasticity on population divergence and speciation. Heredity 115, 306–311. doi: 10.1038/hdy.2015.21
Barluenga, M., and Meyer, A. (2005). Old fish in a young lake: stone loach (Pisces: Barbatula barbatula) populations in Lake Constance are genetically isolated by distance. Mol. Ecol. 14, 1229–1239. doi: 10.1111/j.1365-294X.2005.02468.x
Beisel, J. N. (2001). The elusive model of a biological invasion process: time to take differences among aquatic and terrestrial ecosystems into account? Ethol. Ecol. Evol. 13, 193–195. doi: 10.1080/08927014.2001.9522785
Benkman, C. W. (2016). Matching habitat choice in nomadic crossbills appears most pronounced when food is most limiting. Evolution 71, 778–785. doi: 10.1111/evo.13146
Bonte, D., and Dahirel, M. (2017). Dispersal: a central and independent trait in life history. Oikos 126, 472–479. doi: 10.1111/oik.03801
Bowler, D. E., and Benton, T. G. (2005). Causes and consequences of animal dispersal strategies: relating individual behaviour to spatial dynamics. Biol. Rev. 80, 205–225. doi: 10.1017/S1464793104006645
Brown, G. E., and Brown, J. A. (1996). Kin discrimination in salmonids. Rev. Fish. Biol. Fish. 6, 201–219. doi: 10.1007/BF00182343
Camacho, C., and Hendry, A. P. (2020). Matching habitat choice: it’s not for everyone. Oikos 129, 689–699. doi: 10.1111/oik.06932
Camacho, C., Sanabria-Fernández, A., Baños-Villalba, A., and Edelaar, P. (2020). Experimental evidence that matching habitat choice drives local adaptation in a wild population. Proc. R. Soc. B 287:20200721. doi: 10.1098/rspb.2020.0721
Carlsson, J., Olsen, K. H., Nilsson, J., Øverli, Ø., and Stabell, O. B. (1999). Microsatellites reveal fine-scale genetic structure in stream-living brown trout. J. Fish Biol. 55, 1290–1303. doi: 10.1111/j.1095-8649.1999.tb02076.x
Carroll, A. M., Wainwright, P. C., Huskey, S. H., Collar, D. C., and Turingan, R. G. (2004). Morphology predicts suction feeding performance in centrarchids. J. Exp. Biol. 207, 3873–3881. doi: 10.1242/jeb.01227
Castric, V., Bernatchez, L., Belkhir, K., and Bonhomme, F. (2002). Heterozygote deficiencies in small lacustrine populations of brook charr Salvelinus fontinalis Mitchill (Pisces, Salmonidae): a test of alternative hypotheses. Heredity 89, 27–35. doi: 10.1038/sj.hdy.6800089
Chapuis, M. P., and Estoup, A. (2007). Microsatellite null alleles and estimation of population differentiation. Mol. Biol. Evol. 24, 621–631. doi: 10.1093/molbev/msl191
Clobert, J., Le Galliard, J. F., Cote, J., Meylan, S., and Massot, M. (2009). Informed dispersal, heterogeneity in animal dispersal syndromes and the dynamics of spatially structured populations. Ecol. Lett. 12, 197–209. doi: 10.1111/j.1461-0248.2008.01267.x
Colbourne, J. K., Neff, B. D., Wright, J. M., and Gross, M. R. (1996). DNA fingerprinting of bluegill sunfish (Lepomis macrochirus) using (GT) n microsatellites and its potential for assessment of mating success. Can. J. Fish. Aquat. 53, 342–349. doi: 10.1139/f95-179
Cooper, S. D., Lake, P. S., Sabater, S., Melack, J. M., and Sabo, J. L. (2013). The effects of land use changes on streams and rivers in mediterranean climates. Hydrobiologia 719, 383–425. doi: 10.1007/s10750-012-1333-4
Cornuet, J. M., Piry, S., Luikart, G., Estoup, A., and Solignac, M. (1999). New methods employing multilocus genotypes to select or exclude populations as origins of individuals. Genetics 153, 1989–2000. doi: 10.1093/genetics/153.4.1989
Day, S. W., Higham, T. E., Holzman, R., and Van Wassenbergh, S. (2015). Morphology, kinematics, and dynamics: the mechanics of suction feeding in fishes. Integr. Comp. Biol. 55, 21–35. doi: 10.1093/icb/icv032
Dehais, C., Eudeline, R., Berrebi, P., and Argillier, C. (2010). Microgeographic genetic isolation in chub (Cyprinidae: Squalius cephalus) population of the Durance River: estimating fragmentation by dams. Ecol. Fresh. Fish. 19, 267–278. doi: 10.1111/j.1600-0633.2010.00411.x
Dempster, A. P., Laird, N. M., and Rubin, D. B. (1977). Maximum likelihood from incomplete data via the EM algorithm. J. R. Stat. Soc. Series B Stat. Methodol. 39, 1–38. doi: 10.1111/j.2517-6161.1977.tb01600.x
Diedericks, G., Henriques, R., von der Heyden, S., Weyl, O. L. F., and Hui, C. (2018a). The ghost of introduction past: spatial and temporal variability in the genetic diversity of invasive smallmouth bass. Evol. Appl. 11, 1609–1629. doi: 10.1111/eva.12652
Diedericks, G., Henriques, R., von der Heyden, S., Weyl, O. L. F., and Hui, C. (2018b). Sleeping with the enemy: introgressive hybridization in two invasive centrarchids. J. Fish Biol. 93, 405–410. doi: 10.1111/jfb.13730
Dixon, P. (2003). VEGAN, a package of R functions for community ecology. J. Veg. Sci. 14, 927–930. doi: 10.1111/j.1654-1103.2003.tb02228.x
Domisch, S., Amatulli, G., and Jetz, W. (2015). Near-global freshwater-specific environmental variables for biodiversity analyses in 1 km resolution. Sci. Data 2:150073. doi: 10.1038/sdata.2015.73
Drakou, E. G., Bobori, D. C., Kallimanis, A. S., Mazaris, A. D., Sgardelis, S. P., and Pantis, J. D. (2009). Freshwater fish community structured more by dispersal limitation than by environmental heterogeneity. Ecol. Freshw. Fish 18, 369–379. doi: 10.1111/j.1600-0633.2009.00354.x
DWA (2006). River Health Programme, State of Rivers Report: Olifants/Doring and Sandveld Rivers. Pretoria: DWA.
Dytham, C. (2009). Evolved dispersal strategies at range margins. Proc. R. Soc. B Biol. Sci. 276, 1407–1413. doi: 10.1098/rspb.2008.1535
Earl, D. A. (2012). Structure Harvester: a website and program for visualizing STRUCTURE output and implementing the Evanno method. Conserv. Genet. Res. 4, 359–361. doi: 10.1007/s12686-011-9548-7
Edelaar, P., and Bolnick, D. I. (2012). Non-random gene flow: an underappreciated force in evolution and ecology. Trends Ecol. Evol. 27, 659–665. doi: 10.1016/j.tree.2012.07.009
Edelaar, P., Siepielski, A. M., and Clobert, J. (2008). Matching habitat choice causes directed gene flow: a neglected dimension in evolution and ecology. Evolution 62, 2462–2472. doi: 10.1111/j.1558-5646.2008.00459.x
Endler, J. A. (1973). Gene flow and population differentiation: studies of clines suggest that differentiation along environmental gradients may be independent of gene flow. Science 179, 243–250. doi: 10.1126/science.179.4070.243
Evanno, G., Regnaut, S., and Goudet, J. (2005). Detecting the number of clusters of individuals using the software STRUCTURE: a simulation study. Mol. Ecol. 14, 2611–2620. doi: 10.1111/j.1365-294X.2005.02553.x
Excoffier, L., and Lischer, H. E. (2010). Arlequin suite ver 3.5: a new series of programs to perform population genetics analyses under Linux and Windows. Mol. Ecol. Res. 10, 564–567. doi: 10.1111/j.1755-0998.2010.02847.x
Garant, D., Ford, S. E., and Hendry, A. P. (2007). The multifarious effects of gene flow on contemporary adaptation. Func. Ecol. 2, 434–443. doi: 10.1111/j.1365-2435.2006.01228.x
Gerlach, G., Schardt, U., Eckmann, R., and Meyer, A. (2001). Kin-structured subpopulations in Eurasian perch (Perca fluviatilis L.). Heredity 86, 213–221. doi: 10.1046/j.1365-2540.2001.00825.x
Goudet, J. (1995). FSTAT (Version 1.2): a computer program to calculate F-statistics. J. Hered. 86, 485–486. doi: 10.1093/oxfordjournals.jhered.a111627
Hendry, A. P., Taylor, E. B., and McPhail, J. D. (2002). Adaptive divergence and the balance between selection and gene flow: lake and stream stickleback in the Misty system. Evolution 56, 1199–1216. doi: 10.1111/j.0014-3820.2002.tb01432.x
Higham, T. E. (2011). “Feeding mechanics,” in Encyclopedia of Fish Physiology: From Genome to Environment, ed. A. Farrell (San Diego, CA: Academic Press), 597–602.
Hijmans, R. J., Cameron, S. E., Parra, J. L., Jones, P. G., and Jarvis, A. (2005). Very high resolution interpolated climate surfaces for global land areas. Int. J. Climatol. 25, 1965–1978. doi: 10.1002/joc.1276
Hui, C., Roura-Pascual, N., Brotons, L., Robinson, R. A., and Evans, K. L. (2012). Flexible dispersal strategies in native and non-native ranges: environmental quality and the ‘good-stay bad-disperse’ rule. Ecography 35, 1024–1032. doi: 10.1111/j.1600-0587.2012.07697.x
Jacob, S., Bestion, E., Legrand, D., Clobert, J., and Cote, J. (2015). Habitat matching and spatial heterogeneity of phenotypes: implications for metapopulation and metacommunity functioning. Evol. Ecol. 29, 851–871. doi: 10.1007/s10682-015-9776-5
Jakobsson, M., and Rosenberg, N. A. (2007). CLUMPP: a cluster matching and permutation program for dealing with label switching and multimodality in analysis of population structure. Bioinformatics 23, 1801–1806. doi: 10.1093/bioinformatics/btm233
Johnson, S. L. (2004). Factors influencing stream temperatures in small streams: substrate effects and a shading experiment. Can. J. Fish. Aquat. 61, 913–923. doi: 10.1139/f04-040
Jombart, T., and Ahmed, I. (2011). Adegenet 1.3-1: new tools for the analysis of genome-wide SNP data. Bioinformatics 27, 3070–3071. doi: 10.1093/bioinformatics/btr521
Keast, A., and Webb, D. (1966). Mouth and body form relative to feeding ecology in the fish fauna of a small lake, Lake Opinicon, Ontario. J. Fish. Res. Board Can. 23, 1845–1874. doi: 10.1139/f66-175
Klingenberg, C. P. (2011). MorphoJ: an integrated software package for geometric morphometrics. Mol. Ecol. Res. 11, 353–357. doi: 10.1111/j.1755-0998.2010.02924.x
Langerhans, R. B. (2008). Predictability of phenotypic differentiation across flow regimes in fishes. Integr. Comp. Biol. 48, 750–768. doi: 10.1093/icb/icn092
Langerhans, R. B., and Reznick, D. N. (2010). “Ecology and evolution of swimming performance in fishes: predicting evolution with biomechanics,” in Fish Locomotion: An Eco-ethological Perspective, eds P. Domenici and B. G. Kapoor (Enfield, NH: Science Publishers), 200–248. doi: 10.1098/rspb.2017.0359
Langerhans, R. B., Layman, C. A., Langerhans, A. K., and Dewitt, T. J. (2003). Habitat-associated morphological divergence in two Neotropical fish species. Biol. J. Linn. Soc. 80, 689–698. doi: 10.1111/j.1095-8312.2003.00266.x
Lee, C. E. (2002). Evolutionary genetics of invasive species. Trends Ecol. Evol. 17, 386–391. doi: 10.1016/S0169-5347(02)02554-5
Lodge, D. M., Stein, R. A., Brown, K. M., Covich, A. P., Brönmark, C., Garvey, J. E., et al. (1998). Predicting impact of freshwater exotic species on native biodiversity: challenges in spatial scaling. Aust. J. Ecol. 23, 53–67. doi: 10.1111/j.1442-9993.1998.tb00705.x
Loppnow, G. L., Vascotto, K., and Venturelli, P. A. (2013). Invasive smallmouth bass (Micropterus dolomieu): history, impacts, and control. Manag. Biol. Invasions 4, 191–206. doi: 10.3391/mbi.2013.4.3.02
Lucek, K., Sivasundar, A., Roy, D., and Seehausen, O. (2013). Repeated and predictable patterns of ecotypic differentiation during a biological invasion: lake–stream divergence in parapatric Swiss stickleback. J. Evol. Biol. 26, 2691–2709. doi: 10.1111/jeb.12267
Lyons, J., and Kanehl, P. (2002). “Seasonal movements of smallmouth bass in streams,” in Proceedings of the American Fisheries Society Symposium, (Bethesda, MD: American Fisheries Society), 149–160.
Malloy, T. P., Van Den Bussche, R. A. Jr., Coughlin, W. D., and Echelle, A. A. (2000). Isolation and characterization of microsatellite loci in smallmouth bass, Micropterus dolomieu (Teleostei: centrarchidae), and cross-specific amplification in spotted bass, M. punctulatus. Mol. Ecol. 9, 191–195. doi: 10.1046/j.1365-294x.2000.01096-16.x
Manel, S., Gaggiotti, O. E., and Waples, R. S. (2005). Assignment methods: matching biological questions with appropriate techniques. Trends Ecol. Evol. 20, 136–142. doi: 10.1016/j.tree.2004.12.004
Mantel, N. (1967). The detection of disease clustering and a generalized regression approach. Cancer Res. 27, 209–220.
Nicolaus, M., and Edelaar, P. (2018). Comparing the consequences of natural selection, adaptive phenotypic plasticity, and matching habitat choice for phenotype–environment matching, population genetic structure, and reproductive isolation in meta populations. Ecol. Evol. 8, 3815–3827. doi: 10.1002/ece3.3816
Olden, J. D., Kennard, M. J., Leprieur, F., Tedesco, P. A., Winemiller, K. O., and García-Berthou, E. (2010). Conservation biogeography of freshwater fishes: recent progress and future challenges. Divers. Distrib. 16, 496–513. doi: 10.1111/j.1472-4642.2010.00655.x
Paetkau, D., Slade, R., Burden, M., and Estoup, A. (2004). Genetic assignment methods for the direct, real-time estimation of migration rate: a simulation-based exploration of accuracy and power. Mol. Ecol. 13, 55–65. doi: 10.1046/j.1365-294X.2004.02008.x
Patterson, T. A., Thomas, L., Wilcox, C., Ovaskainen, O., and Matthiopoulos, J. (2008). State–space models of individual animal movement. Trends Ecol. Evol. 23, 87–94. doi: 10.1016/j.tree.2007.10.009
Peakall, R. O. D., and Smouse, P. E. (2006). GENALEX 6: genetic analysis in Excel. Population genetic software for teaching and research. Mol. Ecol. Notes 6, 288–295. doi: 10.1111/j.1471-8286.2005.01155.x
Pebesma, E. (2016). Map Overlay and Spatial Aggregation in sp. Available online at: https://cran.r-project.org/web/packages/sp/vignettes/over.pdf (accessed September 15, 2018).
Piry, S., Alapetite, A., Cornuet, J. M., Paetkau, D., Baudouin, L., and Estoup, A. (2004). GENECLASS2: a software for genetic assignment and first-generation migrant detection. J. Hered. 95, 536–539. doi: 10.1093/jhered/esh074
Prentis, P. J., Wilson, J. R., Dormontt, E. E., Richardson, D. M., and Lowe, A. J. (2008). Adaptive evolution in invasive species. Trends Plant Sci. 13, 288–294. doi: 10.1016/j.tplants.2008.03.004
Pritchard, J. K., Stephens, M., and Donnelly, P. (2000). Inference of population structure using multilocus genotype data. Genetics 155, 945–959. doi: 10.1093/genetics/155.2.945
Pritchard, J. K., Wen, X., and Falush, D. (2010). Documentation for STRUCTURE Software, Version 2.3. Chicago, IL: University of Chicago.
Putman, A. I., and Carbone, I. (2014). Challenges in analysis and interpretation of microsatellite data for population genetic studies. Ecol. Evol. 4, 4399–4428. doi: 10.1002/ece3.1305
Rannala, B., and Mountain, J. L. (1997). Detecting immigration by using multilocus genotypes. Proc. Natl. Acad. Sci. U.S.A. 9, 9197–9201. doi: 10.1073/pnas.94.17.9197
Ricciardi, A., and MacIsaac, H. J. (2000). Recent mass invasion of the North American Great Lakes by Ponto–Caspian species. Trends Ecol. Evol. 15, 62–65. doi: 10.1016/S0169-5347(99)01745-0
Rice, W. R. (1989). Analyzing tables of statistical tests. Evolution 43, 223–225. doi: 10.1111/j.1558-5646.1989.tb04220.x
Richards, C. L., Bossdorf, O., Muth, N. Z., Gurevitch, J., and Pigliucci, M. (2006). Jack of all trades, master of some? On the role of phenotypic plasticity in plant invasions. Ecol. Lett. 9, 981–993. doi: 10.1111/j.1461-0248.2006.00950.x
Ridgway, M. S., and Shuter, B. J. (1996). Effects of displacement on the seasonal movements and home range characteristics of smallmouth bass in Lake Opeongo. N. Am. J. Fish. Manag. 16, 371–377. doi: 10.1577/154886751996016<0371:EODOTS<2.3.CO;2
Rohlf, F. J. (2013). tpsDig, Digitize Landmarks and Outlines, version 2.17. Stony Brook, NY: Department of Ecology and Evolution, State University of New York.
Ronce, O. (2007). How does it feel to be like a rolling stone? Ten questions about dispersal evolution. Annu. Rev. Ecol. Evol. Syst. 38, 231–253. doi: 10.1146/annurev.ecolsys.38.091206.095611
Rosenberg, N. A. (2004). DISTRUCT: a program for the graphical display of population structure. Mol. Ecol. Notes 4, 137–138. doi: 10.1046/j.1471-8286.2003.00566.x
Rousset, F. (2008). genepop’007: a complete reimplementation of the genepop software for Windows and Linux. Mol. Ecol. Res. 8, 103–106. doi: 10.1111/j.1471-8286.2007.01931.x
Rubenson, E. S., and Olden, J. D. (2017). Dynamism in the upstream invasion edge of a freshwater fish exposes range boundary constraints. Oecologia 184, 453–467. doi: 10.1007/s00442-017-3885-5
Saastamoinen, M., Bocedi, G., Cote, J., Legrand, D., Guillaume, F., Wheat, C. W., et al. (2018). Genetics of dispersal. Biol. Rev. 93, 574–599. doi: 10.1111/brv.12356
Sala, O. E., Chapin, F. S., Armesto, J. J., Berlow, E., Bloomfield, J., Dirzo, R., et al. (2000). Global biodiversity scenarios for the year 2100. Science 287, 1770–1774. doi: 10.1126/science.287.5459.1770
Sass, G. G., and Motta, P. J. (2002). The effects of satiation on strike mode and prey-capture kinematics in the largemouth bass, Micropterus salmoides. Environ. Biol. Fishes 65, 441–454. doi: 10.1023/A:1021108519634
Schall, M. K., Bartron, M. L., Wertz, T., Niles, J. M., Shaw, C. H., Blazer, V. S., et al. (2017). Evaluation of genetic population structure of smallmouth bass in the Susquehanna River basin, Pennsylvania. N. Am. J. Fish. Manag. 37, 850–861. doi: 10.1080/02755947.2017.1327902
Schwartz, M. K., and McKelvey, K. S. (2009). Why sampling scheme matters: the effect of sampling scheme on landscape genetic results. Conserv. Genet. 10:441. doi: 10.1007/s10592-008-9622-1
Slatkin, M. (1985). Rare alleles as indicators of gene flow. Evolution 39, 53–65. doi: 10.1111/j.1558-5646.1985.tb04079.x
Smouse, P. E., and Peakall, R. O. D. (1999). Spatial autocorrelation analysis of individual multiallele and multilocus genetic structure. Heredity 82, 561–573. doi: 10.1038/sj.hdy.6885180
Soderberg, K. (2003). Geochemistry of the Fynbos Ecosystem in a Table Mountain Group sub Catchment of the Olifants River, Western Cape, South Africa. Master’s thesis. Cape Town: University of Cape Town.
Taylor, G. C., and Weyl, O. L. F. (2013). Validation of annulus formation in otoliths of largemouth bass Micropterus salmoides outside their native range. J. Appl. Ichthyol. 29, 381–386. doi: 10.1111/jai.12150
Tiffin, P., and Ross-Ibarra, J. (2014). Advances and limits of using population genetics to understand local adaptation. Trends Ecol. Evol. 29, 673–680. doi: 10.1016/j.tree.2014.10.004
Todd, B. L., and Rabeni, C. F. (1989). Movement and habitat use by stream-dwelling smallmouth bass. Trans. Am. Fish. Soc. 118, 229–242. doi: 10.1577/1548-86591989118<0229:MAHUBS<2.3.CO;2
Tran, H. Q., Mehta, R. S., and Wainwright, P. C. (2010). Effects of ram speed on prey capture kinematics of juvenile Indo-Pacific tarpon, Megalops cyprinoides. Zoology 113, 75–84. doi: 10.1016/j.zool.2009.08.002
Valentin, A. E., Penin, X., Chanut, J. P., Sévigny, J. M., and Rohlf, F. J. (2008). Arching effect on fish body shape in geometric morphometric studies. J. Fish Biol. 73, 623–638. doi: 10.1111/j.1095-8649.2008.01961.x
Van der Walt, J. A., Weyl, O. L. F., Woodford, D. J., and Radloff, F. G. T. (2016). Spatial extent and consequences of black bass (Micropterus spp.) invasion in a Cape Floristic Region river basin. Aquat. Conserv. Mar. Freshw. Ecosyst. 26, 736–748. doi: 10.1002/aqc.2589
Van Oosterhout, C., Weetman, D., and Hutchinson, W. F. (2006). Estimation and adjustment of microsatellite null alleles in nonequilibrium populations. Mol. Ecol. Notes 6, 255–256. doi: 10.1111/j.1471-8286.2005.01082.x
Via, S., Gomulkiewicz, R., De Jong, G., Scheiner, S. M., Schlichting, C. D., and Van Tienderen, P. H. (1995). Adaptive phenotypic plasticity: consensus and controversy. Trends Ecol. Evol. 10, 212–217. doi: 10.1016/s0169-5347(00)89061-8
Wahlund, S. (1928). Zusammensetzung von populationen und korrelationerscheinungen vom standpunkt der vererbungslehre aus betrachtet. Hereditas 11, 65–106. doi: 10.1111/J.1601-5223.1928.TB02483.X
Wainwright, P., Carroll, A. M., Collar, D. C., Day, S. W., Higham, T. E., and Holzman, R. A. (2007). Suction feeding mechanics, performance, and diversity in fishes. Integr. Comp. Biol. 47, 96–106. doi: 10.1093/icb/icm032
Westhoff, J. T., Paukert, C., Ettinger-Dietzel, S., Dodd, H., and Siepker, M. (2016). Behavioural thermoregulation and bioenergetics of riverine smallmouth bass associated with ambient cold-period thermal refuge. Ecol. Freshw. Fish 25, 72–85. doi: 10.1111/eff.12192
Whitledge, G. W., Hayward, R. S., and Rabeni, C. F. (2002). Effects of temperature on specific daily metabolic demand and growth scope of sub-adult and adult smallmouth bass. J. Freshw. Ecol. 17, 353–361. doi: 10.1080/02705060.2002.9663908
Winemiller, K. O. (1991). Ecomorphological diversification in lowland freshwater fish assemblages from five biotic regions. Ecol. Monogr. 61, 343–365. doi: 10.2307/2937046
Winemiller, K. O., Flecker, A. S., and Hoeinghaus, D. J. (2010). Patch dynamics and environmental heterogeneity in lotic ecosystems. J. North Am. Benthol. Soc. 29, 84–99. doi: 10.1899/08-048.1
Zhang, F., and Hui, C. (2014). Recent experience-driven behaviour optimizes foraging. Anim. Behav. 88, 13–19. doi: 10.1016/j.anbehav.2013.11.002
Keywords: freshwater fish, matching habitat choice, ecomorphology, Wahlund effect, gene flow, genetic diversity
Citation: Diedericks G, Broeckhoven C, von der Heyden S, Weyl OLF and Hui C (2022) The Role of Directed Dispersal in Driving Genetic and Morphological Structure in Invasive Smallmouth Bass. Front. Ecol. Evol. 9:790829. doi: 10.3389/fevo.2021.790829
Received: 07 October 2021; Accepted: 30 November 2021;
Published: 17 January 2022.
Edited by:
Shannon J. McCauley, University of Toronto Mississauga, CanadaReviewed by:
Erika Rubenson, Four Peaks Environmental Science & Data Solutions, United StatesLiz Alter, California State University, Monterey Bay, United States
Copyright © 2022 Diedericks, Broeckhoven, von der Heyden, Weyl and Hui. This is an open-access article distributed under the terms of the Creative Commons Attribution License (CC BY). The use, distribution or reproduction in other forums is permitted, provided the original author(s) and the copyright owner(s) are credited and that the original publication in this journal is cited, in accordance with accepted academic practice. No use, distribution or reproduction is permitted which does not comply with these terms.
*Correspondence: Genevieve Diedericks, ZGllZGVyaWNrcy5nZW5ldmlldmVAZ21haWwuY29t
†Deceased