Abstract
Most insect communities are composed of evolutionarily diverse lineages, but detailed phylogenetic analyses of whole communities are lacking, in particular in species-rich tropical faunas. Likewise, our knowledge of the Tree-of-Life to document evolutionary diversity of organisms remains highly incomplete and especially requires the inclusion of unstudied lineages from species-rich ecosystems. Here we present the SITE-100 program, which is an attempt at building the Tree-of-Life from whole-community sampling of high-biodiversity sites around the globe. Combining the local site-based sets into a global tree produces an increasingly comprehensive estimate of organismal phylogeny, while also re-tracing evolutionary history of lineages constituting the local community. Local sets are collected in bulk in standardized passive traps and imaged with large-scale high-resolution cameras, which is followed by a parataxonomy step for the preliminary separation of morphospecies and selection of specimens for phylogenetic analysis. Selected specimens are used for individual DNA extraction and sequencing, usually to sequence mitochondrial genomes. All remaining specimens are bulk extracted and subjected to metabarcoding. Phylogenetic analysis on the mitogenomes produces a reference tree to which short barcode sequences are added in a secondary analysis using phylogenetic placement methods or backbone constrained tree searches. However, the approach may be hampered because (1) mitogenomes are limited in phylogenetic informativeness, and (2) site-based sampling may produce poor taxon coverage which causes challenges for phylogenetic inference. To mitigate these problems, we first assemble nuclear shotgun data from taxonomically chosen lineages to resolve the base of the tree, and add site-based mitogenome and DNA barcode data in three hierarchical steps. We posit that site-based sampling, though not meeting the criterion of “taxon-completeness,” has great merits given preliminary studies showing representativeness and evenness of taxa sampled. We therefore argue in favor of site-based sampling as an unorthodox but logistically efficient way to construct large phylogenetic trees.
Introduction
A solid taxonomy of species on Earth is the basis of all biology. Community ecology depends on detailed knowledge of species in the assemblage and their traits that determine each species’ functional role, its interactions with other species, and its ecological and geographic distributions. These species traits are acquired in a line of descent from a common ancestor, and knowing the phylogenetic placement of a species can inform us of its traits (Wiley and Lieberman, 2011). The power of phylogenetics to test hypotheses of ecological trait evolution within communities has long been recognized (Losos, 1996). In studies of community ecology, information on trait evolution is used in a variety of ways, e.g., for distinguishing between scenarios of environmental filtering and competition inferred from phylogenetic clustering or overdispersion, respectively, and the processes driving community assembly generally (Webb et al., 2002; Choo et al., 2017). This paper considers the utility of phylogenetics in community ecology from the perspective of the huge unknown species diversity encountered in many groups of invertebrates. The core focus of our approach aims at sampling understudied and yet to be described species from multiple sites worldwide and adding them to the phylogenetic tree. With each additional sample, the phylogenetic tree becomes more complete in representing the global diversity, while in turn the growing global tree informs on the phylogenetic composition of each local community.
A comprehensive catalog of all or most living species and their phylogenetic relationships appeared largely unattainable with conventional taxonomic methods, but potentially is made possible with the tools of genomics and fast algorithms for phylogenetic tree construction (Hinchliff et al., 2015; Lewin et al., 2018). However, this vision of a complete Tree-of-Life has yet to become a realistic prospect on account of the multiple constraints to taxonomy over the past two centuries. As these constraints shifted over time, they highlight the limitation to our current knowledge and the possibility that the diversity of life on Earth will never be fully known, as the extinction crisis leaves little available time (Dirzo and Raven, 2003). Any approach aimed at speeding up the taxonomic process therefore needs to maximize its contribution in the face of methodological limitations and constraints to resources. Of particular concern are recent restrictions to access to biological samples in a complex regulatory framework for specimen acquisition (Laird et al., 2020). This begs the question about the most efficient manner for obtaining a phylogenetic tree that represents the highest number of species possible. We propose that a community ecology approach could greatly contribute to the taxonomic endeavor while at the same time producing key insights into the forces that shape the assembly and maintenance of the communities themselves. As we take on the task of producing ever larger phylogenetic trees as more communities are added, we also need to understand the potential pitfalls of phylogenetic-tree building that come with a community centered approach.
Over the past two centuries, continuing efforts of species description and phylogenetic analyses have produced a classification that captures the state of knowledge about the huge diversity of living and extinct species and their evolutionary history (Grandcolas and Pellens, 2016). Most conventional approaches of filling the gaps in taxonomic knowledge target particular focal groups or species that are described with reference to close relatives, either already known or also newly described, and only once the group is sufficiently well known is the taxonomic information made available for use in ecological or biodiversity studies. This monographic process of taxonomy can take decades from the time of the initial discovery of a specimen (the so-called “species shelf-life”), and thus such lineage-based approaches are not efficient for the use of phylogenetics in community ecology (Fontaine et al., 2012). They also do not make efficient use of recent methods of DNA sequencing and large-scale digital imaging, which allows processing of numerous species in large batches irrespective of the membership in a particular lineage. Various approaches to automated sorting and imaging of morphospecies for downstream extractions and sequencing have already been developed (e.g., Folk et al., 2021; Srivathsan et al., 2021). We here propose the SITE-100 initiative as an approach specifically designed to deal with the dire need for higher-throughput methods in taxonomy, to both assess species diversity and trace its origins at community level. SITE-100 takes a site-based approach to sampling the Tree-of-Life, by collecting extensively at accessible high-biodiversity localities and processing all or most specimens encountered with standard imaging and sequencing methods (Arribas et al., 2021), to be incorporated in the global phylogenetic tree. The initial ambition of this project is to obtain local samples for 100 sites around the globe, to represent the major biogeographic realms and ecoregions, with focus on forest biomes (Olson et al., 2001). With a site-based approach, communities are captured—as they are ecologically encountered, therefore keeping communities intact—in one sampling event. Once incorporated in a phylogenetic tree, the community data sets provide the basis for addressing questions about local ecological interactions, habitat associations, environmental filters, and others, while at the global level they contribute to address macroevolutionary and macroecological questions about lineage evolution, rates of speciation, historical biogeography, and global species distribution patterns.
Traditionally, alpha taxonomy, being the delimitation and description of species, and phylogenetics, being the inference of relationships, combine into the field of systematics, which enables our classification and understanding of biodiversity. With the wide use of DNA sequencing, these approaches are no longer separate, as population-level sequence data designed to determine the species boundaries or population structure can equally be used to link these species into a wider database and phylogenetic tree (Bocak et al., 2016). Community sampling has immense potential to contribute to phylogenetic inference, as it adds the knowledge of species diversity, while the phylogenetic inference is improved with the increasing taxon density and growing amount of DNA data per species (Tautz et al., 2003; Vogler and Monaghan, 2007). It is worth noting that mapping out the historical processes of evolution through phylogenetics vs. deciphering current compositional aspects of community species diversity are no longer separate endeavors but present themselves as a singular challenge. All aspects of defining and placing a species within an evolutionary framework (systematics) is continually refined by the addition of new data (Lipscomb et al., 2003). To the degree that a tree depicting the relationships of extant species can reflect the true evolutionary history, this growing database and use of sophisticated phylogenetic inference methods would eventually approach an evolutionary tree that includes most of the extant biodiversity at the species level. There has yet to be an organized endeavor that aims to (i) sample the globe at multiple sites and (ii) co-assess both what is present in the local fauna (community scale), and what are the relationships of the local faunas with one another (biogeographic scale). The challenge of bringing together these aspects of both alpha and beta diversity to iteratively begin sampling the globe, and gain a true sense of the diversity within biomes, can be met with the application of high throughput phylogenetics.
Existing databases, even in large collaborative projects are far from achieving a comprehensive tree (Rees and Cranston, 2017). First and foremost, the greatest complication arises from the sheer magnitude of unknown species (Mora et al., 2011). Even if we focus only on Metazoa (multicellular eukaryotes), possibly 90% of species remain unknown. Mora et al. (2011) predicts global eukaryotic diversity to be in the region of 8.7 million (± 1.3 million SE) species, of which ∼2.2 million (± 0.18 million SE) are marine. However, only a fraction of this number has been named and incorporated in the Tree-of-Life. For example, 2.3 million names are present in the Open Tree-of-Life, currently the most comprehensive database of this kind, but the great majority of nodes remain unresolved and only correspond to the Linnaean taxonomy (Hinchliff et al., 2015). In many lineages such as protozoans the proportion of unknown diversity may be a lot higher (Larsen et al., 2017). In addition, these species counts are generally based on Linnaean names and morphological species delimitations that are not easily linked to a DNA-based taxonomic system on which phylogenetic inference is predominantly based (Zamani et al., 2021). Extensive sequencing efforts at the species level are underway, generating inventories of standardized short “DNA barcodes” for each species (Hebert et al., 2003). However, this leads us to the second issue of the type and number of genes available: while barcodes are readily generated, they have limited phylogenetic power (Wiemers and Fiedler, 2007; Quicke et al., 2012; DeSalle and Goldstein, 2019). Resolving deeper levels requires more genes, i.e., genomics, but data collection and analysis are not practical for all species. Compounding this are challenges created by gene flow and horizontal gene transfer that complicate the inference of the species tree from a limited set of markers. Overall, most ambitious genome sequencing projects that ultimately aim for genome sequences for all species, namely the i5K (Robinson et al., 2011), Darwin Tree of Life1, and the EarthBiogenome, remain in their infancy, although in insects the availability of genome sequences is now increasing exponentially (Feron and Waterhouse, 2021).
The SITE-100 initiative implements a hybrid approach, where well-identified specimens are used to bridge classical morpho-taxonomy and phylogenetic inference by subjecting them to a combined phylogenetic analysis of taxon-poor genomic data and link them to taxon-dense metabarcodes (Figure 1). This hybrid approach that integrates few taxa represented by many genes, and many taxa represented by few genes, is probably the only realistic prospect for building the species-level Tree-of-Life in the near future (Chesters, 2017). Disparate activities over the past circa 300 years reporting on Earth’s diversity have been lacking until the advent of phylogenetics, which enhanced the taxonomic informativeness that goes beyond a catalog of species and individual observations, and now provides a synthesis of lineage and trait evolution. Vice versa, for the Tree-of-Life to be fully understood ecological factors must be investigated. The phylo-ecology of community (site) based studies presented here provides an increasingly necessary adjunct to the gargantuan effort of taxonomic lineage-based studies. Combining these approaches, we can then move toward a methodology embedded within the discipline of systematics, within the modern-day constraints to accessing the “completeness” of all living species on Earth.
FIGURE 1

The SITE-100 initiative implements a hybrid approach with different levels of phylogenetic sequencing depth and taxon density. Full genome data are used to represent a limited set of major lineages chosen on taxonomic grounds, while mitogenomes and metabarcodes represent increasing levels of sampling density but with lower sequencing amount. The top level represents intraspecific variation that is assessed using filtered unique ASVs from multiple metabarcoding libraries.
The SITE-100 Methodology
We first discuss the SITE-100 approach in regard to the protocols for data generation and processing. The approach borrows from the idea of “genomic observatories,” i.e., sites that are part of a global network for, ideally, long-term surveillance using genomic methods (Davies et al., 2014). Even if limited to short periods of intense collecting, the SITE-100 approach aspires to employ standardized field methodology repeatable across biomes. A georeferenced one-hectare plot populated with collecting traps enables consistency of data collection across biomes and habitats, with an initial focus on known biodiversity hotspots in tropical forest sites. Specimen selection for phylogenetic analysis relies on an alpha-taxonomic overview for morphospecies capture, particularly with regard to complex community assemblages where putative species are many and cryptic. High throughput sequencing (HTS) provides data for the different hierarchical levels at which the analysis of diversity and turnover is conducted: (1) Genome sequencing for resolving basal relationships; (2) large-scale mitogenome sequencing for the phylogenetics of local communities; (3) (meta) barcoding for the sequencing of all species (or clusters of sequence variation, referred to as Operational Taxonomic Units, OTUs) for studies of species diversity; and (4) ultimately providing resolution of haplotypes (Amplicon Sequence Variants, ASVs) for phylogeographic and population genetics studies (Figure 1).
The sampling and sequencing strategy of the SITE-100 protocol coincides with this hierarchical structure of the data (Figure 2). In the field, we make use of a suite of sampling methods including passive traps (flight interception, pitfall, malaise, light traps), sweeping, and canopy-fogging. Sites may contain sub-sites to cover as many kinds of habitat as possible within a given area. These methods are replicated through time, e.g., 1 month collecting period using a particular trap type for 3-day intervals, providing a modular design that helps with comparability across sites and trapping methods (Arribas et al., 2021). Once gathered in the field, the pool of specimens is imaged using large-scale, high resolution photography (Appendix 1). In a further step these images are used to select representatives of all recognizable morphospecies or of key specimens of interest to phylogenetics spanning the assumed phylogenetic diversity of a site. This selection of specimens conducted in “real-time” requires the expertise of parataxonomists able to recognize higher-level taxa and to separate morphospecies. However, as DNA extractions are generally non-destructive the detailed evaluation of specimens can be conducted by taxonomic specialists at a later stage.
FIGURE 2
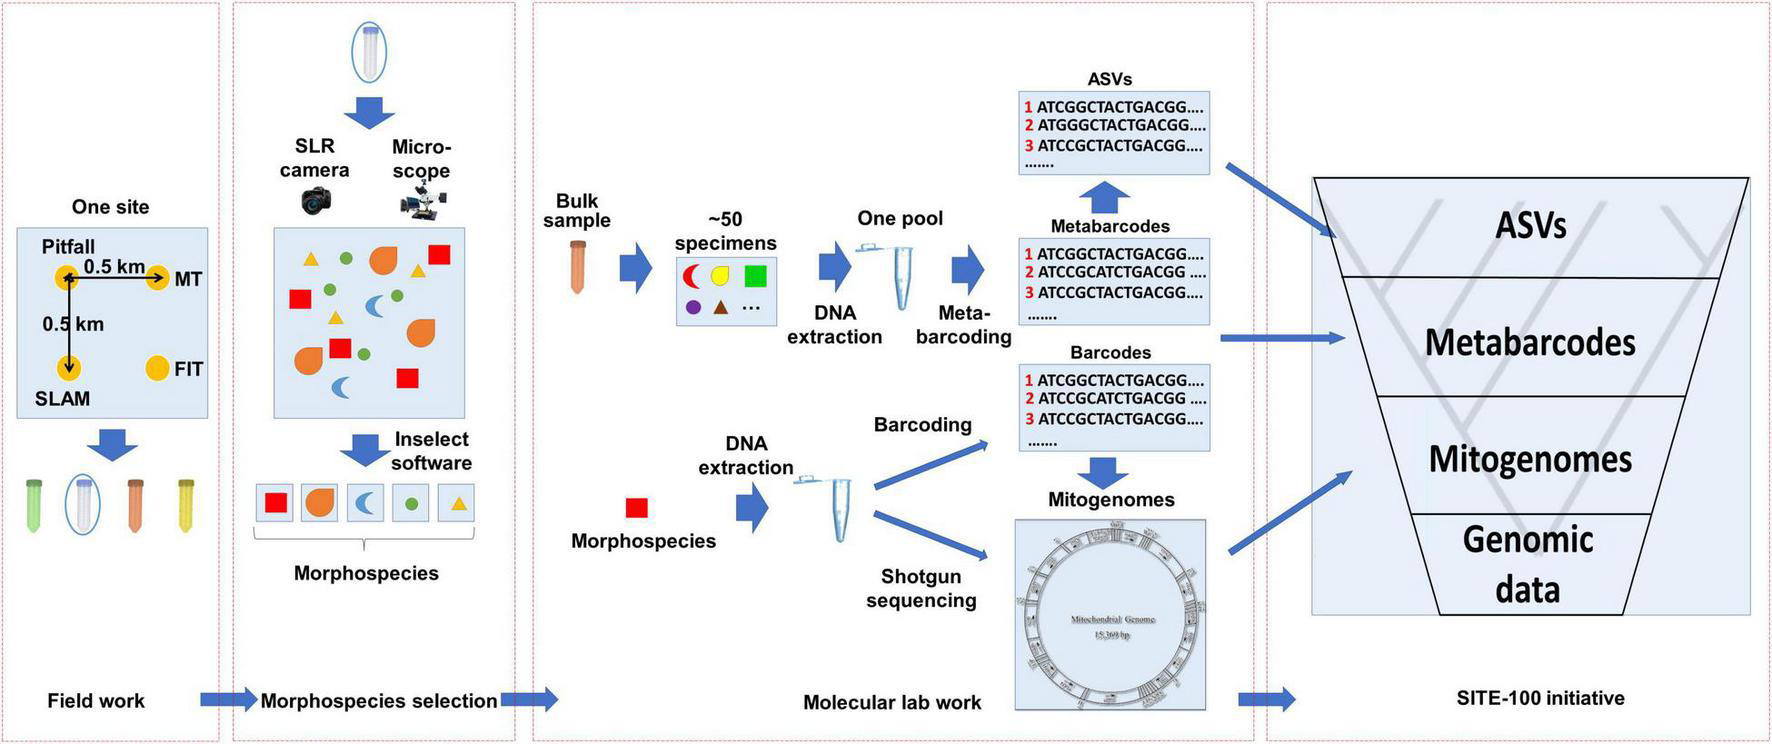
General workflow of the SITE-100 initiative. (1) Field work: Sampling from one site using various standardized collection methods: pitfall trap, Malaise trap (MT), Flight interception trap (FIT) and sea, land, air, and malaise trap (SLAM) to sample from the various strata of a given habitat. (2) Morphospecies selection: Specimens selected in batches of 50 of similar size and digitally imaged with high-resolution imagery. The resulting composite image is separated to morphospecies by employing open-source software Inselect (Hudson et al., 2015). (3) Molecular lab work: A hybrid approach of cox1 metabarcoding of bulk samples and mitochondrial metagenomics of individual specimens representing unique morphospecies. For the latter, cox1 barcodes are produced in parallel as baits for recovery of mitogenomes from mixed sequencing libraries. (4) SITE-100 database and analyses: Phylogeny reconstruction of hierarchical datasets and metabarcode placement for Tree-of-Life construction and biodiversity research.
At the core of the sequencing strategy is the community-wide analysis and assembly of genomic information of mixed specimens using either metagenomics (PCR-free) or metabarcoding (PCR-based). Phylogenetically informative markers may be obtained by genome skimming, i.e., the low coverage shotgun sequencing of pooled samples and assembly of high-copy markers using standard genome assemblers, which in insects provides the reliable acquisition of mitogenomes for all specimens in the mixture (Zhou et al., 2013; Papadopoulou et al., 2015; Crampton-Platt et al., 2016). Genome skimming can add to the number of available mitogenomes rapidly at a sequencing depth of about 10 species per Gb of DNA shotgun data. This step can be conducted on the unsorted specimen mixture from the trap sample (the “insect soup”; Ji et al., 2013) or after the presorting of individual target specimens (Crampton-Platt et al., 2016). Prior to DNA extraction, bulk specimens are imaged with large-scale, high resolution imaging systems, such as the Zeiss AXIO Zoom, featuring a motorized focus drive and motorized stage that enable the field to be divided into regular tile-images which are subsequently xyz stitched. Individual specimen images are cropped from the composite photograph, e.g., using the Inselect software (Hudson et al., 2015), and uploaded to public image databases for storage and downstream taxonomic identification. This image database also provides the for selection of specimens for individual DNA extraction for shotgun sequencing in the genome skimming step generating the mitogenomes (or potentially generating nuclear ortholog sets if sequenced more deeply).
In the currently used protocols, mitochondrial genomes are obtained by shotgun sequencing on the Illumina platform and bioinformatically separated, usually mixing the DNAs from ∼200 specimens to reduce costs. This approach routinely generates 50–80% of complete or nearly complete mitogenome assembly (e.g., Breeschoten et al., 2016; Choo et al., 2017), with limited risk of chimera formation (Gómez-Rodríguez et al., 2017). The resulting mitogenome assemblies are then assigned to a particular specimen by a DNA barcoding step carried out in parallel. The DNA extract from each specimen in the library is used for a separate amplification and sequencing of a fragment of cox1, and the most abundant read extracted with the NAPtime pipeline (Creedy et al., 2019) is used as bait to match a particular mitogenome contigs. However, as sequencing library costs are becoming cheaper, separate genome skims of each individual may be preferable over the sequencing of a specimen mixture. All remaining specimens not selected in this step are bulk-processed and subjected to metabarcoding using the cox1 gene. Of the total pool of cox1 sampled, we cluster sequence reads into OTUs to obtain entities equivalent to the species level using VSEARCH (Rognes et al., 2016). Alternatively, stringent filtering can produce the presumed true haplotypes (ASVs). Phylogeny reconstruction by hierarchical datasets then follows suit, with metabarcode placement on the tips of the phylogeny. For specific details please refer to Figure 2 and Appendix 1.
Building the Tree-of-Life Using Site-Based Metagenomic Sequencing
Each “community,” i.e., the specimens encountered at the 1-ha sites potentially including many hundreds of species, is a largely fortuitous selection of species and deeper lineages. They can be expected to include taxa previously unknown and thus fill the gaps in global clade coverage, obviating traditional approaches specifically seeking to “complete” the sampling of a target lineage. Metabarcoding and metagenomics will extend taxonomic research in particular to the “hidden” biodiversity of small-bodied and poorly known groups whilst populating the tree at the deeper nodes. With the resulting phylogenetic tree, the evolutionary history of the community can be known. For example, a community may be characterized as the inhabitants of a single tree of any given biome, or the population of a geologically young island. Taking into account the growing numbers of samples, DNA data from local sites are combined for an ever more complete sampling of the global Tree-of-Life. Placement of the members of each community on the global tree becomes instrumental to understanding the evolutionary history of local communities, including the biogeographic context that is obtained automatically from the site information (i.e., data retain information of the sites from which they are sampled).
Sequencing and sampling methods of SITE-100 thus deviate from standard practice in phylogenetics, which aims at a set of taxonomic exemplars deemed adequate representatives of a focal group (McKenna et al., 2019). On the other hand the phylogenetics of site-based selection regimes remains in its infancy. By linking two disciplines—phylogenetics and community ecology—it holds great potential for them to converge, provided there is general awareness of possible implications of this type of taxon choice on inferring phylogenetic relationships.
The Impact of Site-Based Sampling on Tree Inference: What Is the Phylogenetic Problem?
The potential problems of site-based phylogenetics revolve around the incomplete sampling of a local site and the limited representation of lineages to inform the topological reconstruction, which exacerbate long-branch attraction (LBA) (Bergsten, 2005). Community sampling intends to capture the phylogenetic diversity within a region. Essentially, it relies on the assumption that many small site-based samples are adequate to capture the phylogenetic diversity of large geographic regions (Figure 3). However, single-sites sampling may skew the taxon selection because: (1) Single sites contain species that are phylogenetically clumped relative to the global tree because of their conserved biogeographic distributions (the locality is phylogenetically correlated) or the common ancestry of ecological traits of co-occurring species (traits are phylogenetically conserved). (2) Single sites contain lineages that are phylogenetically isolated given the incomplete representation of the global tree at any one site. Thus, site-based studies would be expected to suffer from long branches in phylogenetically isolated taxa, which may confound the tree construction in particular when using DNA data with high levels of homoplasy. However, as site-based sampling proceeds, increasing numbers of communities are fed into the same global dataset and phylogenetic analysis so that branches are more densely sampled. Between multiple sites, the following can be expected based on preliminary empirical observations: (1) It takes very few sites globally for most deep lineages to be represented. For example, using communities of Coleoptera (beetles) a few sites in the Neotropics and a single site in Borneo already recovered most clades known from a global taxonomic effort (most families and even subfamilies are represented), while the Neotropical sites combined define the depth of clades unique to this biogeographic region (unpublished). (2) Under the assumption that a more uniform sampling of the tree along the root-to-tip axis can improve the estimates of character variation and avoid long branches (Bergsten, 2005), sampling sites need to be chosen to represent the taxonomically most distinct sets, e.g., by selecting biogeographically or ecologically distant sites. Thus the taxonomic process is then starting at a state that is comparable to taxon selection, that is, where phylogenetic knowledge is directed toward targeted lineages, except here the sampling is for the sites most valuable for taxonomic gap filling. This can be complemented with a final taxon-based selection for isolated lineages that cannot be obtained by bulk sampling.
FIGURE 3
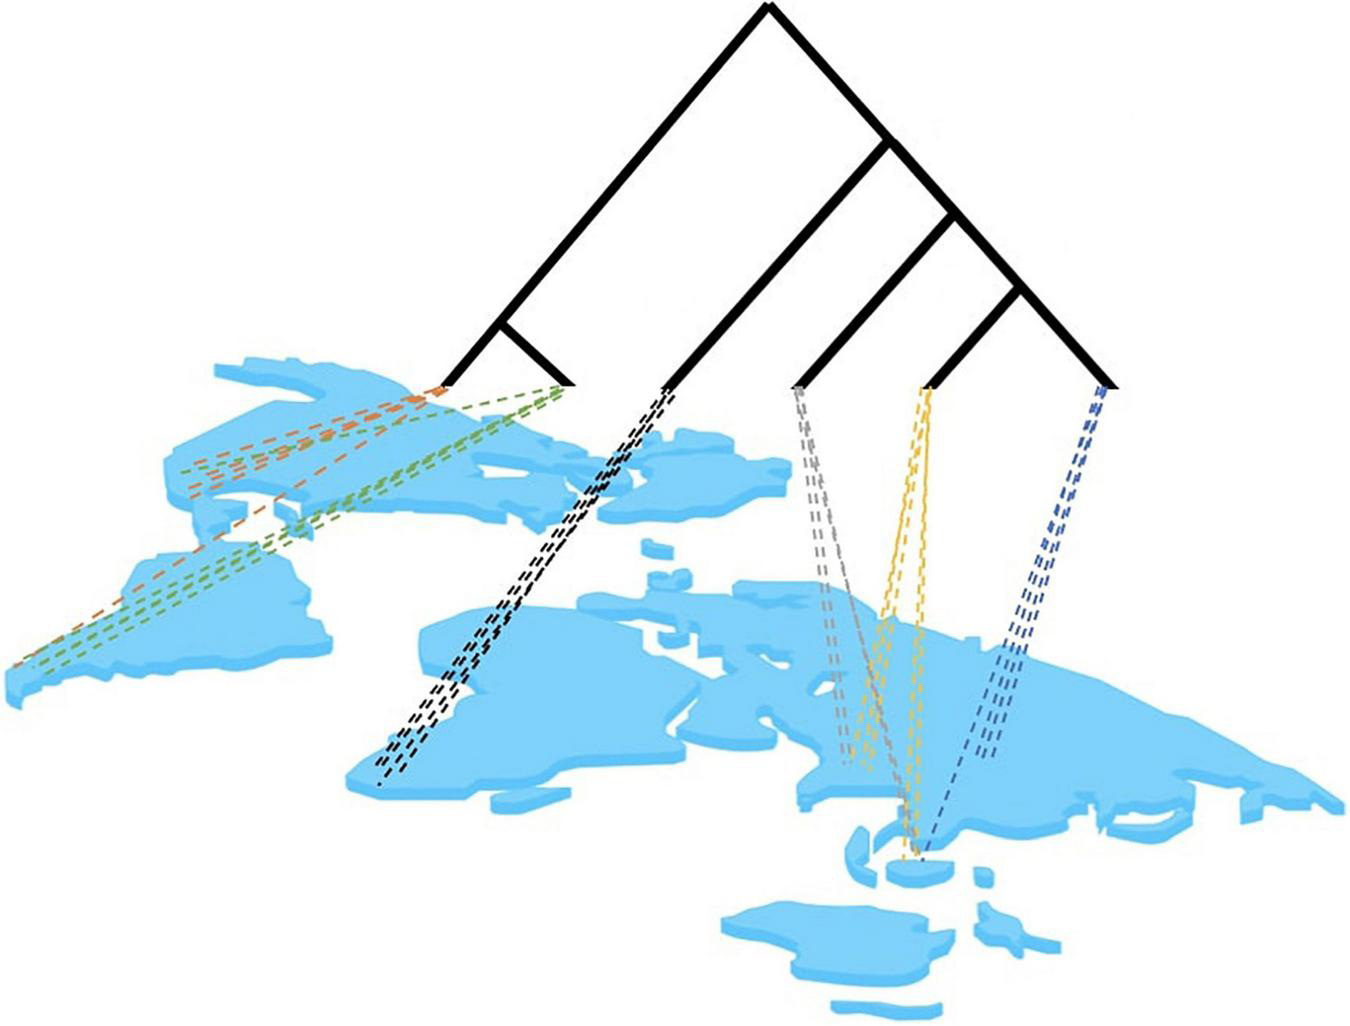
Hypothetical distribution of lineages in a multi-site analysis. Site-based sampling may only capture a certain proportion of the full tree, depending on the level of geographic structure of lineages and the geographic proximity of sampling sites. Colors represent closely related lineages. Note that particular lineages at any hierarchical level may be captured across multiple sites. This overlap can be expected to increase with closer biogeographic proximity of sampling sites and with deeper origin of lineages near the base of the tree.
The challenge of “incomplete” sampling for phylogenetics is actually a challenge of “uneven” sampling. Completeness is an impossible goal. Trees are fundamentally incomplete catalogs of (mostly) extant taxa as well as an incomplete record of branching events that have supposedly led to the taxa represented. A multitude of events permanently mar the shape or “completeness” of a tree, namely extinction dynamics and ecological coverage (Warnock et al., 2020). On the other hand, “evenness” in sampling can be tested and can be intuited as sampling that is randomly spaced out across the root-to-tip axis of the tree. Currently we know too little about the geographic distribution of phylogenetic lineages in most groups of insects to assess the error resulting from the unorthodox sampling. However, in at least one case it has been observed that site-based sampling of dung beetles (Scarabaeinae) from the Neotropical and Oriental regions do indeed capture a set similar to a random sub-selection of global scarabaeine lineage diversity available on GenBank, indicating that even minimal site-based sampling provides high lineage representation (Tansley, 2020).
The benefits of increasing the number of lineages (as opposed to the number of genes) has perhaps been dwarfed by colossal advances in sequencing throughput (Figure 4). Various studies conducted at around the turn of the last century have addressed the question of whether increased sampling in either sequence length or taxon count improves phylogenetic accuracy, using either simulation studies where the “true tree” is known (Graybeal, 1998; Pollock et al., 2002), or by subsampling increasingly larger subsets from a large starter set (Rosenberg and Kumar, 2001). These studies generally suggest that for a given total data matrix size, phylogenetic accuracy improved with the increase in taxa, and this increase was more rapid than with the same amount of data added to the sequence length per taxon. There are caveats to the conclusion about the benefits of adding more terminals: a certain minimum of sequence length for the added taxa is required to provide phylogenetic power, and accuracy did not improve as much if taxa are added near the tips rather than the base of the trees (Graybeal, 1998).
FIGURE 4
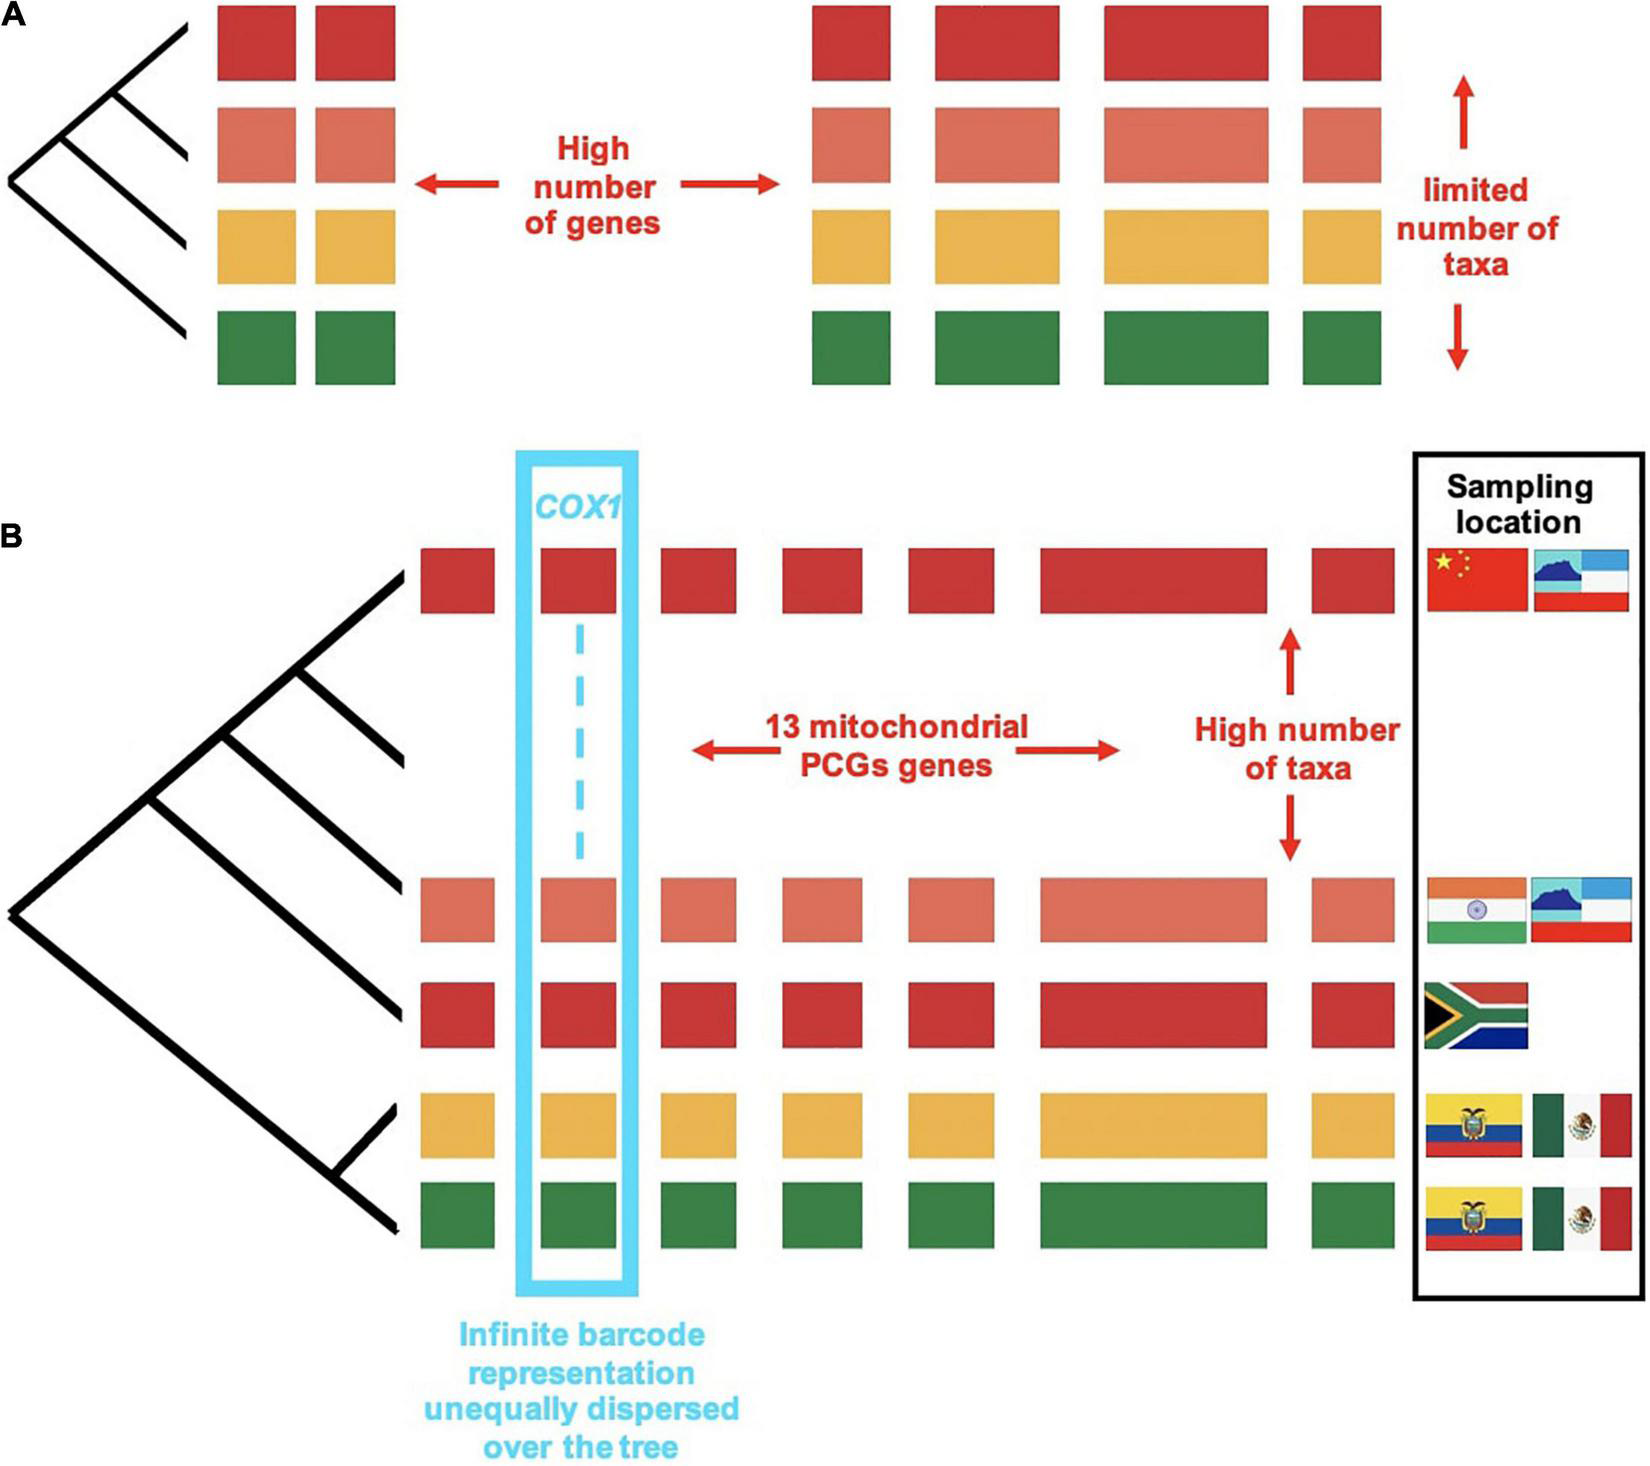
The trade-off between number of lineages and number of genes: (A) A set of taxa chosen for taxonomic purposes and sequenced for a large number of genes, e.g., nuclear orthologs from whole-genome or transcriptome sequencing. (B) The addition of site-based data for full mitogenomes resulting in 13 protein coding genes (PCGs) obtained by genome skimming, and the much larger number of taxa sequenced for the cox1 gene from metabarcoding. Colored blocks represent the individual genes sampled. Different colors represent the lineages sampled. Designing a sampling regime for phylogenetics is necessarily a balancing act between number of genes (blocks) and number of lineages (colors). The availability of cox1 metabarcodes represented in discontinuous lines (cyan) dwarfs all other data types.
To sum up the phylogenetic defensibility of the SITE-100 protocol: (1) The sampling design requires a clear image of the effect of sampling density to ensure between-site relief of LBA-related issues; (2) completeness is a catchall term where the relevance of “evenness” to avoidance of LBA is understated; and (3) the effects of increasing the number of terminals in a phylogenetic analysis is unpredictable and case-specific to the total amount of sequence data involved. It is inevitable that all studies are caught in a tradeoff between detail and scale (Barraclough and Nee, 2001). We take this chance to introduce site-based sampling as a haphazard but logistically efficient and long-game strategy to document the biodiversity of poorly known lineages on Earth.
Hierarchical Datasets
The product of combined nuclear, mitochondrial and metabarcode sequencing is a highly skewed matrix composed of a comparatively small number of nuclear genomes, an intermediate number of full mitogenomes, and a very large number of short metabarcode sequences (see Chesters, 2017). Thus, beyond taxon density, by sequencing a subset of individuals for whole or partial genomes, the database is effectively expanded along other axes of information that (1) contribute a greater number of characters for increased support and (2) are minimally affected by misleading phylogenetic signal. We distinguish four hierarchical levels that differ in scope of biological enquiry and depth of sequencing effort (Figure 4), commensurate with the four hierarchical levels of biological inquiry described in Figure 1. In this section we elaborate on this methodology in order to achieve the increasing scale of taxonomic coverage at each level.
First, nuclear genome data for taxonomically chosen key entries provide a scaffold for the “status-quo” (lineage-based) approach of inferring deep relationships among major groups. Nuclear datasets can be obtained via raw genome and transcriptome sequences such as the Genbank SRA database. A set of 2,000–4,000 universal orthologs can be extracted readily using the Benchmarking Universal Single-Copy Orthologs (BUSCO) (Simão et al., 2015; Waterhouse et al., 2018) pipeline to search for orthologs against an appropriate reference dataset, e.g., for Endopterygota (Waterhouse et al., 2018). Phylogenetic analyses require alignment of each ortholog, followed by concatenation and tree searches under partitioned maximum likelihood models or using multispecies coalescent models on the individual gene trees to address the effects of incomplete lineage sorting (ILS) (Zhang et al., 2018). These analyses can be performed under different missing-data ratios, e.g., creating matrices of 50, 75, and 90% completeness. LBA in these datasets can be partly ameliorated by conducting phylogenetic analyses at the amino acid level and using models incorporating differences in site frequencies (Wang et al., 2018). Tree searches at these scales are computationally intensive; for example, in our hands a matrix of 120 terminals of Coleoptera and 530,000 amino positions took nearly 5,000 CPU hours and this time increases quickly with greater taxon number (Ding, Y., unpublished).
Secondly, mitochondrial genomes greatly increase taxon coverage. Mitogenomes are small and compact in genomic architecture, with short intergenic regions, as does befit an autonomously replicating entity with replicatory signals under strict nuclear control. Unlike in the case of many nuclear genes, orthology is unequivocal for the 13 mitochondrial protein coding and 2 rRNA genes. Due to higher rates of variation compared to most nuclear protein coding regions, the mitochondrial genome lends itself well to systematic studies at intermediate levels of taxonomic classifications, addressing various taxonomic puzzles previously only considered by morphology alone (Rubinoff and Holland, 2005). Mitochondrial genomes lack recombination (all genes have the same history), which eliminates a potential source of character incongruence, but unfortunately also makes it impossible to recognize the effects of ILS when sequencing this marker alone. In addition, character evolution in mitogenomes is complex, and thus mis-specifications of the model and incorrect tree inference may be common. Tree inferences may be confounded by (1) heterogeneity in rate of nucleotide change, (2) heterogeneity in nucleotide composition among the terminals, and (3) multiple superimposed character changes due to elevated mutation rates (Song et al., 2016; Timmermans et al., 2016), which can only partially be ameliorated by parameter-rich (i.e., high-complexity) models of molecular evolution, e.g., using site-heterogeneous mixture models as those implemented in PhyloBayes (Lartillot and Philippe, 2004). Whole mitogenomes partly overcome specific idiosyncrasies of molecular evolution affecting each individual gene, in particular the cox1 barcoding marker showing unique features of variation, which confounds the trees (Pons et al., 2010). However, across the insect phylogeny and even at the order and family levels, heterogeneity of rates and composition lead to biases that affect the propensity for inferring deep relationships. To overcome these issues, mitogenome trees may be constructed with the nuclear tree as a backbone to resolve deep relationships. Combined with these nuclear data, in the balancing act between densely sampling for shorter sequences and frugally curating a select catalog of long sequences, the mitogenome datasets sits at the Goldilock zone as a core dataset in the effort to “complete” the Tree-of-Life by sequencing community samples from high-biodiversity sites.
Finally, we use barcodes and metabarcodes for representation at the tip of a stabilized tree, rather than for phylogenetic information (Min and Hickey, 2007). Barcodes and metabarcodes present a limited number of characters, which in addition are highly homoplastic. Foisting these short sequences over a mitogenomic tree is very different from how metabarcodes are normally used: for rapid phylogenetic placement of a sequence based on similarity searches against a reference database (usually GenBank or BOLD) using the Blast algorithm or k-mer based methods (Huson et al., 2007; Linard et al., 2019). It remains debatable if short metabarcodes alone are sufficient to determine phylogenetic position, in particular if trees are very big and numbers of taxa greatly exceed the number of characters (nucleotide positions), but longer full mitogenome sequences that match these metabarcodes could further validate phylogenetic placements. The generation of ASVs (i.e., we filter for genuine mitochondrial haplotypes) and the recovery of multiple individuals of a given species, potentially from multiple sites, allow us to ask further questions to do with phylogeography and population-level genetics.
Via the methodology outlined above, we harness both the phylogenetic informativeness of nuclear genome data and the easy accessibility of mitogenomes and metabarcodes. Topologies from the previous level constrain and provide scaffold for tree-building the next level down, allowing for the placement of unidentified, short sequences into the well-established phylogenetic tree (Chesters, 2017). The combined evidence of a hierarchical data set provides stability and phylogenetic power for tree-construction, given that the process of tree-construction accounts for the aforementioned problems relevant to each type of gene (for example the problem of ILS in nuclear genes, and heterogeneity in composition and high mutation rates for mitogenomes). This hierarchical approach scales up phylogenetic power and moves us a step closer to the approximation of the insect Tree-of-Life complete at the species level.
Conclusion
The previously separate endeavors of deciphering historical and present-day biodiversity patterns, broadly defined by macroevolution and macroecology, respectively, now present themselves as a unified challenge, enabled by large-scale DNA sequencing focused on a limited number of sites. The phylogenetic framework of biodiversity envisioned here is designed for the study of any poorly known, highly diverse group currently lacking in taxonomic representation. The effort of gathering the Earth’s biodiversity, community by community, has immense potential to contribute to phylogenetic inference, but equally this methodology endeavors to organize the sampling of the terrestrial biotas to establish the distribution of the world’s species, as part of efforts to match the biodiversity extinction crisis. Standardized repeatable field protocols give the structure for deep sampling across habitat strata, from soil to canopy. With recurring sampling and rapid metabarcoding to determine species presence/absence (and possibly abundance) at a site over time, the methodology allows for the truest sense of community dynamics at the clade level to emerge, which can then be applied to multiple sites worldwide and inform the Tree-of-Life in ways that lineage-based methodologies cannot.
The hybrid approach makes use of increased availability of genome data and mitogenomes, which solidify the base and middle portion of the tree, respectively, and the inclusion of metabarcodes will create minimal error as basal relationships are fixed. By sampling insect communities with this method, we can answer questions about evolution, ecological dynamics, biogeography, and others, on an unprecedented scale. This will further the close integration of community ecology and phylogenetics, in particular to understand the role of trait and niche diversity for community assembly and responses to environmental change (Choo et al., 2017; Merckx et al., 2015). There is a need to clearly integrate these efforts with the SITE-100 protocol, its logistical merits, the many ways in which it is unorthodox yet long-game, as well as the phylogenetic problems from which it is and isn’t exempt.
Publisher’s Note
All claims expressed in this article are solely those of the authors and do not necessarily represent those of their affiliated organizations, or those of the publisher, the editors and the reviewers. Any product that may be evaluated in this article, or claim that may be made by its manufacturer, is not guaranteed or endorsed by the publisher.
Statements
Author contributions
XB, BG, HL, and AV conceived the study and wrote the manuscript. All authors contributed to the article and approved the submitted version.
Funding
Funding was provided by the NHM Biodiversity Initiative and the NERC ARBOLES grant.
Acknowledgments
We thank Yin-huan Ding (Nanjing Agricultural University), Michael Tansley (Imperial College London), and Rui-e Nie (Chinese Academy of Sciences) for access to preliminary studies discussed in this text and to members of the Vogler lab (2020–2021) for participation in relevant discussions. We are grateful to our reviewers for helpful comments and improvements to the text.
Conflict of interest
APV is a co-founder and scientific advisor of NatureMetrics, a company providing commercial services for DNA-based biomonitoring. The remaining authors declare that the research was conducted in the absence of any commercial or financial relationships that could be construed as a potential conflict of interest.
Footnotes
References
1
ArribasP.AndújarC.BidartondoM. I.BohmannK.CoissacÉ.CreerS.et al (2021). Connecting high-throughput biodiversity inventories: opportunities for a site-based genomic framework for global integration and synthesis.Mol. Ecol.301120–1135. 10.1111/mec.15797
2
BarracloughT. G.NeeS. (2001). Phylogenetics and speciation.Trends Ecol. Evol.16391–399. 10.1016/s0169-5347(01)02161-9
3
BergstenJ. (2005). A review of long-branch attraction.Cladistics21163–193. 10.1111/j.1096-0031.2005.00059.x
4
BocakL.KundrataR.FernándezC. A.VoglerA. P. (2016). The discovery of Iberobaeniidae (Coleoptera: Elateroidea): a new family of beetles from Spain, with immatures detected by environmental DNA sequencing.Proc. R. Soc.283:20152350. 10.1098/rspb.2015.2350
5
BreeschotenT.DoorenweerdC.TarasovS.VoglerA. P. (2016). Phylogenetics and biogeography of the dung beetle genus Onthophagus inferred from mitochondrial genomes.Mol. Phylogen. Evol.10586–95. 10.1016/j.ympev.2016.08.016
6
Cavender-BaresJ.KozakK. H.FineP. V. A.KembelS. W. (2009). The merging of community ecology and phylogenetic biology.Ecol. Lett.12693–715. 10.1111/j.1461-0248.2009.01314.x
7
ChestersD. (2017). Construction of a species-level Tree of Life for the insects and utility in taxonomic profiling.Syst. Biol.66426–439. 10.1093/sysbio/syw099
8
ChooL. Q.Crampton-PlattA.VoglerA. P. (2017). Shotgun mitogenomics across body size classes in a local assemblage of tropical Diptera: Phylogeny, species diversity and mitochondrial abundance spectrum.Mol. Ecol.265086–5098. 10.1111/mec.14258
9
Crampton-PlattA.YuD. W.ZhouX.VoglerA. P. (2016). Mitochondrial metagenomics: letting the genes out of the bottle.Gigascience5:15. 10.1186/s13742-016-0120-y
10
CreedyT. J.AndújarC.MeramveliotakisE.NogueralesV.OvercastI.PapadopoulouA.et al (2022). Coming of age for COI metabarcoding of whole organism community DNA: towards bioinformatic harmonisation.Mol. Ecol. Resour.22847–861. 10.1111/1755-0998.13502
11
CreedyT. J.NormanH.TangC. Q.ChinK. Q.AndujarC.ArribasP.et al (2019). A validated workflow for rapid taxonomic assignment and monitoring of a national fauna of bees (Apiformes) using high throughput DNA barcoding.Mol. Ecol. Resour.2040–53. 10.1111/1755-0998.13056
12
DaviesN.FieldD.Amaral-ZettlerL.ClarkM. S.DeckJ.DrummondA.et al (2014). The founding charter of the Genomic Observatories Network.Gigascience3:2. 10.1186/2047-217X-3-2
13
DeSalleR.GoldsteinP. Z. (2019). Review and interpretation of trends in DNA barcoding.Front. Ecol. Evol.7:302. 10.3389/fevo.2019.00302
14
DirzoR.RavenP. H. (2003). Global state of biodiversity and loss.Annu. Rev. Env. Resour.28137–167. 10.1146/annurev.energy.28.050302.105532
15
FeronR.WaterhouseR. M. (2021). Assessing species coverage and assembly quality of rapidly accumulating sequenced genomes.bioRxiv [Preprint]. 10.1101/2021.10.15.464561
16
FolkR. A.KatesH. R.LaFranceR.SoltisD. E.SoltisP. S.GuralnickR. P. (2021). High-throughput methods for efficiently building massive phylogenies from natural history collections.Appl. Plant. Sci.9:e11410. 10.1002/aps3.11410
17
FontaineB.PerrardA.BouchetP. (2012). Twenty-one years of shelf life between discovery and description of new species.Curr. Biol.22943–944. 10.1016/j.cub.2012.10.029
18
Gómez-RodríguezC.Crampton-PlattA.TimmermansM. J. T. N.BaselgaA.VoglerA. P. (2017). Intraspecific genetic variation in complex assemblages from mitochondrial metagenomics: comparison with DNA barcodes.Methods Ecol. Evol.8248–256. 10.1111/2041-210x.12667
19
GrandcolasP.PellensR. (2016). Biodiversity Conservation and Phylogenetic Systematics: Preserving Our Evolutionary Heritage in An Extinction Crisis, 1st Edn. New York, NY: Springer. 10.1007/978-3-319-22461-9
20
GraybealA. (1998). Is it better to add taxa or characters to a difficult phylogenetic problem?Syst. Biol.479–17. 10.1080/106351598260996
21
HebertP. D.CywinskaA.BallS. L.deWaardJ. R. (2003). Biological identifications through DNA barcodes.Proc. Biol. Sci.270313–321. 10.1098/rspb.2002.2218
22
HinchliffC. E.SmithS. A.AllmanJ. F.BurleighJ. G.ChaudharyR.CoghillL. M.et al (2015). Synthesis of phylogeny and taxonomy into a comprehensive tree of life.Proc. Natl. Acad. Sci. U.S.A.11212764–12769. 10.1073/pnas.1423041112
23
HudsonL. N.BlagoderovV.HeatonA.HoltzhausenP.LivermoreL.PriceB. W.et al (2015). Inselect: automating the digitization of natural history collections.PLoS One10:e0143402. 10.1371/journal.pone.0143402
24
HusonD. H.AuchA. F.QiJ.SchusterS. C. (2007). MEGAN analysis of metagenomic data.Genome Res.17377–386. 10.1101/gr.5969107
25
JiY.AshtonL.PedleyS. M.EdwardsD. P.TangY.NakamuraA.et al (2013). Reliable, verifiable and efficient monitoring of biodiversity via metabarcoding.Ecol. Lett.161245–1257. 10.1111/ele.12162
26
LairdS.WynbergR.RourkeM.HumphriesF.MullerM. R.LawsonC. (2020). Rethink the expansion of access and benefit sharing.Science3671200–1202. 10.1126/science.aba9609
27
LarsenB. B.MillerE. C.RhodesM. K.WiensJ. J. (2017). Inordinate fondness multiplied and redistributed: the number of species on earth and the new pie of life.Q. Rev. Biol.92229–265. 10.1086/693564
28
LartillotN.PhilippeH. (2004). A Bayesian mixture model for across-site heterogeneities in the amino-acid replacement process.Mol. Biol. Evol.211095–1109. 10.1093/molbev/msh112
29
LewinH. A.RobinsonG. E.KressW. J.BakerW. J.CoddingtonJ.CrandallK. A.et al (2018). Earth BioGenome Project: sequencing life for the future of life.Proc. Natl. Acad. Sci. U.S.A.1154325–4333. 10.1073/pnas.1720115115
30
LinardB.SwensonK.PardiF. (2019). Rapid alignment-free phylogenetic identification of metagenomic sequences.Bioinformatics353303–3312. 10.1093/bioinformatics/btz068
31
LipscombD.PlatnickN. I.WheelerQ. (2003). The Intellectual content of taxonomy: a comment on DNA taxonomy.Trends Ecol. Evol.1865–66. 10.1016/S0169-5347(02)00060-5
32
LososJ. B. (1996). Phylogenetic perspectives on community ecology.Ecology771344–1354. 10.2307/2265532
33
McKennaD. D.ShinS.AhrensD.BalkeM.Beza-BezaC.ClarkeD. J.et al (2019). The evolution and genomic basis of beetle diversity.Proc. Natl. Acad. Sci. U.S.A.11624729–24737. 10.1073/pnas.1909655116
34
MerckxV. S.HendriksK. P.BeentjesK. K.MennesC. B.BeckingL. E.PeijnenburgK. T.et al (2015). Evolution of endemism on a young tropical mountain.Nature524347–350. 10.1111/zsc.12501
35
MinX. J.HickeyD. A. (2007). Assessing the effect of varying sequence length on DNA barcoding of fungi.Mol. Ecol. Notes7365–373. 10.1111/j.1471-8286.2007.01698.x
36
MoraC.TittensorD. P.AdlS.SimpsonA. G.WormB. (2011). How many species are there on Earth and in the ocean?PLoS Biol.9:e1001127. 10.1371/journal.pbio.1001127
37
OlsonD. M.DinersteinE.WikramanayakeE. D.BurgessN. D.PowellG. V. N.UnderwoodE. C.et al (2001). Terrestrial ecoregions of the world: a new map of life on earth: a new global map of terrestrial ecoregions provides an innovative tool for conserving biodiversity.Bioscience51933–938. 10.1641/0006-3568(2001)051[0933:teotwa]2.0.co;2
38
PapadopoulouA.TaberletP.ZingerL. (2015). Metagenome skimming for phylogenetic community ecology: a new era in biodiversity research.Mol. Ecol.243515–3517. 10.1111/mec.13263
39
PollockD. D.ZwicklD. J.McGuireJ. A.HillisD. M. (2002). Increased taxon sampling is advantageous for phylogenetic inference.Syst. Biol.51664–671. 10.1080/10635150290102357
40
PonsJ.RiberaI.BertranpetitJ.BalkeM. (2010). Nucleotide substitution rates for the full set of mitochondrial protein-coding genes in Coleoptera.Mol. Phylogenet. Evol.56796–807. 10.1016/j.ympev.2010.02.007
41
QuickeD. L.SmithM. A.JanzenD. H.HallwachsW.Fernandez-TrianaJ.LaurenneN. M.et al (2012). Utility of the DNA barcoding gene fragment for parasitic wasp phylogeny (Hymenoptera: Ichneumonoidea): data release and new measure of taxonomic congruence.Mol. Ecol. Resour.12676–685. 10.1111/j.1755-0998.2012.03143.x
42
ReesJ. A.CranstonK. (2017). Automated assembly of a reference taxonomy for phylogenetic data synthesis.Biodivers. Data J.5:e12581. 10.3897/BDJ.5.e12581
43
RobinsonG. E.HacketK. J.Purcell-MiramontesM.BrownS. J.EvansJ. D.GoldsmithM. R.et al (2011). Creating a buzz about insect genomes.Science331:1386. 10.1126/science.331.6023.1386
44
RognesT.FlouriT.NicholsB.QuinceC.MahéF. (2016). VSEARCH: a versatile open source tool for metagenomics.PeerJ4:e2584. 10.7717/peerj.2584
45
RosenbergM. S.KumarS. (2001). Incomplete taxon sampling is not a problem for phylogenetic inference.Proc. Natl. Acad. Sci. U.S.A.9810751–10756. 10.1073/pnas.191248498
46
RubinoffD.HollandB. S. (2005). Between two extremes: mitochondrial DNA is neither the panacea nor the nemesis of phylogenetic and taxonomic inference.Syst. Biol.54952–961. 10.1080/10635150500234674
47
SimãoF. A.WaterhouseR. M.IoannidisP.KriventsevaE. V.ZdobnovE. M. (2015). BUSCO: assessing genome assembly and annotation completeness with single-copy orthologs.Bioinformatics313210–3212. 10.1093/bioinformatics/btv351
48
SongF.LiH.JiangP.ZhouX.LiuJ.SunC.et al (2016). Capturing the phylogeny of Holometabola with mitochondrial genome data and Bayesian site-heterogeneous mixture models.Genome Biol. Evol.81411–1426. 10.1093/gbe/evw086
49
SrivathsanA.LeeL.KatohK.HartopE.KuttyS.WongJ.et al (2021). ONTbarcoder and MinION barcodes aid biodiversity discovery and identification by everyone, for everyone.BMC Biol.19:217. 10.5281/zenodo.5115258
50
TansleyM. (2020). A Site-Based Phylogenetic Analysis and Biogeographic Reconstruction of the Dung Beetles (Scarabaeinae).Master’s thesis.London: Imperial College London.
51
TautzD.ArctanderP.MinelliA.ThomasR. H.VoglerA. P. (2003). A plea for DNA taxonomy.Trends Ecol. Evol.1871–74. 10.1016/S0169-5347(02)00041-1
52
TimmermansM. J. T. N.BartonC.HaranJ.AhrensD.CulverwellL.OllikainenA.et al (2016). Family-level sampling of mitochondrial genomes in Coleoptera: compositional heterogeneity and phylogenetics.Genome Biol. Evol.8161–175. 10.1093/gbe/evv241
53
VoglerA. P.MonaghanM. T. (2007). Recent advances in DNA taxonomy.J. Zool. Syst. Evol. Res.451–10. 10.1111/j.1439-0469.2006.00384.x
54
WangH. C.MinhB. Q.SuskoE.RogerA. J. (2018). Modeling site heterogeneity with posterior mean site frequency profiles accelerates accurate phylogenomic estimation.Syst. Biol.67216–235. 10.1093/sysbio/syx068
55
WarnockR. C. M.HeathT. A.StadlerT. (2020). Assessing the impact of incomplete species sampling on estimates of speciation and extinction rates.Paleobiology46137–157. 10.1017/pab.2020.12
56
WaterhouseR. M.SeppeyM.SimãoF. A.ManniM.IoannidisP.KlioutchnikovG.et al (2018). BUSCO Applications from quality assessments to gene prediction and phylogenomics.Mol. Biol. Evol.353543–548. 10.1093/molbev/msx319
57
WebbC. O.AckerlyD. D.McPeekM. A.DonoghueM. J. (2002). Phylogenies and community ecology.Annu. Rev. Ecol. Syst.33475–505. 10.1146/annurev.ecolsys.33.010802.150448
58
WiemersM.FiedlerK. (2007). Does the DNA barcoding gap exist? - A case study in blue butterflies (Lepidoptera: Lycaenidae).Front. Zool.4:8. 10.1186/1742-9994-4-8
59
WileyE. O.LiebermanB. S. (2011). Phylogenetics: Theory and Practice of Phylogenetic Systematics, 2nd Edn. Hoboken, NJ: Wiley and Black.
60
ZamaniA.VahteraV.SääksjärviI. E.ScherzM. D. (2021). The omission of critical data in the pursuit of ‘revolutionary’ methods to accelerate the description of species.Syst. Entomol.461–4. 10.1111/syen.12444
61
ZhangC.RabieeM.SayyariE.MirarabS. (2018). ASTRAL-III: polynomial time species tree reconstruction from partially resolved gene trees.BMC Bioinformatics19(Suppl.6):153. 10.1186/s12859-018-2129-y
62
ZhouX.LiY.LiuS.YangQ.SuX.ZhouL.et al (2013). Ultra-deep sequencing enables high-fidelity recovery of biodiversity for bulk arthropod samples without PCR amplification.Gigascience16:2047. 10.1186/2047-217X-2-4
Appendix 1
- 1.
Field work protocol
- a.
SITE-100 employs standardized site-based sampling, using a set of trapping methods and trap type replication, for example 1 month sampling of pitfall traps collected from every 2 days is employed on one site, e.g., a one hectare plot, or, to cover as many kinds of habitat as possible within a given site, or to focus on collections for community studies, such as canopy fogging transects;
- b.
At a minimum each site is sampled with a standardized number of traps, including flight interception traps (FIT), pitfall trap, malaise trap (MT); in addition, other sampling types are used, including sweeping, light trapping, canopy fogging, suspended land and air malaise (SLAM), Berlese traps, etc. These methods are replicated through time, e.g., 1 month of trap collection every 2 days;
- c.
Specimen preservation: specimens should be labeled as per each trapping method and dated, and then transferred to 96% ethanol as quickly as possible, and stored at –20 C until further processing.
- a.
- 2.
Specimen processing
- a.
All specimens are imaged by SLR camera (Canon EOS 650D) and/or Zeiss Axio Zoom.v16 motorized stereo zoom microscope;
- b.
Morphospecies are selected through the images by Inselect software (Hudson et al., 2015).
- c.
Morphospecies are extracted individually and non-destructively using DNeasy 96 Blood and Tissue Kit (Qiagen, Venlo, Netherlands) and sequenced by shotgun sequencing NGS to obtain mitogenomes of morphospecies;
- d.
Bulk samples are extracted non-destructively using the same kit as morphospecies extraction, and amplified for metabarcoding (418 bp portion of the cox1 region) and sequenced by Illumina MiSeq v.3 (2 × 300 bp paired−end). Mi-seq.
- a.
- 3.
Data processing
- a.
Raw sequence data are processed through the pipeline [demultiplexing—trimming—merging—quality, size, frequency, and chimera filtered through NAPtime (Creedy et al., 2019, 2022) and VSEARCH (Rognes et al., 2016)]. This pipeline generates the ASVs which are then clustered to obtain metabarcodes (OTUs);
- b.
Phylogeny reconstruction by hierarchical datasets;
- c.
Metabarcodes placement on the phylogeny.
- a.
Summary
Keywords
metagenomics, Tree-of-Life, biodiversity, communities, phylogenetics
Citation
Bian X, Garner BH, Liu H and Vogler AP (2022) The SITE-100 Project: Site-Based Biodiversity Genomics for Species Discovery, Community Ecology, and a Global Tree-of-Life. Front. Ecol. Evol. 10:787560. doi: 10.3389/fevo.2022.787560
Received
30 September 2021
Accepted
10 January 2022
Published
19 April 2022
Volume
10 - 2022
Edited by
Xin Zhou, China Agricultural University, China
Reviewed by
Miquel A. Arnedo, University of Barcelona, Spain; Haw Chuan Lim, George Mason University, United States
Updates
Copyright
© 2022 Bian, Garner, Liu and Vogler.
This is an open-access article distributed under the terms of the Creative Commons Attribution License (CC BY). The use, distribution or reproduction in other forums is permitted, provided the original author(s) and the copyright owner(s) are credited and that the original publication in this journal is cited, in accordance with accepted academic practice. No use, distribution or reproduction is permitted which does not comply with these terms.
*Correspondence: Alfried P. Vogler, a.vogler@imperial.ac.uk
This article was submitted to Biogeography and Macroecology, a section of the journal Frontiers in Ecology and Evolution
Disclaimer
All claims expressed in this article are solely those of the authors and do not necessarily represent those of their affiliated organizations, or those of the publisher, the editors and the reviewers. Any product that may be evaluated in this article or claim that may be made by its manufacturer is not guaranteed or endorsed by the publisher.