 Sandra Müller
 Oliver Mitesser
 Linda Oschwald1
- 1Department of Geobotany, Faculty of Biology, University of Freiburg, Freiburg, Germany
- 2Field Station Fabrikschleichach, Animal Ecology and Tropical Biology, Biocenter, University of Würzburg, Rauhenebrach, Germany
- 3Neotropical Ecology Lab, Department of Biology, Smithsonian Tropical Research Institute, McGill University, Montreal, QC, Canada
In this ecoacoustic study we used the setting of a tropical tree diversity planted forest to analyze temporal patterns in the composition of soundscapes and to test the effects of tree species richness on associated biodiversity measured as acoustic diversity. The analysis of soundscapes offers easy, rapid and sustainable methods when assessing biodiversity. During the last years the quantification of regional or global acoustic variability in sounds and the analysis of different soundscapes has been evolving into an important tool for biodiversity conservation, especially since case studies confirmed a relationship between land-use management, forest structure and acoustic diversity. Here we analyzed soundscapes from two seasons (dry and rainy season) and aurally inspected a subset of audio recordings to describe temporal patterns in soundscape composition. Several acoustic indices were calculated and we performed a correlation analysis and a non-metric multidimensional scaling analysis to identify acoustic indices that: (i) were complementary to each other and such represented different aspects of the local soundscapes and (ii) related most strongly to differences in acoustic composition among tree species richness, season and day phase. Thus, we chose “High Frequency Cover,” “Bioacoustic Index,” and “Events Per Second” to test the hypothesis that acoustic diversity increases with increasing tree species richness. Monocultures differed significantly from polycultures during night recordings, with respect to High Frequency Cover. This index covers sounds above 8 kHz and thus represents part of the orthopteran community. We conclude that increasing tree species richness in a young tropical forest plantation had positive effects on the vocalizing communities. The strongest effects were found for acoustic activity of the orthopteran community. In contrast to birds, orthopterans have smaller home ranges, and are therefore important indicator species for small scale environmental conditions.
Introduction
Habitat loss, agricultural activities, global warming and the introduction of exotic species lead to massive decreases of biodiversity all over the world (Sala et al., 2000; Cardinale et al., 2012; IPBES, 2019b). With habitat loss being a major driver of species loss and deforestation still increasing dramatically in the tropics (Brooks et al., 2002; IPBES, 2019a), afforestation is an important and widely used tool for restoring ecosystems and mitigating climate change. Although evidence shows that tree species mixtures can improve multi-functionality in forest (van der Plas et al., 2016, 2017), particularly forest productivity and Carbon storage (Potvin and Gotelli, 2008; Potvin et al., 2011; Ammer, 2019; Guillemot et al., 2020), most areas pledged for afforestation are currently set to become monocultures (Lewis et al., 2019). Monocultures are likely less suited than natural secondary forests or mixed-species plantations for promoting and restoring associated biodiversity (Perfecto et al., 1997; Ampoorter et al., 2020). Increasing tree species richness in plantations might have multiple consequences for the associated fauna, by providing a broader range of food sources for both generalists and specialists herbivores, which could scale up to higher trophic levels (Brose, 2003; Potts et al., 2003; Castagneyrol and Jactel, 2012; Pekin et al., 2012; Ebeling et al., 2018). Additionally, changes in tree species richness has consequences for microclimatic conditions that could affect both diversity and abundance of the animal communities as well as temporal activity patterns (Walker, 1975a,b; Akutsu et al., 2007; Checa et al., 2014; Kunz et al., 2019; Campos-Cerqueira et al., 2020; Burivalova et al., 2021).
Biodiversity assessments in species rich tropical regions are time and resource consuming. This is particularly true for arthropods, as species identification for arthropods can take years and demand expert knowledge in taxonomy. But also for well-known taxonomic groups such as birds sampling is time, money and labor intensive. During the last decade passive acoustic monitoring and ecoacoustic methods have been proven a useful and rapidly expanding tool for fast detection of biodiversity trends, especially in response to land-use change (Burivalova et al., 2018, 2019, 2021). Acoustic surveys do have the advantages of being rapid, sensitive to multiple taxa, non-invasive and easy to apply over large areas and long term periods simultaneously at multiple locations (Sueur et al., 2008). Soundscapes are driven by the composition of different vocalizing communities and thus follow their respective vocal activity patterns resulting in specific diurnal and seasonal soundscapes patterns. However, for tropical habitats, little is known about such acoustic temporal patterns, as most ecoacoustic studies so far have focused on temperate regions (Scarpelli et al., 2020). The majority of tropical ecoacoustic studies focused on diurnal patterns indicate that insects dominate most of the diurnal soundscape, leaving a rather small “empty” acoustic niche for birds at dawn and dusk (Aide et al., 2017). In mature tropical forests these dawn and dusk periods result in an overall soundscape saturation peak, with soundscape saturation being defined as the proportion of active acoustic frequency bins within a recording (Burivalova et al., 2018). Much less is known on seasonal acoustic trends in the tropics, which likely relate to changes in precipitation and humidity, often driven by the alternation of dry and rainy seasons (Rankin and Axel, 2017; Opaev et al., 2021). Additionally, some studies indicate that disturbances and changes in microclimate might interact with the diurnal and seasonal (acoustic) activity patterns of the tropical fauna (Akutsu et al., 2007; Checa et al., 2014; Campos-Cerqueira et al., 2020; Burivalova et al., 2021; Fontúrbel et al., 2021).
Phenological acoustic activity patterns can be studied by the application of ecoacoustic methods and its large variety of acoustic indices that have been developed so far (Sueur et al., 2014; Eldridge et al., 2018; Oliveira et al., 2021). In the past, these indices have been successfully used as proxies for various aspects of ecosystem biodiversity and as tools for conservation (Sueur et al., 2008; Pekin et al., 2012; Fuller et al., 2015; Buxton et al., 2016, 2018; Mammides et al., 2017; Burivalova et al., 2018; Gasc et al., 2018; Turner et al., 2018; Shaw et al., 2021). These findings suggest that habitat heterogeneity positively affects acoustic diversity and thus also species richness, at least for vocalizing taxonomic groups. Habitat gradients that were tested in previous ecoacoustic studies were sometimes substantial. Dröge et al. (2021) for example confirmed good relationships between acoustic indices and land-use types, testing a gradient from rice paddies to old growth forests. In the present study we wanted to test how changing a single habitat parameter, that is tree species richness, effects the acoustic composition and temporal dynamic of the acoustic community during the diurnal cycle in both the dry and wet seasons. Experimental plantations are an ideal platform for testing such a question as all other environmental variables can be kept rather constant. This research took advantage of the Sardinilla planted forest, set up in Panama in 2001 to study the effects of tree species richness on ecosystem functions (Scherer-Lorenzen et al., 2005). Here we performed acoustic monitoring in plots with different tree species richness ranging from monocultures to five-species polycultures to test our hypothesis that acoustic diversity increases with increasing tree richness. Based on previous studies highlighting the dominance of insects in tropical soundscapes and given the small size of the research plots we further hypothesized that particularly orthopteran vocalizations should increase with increasing tree species richness (Aide et al., 2017; Campos-Cerqueira et al., 2020).
Above and beyond testing the effect of tree species richness on acoustic diversity, our objectives were to examine how tree species richness effected acoustic patterns through different seasons and day phases and which acoustic indices can be used to capture complementary acoustic patterns.
Materials and Methods
Study Site
The Sardinilla planted forest is part of the global research network TreeDivNet, which aims to quantify the relation between tree species richness and ecosystem functioning (Paquette et al., 2018). The experimental site of Sardinilla is located in the central north of Panama (9°19′30″N, 79°38′00″W) at an altitude of 70 m. The area’s original forest was logged in the early 1950’s. After 2 years of agriculture, land-use turned into pasture. The total experimental area covers approximately nine hectares (Scherer-Lorenzen et al., 2007).
The tree plantation included six native tree species that form a gradient from fast-growing pioneers to slow long-lived tree species. Planted fast-growing species were Cordia alliodora [(Ruiz and Pav.) Oken] and Luehea seemannii (Triana and Planch.), whereas intermediate-growing species were Anacardium excelsum [(Bertero and Balb. ex Kunth) Skeels] and Hura crepitans (L.). Cedrela odorata (L.) and Tabebuia rosea [(Bertol.) Bertero ex A.DC.] were chosen as slow-growing tree species. In total, there were 24 plots of 45 m by 45 m consisting of twelve monoculture plots (two per species), six three-species mixtures (one per growth rate category) and six identical six-species plots (Potvin and Gotelli, 2008). One tree species, Cordia alliodora, failed to establish. We thus considered the realized species richness (5, 3, 2, and 1) rather than the original richness (6-3-1) (Figure 1). In 2017, after 16 years of growth, a data collection campaign took place during which we set up automatic recording devices to monitor acoustic diversity. The recording period ranged from 30 March 2017 to 11 June 2017, covering parts of the dry and the rainy season. The dry season in Sardinilla lasts from end of December to April followed by 8 months of rainy season, which is reflected in monthly precipitation sums of Sardinilla ranging from 48 to 70 mm in March over 115–142 mm in April up to 306–344 mm in May and 290–339 mm in June 2017 (Hydrometeorology Management of ETESA, 2017). Days were differentiated into four phases: dawn (05:30–09:00), day (09:10–15:50), dusk (16:00–19:30) and night (19:40–05:20).
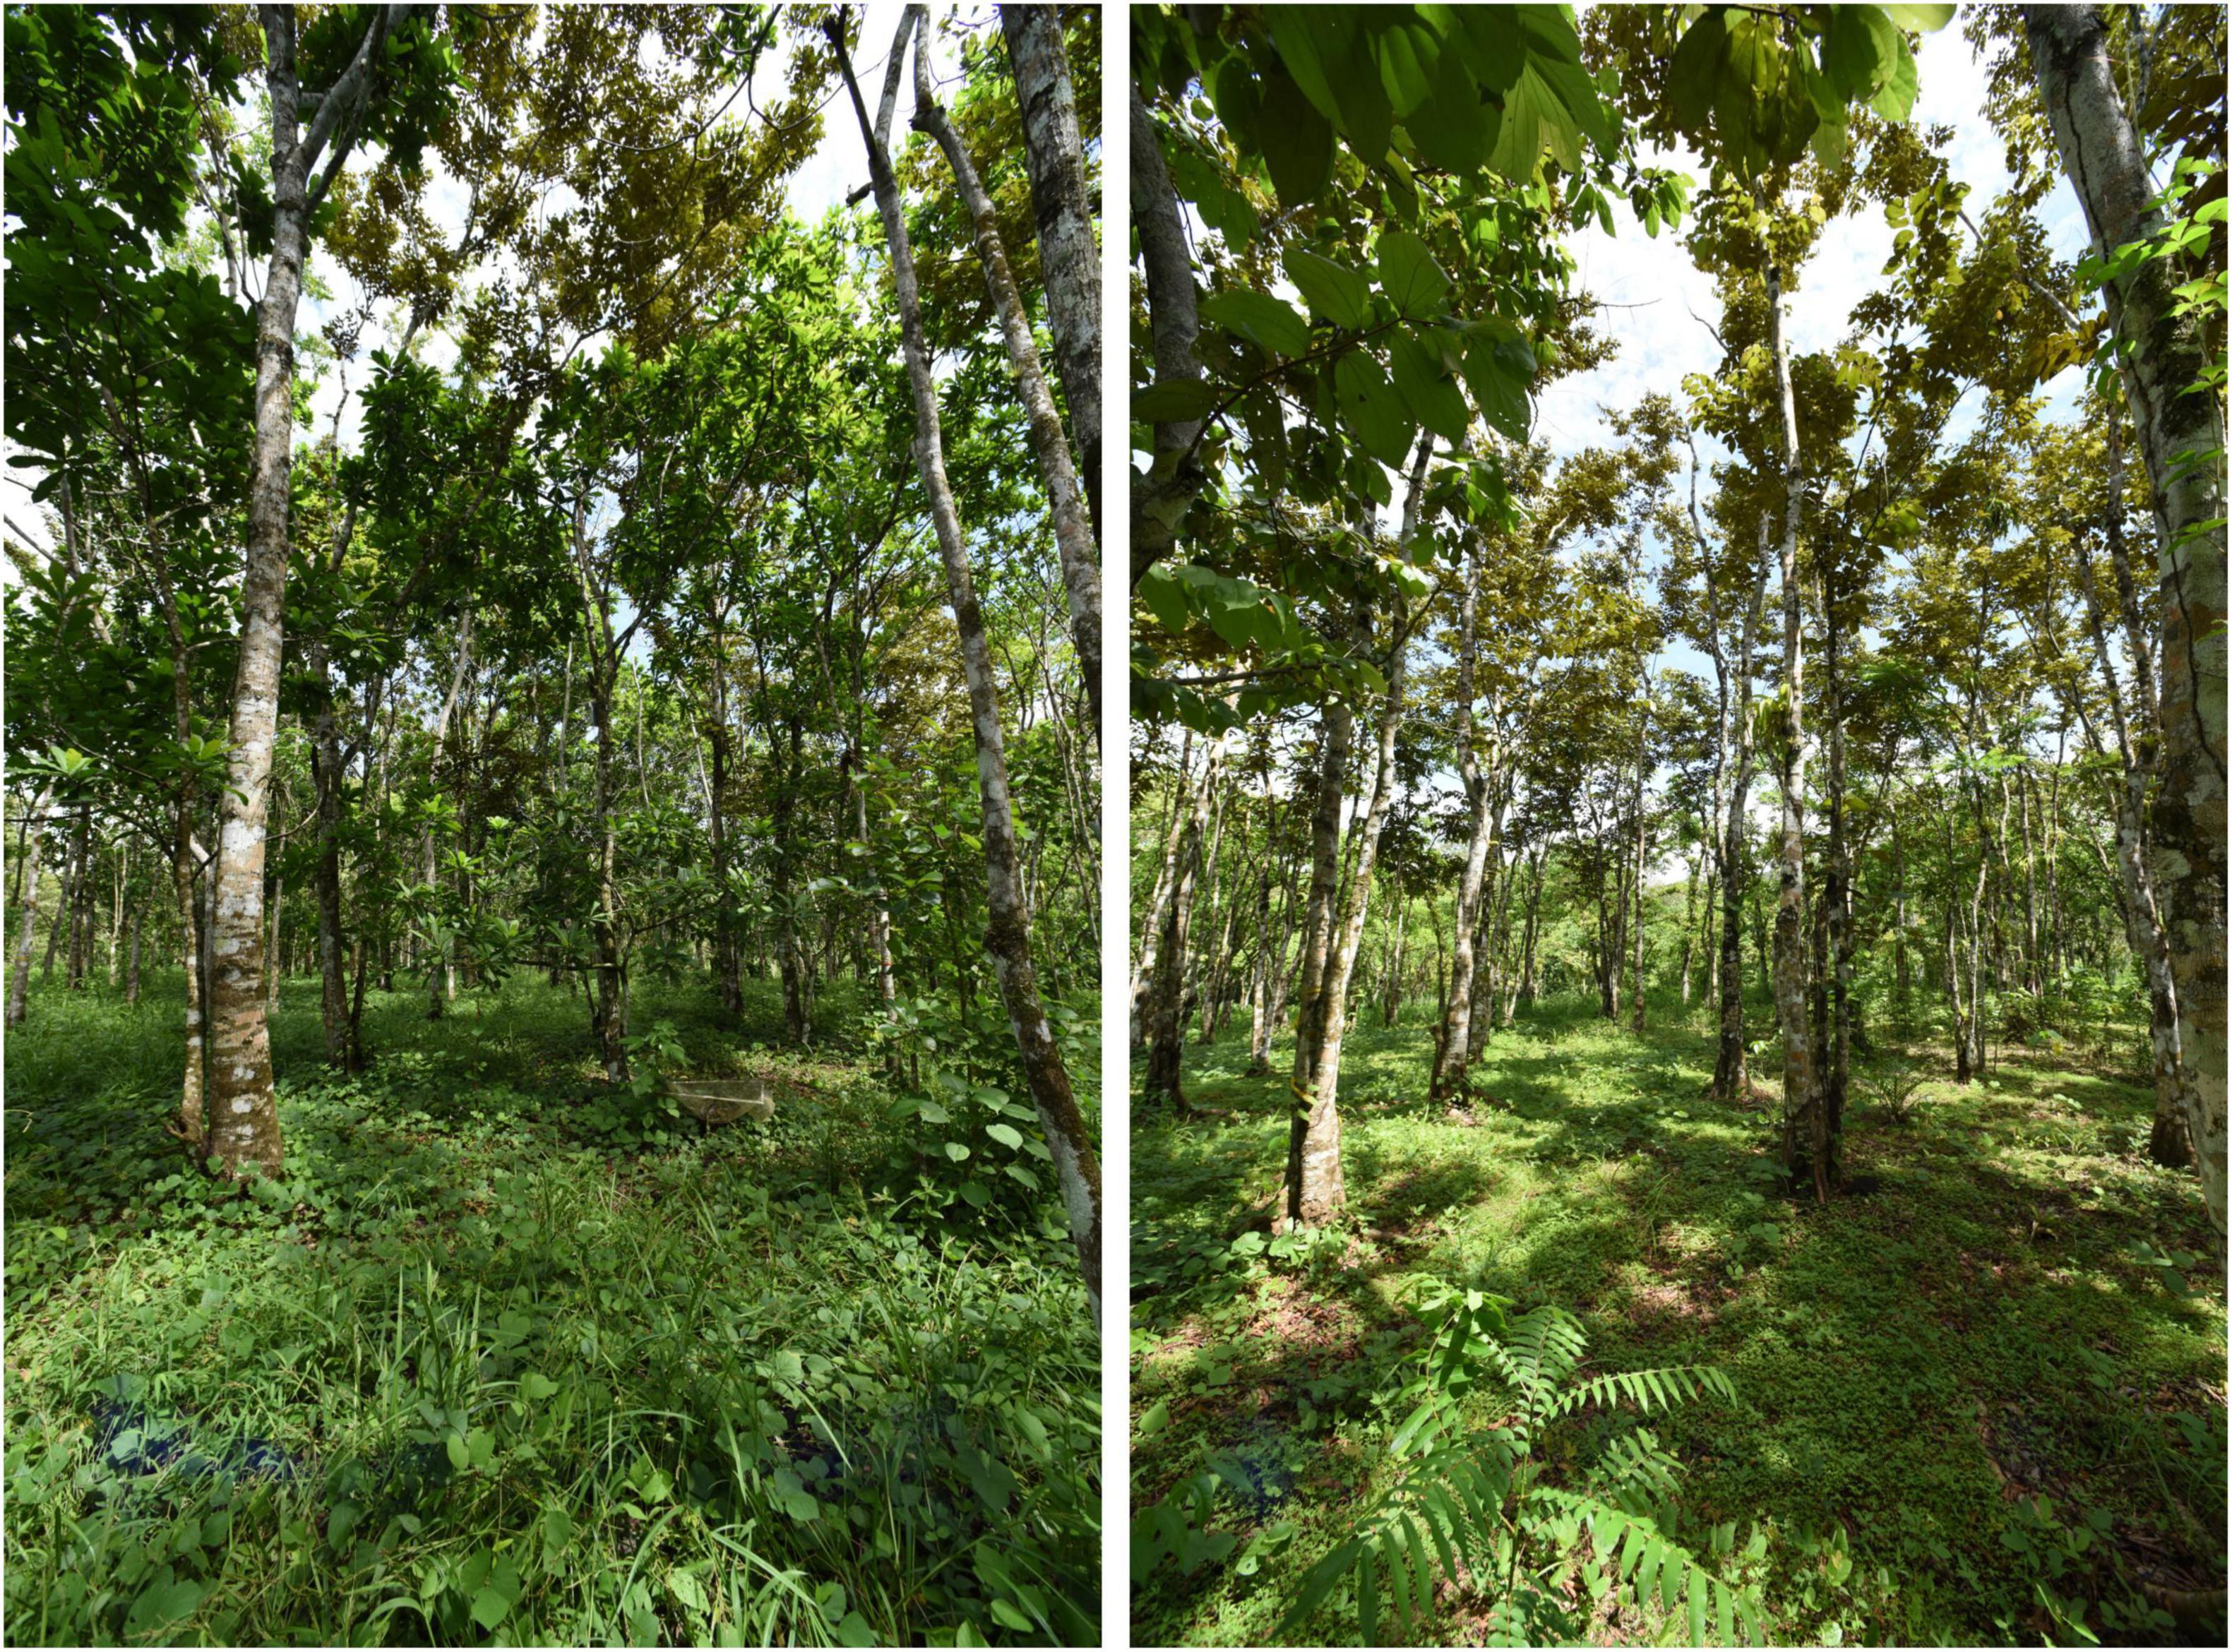
Figure 1. Images of two plots of the Sardinilla planted forest. Left: Example of a five-species mixture; right: example of a monoculture with Luehea seemannii. Photographs are curtsey of Matthias Kunz and were taken in the middle of each plot, on June 10th 2017.
Recording Methods
Recordings were made in all five-species plots, all three- and two-species plots and five monoculture plots (one for each species) using prototypes of the SET-Recorders (Soundscape Explanatory Terrestrial, Lunilettronik, Fivizzano)1. One monoculture (Hura crepitans) and two five-species plots were excluded from further analysis as recordings stopped after just a few recording minutes. Thus, in total we analyzed data from 14 plots (four 4 monocultures, 3 two-species, 3 three-species, and 4 five-species). The autonomous recorders were equipped with omnidirectional microphone capsule [EMY-63M/P, sensitivity (0 dB = 1 V/Pa. 1 kHz): dB −38 ± 3, signal to noise ratio: >60 dB, input voltage of the ADC: 0.75 Vrms (personal communication with Lunilettronik Coop.)]. The microphone gain was manually set to +25 dB. The signals were sampled at 48 kHz with a 16 bits digitization, recording for 1-min every tenth minute during 24 h a day. This recording schedule allowed us to cover the whole diurnal cycle, while at the same time covering an extended time period from the dry season into the rainy season. The devices were installed on a tree in the center of the plots, positioned at 1.7 m height always facing south, away from the main wind direction. To assess the quality of the audio data the first and last recordings per recording period were listened to.
Aural Classification of Audio Files
Adapting the protocol developed by Gasc et al. (2018), we randomly selected a subsample of our recordings – 10 audio files per day phase (4), season (2) and richness level (4), resulting in 320 audio files in total. First author SM listened to each of these audio files and visualized the spectrogram classifying them according to the three soundscape categories biophony, geophony, and anthropophony (Pijanowski et al., 2011). It was possible that the same audio file contained several of these categories. Furthermore, SM noted for all recordings containing biophony the presence and absence of different vocalizing animal groups, that were anurans, birds, cicada, insects vocalizing in mid-frequency ranges (4–8 kHz) and insects vocalizing in high-frequency ranges (8–24 kHz); again it was possible to assign several subcategories to the same audio file. The presence of other soundscape components such as wind, rain, planes, cars, barking dogs, human voices, and other identifiable sounds was also noted, but we did not use this information for further analysis. In accordance with Gasc et al. (2018) the duration of each category and subcategory as well as the range of song types were recorded. As only birds differed very slightly in that respect among tree species richness levels we refrained from presenting that data.
Calculation and Selection of Acoustic Indices
In total we calculated different acoustic features using “Analysis Program” (Towsey et al., 2018) and the Bioacoustic Index (Boelman et al., 2007). Data preprocessing involved the package “stringr” (Wickham, 2019). We used “High Amplitude” and “Clipping Index” to identify recordings with very loud wind and rain noises and excluded all recordings with values > 0 from further analysis. False-Color-Spectrograms (Towsey et al., 2014, 2018) were produced to identify periods with strong rain and wind, which were additionally excluded from further analysis. We assumed that strong rain and strong wind events were identical for all plots. This method allowed us to identify the exact start of the rainy season in that year as being the 15 April 2017.
After calculating acoustic indices, a correlation analysis and a non-metric multidimensional scaling (NMDS) analysis to select acoustic indices for further analysis (see Supplementary for further details) were performed. This served to identify indices that were most complementary to each other and thus were most likely to capture different soundscapes components during the different day phases and seasons (Towsey et al., 2014; Phillips et al., 2018). The selection was based on the following criteria (i) acoustic indices should not be significantly correlated among each other (Supplementary Figures 1–11); (ii) selected acoustic indices should relate to the NMDS axis that separate the different day phases, seasons and mixture levels (Supplementary Figures 12–14).
Based on these criteria, “High Frequency Cover”, “Bioacoustic Index,” and “Events Per Second” were selected for analysis. “High Frequency Cover” describes the “fraction of noise-reduced spectrogram cells that exceed 3 dB in the high-frequency band” (8–24 kHz) (Towsey, 2018). The “Bioacoustic Index” is calculated as the “area under each curve included all frequency bands associated with the dB value that was greater than the minimum dB value for each curve. The area values are thus a function of both the sound level and the number of frequency bands used by the” fauna (Boelman et al., 2007). “Events Per Second” represents a “measure of the number of acoustic events per second, averaged over the same noise-reduced 1-min segment. An event is counted each time the decibel value in a bin crosses the 3-dB threshold from lower to higher values” (Towsey, 2018). Insect sounds that cover a frequency band for the whole duration of the audio file (e.g., monotonous stridulations) are not counted as an acoustic event.
Statistical Methods
Statistical analyses were performed using R 4.0.2 (R Core Team, 2020). For the selected acoustic indices, we model diurnal patterns per season using generalized additive models (GAMs) and tested if parameter estimates for tree species richness level were significant. Tree species richness level (Mix) and season were included as factors, time of the day as smoother and “PlotID” as a random effect. Tropical acoustic communities show diurnal and seasonal activity patterns, to test this we added interaction terms for tree species richness level and season, as well as an additional smoother interaction term for time of day and season. GAMs were calculated using the “mgcv” package (Wood, 2011). Model diagnostics were assessed graphically and a specific distribution family was necessary for each acoustic index. Respective model specifications can be found in Tables 1–3. For graphical outputs we use the packages “ggplot2” (Wickham, 2016) and “tidymv” (Coretta, 2021).

Table 1. Model specifications and output for High Frequency Cover.
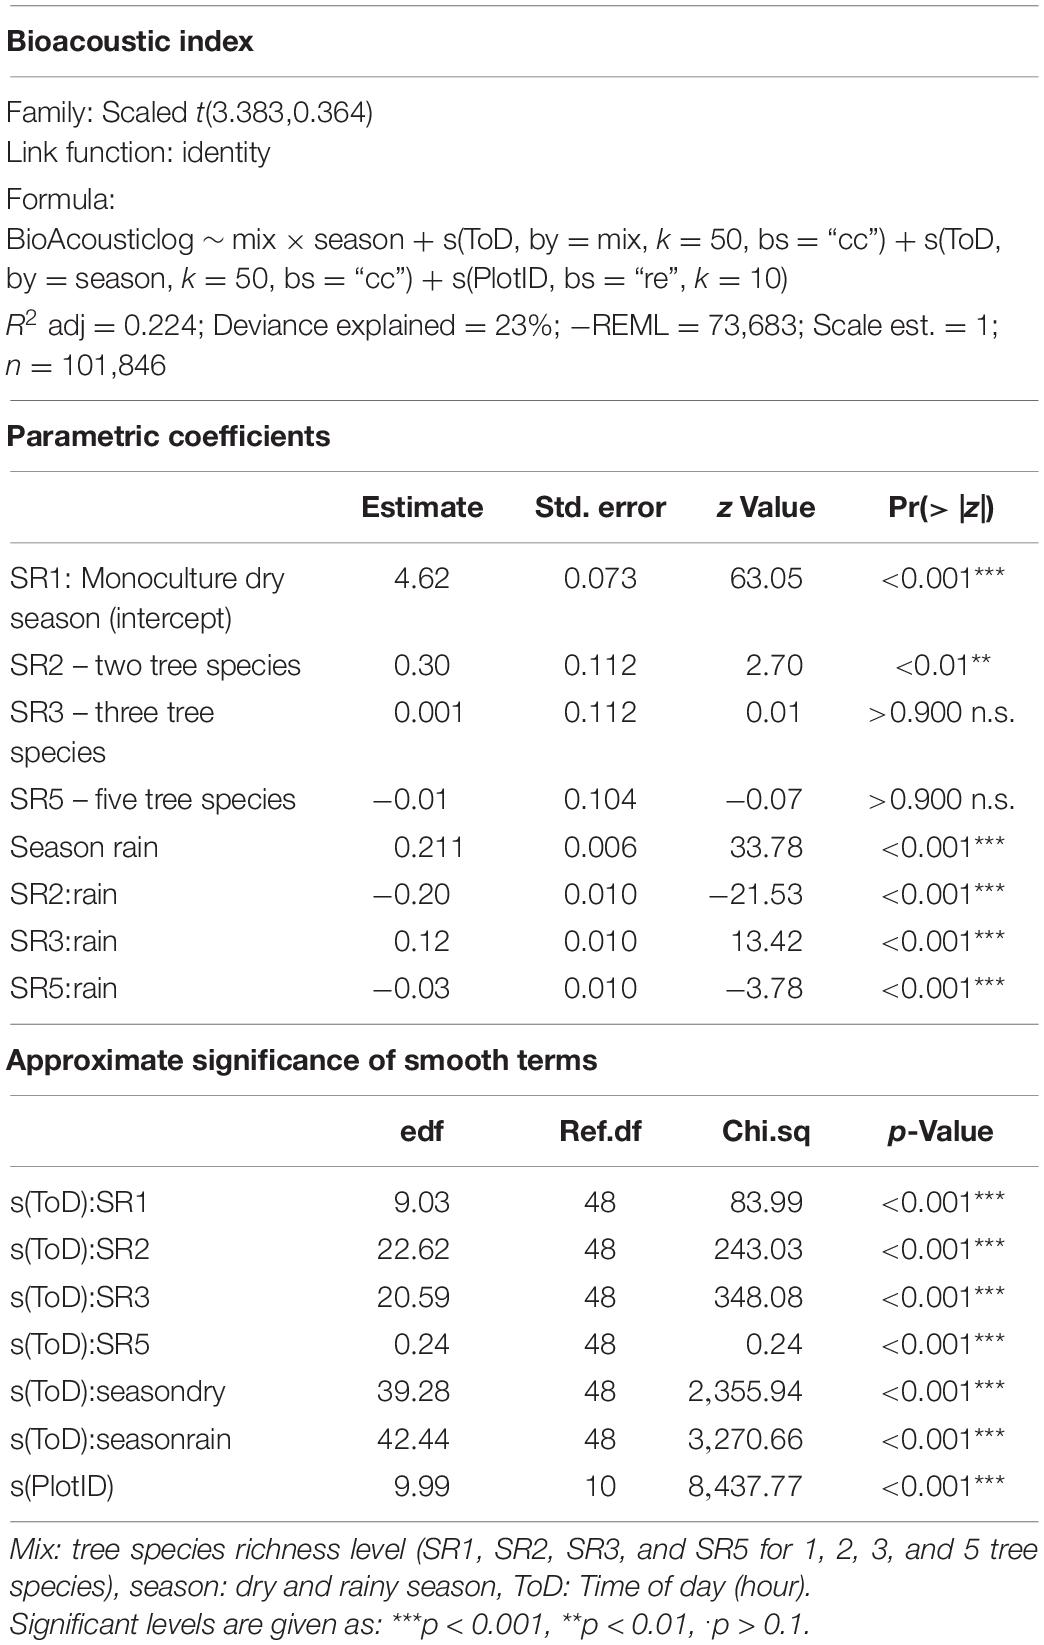
Table 2. Model specifications and output for Bioacoustic Index.
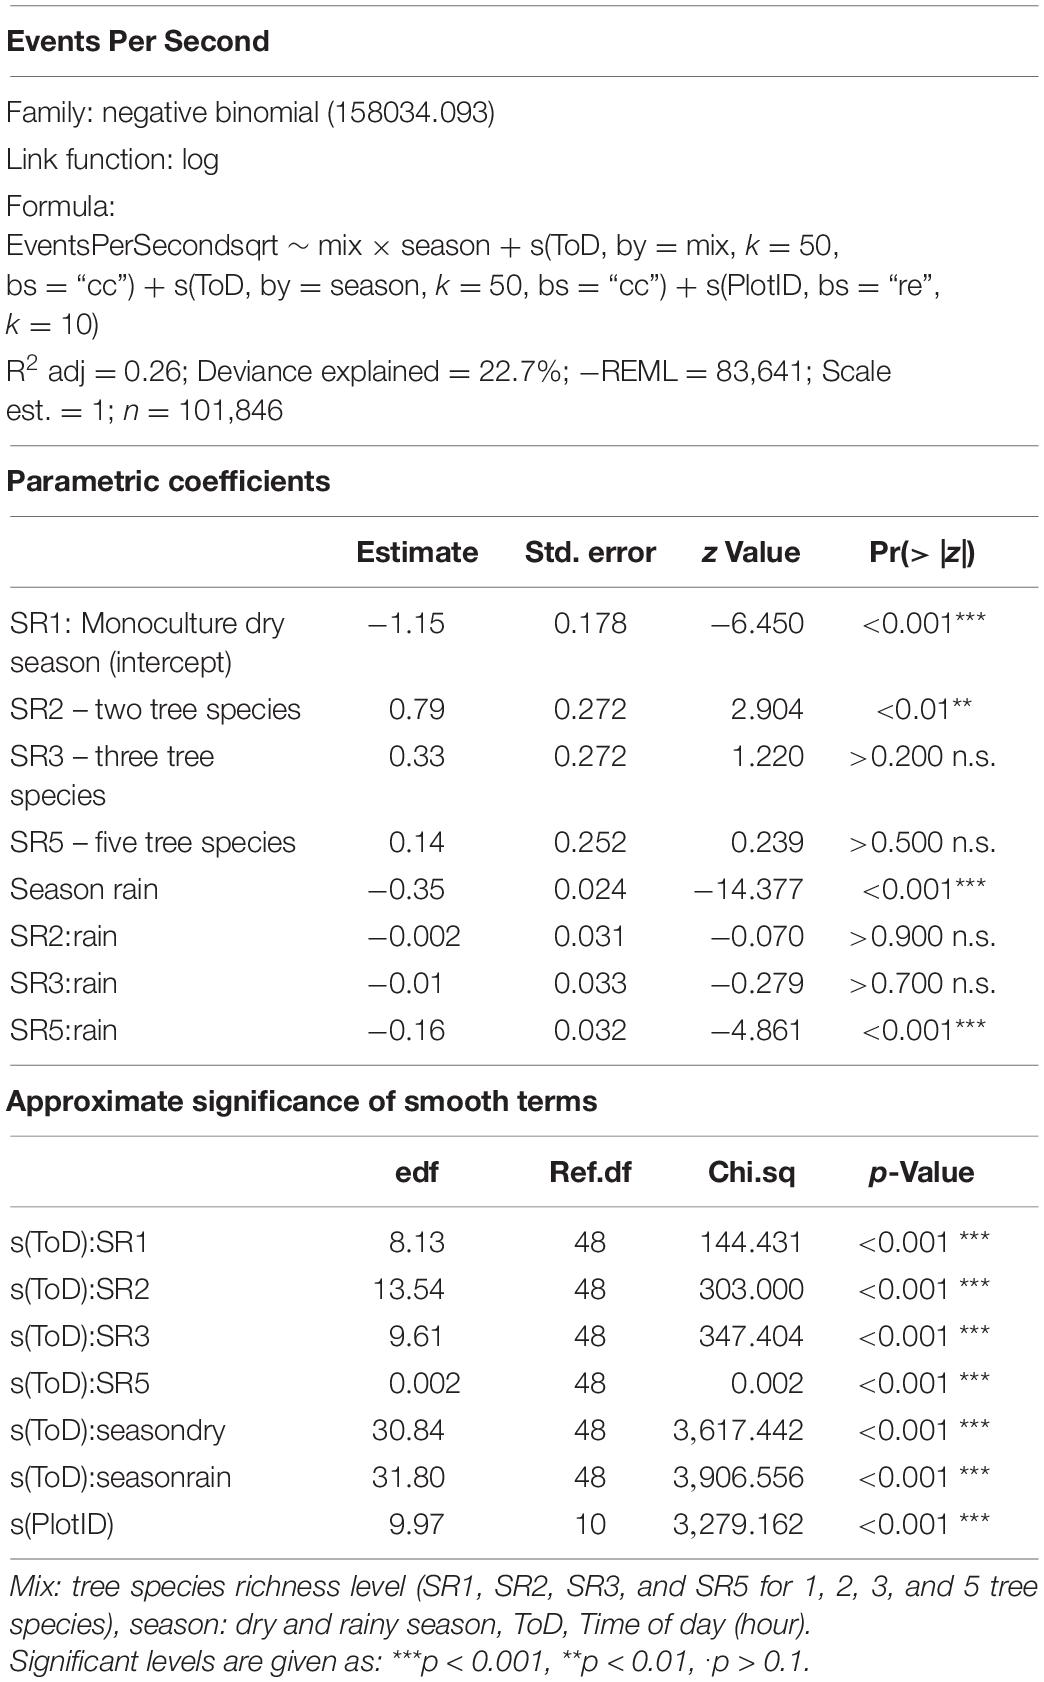
Table 3. Model specifications and output for Events Per Second.
Results
Temporal Patterns and Soundscape Composition
Aural Inspection
The number of recordings containing biophony did not change substantially across day phases and season, as biophony was recorded in almost all recordings that were aurally inspected (Figure 2). Both geophony and anthropophony appeared mostly during the day and rarely at night, but were overall less frequent than biophony. The most common geophony sounds were light wind and rain, as recordings with heavy rain and strong wind were excluded from the recordings. Anthropophony consisted of sounds from planes, undefinable machinery, nearby constructions, vehicles, and chainsaws.
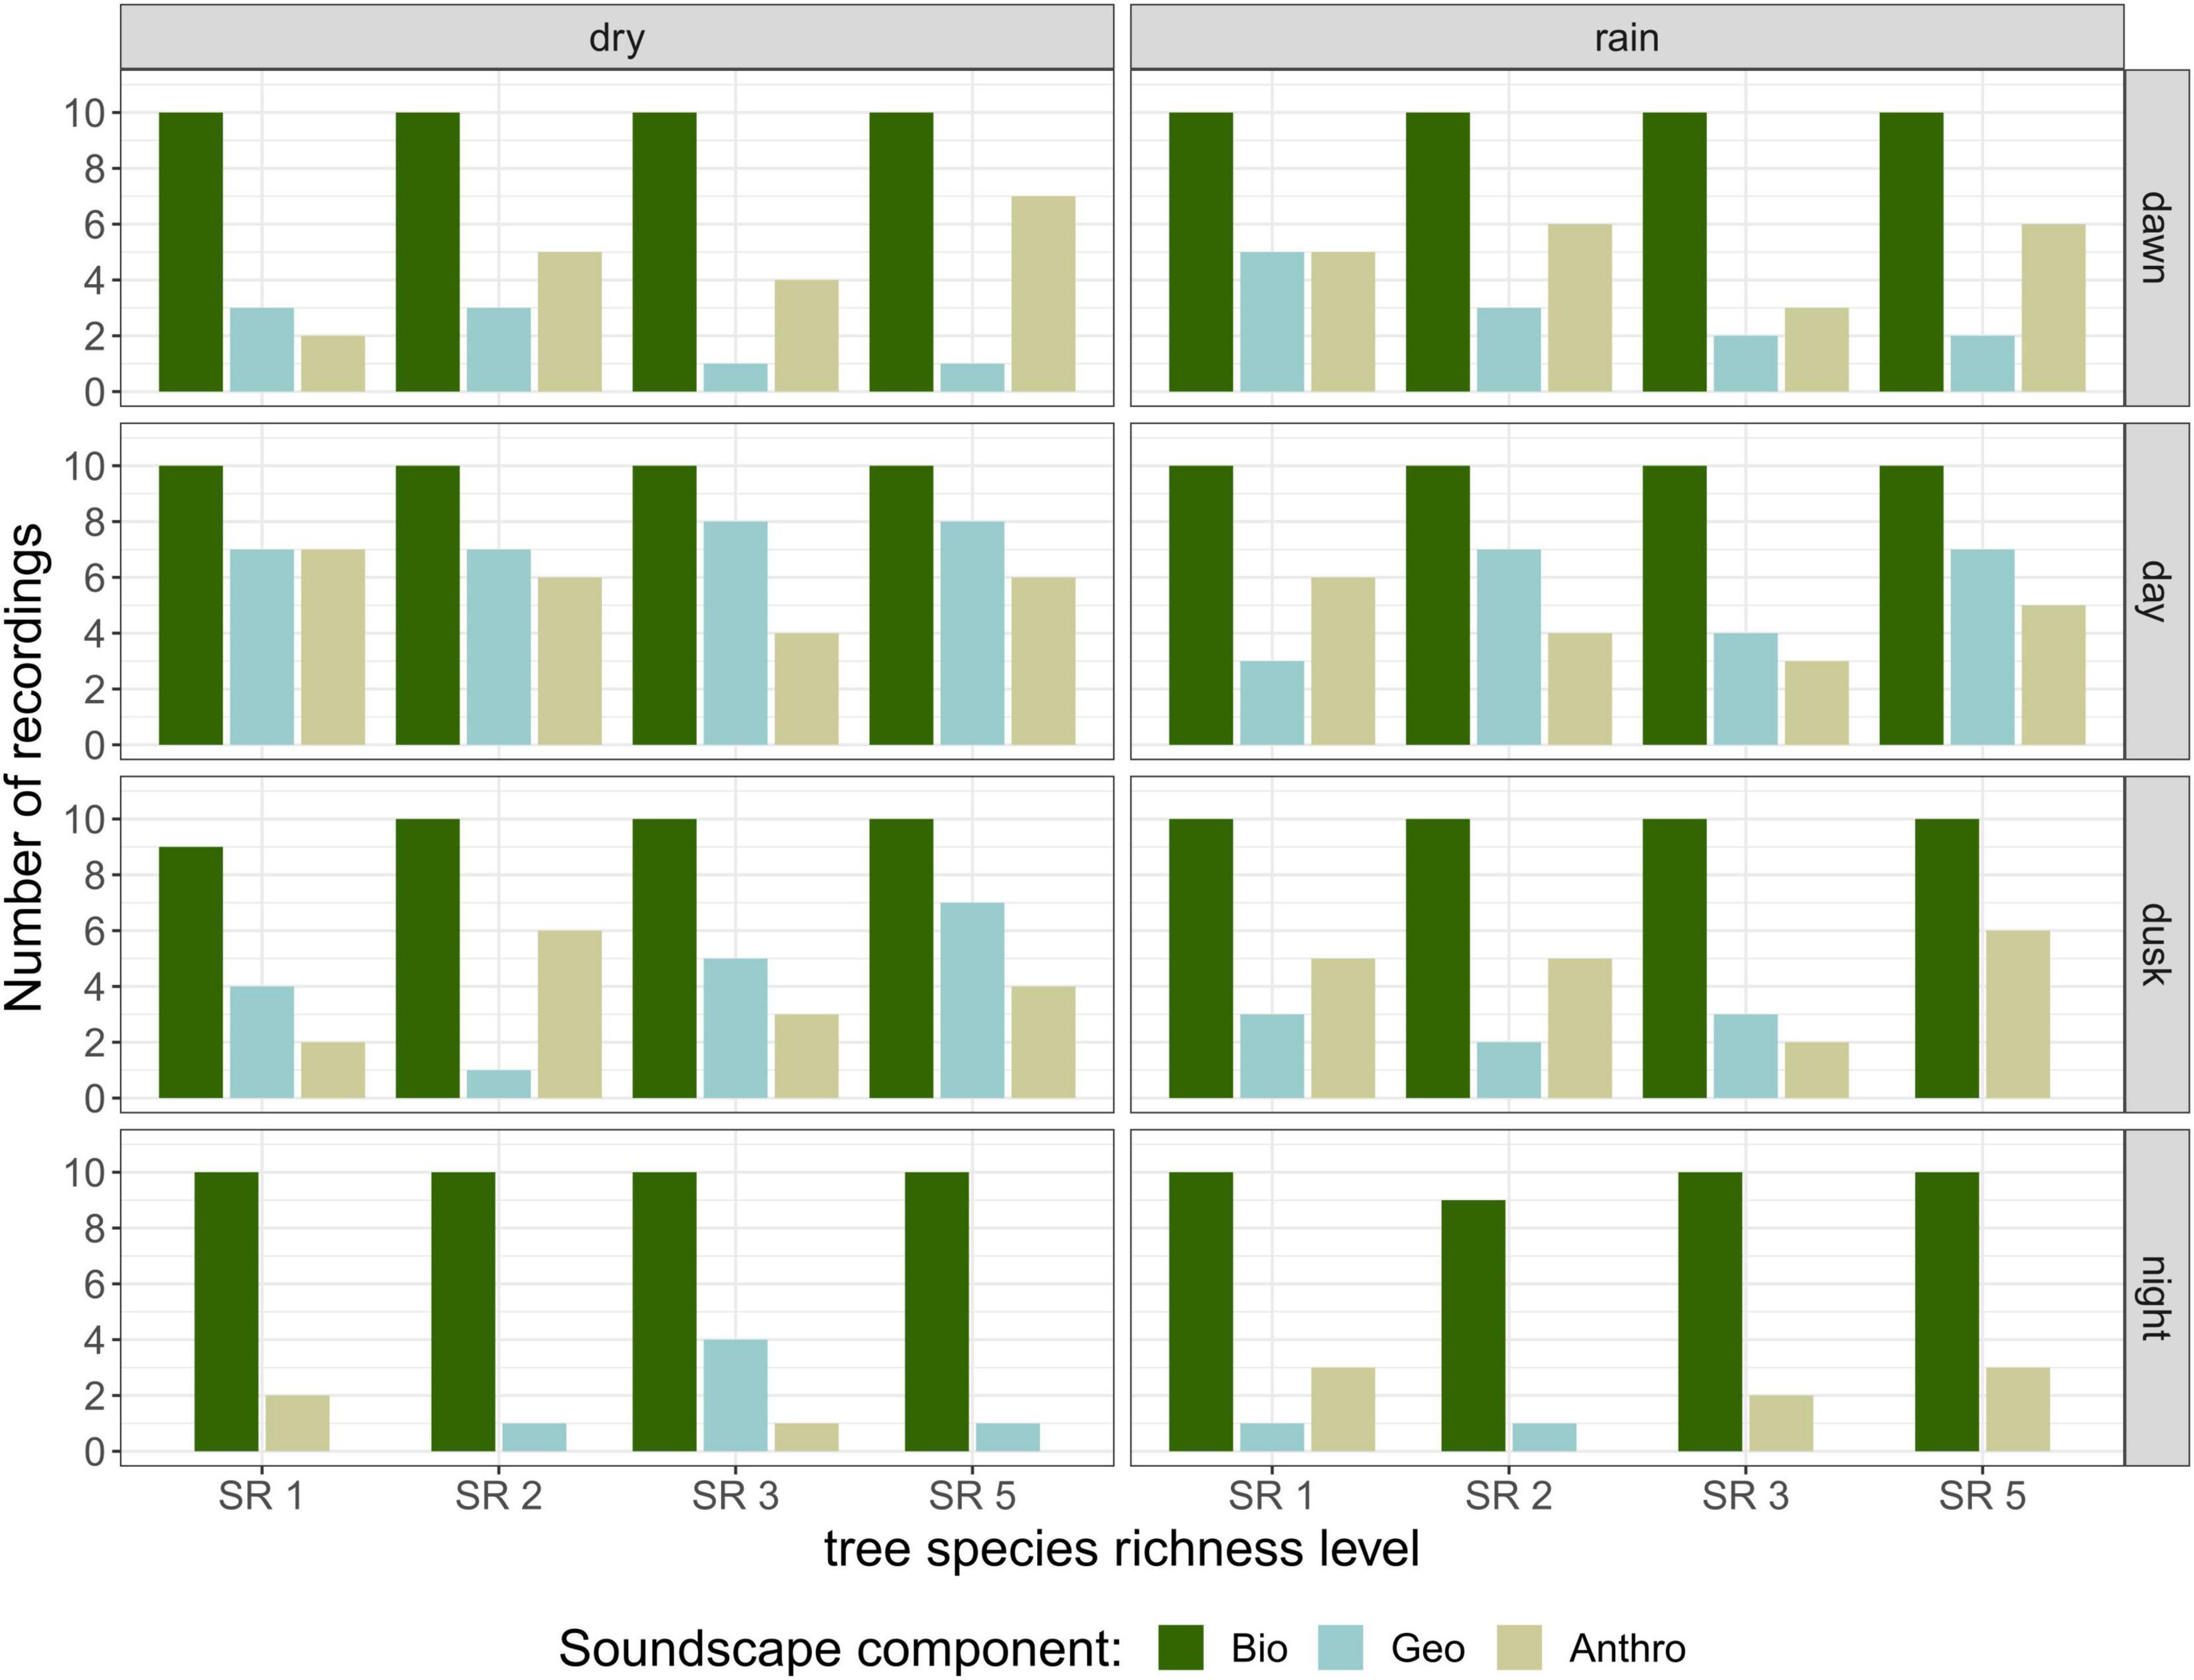
Figure 2. Soundscape composition of recordings in terms of biophony, geophony, and anthropophony. Number of recordings for each category from the 320 recordings that were aurally classified, per season, day phase, and tree species richness level. Recordings could contain more than one soundscape component.
Distinct patterns were found between day – when birds and non-biophony sounds were dominating the soundscape – and night – with orthopterans occupying a large frequency band (Figure 3). Other sound sources in the Sardinilla planted forest included insects vocalizing in mid-frequency ranges (4–8 kHz, mainly crickets), anuran (dominating the range just below the crickets) and cicada (rare events, overlapping with crickets in the frequency domain). Bird vocalizations were recorded from dawn until dusk, and dominated the day recordings. This dominance resulted from a reduced number of recordings with vocalizations from anurans and insects rather than an increase in bird activity. Thus, the aural inspection did not indicate a clear peak of bird vocal activity at dawn and dusk, as can be observed in temperate or boreal biomes. There was no observable seasonal trend for birds. Anurans were least active during the day but this activity increased in the rainy season. Insects singing in mid–frequency ranges were also least active during the day, with a slight increase in the rainy season. Insects singing at high frequency ranges showed clear activity peaks at dusk and night with no strong seasonal patterns. Cicadas were not common to observe, and showed an irregular pattern with a slight higher frequency of observations during day and dusk in the dry season.
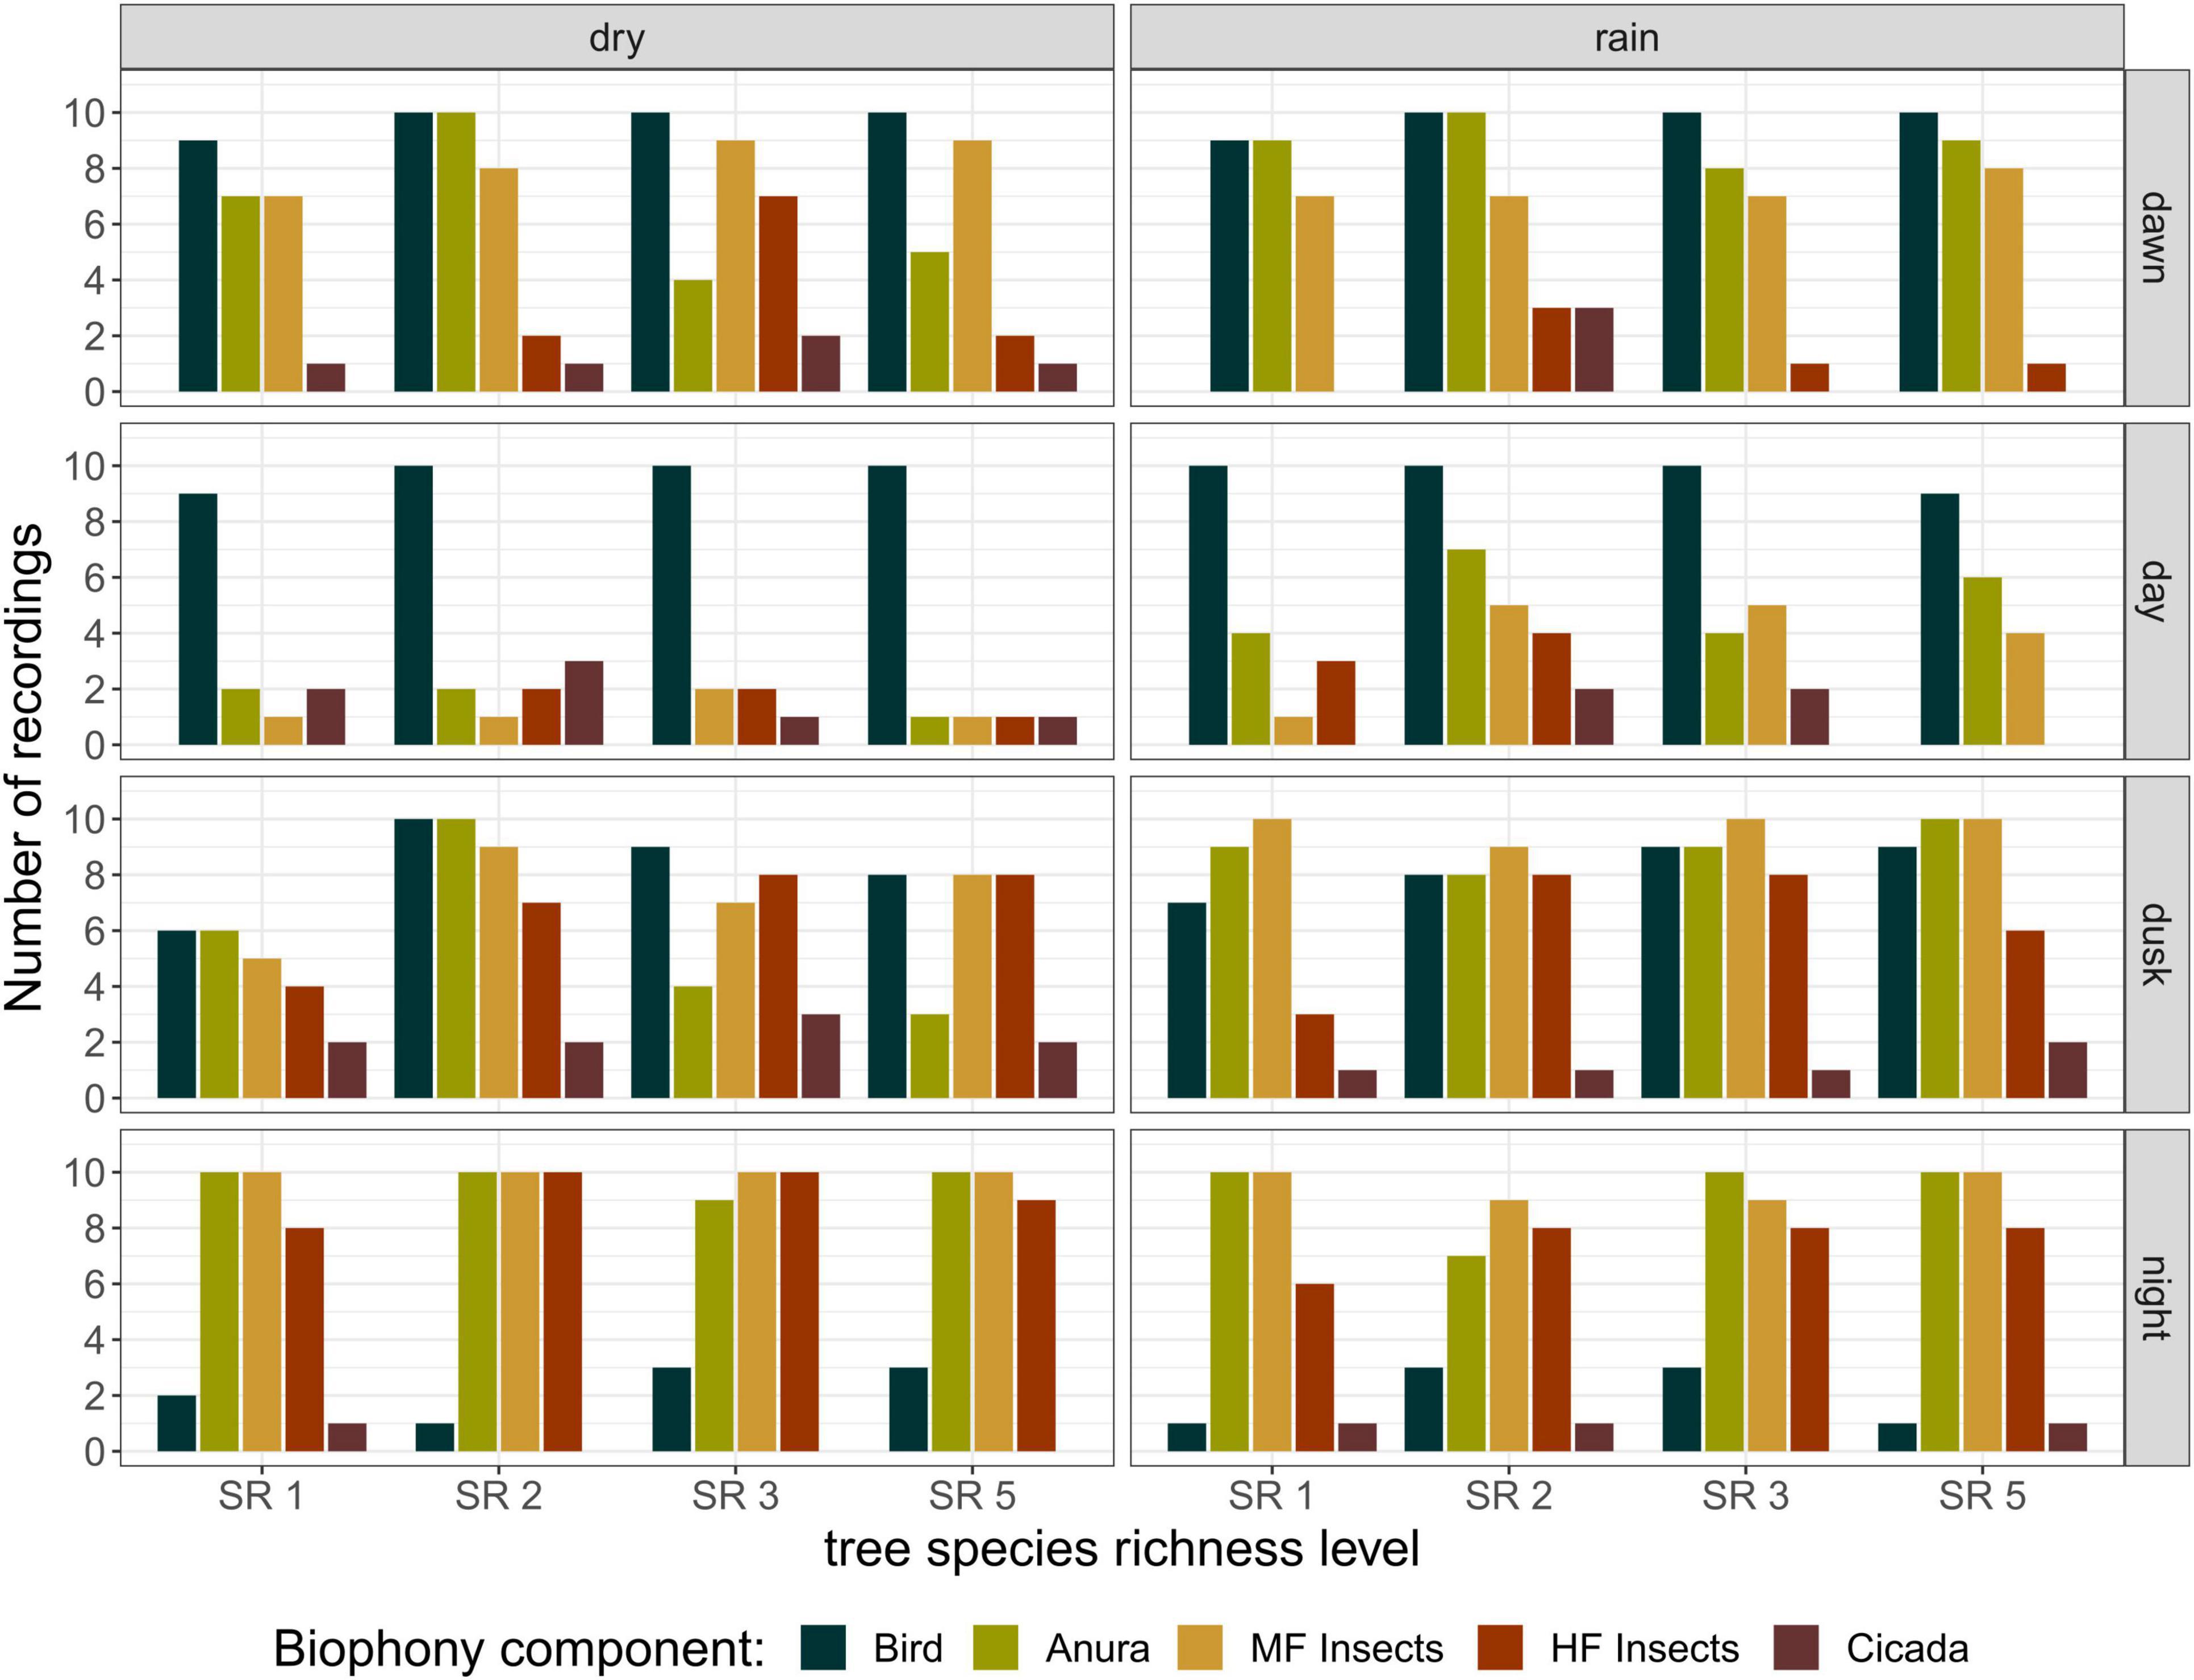
Figure 3. Detailed biophony composition analysis, from the 320 recordings that were aurally classified, per season, day phase, and tree species richness level. Recordings could contain more than one biophony component. All recordings containing biophony were classified according to presence of birds, anurans, insects vocalizing in mid-frequency ranges (4–8 kHz, MF Insects), insects vocalizing in high-frequency ranges (8–24 kHz, HF Insects) and cicadas.
Comparison of Acoustic Indices
The correlation analysis revealed that acoustic indices could be grouped into four clusters (Supplementary Figure 1). Cluster 1 consisted of Entropy of Average Spectrum and Entropy of Variance Spectrum. These indices showed higher values at night compared to day, with only slight differences among rainy and dry season (Supplementary Figures 2, 3). These indices were negatively correlated with indices from cluster 2 and 4 and were therefore not included in further analysis. Cluster 2 consisted of Acoustic Complexity Index, Mid Frequency Cover and Bioacoustic Index. All indices showed distinct dawn peaks and different patterns between dry and rainy season (Supplementary Figures 4–6). From this cluster we chose the Bioacoustic Index for further hypothesis testing, also based on results from an NMDS analysis (Supplementary Figure 12). The Bioacoustic Index showed peaks at dawn and dusk, slightly lower values during the day and lowest values at night (Figure 4). During the rainy season, the patterns for these indices changed: index values increased throughout the day, but particularly at midday, resulting in less pronounced peaks at dawn and dusk. Thus, the Bioacoustic Index corresponded to anuran and bird acoustic activity patterns identified in the aural inspection. Cluster 3 consisted of High Frequency Cover and Spectral Density. These indices also showed higher values at night compared to day (as cluster 1, Supplementary Figures 7, 8). From this cluster we chose High Frequency Cover for further analysis. High Frequency Cover was designed to represent the orthopteran community that predominantly communicates in high frequencies, while few other vocalizing animal groups occupy this frequency range. Peaks at night for High Frequency Cover, as well as a slight reduced High Frequency Cover in the rainy season (Figure 5) could be verified by the aural inspection (section “Aural Inspection” and Figures 3, 5). Cluster 4 consisted of Low Frequency Cover, Events per Second and Temporal Entropy. These indices showed strong peaks during the day, without peaks at dawn and dusk, and very low values at night (Supplementary Figures 9–11). Dry season had higher peak values than the rainy season. From this cluster Events Per Second was chosen for further analysis (Figure 6).
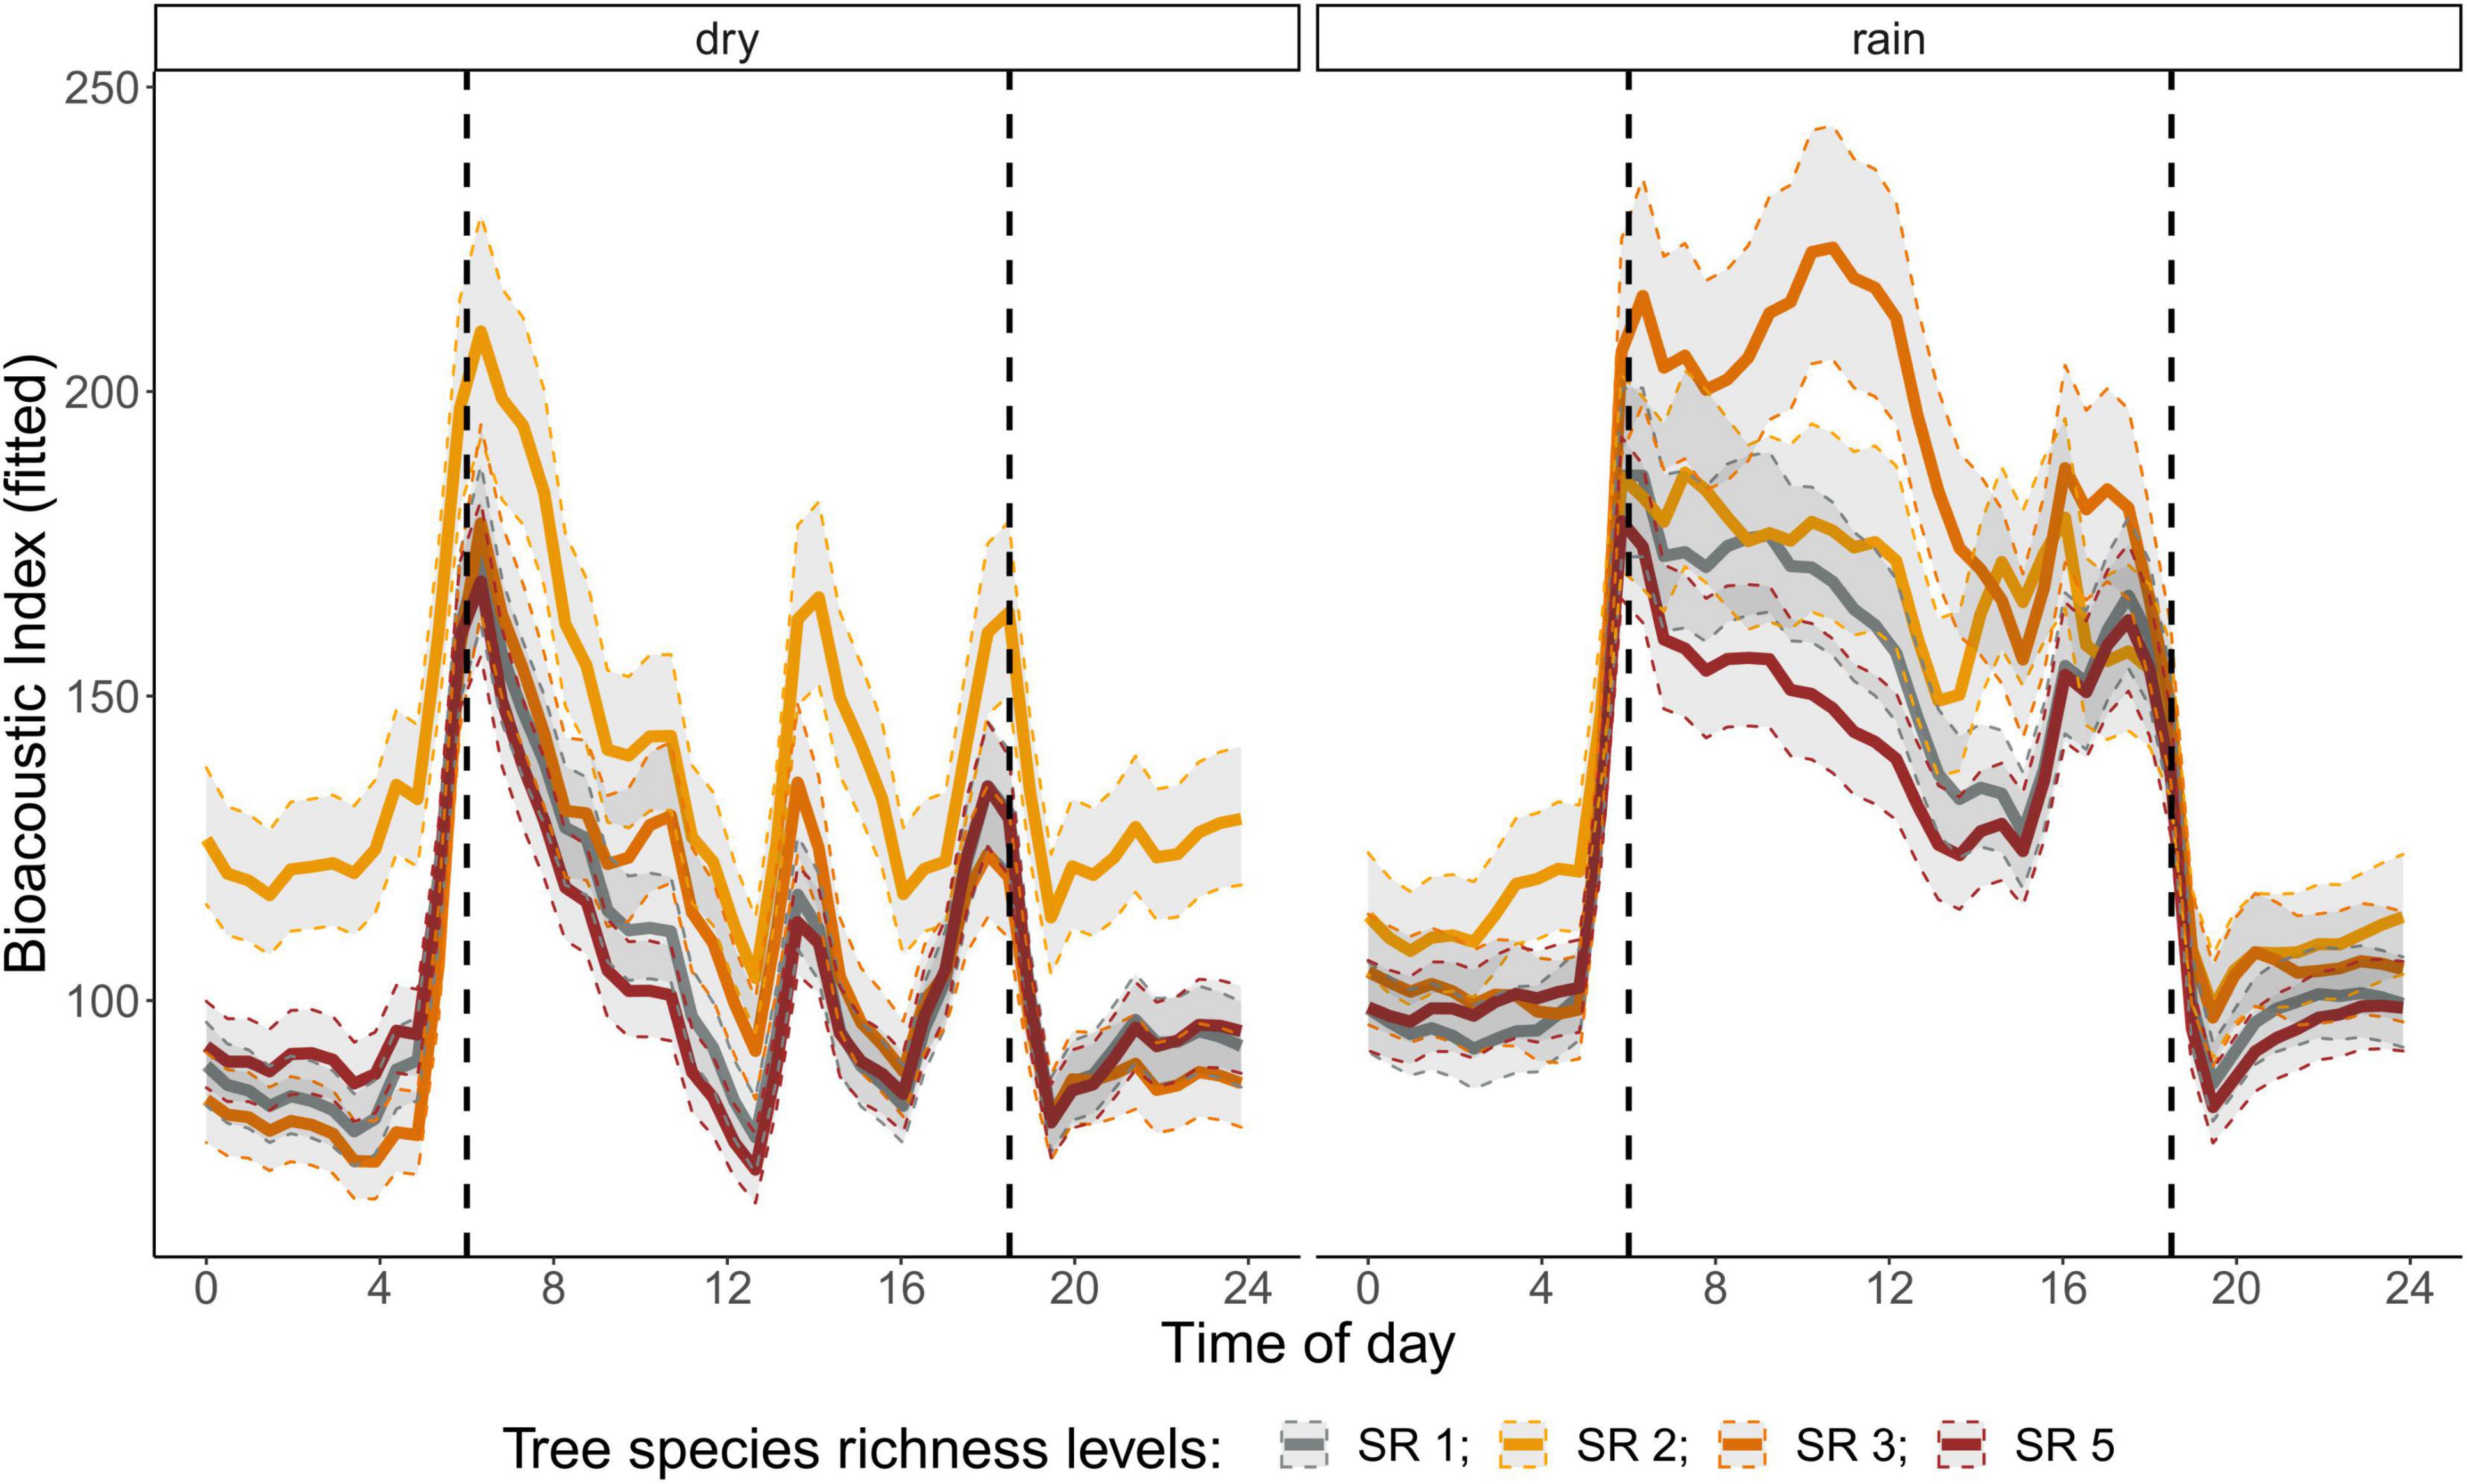
Figure 4. Fitted values for bioacoustic index over a diurnal cycle (time of day) per season (dry and rainy season) and tree SR level. Dashed vertical line indicate sunrise (ca. 06:00) and sunset (around 18:30).
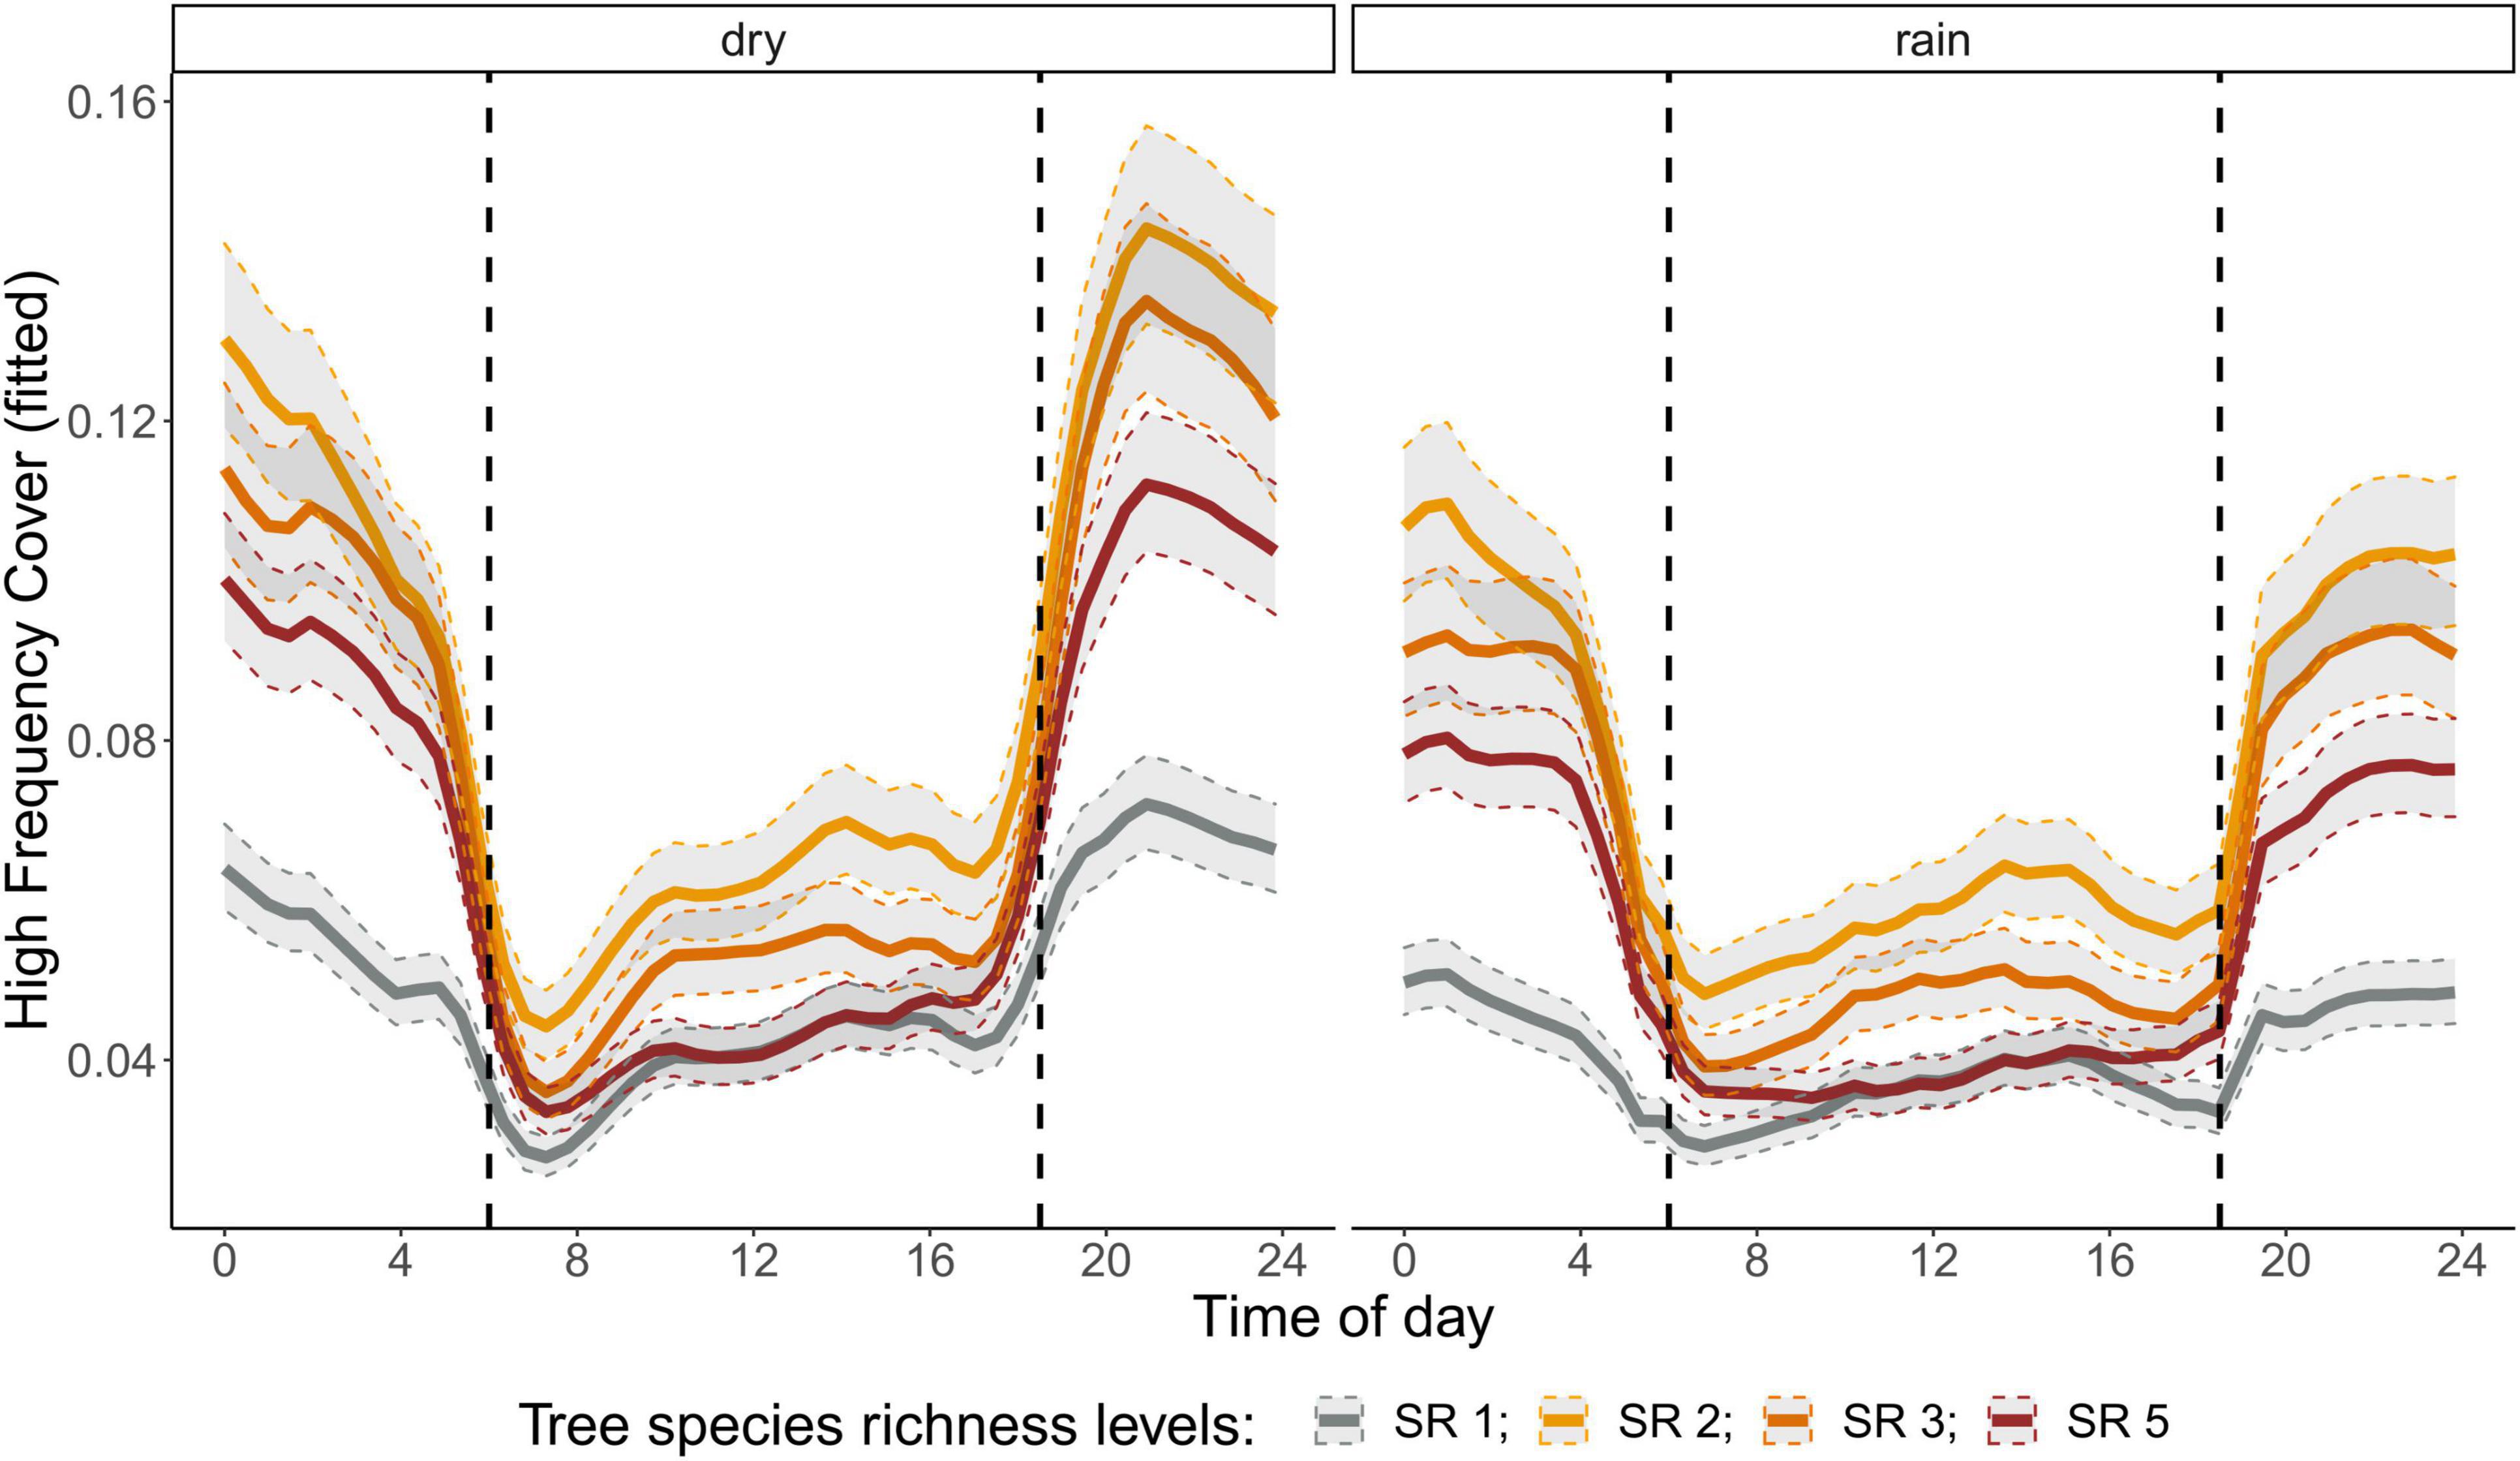
Figure 5. Fitted values for high frequency cover over a diurnal cycle (time of day) per season (dry and rainy season) and tree species richness level (SR). Dashed vertical line indicate sunrise (ca. 06:00) and sunset (around 18:30).
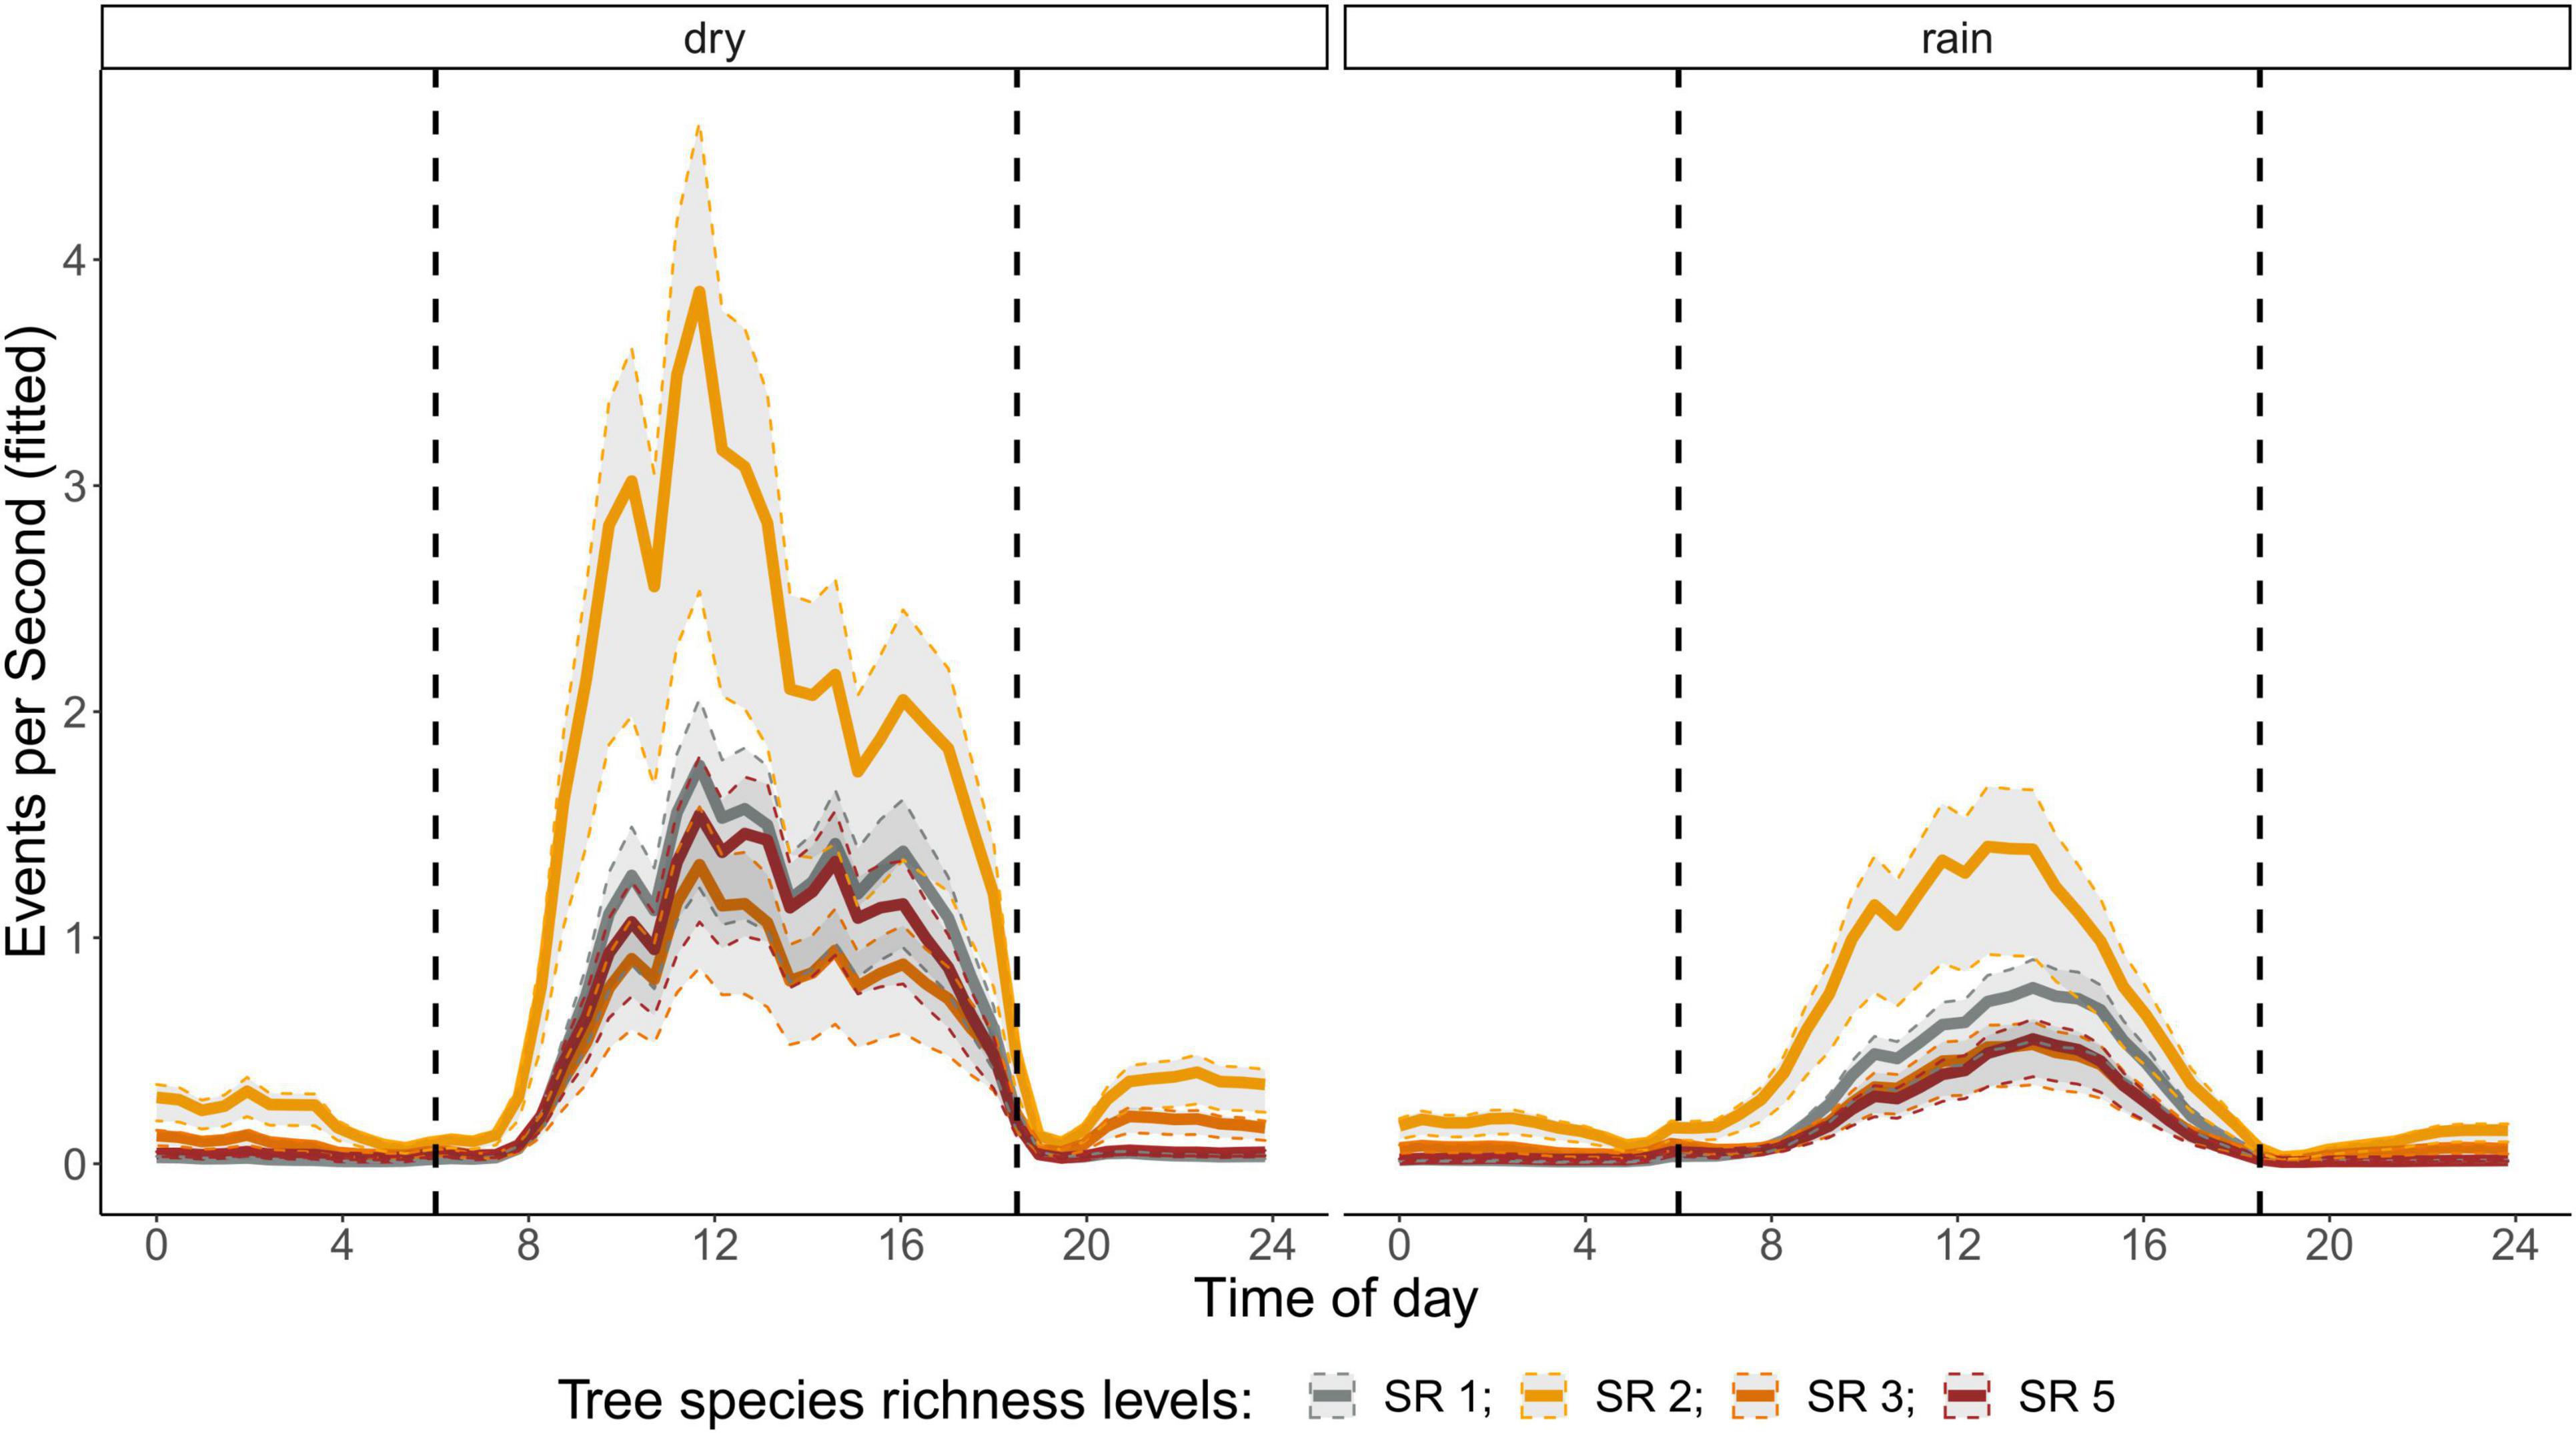
Figure 6. Fitted values for events per second over a diurnal cycle (time of day) per season (dry and rainy season) and tree SR level. Dashed vertical line indicate sunrise (ca. 06:00) and sunset (around 18:30).
Effects of Tree Species Richness on Temporal Patterns of Acoustic Indices
There was a significant lower High Frequency Cover in monocultures at night, compared to polycultures (Figure 5), and parametric coefficients for polycultures were significantly different from the monocultures (Table 1). Polycultures did not differ from each other, but two-species mixtures showed a slight but significant lower decrease of High Frequency cover in the rainy season than the other plots (Table 1). In the dry season the parametric coefficients for two-species mixtures were significantly higher than for the other mixture levels in terms of the Bioacoustic Index, and differences were most pronounced at night (Figure 4 and Table 2). In the rainy season the three-species mixtures showed higher values than the other plots at midday. For Events Per Second the two-species mixtures showed parametric coefficients significantly different from the monocultures while the other polycultures did not (Table 3), and had a significantly higher day peak during the dry season. Differences among two-species mixtures and the other tree species richness levels were less pronounced but still significant during the rainy season (Figure 6).
Discussion
Indices to Capture Temporal Patterns of Acoustic Diversity
Different acoustic indices capture different aspects of the soundscape. By choosing non-redundant indices, it is possible to capture complementary patterns in the soundscape, and attribute them to specific groups in the acoustic community (Buxton et al., 2018; Eldridge et al., 2018; Phillips et al., 2018). Since acoustic community composition and dynamics vary among different biomes in interaction with local geophony and anthropophony, it may be necessary for each ecoacoustic study to identify its own unique set of indices to describe soundscape composition. Ross et al. (2021) tested several acoustic indices within different sonic conditions for their performance in capturing biological meaningful patterns and sensitivity in respect to noise. Most commonly used indices showed sensitivity to various confounding sound sources (Ross et al., 2021). Even though they came up with very useful practical recommendation for the suitability of different indices in different sonic conditions, studies in other biomes identified different sets of acoustic indicators to best describe their specific soundscape (Fuller et al., 2015; Ng et al., 2018; Turner et al., 2018; Carruthers-Jones et al., 2019; Oliveira et al., 2021).
If we understand acoustic indices as an integrative measure of biodiversity that reflects the soundscape composition and particularly the acoustic communities as a whole in response to human activity and ecological gradients (Pijanowski et al., 2011; Farina, 2014; Farina and Gage, 2017) we also have to understand that a single acoustic index will rarely correspond only to a single vocalizing animal group (Retamosa Izaguirre et al., 2021). This is probably especially true in the tropics as different vocalizing animal groups often vocalize at the same time (Eldridge et al., 2018) and could explain why in our study the temporal patterns of the chosen acoustic indices did not match the patterns of a single vocalizing animal group perfectly well. This is in line with other studies, mostly on birds, that have shown an often significant but weak correlation of acoustic indices with bird richness (Moreno-Gómez et al., 2019; Dröge et al., 2021). Even though recent studies indicate that such correlations might be improved if species richness is based on bioacoustic identification from acoustic recordings rather than point-count assessments (Shaw et al., 2021). In contrast, studies focusing on the relationship of acoustic indices with parameters that describe ecological condition such as vegetation structure, vegetation complexity, habitat type, land-use intensity and/or distance to the nearest road often report acoustic indices to be good indicators (Tucker et al., 2014; Fuller et al., 2015; Burivalova et al., 2018; Ng et al., 2018).
By the selection process we applied and by analyzing different temporal acoustic niches, we could identify three complementary indices that allowed us to test effects of tree species richness on different vocalizing communities. As Metcalf et al. (2020) argued, the interpretability of acoustic indices can be greatly improved by calculating them in ecological meaningful time and frequency bins. But even then, given the integrative properties of acoustic indices in capturing soundscape components, interpretability of acoustic index patterns might not be very straight forward. Aural inspection of a subset of recordings supported the interpretability in our study. Nevertheless, aural inspection only indicated the presence or absence of certain vocalizing groups across day phases and season, while acoustic indices respond also to diversity, distance and abundances of vocalizing animal groups.
High Frequency Cover in our study matched the temporal acoustic activity patterns identified for orthopteran vocalizing in high frequencies, and was therefore a useful tool to identify effects of tree species richness on this insect community. The Bioacoustic Index is frequently used in ecoacoustic studies and it was designed to specifically pick up bird vocalization patterns (Boelman et al., 2007). In our study it seemed to be driven both by bird and anuran vocalizations. While aural inspection of recordings did not suggest a change in activity patterns of birds in our study, the increase in Bioacoustic Index during the rainy season might be mainly driven by an increase in anuran activity. Also Boullhesen et al. (2021) found a very good relationship between the Bioacoustic Index and frog vocal activity patterns and frog species richness. Opaev et al. (2021) found a similar increase of Bioacoustic Index with increasing humidity just before the monsoon season, which they associated with the onset of the breeding season for both birds and anurans. In a study of different forest types in the Valdivian temperate rainforests of southern Chile, Fontúrbel et al. (2021) observed a clear peak of bird vocalizations at dawn only in old- growth forest, while it peaked at noon in plantations, and in the afternoon in logged forests and showed a variable pattern in secondary forest, suggesting that daily activity peaks of birds could depend on forest understorey and forest structure. Our data showing that birds were active throughout the day from dawn until dusk and dominated the soundscape at noon is coherent with the observations made in Chilean plantations.
Events Per Second was correlated with Low Frequency Cover and Temporal Entropy and showed a clear peak during the day, but no peaks at dawn and dusk. This might have related to an increase in geophony and anthropophony during the day recordings (Figure 2), which should both be related to Low Frequency Cover (Gage and Axel, 2014; Shaw et al., 2021). The two-species mixtures were a result of establishment failure of Cordia alliodora. Which could have resulted in higher wind noises in these plots due to lower stand density and might explain partly that these plots showed significantly higher values for Events Per Second throughout the day, in comparison to the other plots. Additionally, Events Per Second might relate to a dominance of birds while insects showed a reduced activity. This would relate also to the fact that Events Per Second is reduced in the rainy season when the dominance of birds is also reduced due to an increase in anuran activity.
Since the high frequency ranges - in most environments we can think of - are occupied exclusively by orthopterans (and sometimes bats), the usefulness of High Frequency Cover can probably be generalized to other ecosystems and habitats. The situation is more complex in mid-frequency ranges where more than one vocalizing animal group is active. Other studies have addressed the advantages and disadvantages of different acoustic indices under different environmental conditions, and useful overviews can be found, for example, in Bradfer-Lawrence et al. (2019), Zhao et al. (2019), Ross et al. (2021), Sánchez-Giraldo et al. (2021), and Shaw et al. (2021).
Effects of Tree Species Richness
High Frequency cover, revealed a positive effect of polycultures on insect acoustic activity that might relate to abundance of this vocalizing insect group. This confirmed our hypothesis that planting polycultures has positive effects on associated biodiversity, specifically manifested within the orthopteran community due to their small home ranges. Birds in contrast are likely to be more mobile and their home ranges might not be restricted to a single plot. A recent meta-analysis revealed that bird diversity in plantations is lower than in natural forests but that overall faunal diversity, including birds, benefits from planting a mix of native tree species (Bohada-Murillo et al., 2020; Wang et al., 2021)
An increase in tree species richness could increase orthopteran abundance and diversity via an improved variety of food sources, especially for specialist plant consumers. A mechanism that is modulated by trophic interactions, as was shown for grassland ecosystems (Siemann, 1998; Ebeling et al., 2018). In forests these relationships were often studied under the objective of testing tree species richness effects on herbivore damage on trees (associational resistance hypothesis, Jactel et al., 2021), and not how it would affect orthopteran diversity. Still, there is evidence that herbivore arthropod diversity and abundance is related to tree diversity and that this relationship between plant diversity and consumer diversity might be particularly strong in the tropics (Becerra, 2015). Given that many orthopteran are highly host tree specific, the effect of tree species identity has to be considered as well (Novotny and Basset, 2005).
Another mechanism could be the indirect effect of tree species richness on microclimate and microhabitats. In a global meta-analysis, canopy cover, which affects microclimate, was the most important driver of faunal biodiversity (Wang et al., 2021). How microclimate can change the acoustic communities was addressed by Campos-Cerqueira et al. (2020) and Burivalova et al. (2021). In their study selective logging resulted in microclimatic changes that decreased humidity in the logging gaps. This had impacts on amphibians and understory specialist birds, and certain insect groups. Anurans are driven by the presence of microhabitats and waterbodies while tree species richness itself is likely less important (Duellman, 1988; Oda et al., 2016). In our study we found tree species richness effects on Bioacoustic Index, suggesting that anuran and maybe also bird activity was positively related to two-species mixtures in the dry season and three-species mixtures in the rainy season.
The sensitivity of insects to land-use induced habitat and microclimatic changes could make them very suitable indicators for disturbance regimes in tropical forests (Akutsu et al., 2007; Campos-Cerqueira et al., 2020). These studies highlight the urgency for including insects into biodiversity assessments. While acoustic identification of insects in the tropics poses a significant challenge, acoustic indices can give valuable insights in temporal activity changes, and indicate changes in abundance and diversity (Oliveira et al., 2021). Thus, acoustic monitoring has great potential to become an important additional monitoring tool which is crucial particularly for tropical ecosystems (Lamarre et al., 2020). In our study, differences in microclimate among plots might be a result of the different tree species richness levels, that result from differences in above ground space use efficiency (Sapijanskas et al., 2014). Additionally, the failure of one tree species resulted in larger canopy openings of some plots, mainly the two-species mixture. If insects profit from canopy gaps this could explain why two-species mixture often showed the highest acoustic activity.
Conclusion
In this study we showed that planting polycultures increased orthopteran acoustic activity at night, and this may be related to an increase in abundance and maybe also richness of this taxonomic group. Given the small scale of the plots and the young age of the planation this would indicate that this animal group is most sensitive to these small scale habitat differences in our experimental forest plantation, making them important indicator species for monitoring ecosystem changes. Additional to direct effects of tree species richness and tree species identity, variations in microclimate most likely drive the observed differences in acoustic patterns across season and day phases. We have shown that ecoacoustics can provide valuable insights in studying the interaction between forest features, associated biodiversity and acoustic activity patterns in the tropics where these interactions are far less studied than in temperate regions.
Data Availability Statement
The raw data supporting the conclusions of this article will be made available by the authors, without undue reservation.
Author Contributions
SM, MS-L, and CP designed the study. SM analyzed the data with support from OM and LO and wrote the manuscript. All authors read, commented on, and approved the final version of the manuscript.
Funding
The research leading to these results has received funding from the Natural Science and Engineering Council of Canada, and Canada Research Chair Programme to CP, as well as site support from the Smithsonian Tropical Research Institute. SM and MS-L acknowledge funding through the Dr. Forest project, funded through the 2018–2019 BiodivERsA joint call for research proposals, under the BiodivERsA3 ERA-Net COFUND programme, and with the funding organisations DFG (Germany, grant number DFG 428795724), ANR (France), FWO (Belgium), FWF (Austria), and NCN (Poland). Audio recorders were purchased through a grant to MS-L within the DFG Priority Program 1374 “Infrastructure-Biodiversity-Exploratories” (SCHE 695/6-1), and re-used for this study. The article processing charge was funded by the University of Freiburg in the funding programme Open Access Publishing.
Conflict of Interest
The authors declare that the research was conducted in the absence of any commercial or financial relationships that could be construed as a potential conflict of interest.
Publisher’s Note
All claims expressed in this article are solely those of the authors and do not necessarily represent those of their affiliated organizations, or those of the publisher, the editors and the reviewers. Any product that may be evaluated in this article, or claim that may be made by its manufacturer, is not guaranteed or endorsed by the publisher.
Acknowledgments
This research would not have been possible without the immense dedication of those who coordinated and worked in the Sardinilla planted forest over the last years, in particular José Monteza the site manager, Lady Mancilla, the administrative assistant, and their fieldworkers. We are specifically grateful to José Monteza for setting up and maintaining the audio recorders and to Lady Mancilla for sending equipment back to Germany, dealing with customs and for her good spirit and support.
Supplementary Material
The Supplementary Material for this article can be found online at: https://www.frontiersin.org/articles/10.3389/fevo.2022.808589/full#supplementary-material
Footnotes
References
Aide, M. T., Hernández-Serna, A., Campos-Cerqueira, M., Acevedo-Charry, O., and Deichmann, L. J. (2017). Species richness (of insects) drives the use of acoustic space in the tropics. Remote Sens. 9:1096. doi: 10.3390/rs9111096
Akutsu, K., Khen, C. V., and Toda, M. J. (2007). Assessment of higher insect taxa as bioindicators for different logging-disturbance regimes in lowland tropical rain forest in Sabah, Malaysia. Ecol. Res. 22, 542–550. doi: 10.1007/s11284-006-0052-6
Ammer, C. (2019). Diversity and forest productivity in a changing climate. New Phytol. 221, 50–66. doi: 10.1111/nph.15263
Ampoorter, E., Barbaro, L., Jactel, H., Baeten, L., Boberg, J., Carnol, M., et al. (2020). Tree diversity is key for promoting the diversity and abundance of forest-associated taxa in Europe. Oikos 129, 133–146. doi: 10.1111/oik.06290
Becerra, J. X. (2015). On the factors that promote the diversity of herbivorous insects and plants in tropical forests. Proc. Natl. Acad. Sci. U.S.A. 112, 6098–6103. doi: 10.1073/pnas.1418643112
Boelman, N. T., Asner, G. P., Hart, P. J., and Martin, R. E. (2007). Multi-trophic invasion resistance in hawaii: bioacoustics, field surveys, and airborne remote sensing. Ecol. Appl. 17, 2137–2144. doi: 10.1890/07-0004.1
Bohada-Murillo, M., Castaño-Villa, G. J., and Fontúrbel, F. E. (2020). The effects of forestry and agroforestry plantations on bird diversity: a global synthesis. Land Degrad. Dev. 31, 646–654. doi: 10.1002/ldr.3478
Boullhesen, M., Vaira, M., Barquez, R. M., and Akmentins, M. S. (2021). Evaluating the efficacy of visual encounter and automated acoustic survey methods in anuran assemblages of the Yungas Andean forests of Argentina. Ecol. Indic. 127:107750. doi: 10.1016/j.ecolind.2021.107750
Bradfer-Lawrence, T., Gardner, N., Bunnefeld, L., Bunnefeld, N., Willis, S. G., and Dent, D. H. (2019). Guidelines for the use of acoustic indices in environmental research. Methods Ecol. Evol. 10, 1796–1807. doi: 10.1111/2041-210X.13254
Brooks, T. M., Mittermeier, R. A., Mittermeier, C. G., Da Fonseca, G. A. B., Rylands, A. B., Konstant, W. R., et al. (2002). Habitat loss and extinction in the hotspots of biodiversity. Conserv. Biol. 16, 909–923. doi: 10.1046/j.1523-1739.2002.00530.x
Brose, U. (2003). Bottom-up control of carabid beetle communities in early successional wetlands: mediated by vegetation structure or plant diversity? Oecologia 135, 407–413. doi: 10.1007/s00442-003-1222-7
Burivalova, Z., Purnomo Orndorff, S., Truskinger, A., Roe, P., and Game, E. T. (2021). The sound of logging: tropical forest soundscape before, during, and after selective timber extraction. Biol. Conserv. 254:108812. doi: 10.1016/j.biocon.2020.108812
Burivalova, Z., Purnomo Wahyudi, B., Boucher, T. M., Ellis, P., Truskinger, A., et al. (2019). Using soundscapes to investigate homogenization of tropical forest diversity in selectively logged forests. J. Appl. Ecol. 56, 2493–2504. doi: 10.1111/1365-2664.13481
Burivalova, Z., Towsey, M., Boucher, T., Truskinger, A., Apelis, C., Roe, P., et al. (2018). Using soundscapes to detect variable degrees of human influence on tropical forests in Papua New Guinea. Conserv. Biol. 32, 205–215. doi: 10.1111/cobi.12968
Buxton, R. T., Brown, E., Sharman, L., Gabriele, C. M., and McKenna, M. F. (2016). Using bioacoustics to examine shifts in songbird phenology. Ecol. Evol. 6, 4697–4710. doi: 10.1002/ece3.2242
Buxton, R. T., McKenna, M. F., Clapp, M., Meyer, E., Stabenau, E., Angeloni, L. M., et al. (2018). Efficacy of extracting indices from large-scale acoustic recordings to monitor biodiversity. Conserv. Biol. 32, 1174–1184. doi: 10.1111/cobi.13119
Campos-Cerqueira, M., Mena, J. L., Tejeda-Gómez, V., Aguilar-Amuchastegui, N., Gutierrez, N., and Aide, T. M. (2020). How does FSC forest certification affect the acoustically active fauna in Madre de Dios, Peru? Remote Sens. Ecol. Conserv. 6, 274–285. doi: 10.1002/rse2.120
Cardinale, B. J., Duffy, J. E., Gonzalez, A., Hooper, D. U., Perrings, C., Venail, P., et al. (2012). Biodiversity loss and its impact on humanity. Nature 486, 59–67. doi: 10.1038/nature11148
Carruthers-Jones, J., Eldridge, A., Guyot, P., Hassall, C., and Holmes, G. (2019). The call of the wild: investigating the potential for ecoacoustic methods in mapping wilderness areas. Sci. Total Environ. 695:133797. doi: 10.1016/j.scitotenv.2019.133797
Castagneyrol, B., and Jactel, H. (2012). Unraveling plant-animal diversity relationships: a meta-regression analysis. Ecology 93, 2115–2124.
Checa, M. F., Rodriguez, J., Willmott, K. R., and Liger, B. (2014). Microclimate variability significantly affects the composition, abundance and phenology of butterfly communities in a highly threatened neotropical dry forest. Florida Entomol. 97, 1–13. doi: 10.1653/024.097.0101
Coretta, S. (2021). tidymv: Tidy Model Visualisation for Generalised Additive Models. R package version 3.2.1. Available online at: https://cran.r-project.org/package=tidymv (accessed October 29, 2021).
Dröge, S., Martin, D. A., Andriafanomezantsoa, R., Burivalova, Z., Fulgence, T. R., Osen, K., et al. (2021). Listening to a changing landscape: acoustic indices reflect bird species richness and plot-scale vegetation structure across different land-use types in north-eastern Madagascar. Ecol. Indic. 120:106929. doi: 10.1016/j.ecolind.2020.106929
Duellman, W. E. (1988). Patterns of species diversity in anuran amphibians in the american tropics. Ann. Missouri Bot. Gard. 75, 79–104. doi: 10.2307/2399467
Ebeling, A., Rzanny, M., Lange, M., Eisenhauer, N., Hertzog, L. R., Meyer, S. T., et al. (2018). Plant diversity induces shifts in the functional structure and diversity across trophic levels. Oikos 127, 208–219. doi: 10.1111/oik.04210
Eldridge, A., Guyot, P., Moscoso, P., Johnston, A., Eyre-Walker, Y., and Peck, M. (2018). Sounding out ecoacoustic metrics: avian species richness is predicted by acoustic indices in temperate but not tropical habitats. Ecol. Indic. 95, 939–952. doi: 10.1016/j.ecolind.2018.06.012
Farina, A. (2014). Soundscape Ecology: Priniciples, Patterns, Methods and Applications, 1st Edn. New York, NY: Springer, doi: 10.1007/978-94-007-7374-5
Farina, A., and Gage, S. H. (eds) (2017). Ecoacoustics - The Ecological Role of Sounds. Hoboken, MJ: John Wiley & Sons, Inc.
Fontúrbel, F. E., Orellana, J. I., Rodríguez-Gómez, G. B., Tabilo, C. A., and Castaño-Villa, G. J. (2021). Habitat disturbance can alter forest understory bird activity patterns: a regional-scale assessment with camera-traps. For. Ecol. Manage. 479:118618. doi: 10.1016/j.foreco.2020.118618
Fuller, S., Axel, A. C., Tucker, D., and Gage, S. H. (2015). Connecting soundscape to landscape: which acoustic index best describes landscape configuration? Ecol. Indic. 58, 207–215. doi: 10.1016/j.ecolind.2015.05.057
Gage, S. H., and Axel, A. C. (2014). Visualization of temporal change in soundscape power of a michigan lake habitat over a 4-year period. Ecol. Inform. 21, 100–109. doi: 10.1016/j.ecoinf.2013.11.004
Gasc, A., Gottesman, B. L., Francomano, D., Jung, J., Durham, M., Mateljak, J., et al. (2018). Soundscapes reveal disturbance impacts: biophonic response to wildfire in the Sonoran Desert Sky Islands. Landsc. Ecol. 33, 1399–1415. doi: 10.1007/s10980-018-0675-3
Guillemot, J., Kunz, M., Schnabel, F., Fichtner, A., Madsen, C. P., Gebauer, T., et al. (2020). Neighbourhood-mediated shifts in tree biomass allocation drive overyielding in tropical species mixtures. New Phytol. 228, 1256–1268. doi: 10.1111/nph.16722
Hydrometeorology Management of ETESA (2017). Pronóstico Mensual de Lluvia. Available online at: http://www.hidromet.com.pa (accessed July 16, 2018).
IPBES (2019a). Global Assessment Report on Biodiversity and Ecosystem Services of the Intergovernmental Science-Policy Platform on Biodiversity and Ecosystem Services, eds E. S. Brondizio, J. Settele, S. Díaz, and H. T. Ngo (Bonn: IPBES secretariat), doi: 10.5281/zenodo.3831673
IPBES (2019b). Summary for Policymakers of the Global Assessment Report on Biodiversity and Ecosystem Services of the Intergovernmental Science-Policy Platform on Biodiversity and Ecosystem Services, eds S. Díaz et al. (Bonn: IPBES secretariat).
Jactel, H., Moreira, X., and Castagneyrol, B. (2021). Tree diversity and forest resistance to insect pests: patterns, mechanisms, and prospects. Annu. Rev. Entomol. 66, 277–296. doi: 10.1146/annurev-ento-041720-075234
Kunz, M., Fichtner, A., Härdtle, W., Raumonen, P., Bruelheide, H., and von Oheimb, G. (2019). Neighbour species richness and local structural variability modulate aboveground allocation patterns and crown morphology of individual trees. Ecol. Lett. 22, 2130–2140. doi: 10.1111/ele.13400
Lamarre, G. P. A., Fayle, T. M., Segar, S. T., Laird-Hopkins, B. C., Nakamura, A., Souto-Vilarós, D., et al. (2020). “Chapter Eight - Monitoring tropical insects in the 21st century,” in Tropical Ecosystems in the 21st Century, eds A. J. Dumbrell et al. (Cambridge, MA: Academic Press), 295–330. doi: 10.1016/bs.aecr.2020.01.004
Lewis, S., Wheeler, C., Mitchard, E., and Koch, A. (2019). Regenerate natural forests to store carbon. Nature 568, 25–28. doi: 10.1038/d41586-019-01026-8
Mammides, C., Goodale, E., Dayananda, S. K., Kang, L., and Chen, J. (2017). Do acoustic indices correlate with bird diversity? Insights from two biodiverse regions in Yunnan Province, south China. Ecol. Indic. 82, 470–477. doi: 10.1016/j.ecolind.2017.07.017
Metcalf, O. C., Barlow, J., Devenish, C., Marsden, S., Berenguer, E., and Lees, A. C. (2020). Acoustic indices perform better when applied at ecologically meaningful time and frequency scales. Methods Ecol. Evol. 12, 421–431. doi: 10.1111/2041-210X.13521
Moreno-Gómez, F. N., Bartheld, J., Silva-Escobar, A. A., Briones, R., Márquez, R., and Penna, M. (2019). Evaluating acoustic indices in the Valdivian rainforest, a biodiversity hotspot in South America. Ecol. Indic. 103, 1–8. doi: 10.1016/j.ecolind.2019.03.024
Ng, M.-L., Butler, N., and Woods, N. (2018). Soundscapes as a surrogate measure of vegetation condition for biodiversity values: a pilot study. Ecol. Indic. 93, 1070–1080. doi: 10.1016/j.ecolind.2018.06.003
Novotny, V., and Basset, Y. (2005). Host specificity of insect herbivores in tropical forests. Proc. R. Soc. B Biol. Sci. 272, 1083–1090. doi: 10.1098/rspb.2004.3023
Oda, F. H., Batista, V. G., Gambale, P. G., Mise, F. T., de Souza, F., Bellay, S., et al. (2016). Anuran species richness, composition, and breeding habitat preferences: a comparison between forest remnants and agricultural landscapes in Southern Brazil. Zool. Stud. 55:e34. doi: 10.6620/ZS.2016.55-34
Oliveira, E. G., Ribeiro, M. C., Roe, P., and Sousa-Lima, R. S. (2021). The caatinga orchestra: acoustic indices track temporal changes in a seasonally dry tropical forest. Ecol. Indic. 129:107897. doi: 10.1016/j.ecolind.2021.107897
Opaev, A., Gogoleva, S., Palko, I., Nguyen, V. T., and Rozhnov, V. (2021). Annual acoustic dynamics are associated with seasonality in a monsoon tropical forest in South Vietnam. Ecol. Indic. 122:107269. doi: 10.1016/j.ecolind.2020.107269
Paquette, A., Hector, A., Castagneyrol, B., Vanhellemont, M., Koricheva, J., Scherer-Lorenzen, M., et al. (2018). A million and more trees for science. Nat. Ecol. Evol. 2, 763–766. doi: 10.1038/s41559-018-0544-0
Pekin, B. K., Jung, J. H., Villanueva-Rivera, L. J., Pijanowski, B. C., and Ahumada, J. A. (2012). Modeling acoustic diversity using soundscape recordings and LIDAR-derived metrics of vertical forest structure in a neotropical rainforest. Landsc. Ecol. 27, 1513–1522. doi: 10.1007/s10980-012-9806-4
Perfecto, I., Vandermeer, J., Hanson, P., and Cartín, V. (1997). Arthropod biodiversity loss and the transformation of a tropical agro-ecosystem. Biodivers. Conserv. 6, 935–945. doi: 10.1023/A:1018359429106
Phillips, Y. F., Towsey, M., and Roe, P. (2018). Revealing the ecological content of long-duration audio-recordings of the environment through clustering and visualisation. PLoS One 13:e0193345. doi: 10.1371/journal.pone.0193345
Pijanowski, B. C., Farina, A., Gage, S. H., Dumyahn, S. L., and Krause, B. L. (2011). What is soundscape ecology? An introduction and overview of an emerging new science. Landsc. Ecol. 26, 1213–1232. doi: 10.1007/s10980-011-9600-8
Potts, S. G., Vulliamy, B., Dafni, A., Ne’eman, G., and Willmer, P. (2003). Linking bees and flowers: how do floral communities structure pollinator communities? Ecology 84, 2628–2642. doi: 10.1890/02-0136
Potvin, C., and Gotelli, N. J. (2008). Biodiversity enhances individual performance but does not affect survivorship in tropical trees. Ecol. Lett. 11, 217–223. doi: 10.1111/j.1461-0248.2007.01148.x
Potvin, C., Mancilla, L., Buchmann, N., Monteza, J., Moore, T., et al. (2011). An ecosystem approach to biodiversity effects: carbon pools in a tropical tree plantation. For. Ecol. Manage. 261, 1614–1624.
Rankin, L., and Axel, A. C. (2017). “Biodiversity assessment in tropical biomes using ecoacoustics: linking soundscape to forest structure in a human-dominated tropical dry forest in southern madagascar,” in Ecoacoustics - The Ecological Role of Sounds, eds A. Farina and S. H. Gage (Hoboken, MJ: John Wiley & Sons, Inc), 129–145. doi: 10.1002/9781119230724.ch8
Retamosa Izaguirre, M., Barrantes-Madrigal, J., Segura Sequeira, D., Spínola-Parallada, M., and Ramírez-Alán, O. (2021). It is not just about birds: what do acoustic indices reveal about a Costa Rican tropical rainforest? Neotrop. Biodivers. 7, 431–442. doi: 10.1080/23766808.2021.1971042
Ross, S. R., Friedman, N. R., Yoshimura, M., Yoshida, T., Donohue, I., and Economo, E. P. (2021). Utility of acoustic indices for ecological monitoring in complex sonic environments. Ecol. Indic. 121:107114. doi: 10.1016/j.ecolind.2020.107114
Sala, O. E., Chapin, F. S., Armesto, J. J., Berlow, E., Bloomfield, J., Dirzo, R., et al. (2000). Biodiversity - global biodiversity scenarios for the year 2100. Science 287, 1770–1774.
Sánchez-Giraldo, C., Correa Ayram, C., and Daza, J. (2021). Environmental sound as a mirror of landscape ecological integrity in monitoring programs. Perspect. Ecol. Conserv. 19, 319–328. doi: 10.1016/j.pecon.2021.04.003
Sapijanskas, J., Paquette, A., Potvin, C., Kunert, N., and Loreau, M. (2014). Tropical tree diversity enhances light capture through crown plasticity and spatial and temporal niche differences. Ecology 95, 2479–2492. doi: 10.1890/13-1366.1
Scarpelli, M. D. A., Ribeiro, M. C., Teixeira, F. Z., Young, R. J., and Teixeira, C. P. (2020). Gaps in terrestrial soundscape research: it’s time to focus on tropical wildlife. Sci. Total Environ. 707:135403. doi: 10.1016/j.scitotenv.2019.135403
Scherer-Lorenzen, M., Bonilla, J. L., and Potvin, C. (2007). Tree species richness affects litter production and decomposition rates in a tropical biodiversity experiment. Oikos 116, 2108–2124. doi: 10.1111/j.2007.0030-1299.16065.x
Scherer-Lorenzen, M., Potvin, C., Koricheva, J., Schmid, B., Hector, A., Bornik, Z., et al. (2005). “The design of experimental tree plantations for functional biodiversity research,” in Forest Diversity and Function. Temperate and Boreal Systems, eds M. Scherer-Lorenzen, C. Körner, and E.-D. Schulze (Berlin: Springer Berlin Heidelberg), 347–376. doi: 10.1007/3-540-26599-6_16
Shaw, T., Hedes, R., Sandstrom, A., Ruete, A., Hiron, M., Hedblom, M., et al. (2021). Hybrid bioacoustic and ecoacoustic analyses provide new links between bird assemblages and habitat quality in a winter boreal forest. Environ. Sustain. Indic. 11:100141. doi: 10.1016/j.indic.2021.100141
Siemann, E. (1998). Experimental tests of effects of plant productivity and diversity on grassland arthropod diversity. Ecology 79, 2057–2070.
Sueur, J., Farina, A., Gasc, A., Pieretti, N., and Pavoine, S. (2014). Acoustic indices for biodiversity assessment and landscape investigation. Acta Acust. United Acust. 100, 772–781. doi: 10.3813/AAA.918757
Sueur, J., Pavoine, S., Hamerlynck, O., and Duvail, S. (2008). Rapid acoustic survey for biodiversity appraisal. PLoS One 3:e4065. doi: 10.1371/journal.pone.0004065
Towsey, M. (2018). The Calculation of Acoustic Indices Derived From Long-Duration Recording of the Natural Environment. Available online at: https://eprints.qut.edu.au/110634/ (accessed November 27, 2020).
Towsey, M., Truskinger, A., Cottman-Fields, M., and Roe, P. (2018). Ecoacoustics Audio Analysis Software v18.03.0.41. doi: 10.5281/zenodo.1188744
Towsey, M., Zhang, L., Cottman-Fields, M., Wimmer, J., Zhang, J., and Roe, P. (2014). Visualization of long-duration acoustic recordings of the environment. Procedia Comput. Sci. 29, 703–712. doi: 10.1016/j.procs.2014.05.063
Tucker, D., Gage, S. H., Williamson, I., and Fuller, S. (2014). Linking ecological condition and the soundscape in fragmented Australian forests. Landsc. Ecol. 29, 745–758. doi: 10.1007/s10980-014-0015-1
Turner, A., Fischer, M., and Tzanopoulos, J. (2018). Sound-mapping a coniferous forest—perspectives for biodiversity monitoring and noise mitigation. PLoS One 13:e0189843. doi: 10.1371/journal.pone.0189843
van der Plas, F., Manning, P., Allan, E., Scherer-Lorenzen, M., Verheyen, K., Wirth, C., et al. (2016). Jack-of-all-trades effects drive biodiversity–ecosystem multifunctionality relationships in European forests. Nat. Commun. 7:11109. doi: 10.1038/ncomms11109
van der Plas, F., Ratcliffe, S., Ruiz-Benito, P., Scherer-Lorenzen, M., Verheyen, K., Wirth, C., et al. (2017). Continental mapping of forest ecosystem functions reveals a high but unrealised potential for forest multifunctionality. Ecol. Lett. 21, 31–42. doi: 10.1111/ele.12868
Walker, T. J. (1975a). Effects of temperature, humidity, and age on stridulatory rates in atlanticus Spp (orthoptera-tettigoniidae-decticinae). Ann. Entomol. Soc. Am. 68, 607–611.
Walker, T. J. (1975b). Effects of temperature on rates in poikilotherm nervous systems - evidence from calling songs of meadow katydids (orthoptera-tettigoniidae-orchelimum) and reanalysis of published data. J. Comp. Physiol. 101, 57–69.
Wang, C., Zhang, W., Li, X., and Wu, J. (2021). A global meta-analysis of the impacts of tree plantations on biodiversity. Glob. Ecol. Biogeogr. 00, 1–12 doi: 10.1111/geb.13440
Wickham, H. (2019). stringr: Simple, Consistent Wrappers for Common String Operations. R package version 1.4.0. Available online at: https://cran.r-project.org/package=stringr (accessed October 20, 2021).
Wood, S. N. (2011). Fast stable restricted maximum likelihood and marginal likelihood estimation of semiparametric generalized linear models. J. R. Stat. Soc. 73, 3–36.
Zhao, Z., Xu, Z., Bellisario, K., Zeng, R., Li, N., Zhou, W., et al. (2019). How well do acoustic indices measure biodiversity? Computational experiments to determine effect of sound unit shape, vocalization intensity, and frequency of vocalization occurrence on performance of acoustic indices. Ecol. Indic. 107:105588. doi: 10.1016/j.ecolind.2019.105588
Keywords: ecoacoustics, tree diversity experiment, high frequency cover, acoustic diversity, soundscape, temporal patterns
Citation: Müller S, Mitesser O, Oschwald L, Scherer-Lorenzen M and Potvin C (2022) Temporal Soundscape Patterns in a Panamanian Tree Diversity Experiment: Polycultures Show an Increase in High Frequency Cover. Front. Ecol. Evol. 10:808589. doi: 10.3389/fevo.2022.808589
Received: 03 November 2021; Accepted: 14 January 2022;
Published: 08 February 2022.
Edited by:
Susan Fuller, Queensland University of Technology, AustraliaReviewed by:
Jake L. Snaddon, University of Southampton, United KingdomPaul Roe, Queensland University of Technology, Australia
Copyright © 2022 Müller, Mitesser, Oschwald, Scherer-Lorenzen and Potvin. This is an open-access article distributed under the terms of the Creative Commons Attribution License (CC BY). The use, distribution or reproduction in other forums is permitted, provided the original author(s) and the copyright owner(s) are credited and that the original publication in this journal is cited, in accordance with accepted academic practice. No use, distribution or reproduction is permitted which does not comply with these terms.
*Correspondence: Sandra Müller, U2FuZHJhLm11ZWxsZXJAYmlvbG9naWUudW5pLWZyZWlidXJnLmRl