 Scott A. Hamilton*
 Dennis D. Murphy
- Center for California Water Resources Policy and Management, Sacramento, CA, United States
Correctly identifying the environmental factors that limit population growth and recovery of imperiled species is an essential element of any targeted conservation program. Abundance index values for delta smelt (Hypomesus transpacificus), an imperiled fish in the upper San Francisco Estuary, have exhibited substantial inter-annual variation and the population is now at historically low numbers. Drawing from conceptual ecological models, we developed and applied a new multivariate analytical technique that incorporates a fundamental characteristic of limiting environmental factors– recognition that certain factors influence abundance in certain seasons or years, but they may have no influence on the species’ performance at other times. We observe that delta smelt occasionally experience years with population size increases, despite their ongoing long-term downward trajectory in numbers. The differences in environmental conditions that occur in years that prompt different population responses can provide insight into the environmental factors that limit species recovery. Nine temporally and spatially explicit covariates emerged from analyses that explain changes in inter-annual delta smelt abundance indices. We contrast those environmental factors with the factors that influence occupancy because distinguishing and focusing conservation actions on factors affecting delta smelt performance, rather than occupancy, should lead to the implementation of management and habitat-restoration actions that are more likely to benefit the fish. We think that the approach taken in this study can be a model for other species where salient data are limited and information needs are pressing.
Introduction
Requisite to any successful conservation plan for an imperiled species is the ability of resource managers to identify its habitat and assess the quality of that habitat accurately. In employing pragmatism to overcome sparse data, a common default assumes that landscape areas that support higher densities of a particular species provide “better” habitat, and that a strategy for creating or restoring similar landscape circumstances and providing similar resource conditions elsewhere will benefit the species. But ecologists have long recognized that density can be a misleading indicator of habitat quality. Indeed density, survival, and reproductive success may not be positively correlated (Van Horne, 1983; Johnson, 2007). While multiple metrics have been used to measure habitat quality, for managers intent on conserving imperiled species there is need to identify the environmental conditions that maximize survival and reproductive success.
Since factors influencing occupancy may be unrelated to the performance of a species and a species’ performance may be influenced by factors unrelated to occupancy, determining the environmental-factor conditions associated with landscape occupancy alone can be insufficient to guide conservation planning. The task facing conservation planners therefore is challenging. In real world circumstances how should one go about identifying the environmental conditions that are essential for reproduction and survival, or that otherwise limit performance of a species, beyond the conditions that are associated with occupancy? In this manuscript we present an approach for eliciting that information by focusing on factors that limit abundance.
An annual fish that once occurred in extraordinary numbers, the narrowly endemic delta smelt (Hypomesus transpacificus) has been protected in the upper San Francisco Estuary under both federal and California state Endangered Species Acts for more than a quarter century. Although delta smelt have been the target of many millions of research dollars annually, ecological investigations have failed to provide effective guidance to a management agenda and restoration efforts intended to reverse its declining numbers. At this point, so few delta smelt apparently exist that they are now no longer observed in two general fish surveys in which they were once abundant (Polansky et al., 2019). Because delta smelt are hidden in turbid estuarine waters, inferences regarding their habitat and variation in habitat conditions must be drawn from measures of physical and biotic factors taken where and when delta smelt are sampled in trawler surveys.
Studies conducted previously have attempted to address a variety of management-relevant questions and employed a range of approaches in doing so. Abiotic factors have been used as proxies to represent habitat quality and to explain patterns of occupancy (Feyrer et al., 2007, 2011; Nobriga et al., 2008). A Bayesian changepoint analysis was employed to identify abrupt or unusual step changes or trend changes in abundance (Thomson et al., 2010), and multivariate autoregressive modeling was utilized in an effort to discern the environmental factors responsible for the declines of pelagic fish (Mac Nally et al., 2010). State-space modeling, which separates factors affecting detection from those affecting occupancy and performance, was the basis for two studies (Maunder and Deriso, 2011; Polansky et al., 2021), and a hierarchical multiple-regression approach distinguishing the effects of environmental factors acting directly on delta smelt from those acting indirectly through other factors (Miller et al., 2012). The results from the different analytical approaches have been inconsistent, even contradictory, creating uncertainty and confusion for conservation planners and resource managers seeking guidance from the best available scientific information.
Traditional additive models seek some contribution for each covariate each year and cannot capture the relevance of limiting factors without undertaking the challenging task of identifying and incorporating thresholds in the analysis (see Supplementary Appendix A). In this investigation we use available data to inform a new approach to understanding the limiting environmental factors that influence the abundance of delta smelt. The role of limiting factors – the environmental factors that control the size of a population in some years and seasons, but not others – in determining the trajectory of populations, has received little attention in conservation biology, but is an essential concept in the search for the causes of population declines in complex ecological circumstances (Cade et al., 1999; Dunham et al., 2002; Hamilton and Murphy, 2018).
To offer guidance to resource managers, we previously analyzed the co-occurrence of delta smelt with several environmental factors, developing “affinity functions” that identified adequate and inadequate environmental factor-condition ranges for delta smelt (Hamilton and Murphy, 2020). Those analyses showed that the factor conditions that are suitable for delta smelt change through its life-stages and that a large portion of the upper estuary experiences habitat conditions that are seasonally unsuitable to delta smelt, and individual delta smelt frequently occupy, actually are relegated to, landscape areas that provide inadequate habitat conditions with respect to one or more essential resources at least some of the time. Accordingly, in efforts to identify delta smelt habitat and determine its contribution to the species’ performance, analysts are challenged to differentiate between environmental factor conditions that determine the survival and reproduction of delta smelt from those that do not.
Despite the long-term decline in delta smelt numbers, in certain individual years in the available time-series data, delta smelt showed remarkable increases in an abundance index derived from survey returns, leading us to ask – What environmental conditions occurred in the years that exhibited increased delta smelt abundance that did not occur in years with decreased abundance? Are the factors that influence delta smelt performance the same ones that influence occupancy? By addressing those questions in appropriate spatial and temporal context across the delta smelt’s short life cycle, we distinguish the environmental-factor conditions that are associated with better performance by delta smelt, which in turn can help identify management and restoration actions that should benefit the species and promote its recovery.
Materials and Methods
The San Francisco Estuary is the largest of its kind along the North American Pacific Coast. Formed by the confluence of the Sacramento and San Joaquin rivers, the estuary drains a watershed that includes nearly 40% of California’s surface area (van Geen and Luoma, 1999; Sommer et al., 2007). The upper estuary is tidally influenced and has been greatly altered during the last two centuries. The dendritic sloughs and extensive marshlands that dominated the estuary before European settlement and the floodplains that surrounded it have been nearly completely replaced by agriculture and managed wetlands set behind fortified levees (Whipple et al., 2012). The endemic delta smelt and a community of other native fishes surviving in the estuary now exist in ecological circumstances that are dominated by non-native competitors and predators, particularly Mississippi silversides (Menidia audens), but also striped bass (Morone saxatilis) and American shad (Alosa sapidissima), embedded in highly altered food webs, and subject to ever-increasing anthropogenic disturbances.
To identify environmental factors that plausibly contribute to the performance of delta smelt we followed a sequence of analytical steps: (1) we developed a simple proxy measure for annual changes in the size of the delta smelt population, (2) we evaluated the distribution of delta smelt across its range in the upper estuary in 2-month increments during each year as a preliminary step to characterizing the physical and biotic conditions that delta smelt encounter in real time, (3) we identified candidate environmental factors from conceptual models and previous studies that could be expected to affect the performance of delta smelt and quantified covariates representing those environmental factors, and (4) recognizing high covariance among a number of environmental factors, we developed and applied a new multivariate analytical technique to identify the environmental factors that best explain the observed variance in delta smelt performance. That last step required the verification and validation procedures that are described below.
Measuring Annual Changes in the Performance of Delta Smelt
Seasonal fish surveys that sample delta smelt in the upper San Francisco Estuary generate abundance indices that can be used to investigate delta smelt responses to ambient environmental conditions. For the present analysis we engaged annual abundance index values from the Fall Midwater Trawl (FMWT), which has been conducted from September through December by the California Department of Fish and Wildlife since 1967. It provides time-series index values for the estuary’s fishes sampled from more than 100 survey stations. The characteristics of the FMWT, including its shortcomings as a census tool for delta smelt, have been addressed at length previously (see Moyle et al., 1992; U.S. Fish and Wildlife Service, 2004; Murphy and Weiland, 2019; Polansky et al., 2019). Monthly abundance indices are calculated by averaging catch per tow-pass for index stations in designated areas, multiplying the means by weighting factors for each area (a scalar based on water volume).
The metric used to gauge the performance of delta smelt in this study is the ratio of the FMWT index value in 1 year to the FMWT index value in the prior year, thus it captures the full delta smelt life cycle. For convenience, we refer to this metric as the abundance change ratio (ACR), recognizing that the fish surveys cannot be used to provide reliable census of the delta smelt population, but rather an “index” of abundance in each survey year (Polansky et al., 2019). We used ACR rather than the population growth rate (the change in population divided by the prior population) because the technique we employed required a metric that was always positive. We reviewed historic data on the abundance indices for delta smelt in the autumn and calculated the ACR, for the history of the FMWT Survey. To draw inference from noisy data, we binned the data into four categories – “excellent” years for delta smelt performance in which the ACR value exceeded 3, “good” years in which the delta smelt abundance index increased but to a lesser extent, with an ACR value between 1 and 3, “poor years” for delta smelt in which the ACR was between 0.5 and 1 and “very poor” years in which the ACR value was less than 0.5. We considered environmental conditions each year since the introduction of the Asian clam (Potamocorbula amurensis) in 1986. The proliferation of the clam has been assumed to have reset the food web and reduced the availability of phytoplankton and zooplankton in certain subregions of the upper estuary (Carlton et al., 1990; Feyrer et al., 2003). We ended the study period in 2014, after which delta smelt were so infrequent in the FMWT survey that catching or missing just one fish would influence the ACR value. For evaluation purposes we calculated the log of the ACR. We linearly transformed log(ACR) to provide an “ACR Index” ranging from 0 to 1, where 1 equates to a value that is a third higher than the maximum historical ACR and 0 equates to a value that is one third less than the minimum historical ACR. On this scale, numbers greater than 0.5 indicate an increase in the abundance index. The range of historic ACR values was expanded using the one-third scalar, recognizing that the years of best delta smelt performance historically might not be the best possible, and that the worst years historically might not be the worst possible. The selection of the one-third scalar was arbitrary.
Evaluating the Distribution of Delta Smelt
The upper San Francisco Estuary is environmentally diverse, with wide variability in environmental conditions, particularly in salinity and food availability, from east to west and from year to year. Within its geographic range, investigators have inferred that delta smelt can move considerable distances, presumably tracking suitable environmental conditions (see Table 1 and Hobbs et al., 2019). To quantify the physical and biotic conditions experienced by delta smelt at any given time requires disaggregation of the upper estuary into subregions. We delineated 10 subregions in the upper estuary informed by the seasonal distribution of delta smelt [and combining subregions identified in Merz et al. (2011)], ecological and hydrological variation across the range of delta smelt, and data availability (the number of fish survey stations and availability of environmental-factor data that varies across the upper estuary) (Figure 1).
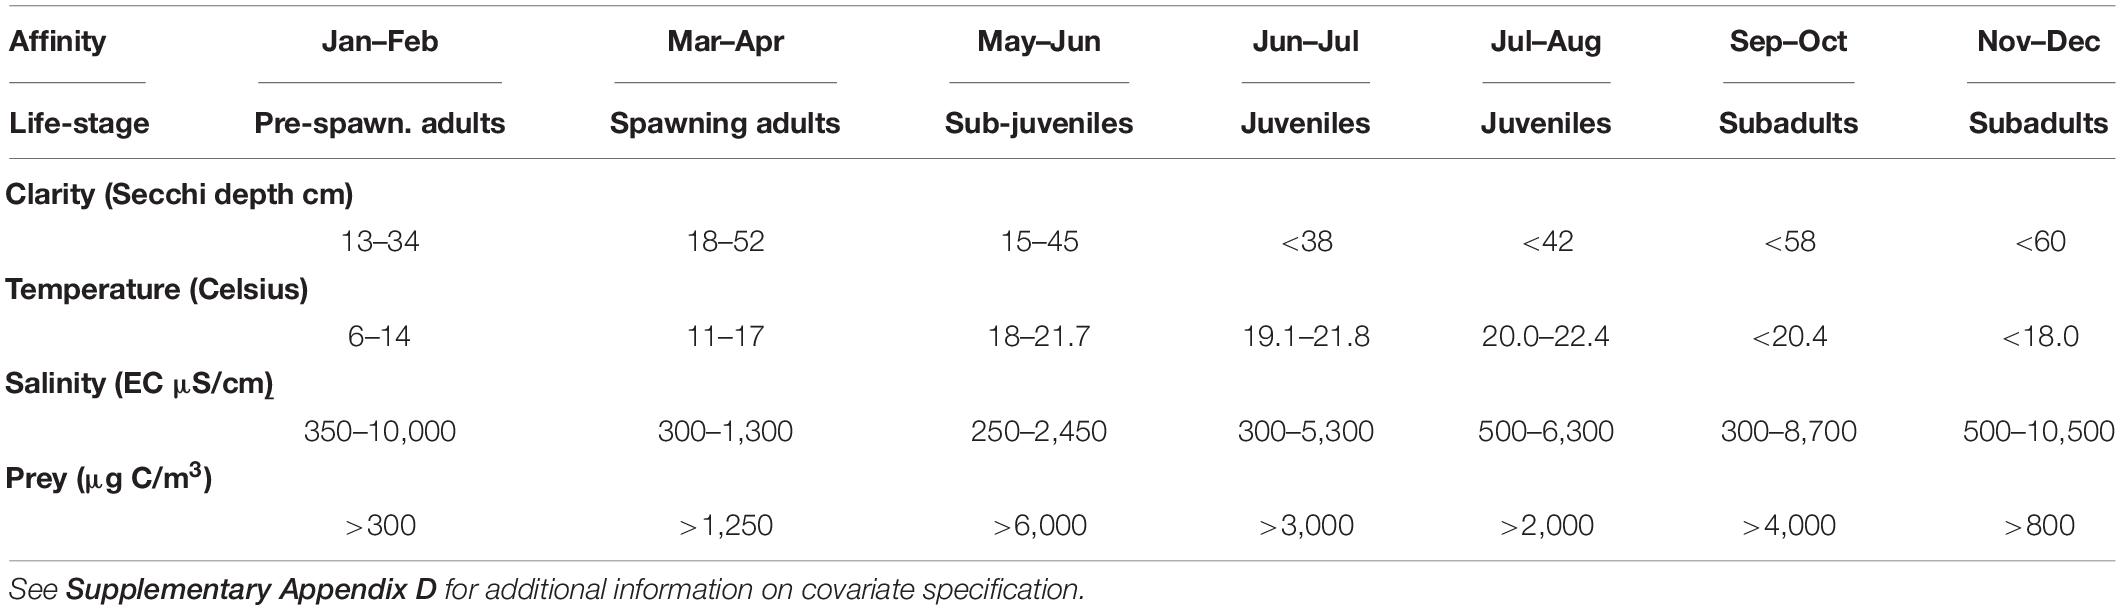
Table 1. Ranges of adequate conditions for four environmental factors that impact the distribution of delta smelt, drawn from occupancy studies in Hamilton and Murphy (2020).
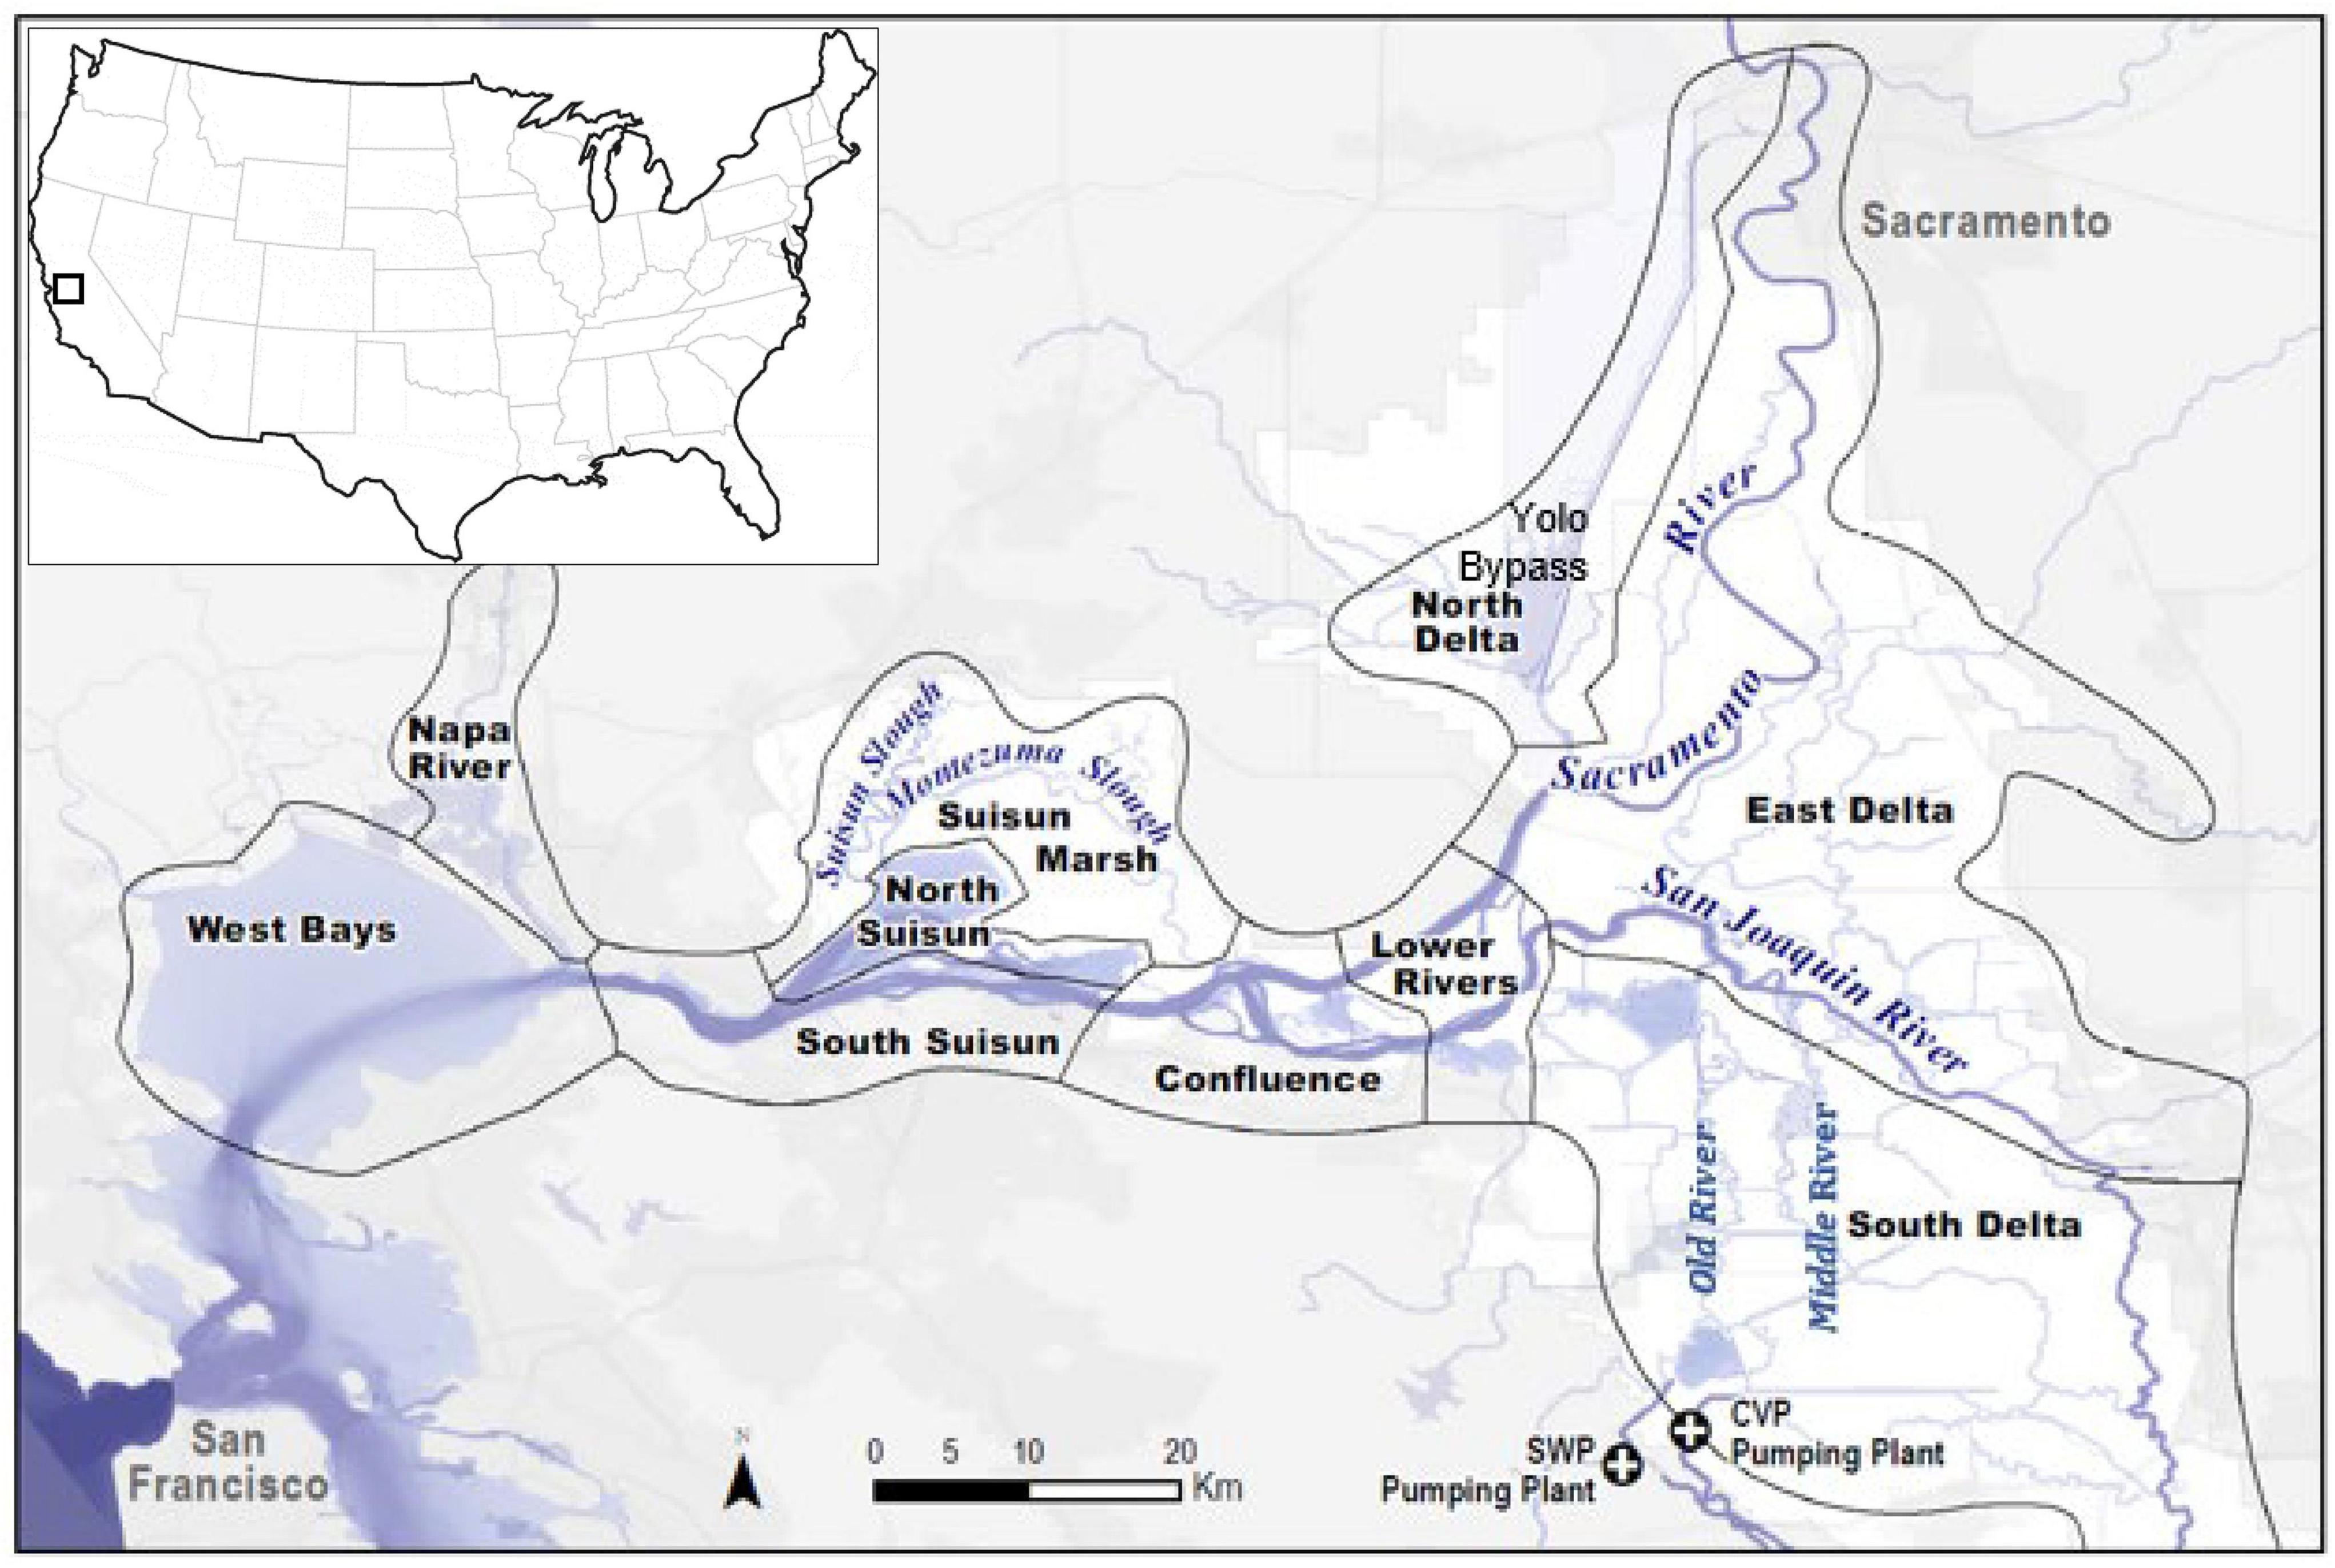
Figure 1. The upper San Francisco Estuary, including the Sacramento-San Joaquin Delta, and its subregions.
The distribution of delta smelt, along with data on co-occurring environmental factors, was drawn from publicly available, archived trawl-survey information gathered by the California Department of Fish and Wildlife. We used data from those fish surveys, delineating life stages as depicted in Table 2, to assess the distribution and local occurrences of delta smelt. The period represented for each life stage reflects the months when the life stage is most abundant. We developed abundance estimates by expanding the average catch density in each subregion by the volume of water in the top 4 m of the water bodies in each subregion (following Smith et al., 2018). The relative distribution of delta smelt was determined by calculating the percentage of delta smelt in each subregion over each 2-month period throughout the year.

Table 2. Delineation of the life stages used to examine delta smelt performance.
Selection and Specification of Candidate Covariates
To generate an initial list of candidate environmental factors and anthropogenic stressors that could be expected to affect delta smelt performance, we drew from a conceptual ecological model in an Interagency Ecological Program report (IEP MAST, 2015). We transformed the factors from the conceptual model into specifiable environmental covariates (Table 3 and Supplementary Appendix D). We excluded factors identified in the IEP conceptual model from our analysis if data were unavailable or if factors were duplicative (for example, weather factors).
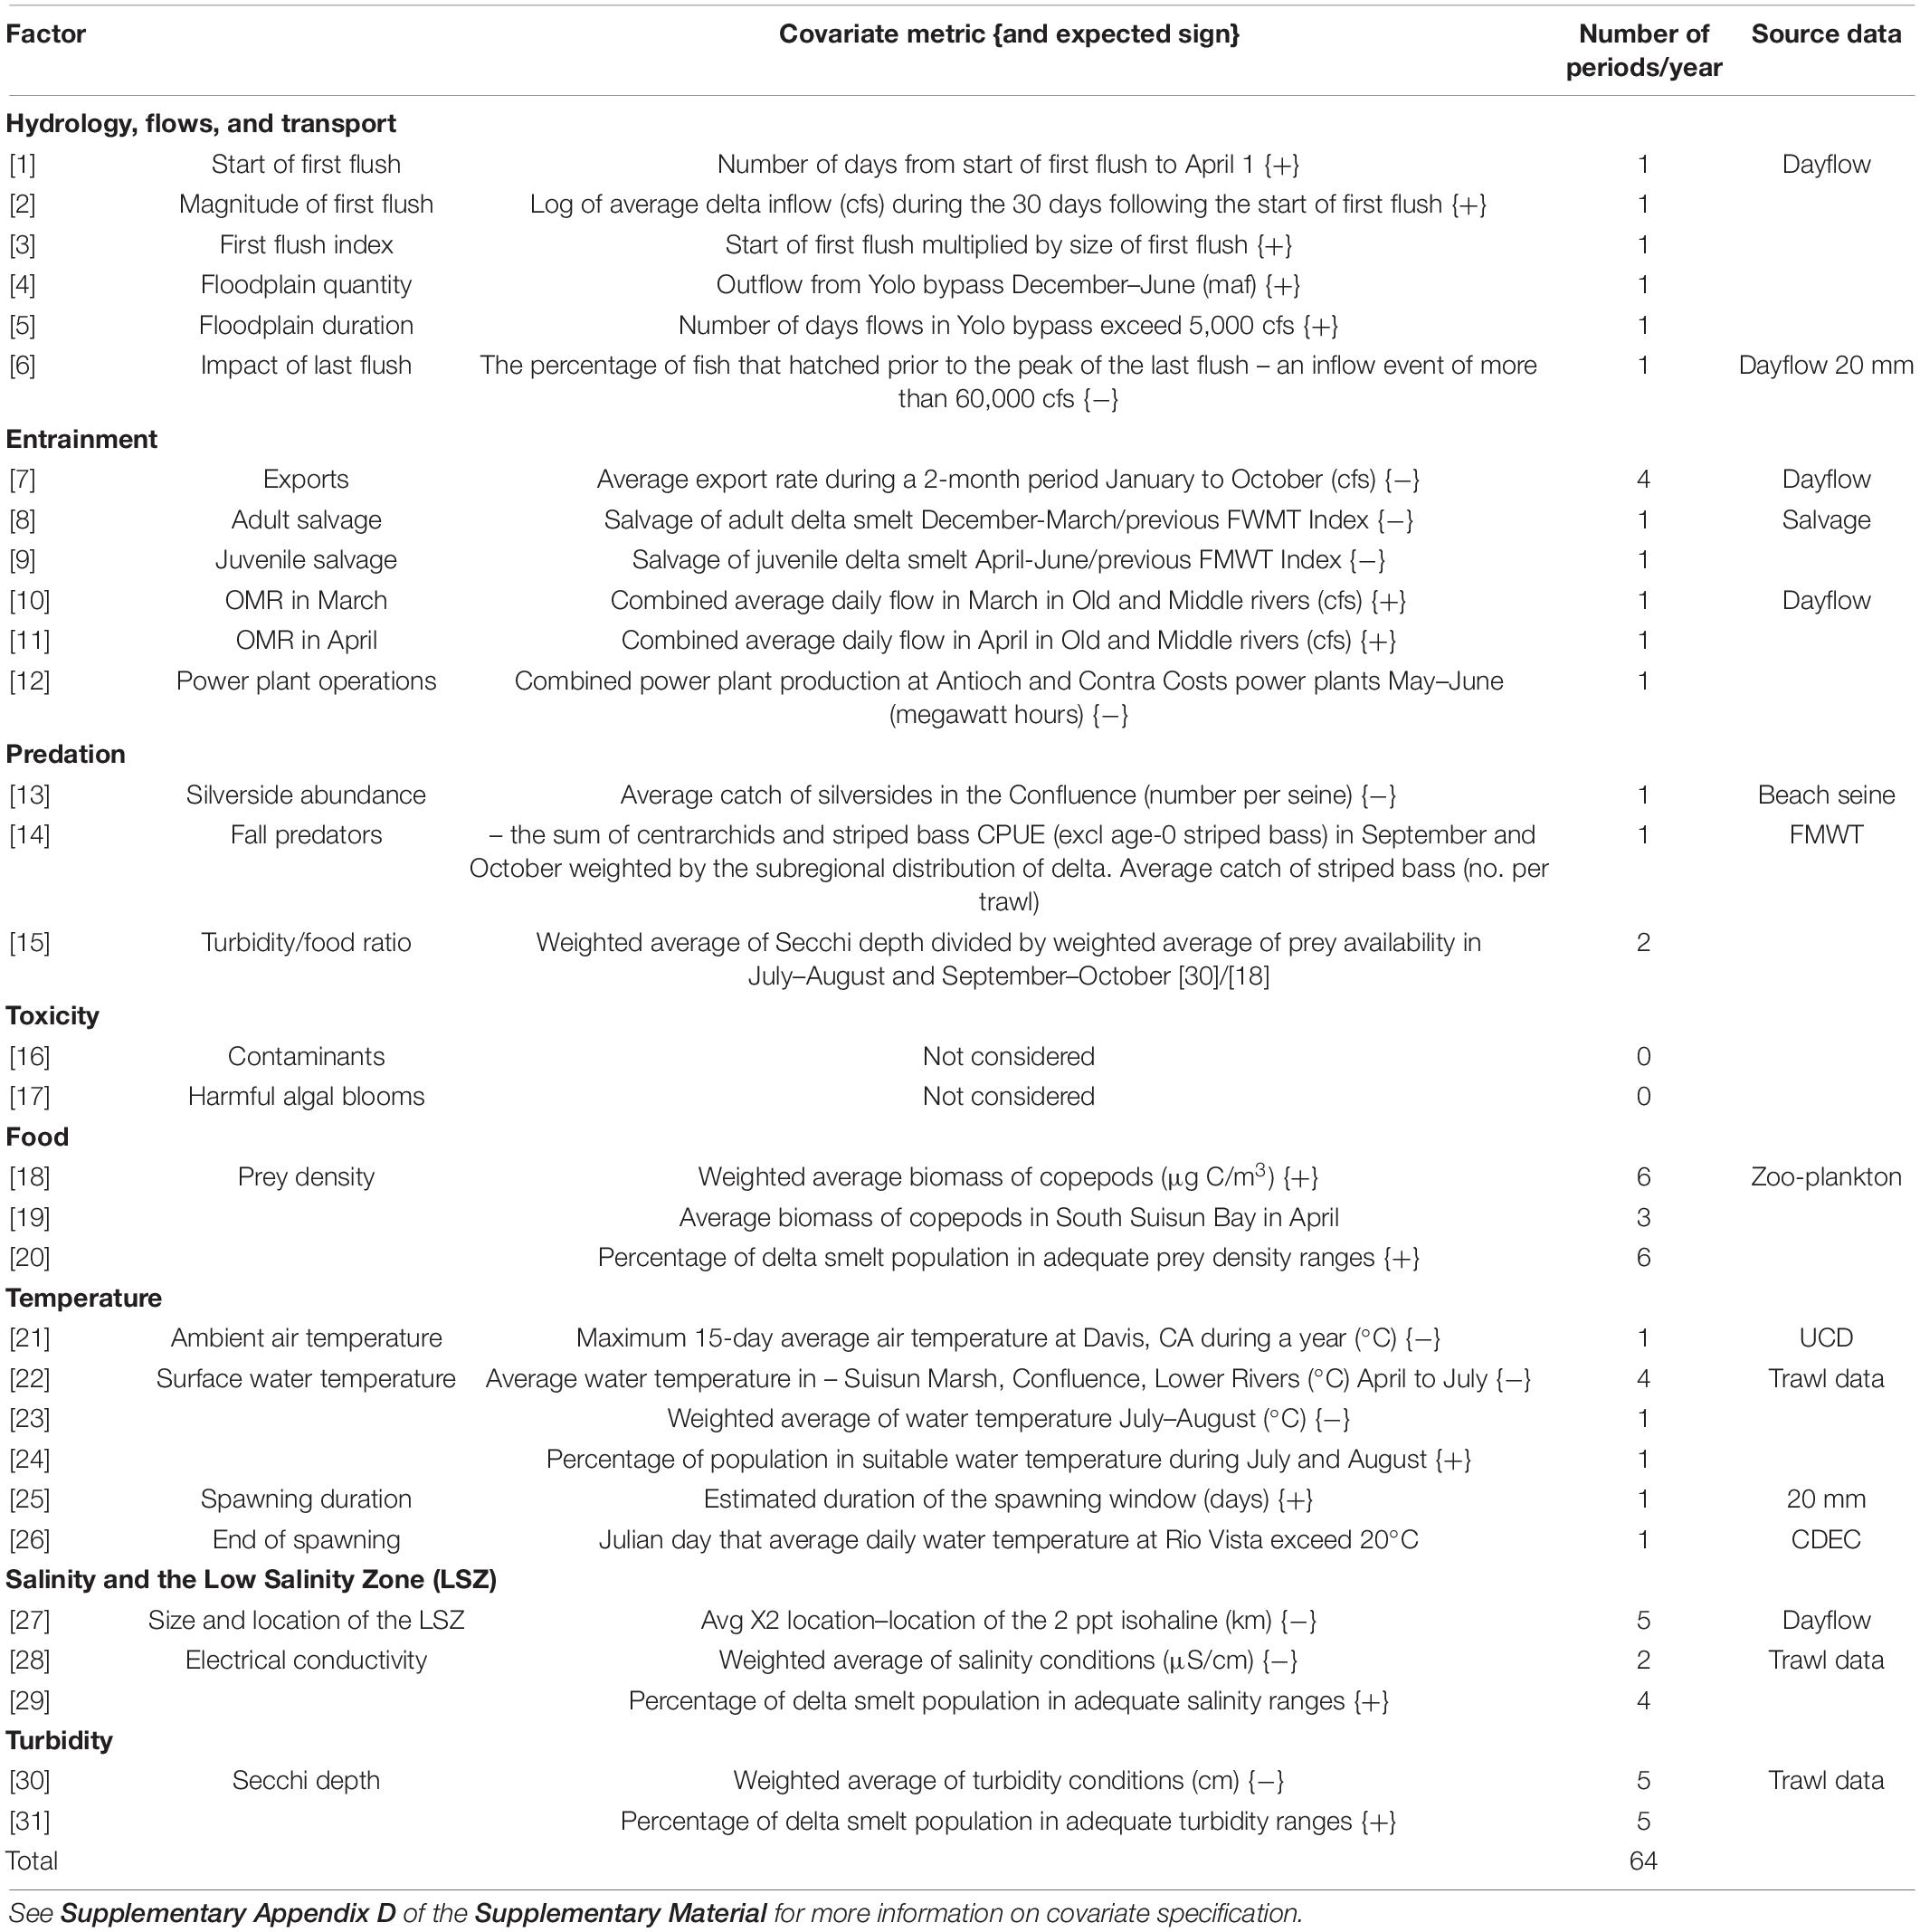
Table 3. Candidate covariates included in the analysis of factors that may influence population growth rate, represented as the abundance change ratio (ACR), the ratio of the abundance-index value in 1 year relative to the abundance-index value in the prior year.
Multivariate Analysis
A high level of covariation is apparent among some environmental factors. Accordingly, a strong statistical relationship between an individual environmental covariate and delta smelt performance may occur, not because the relationship is itself causal, rather because the covariate is correlated with another covariate that is causal. Additionally noteworthy, a relevant covariate may fail to appear relevant in a univariate analysis because it limits delta smelt abundance only some of the time. To identify combinations of covariates that have the greatest explanatory power, we conducted a multivariate analysis. In implementing the multivariate analysis, we sought a functional form that permits the expression of different types of relationships between environmental factors and delta smelt responses, including circumstances wherein: (1) environmental factors limit delta smelt performance only in certain years or seasons, (2) multiple factors limit delta smelt abundance during an individual life stage, (3) interactions between or among factors, for example, the co-occurrence of poor food conditions and poor turbidity conditions, have consequences greater than their additive impacts, and/or (4) threshold effects occur because factor conditions may exceed, or fall below, a certain level before they influence delta smelt abundance.
To enable these characteristics, we developed an approach derived from the theory of limiting factors (see Hamilton and Murphy, 2018). For any population or cohort, there is a (theoretical) maximum population size (In practice, the theoretical population potential is likely not observed within a study period). We constructed the ACR index for delta smelt to have a maximum value of 1, representing the maximum abundance change ratio during the study period multiplied by 1.33. The occurrence of “controlling” environmental factors throughout an organism’s life cycle interact to reduce potential maximum abundance of each life stage. By rescaling environmental factor values so that each has a range of zero to one, then multiplying them together, the maximum observed ACR is achieved when the index value of each of the factors is also equal to 1, that is, no factor is limiting.
To incorporate that limiting-factor approach into the analysis, we convert each environmental covariate and the independent variable into a range from 0 to 1. We began from the basic premise that delta smelt live for 1 year and that the delta smelt abundance index in year “y” (Ny) is determined by the interaction (the product) of the prior abundance index (Ny–1), recruitment into year y (Ry), and survival through each life stage (Sl,y).
There are four delta smelt life stages, therefore abundance at the end of year y would be calculated as:
and the ACR can be calculated by dividing both sides of the equation by Nt–1:
where π is the multiplicative operator. If necessary, covariates, for example water temperature, were rescaled so that covariate values were positively correlated with performance. The magnitude of the first seasonal flush and outflows through the Yolo Bypass floodway in the Delta portion of the upper estuary were converted to log forms. We then conducted an empirical, multivariate analysis to identify the set of covariates that provide the best explanation of variation in changes in the abundance indices. Given that many covariates were available, we used a linear response function to estimate the influence of each covariate on delta smelt survival and recruitment, to reduce the number of coefficients being estimated:
across all covariates, X, relevant to n factors affecting survival and m factors affecting recruitment in year y. By substituting Eqs [3, 4] into Eq. [2] we obtain the general form:
where p is the total number of factors affecting recruitment and survival. Because not all factors are limiting all of the time (αx + βxXx,y) should equal one when it is not influencing survival. This is achieved by taking the minimum of 1 and (αx + βxIx,y) such that:
and
Abundance change ratio for delta smelt, an r-selected species, can be very high (Reznick et al., 2002). To accommodate this characteristic, we transformed the ACR logarithmically and then linearly to obtain an ACR Index ranging from 0 to 1, so that the maximum value of both sides of Eq. [7] is one, reflecting the abundance potential. We then seek to explain variation in the ACR Index:
In this formulation, when a covariate does not add explanatory power, the solution routine will adjust α and β so that αx + βxX > 1, and X* will be set to 1 through the minimum function in Eq. [6]. This results in the covariate having no influence in determining the value of the predicted ACR Index (Supplementary Appendix A).
The estimated coefficients can be used to identify thresholds since a factor will have no influence when:
that is, when,
The arrays of α and β are estimated by finding values for them that reduce the residual sum of squares between the actual and predicted ACR Index values. A simplified demonstration of the technique is provided in Supplementary Appendix A. Rather than AIC, which provides no indication of how effectively a model explains variance, we used maximization of adjusted R2 as the model-selection criterion. The coefficients were estimated in Microsoft Excel using the generalized reduced-gradient, non-linear optimization routine, Solver, to minimize the residual sum of squares. To ensure that the approach could correctly identify influential covariates, we verified the approach by developing a synthetic data set of 50 covariates and examined conditions under which four influential covariates could be detected from among 46 random covariates (Supplementary Appendix B).
The identification of a preferred model began with 64 covariates being included as candidates in an initial formulation (see Table 3 for the list of covariates). Non-linear optimization requires starting values to be provided for the coefficients to be estimated. The process does not necessarily identify a global optimum, therefore different starting values were considered to improve the likelihood of identifying a global optimum. We use starting values ranging from 0.5 to 0.7 for α and 0.5 to 1.0 for β. The execution of the optimization routine typically results in the selection of a dozen or so covariates. Those not selected have X* values that are all equal to 1 (Eq. 6); they do not influence the estimated ACR in any year (Eq. 7). Some of the covariates that were selected were projected to influence abundance in only 1 year. Due to the risk of overfitting, these covariates were removed from consideration. The remaining covariates constitute a preliminary model. Covariates were sequentially removed from the preliminary model and the adjusted R2 noted. We experimented with different starting values and explored different specification of selected covariates The model with the highest adjusted R2 became the preferred model.
We performed a cross-validation analysis to validate the preferred model. We validated the preferred model by applying it to years outside of the data set and to an abundance change ratio developed for adults. We also compared our results to those from a traditional linear regression analysis. The details of these verification and validation procedures are described in Supplementary Material in Supplementary Appendix B.
To provide insight into the influence of each covariate on changes in abundance, we identified the number of years that each covariate in the preferred model was projected to constrain abundance – simply the number of X* values that are not equal to 1 – for each covariate. We also projected the potential impact of hypothetical conservation actions that could completely correct for environmental stressors. An average ACR can be calculated for each factor assuming it was no longer constraining the population by setting each X* value to 1 for all years. That calculated ACR can then be compared to the average ACR during the study period to project a percentage increase in abundance as a result of eliminating the stressor.
Frequently practitioners want to know at what point management actions should be initiated to prevent a population decline. Using Eq. 10, we identified the thresholds at which each covariate would begin to constrain delta smelt abundance. We compared that to the worst value of each limiting factor in years of excellent performance, acknowledging that not all values in years of excellent performance constrain the population. Based on the estimated threshold and a worst value in the years of excellent performance we identified the values at which environmental factor conditions likely impact delta smelt abundance, recognizing these as values that trigger concern.
Results
Delta Smelt Performance and Geographic Distribution
In examining the FMWT Index data, we identified 3 years of excellent delta smelt performance: 1993, 1995, and 2011, which had ACR values of 6.9, 8.8, and 11.8, respectively (Figure 2). In later analyses, to increase sample size, we also included 1980 in this category. While having no delta smelt abundance data available for the prior year, 1980 exhibited a record high abundance index with values three times higher than the three previous years for which data were available. In our data set, the ACR then was “excellent” in 4 years, was “good” in 9 years, was “poor” in 8 years, and was “very poor” in 8 years (Figure 3).
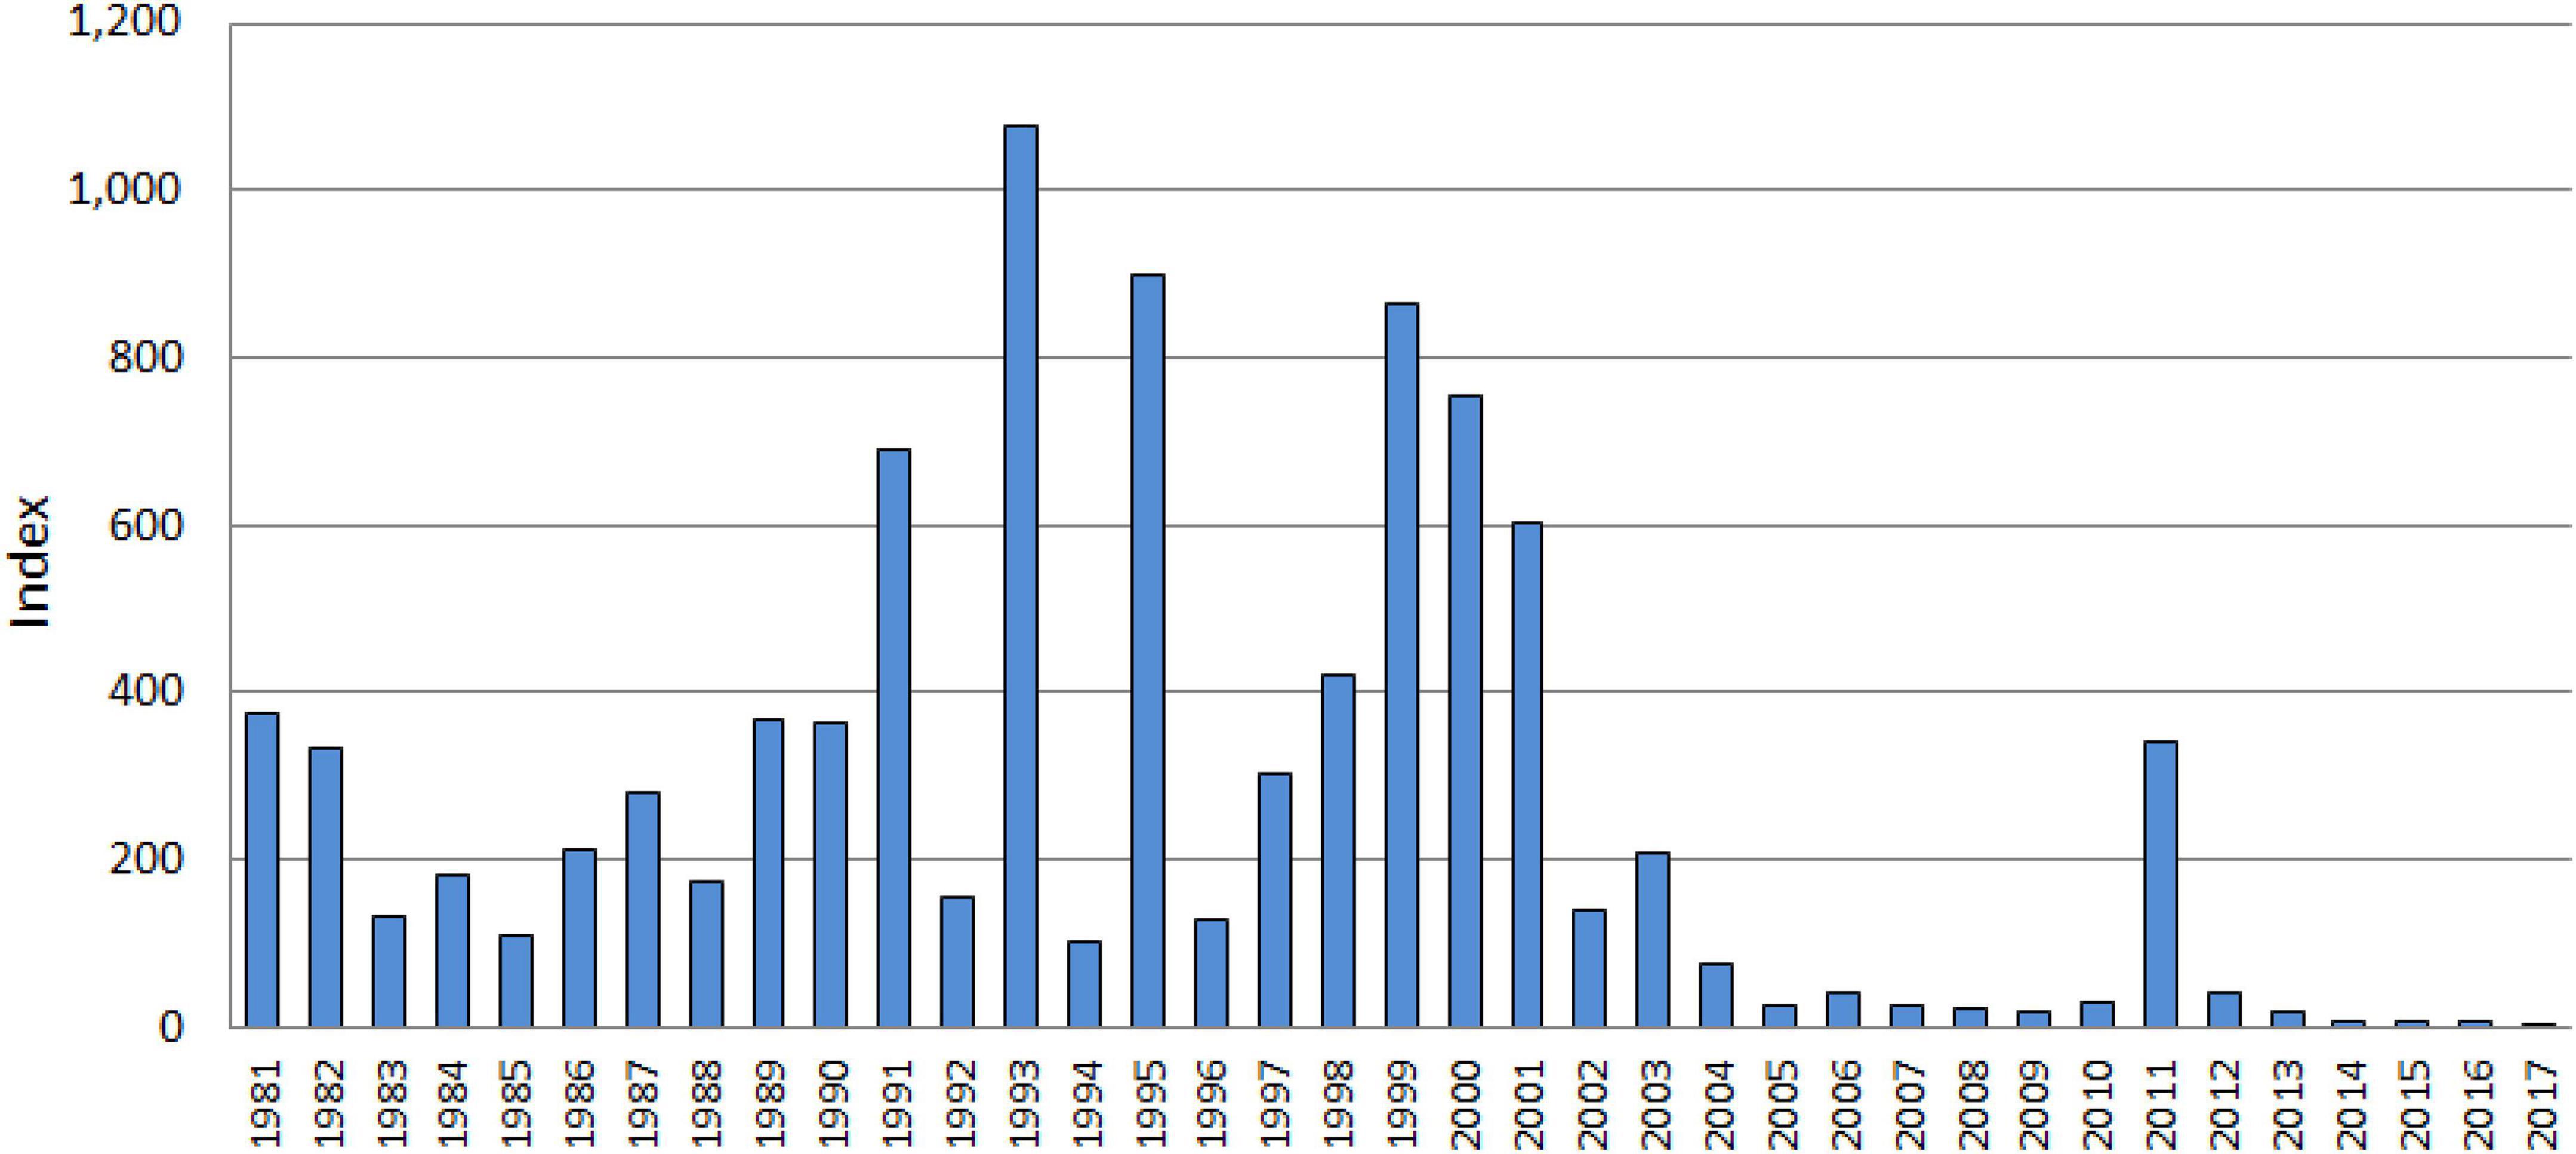
Figure 2. Abundance of delta smelt as assessed by the Fall Midwater Trawl Index 1981–2017.
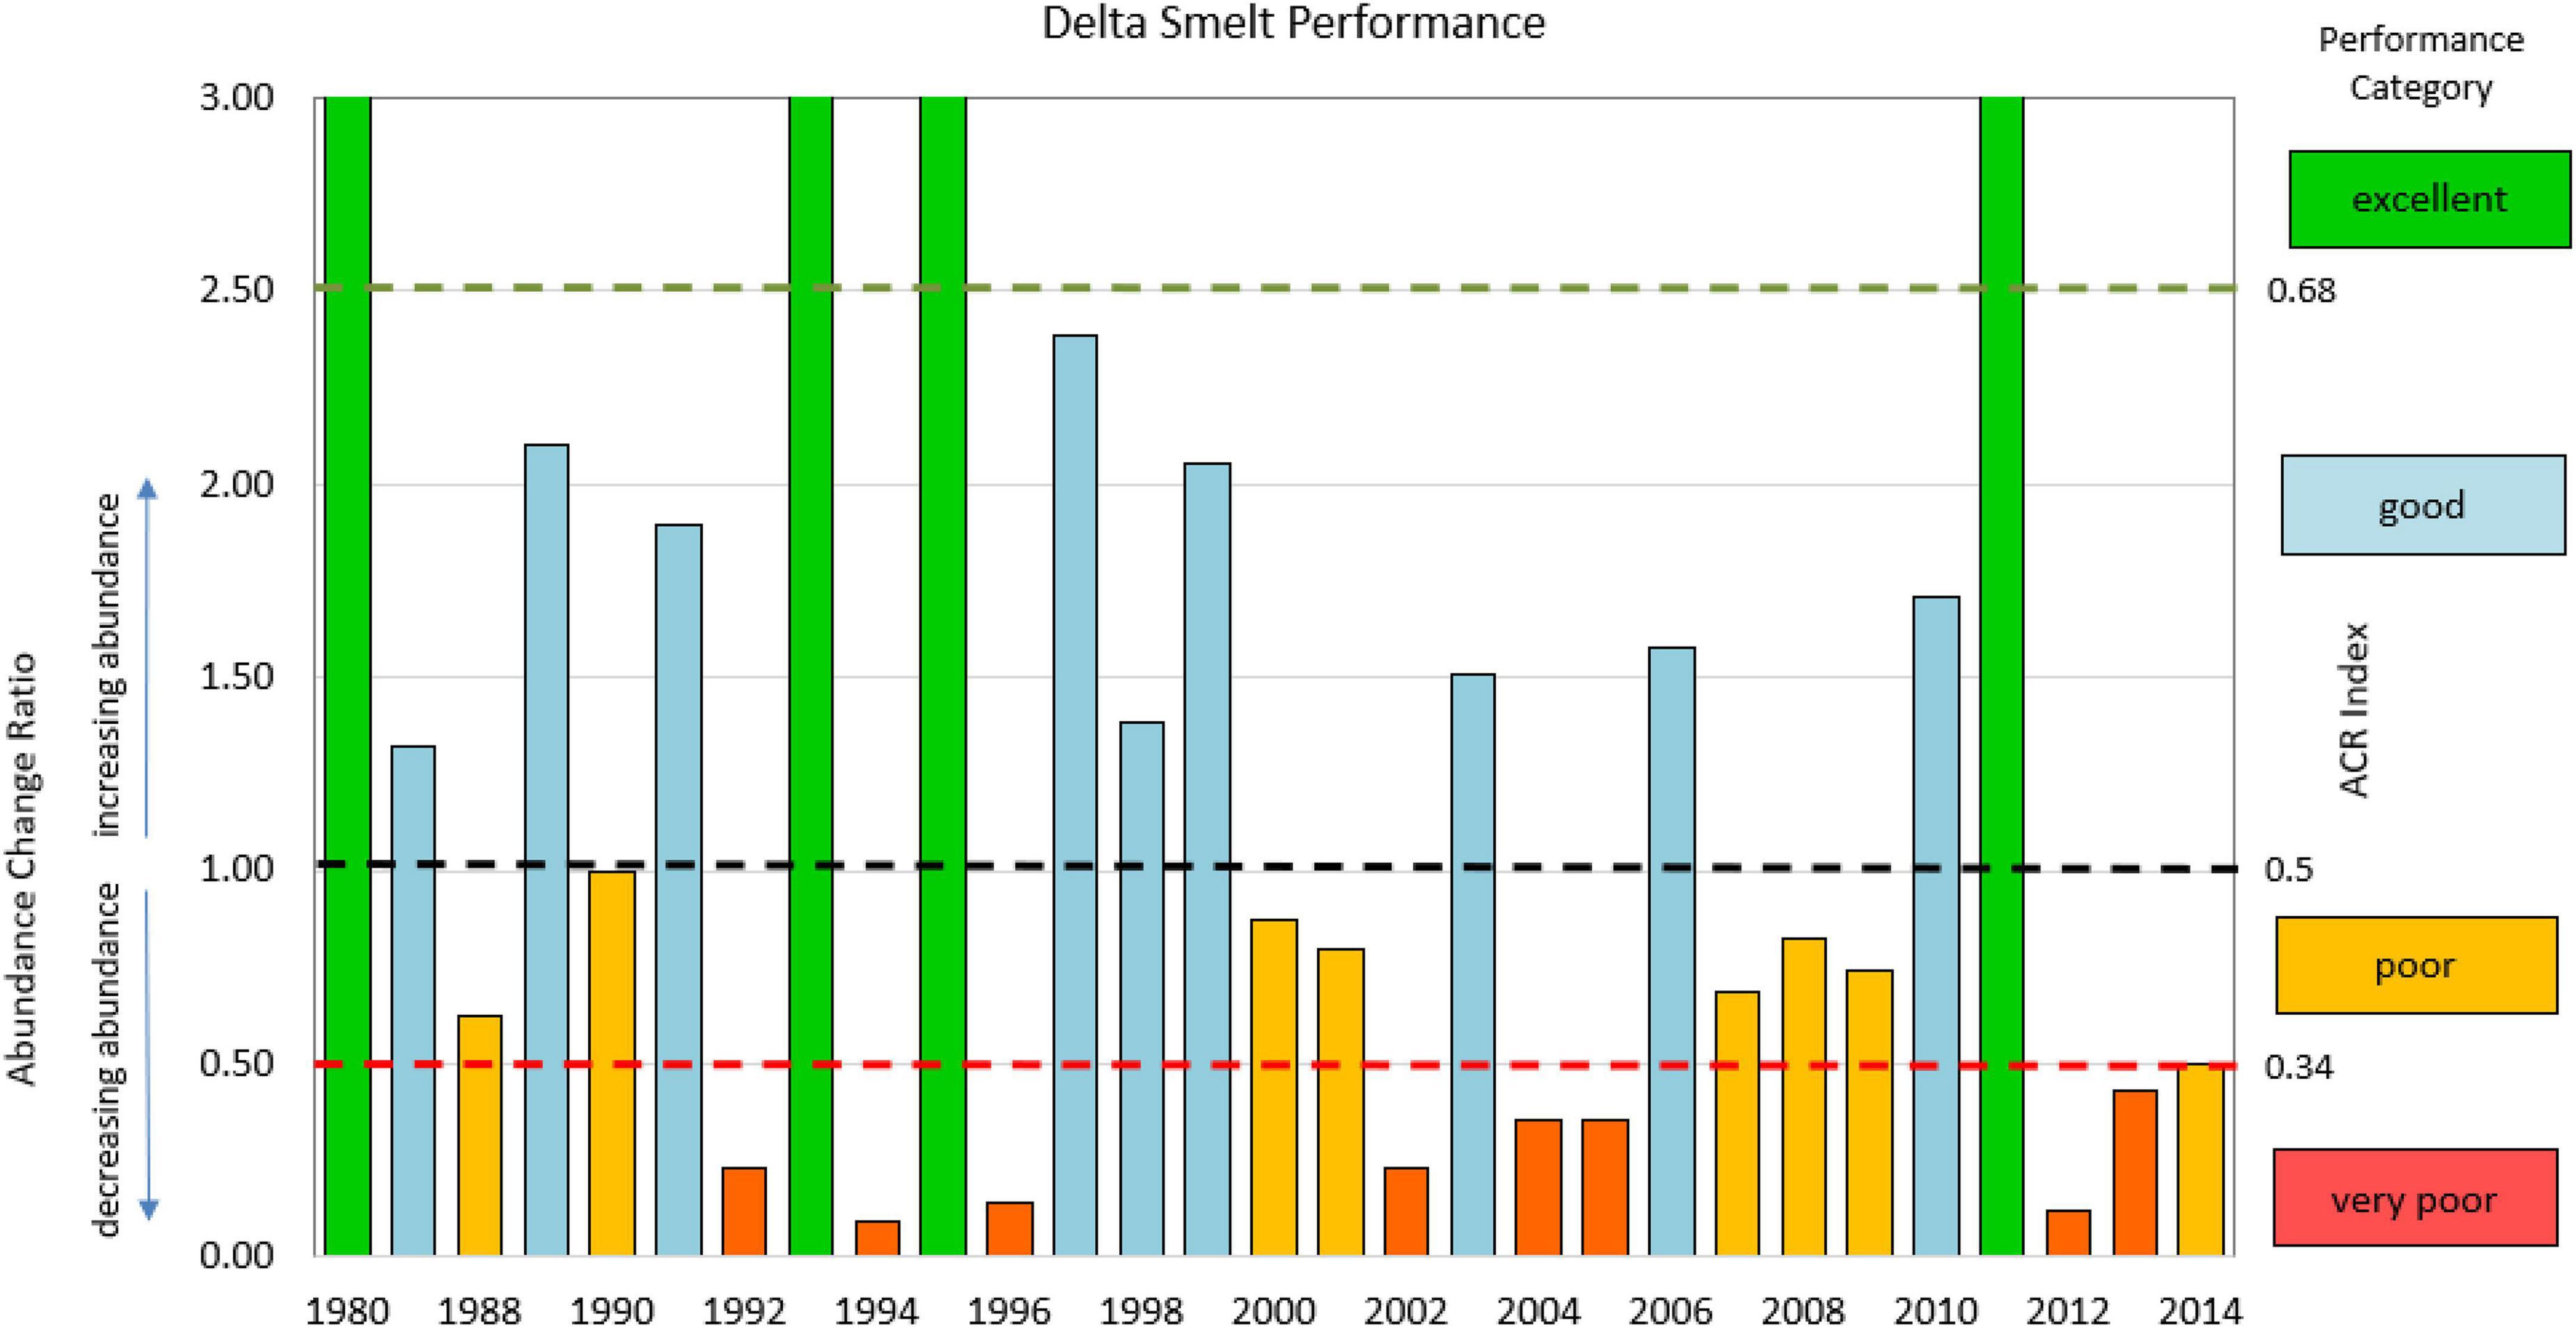
Figure 3. Abundance Change Ratio (ACR) for 1987 through 2014 identified by performance categories for delta smelt of excellent, good, poor, and very poor. Note that the Y-axis is truncated at 3.0. The years with excellent performance all have ACR values exceeding 6. Although no survey was conducted in 1979, 1980 is included because of its relation to abundance in 1976–1978.
In each of the years with excellent performance, the majority of delta smelt were found in Suisun Bay and Confluence subregions from November through August, with an apparent shift in distribution from Suisun Marsh to South Suisun in April through August (Figure 4). In the years with very poor performance, the population was distributed more easterly with greater percentages of delta smelt in the Confluence, Lower Rivers, and North Delta.
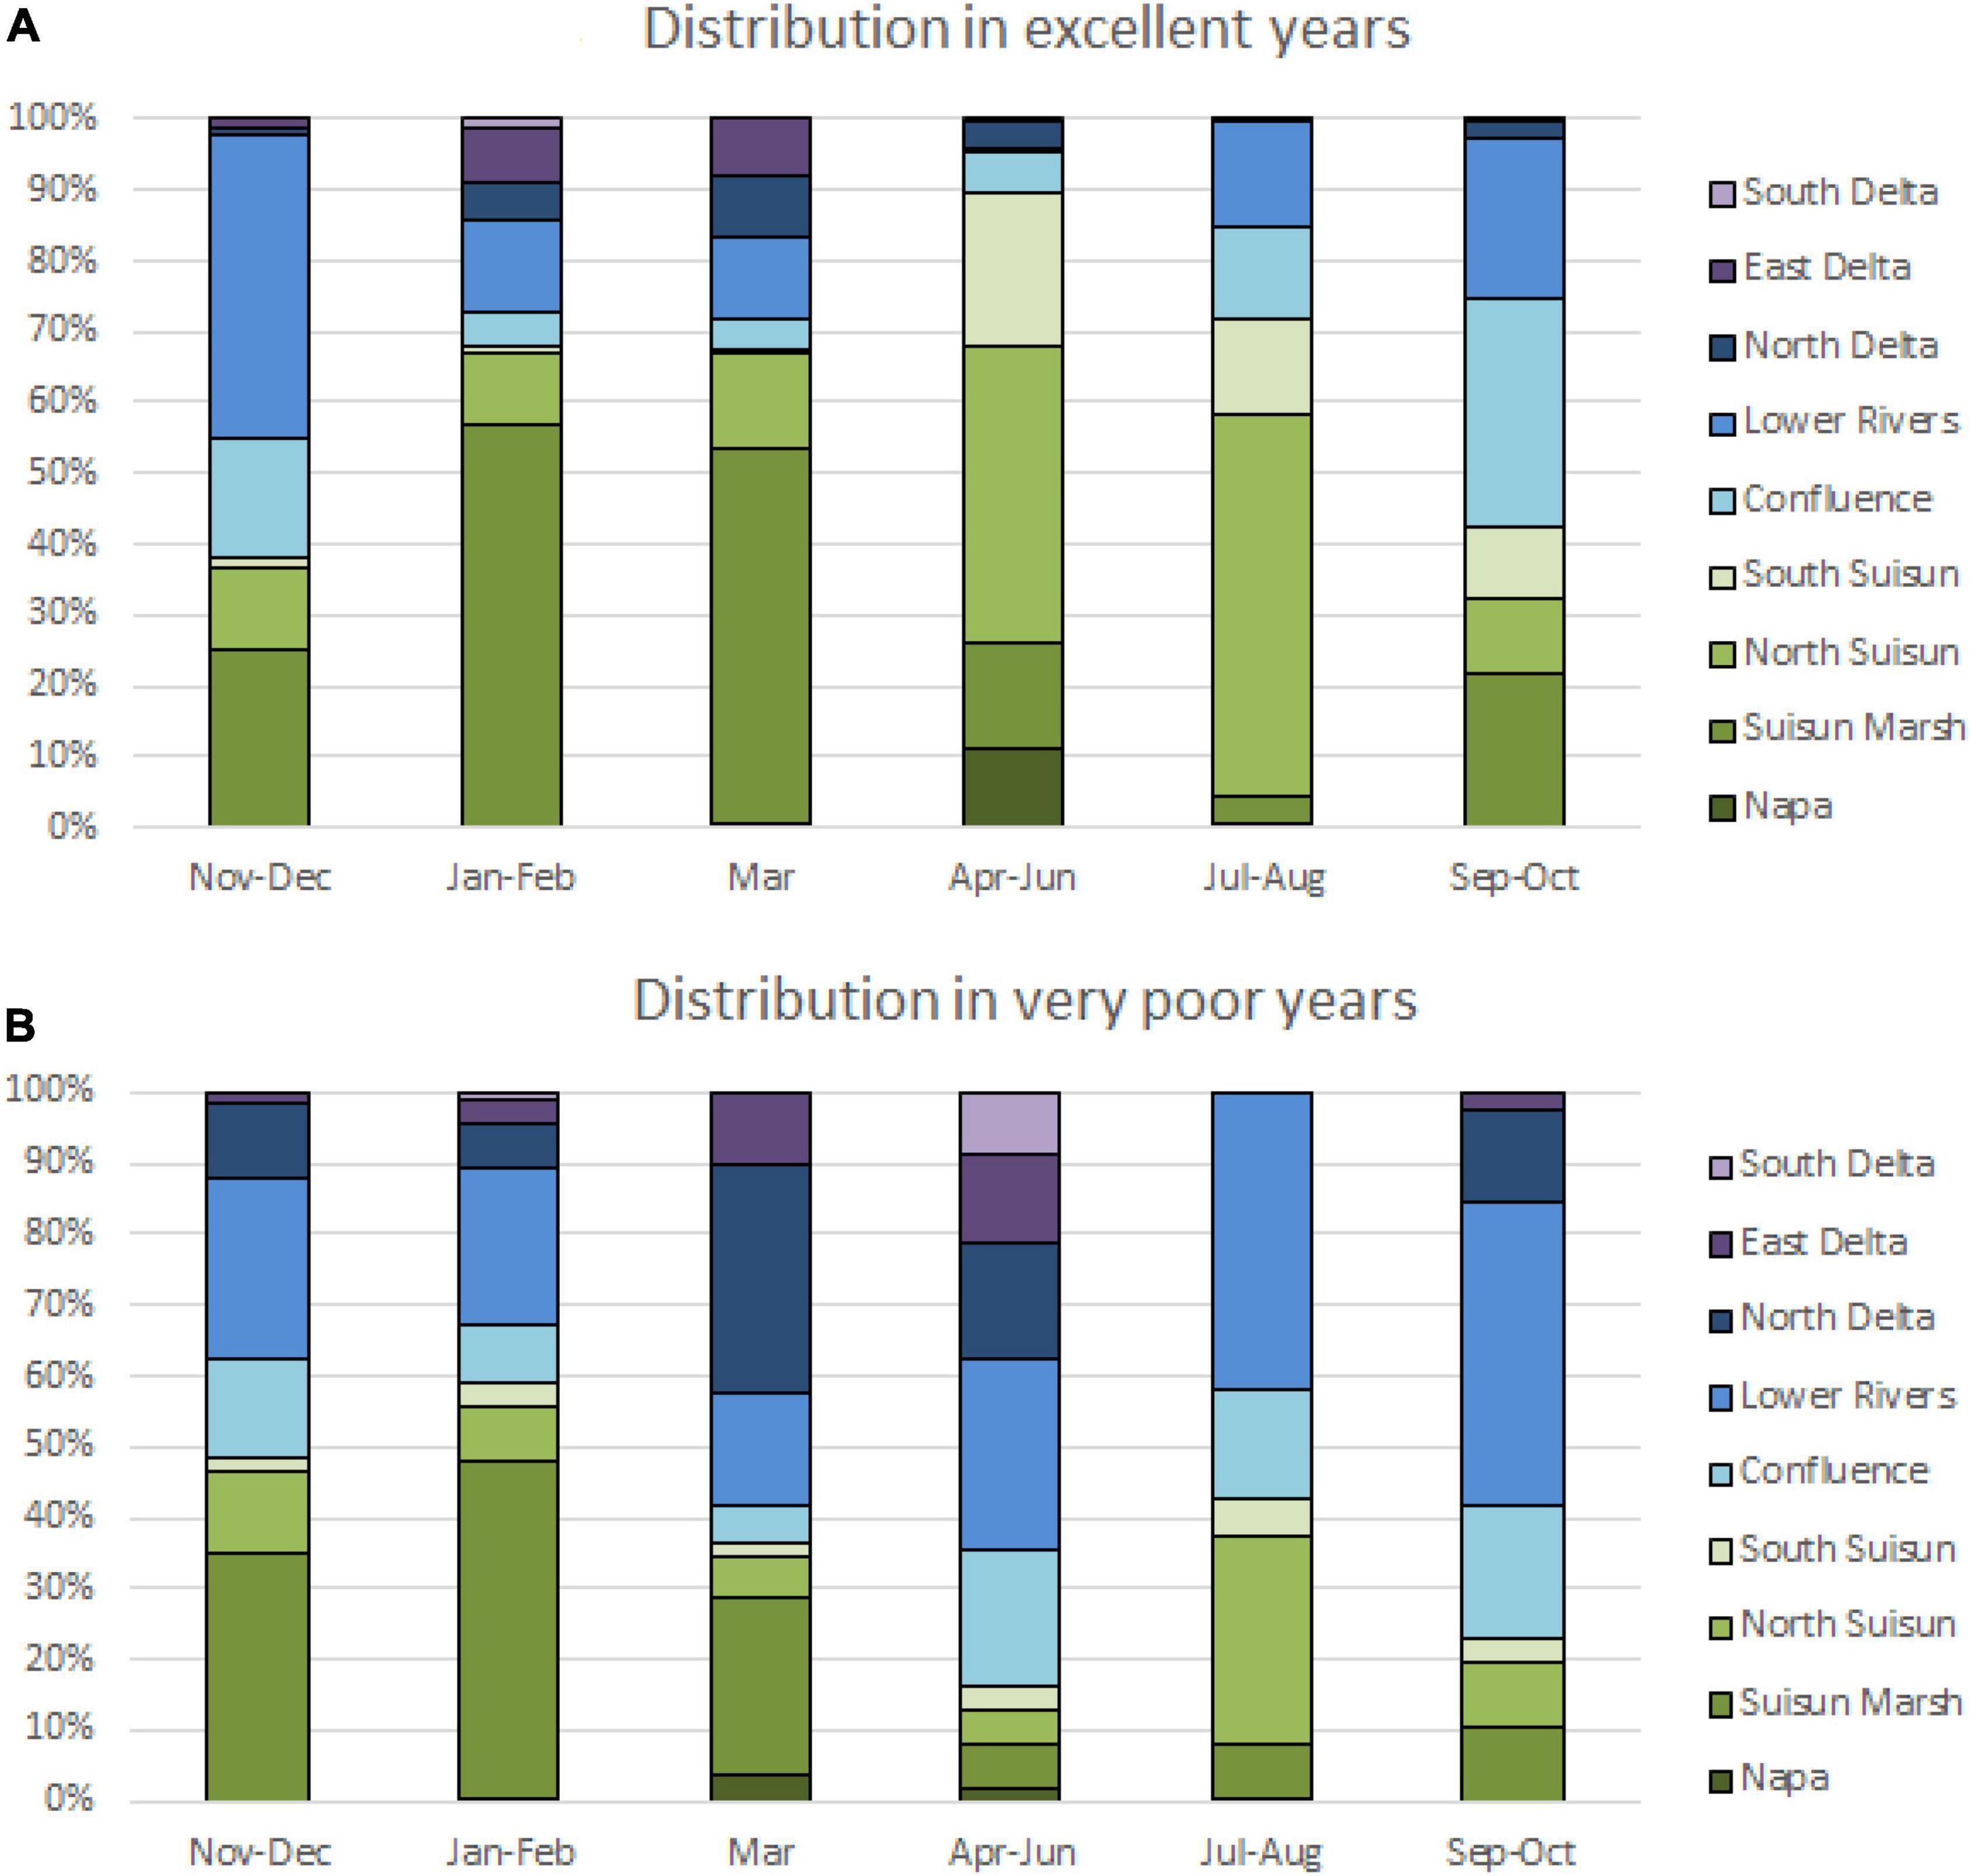
Figure 4. Average distribution of delta smelt by months in years of excellent performance (A) and very poor performance (B) with western subregions shown in shades of green and eastern subregions shown in shades of blue and purple.
Multivariate Analysis
A challenge to understanding how environmental factors influence the performance of delta smelt is the large potential number of covariates, many of which may be correlated, presumptively due to a limited number of environmental drivers in the estuary. In conducting the multivariate analysis and in estimating α and β for each covariate (see Eqs [7, 8]), the 64 covariates were reduced to smaller sets of covariates, in which some covariates influenced abundance in only 1 year, therefore were removed from the solution set. After considering different starting values and different combinations of covariates, the model with the highest adjusted R2, which had nine covariates, was selected as the preferred model (Table 4). Of the nine covariates, two were related to Delta inflow. Higher inflow to the Delta early in the season is associated with increased delta smelt numbers in survey samples, while higher inflow late in the season may transport recently hatched delta smelt into areas of the upper estuary with unsuitable environmental conditions. Two covariates were related to food availability; for larval delta smelt in the spring and for juveniles in the summer. One covariate considered the interaction of turbidity and food availability for subadults in the fall, where high turbidity and high food availability were associated with increased performance. Two covariates were included that related to water temperature – in the spring as it likely influences the duration of spawning and in summer increasing stress. More information on the biological bases of these results and comparisons with other studies are presented in Supplementary Appendix C. Power plant production in the spring was negatively associated with performance of delta smelt. Suspected influences were direct entrainment and increases in water temperature (Matica and Sommer, 2005).
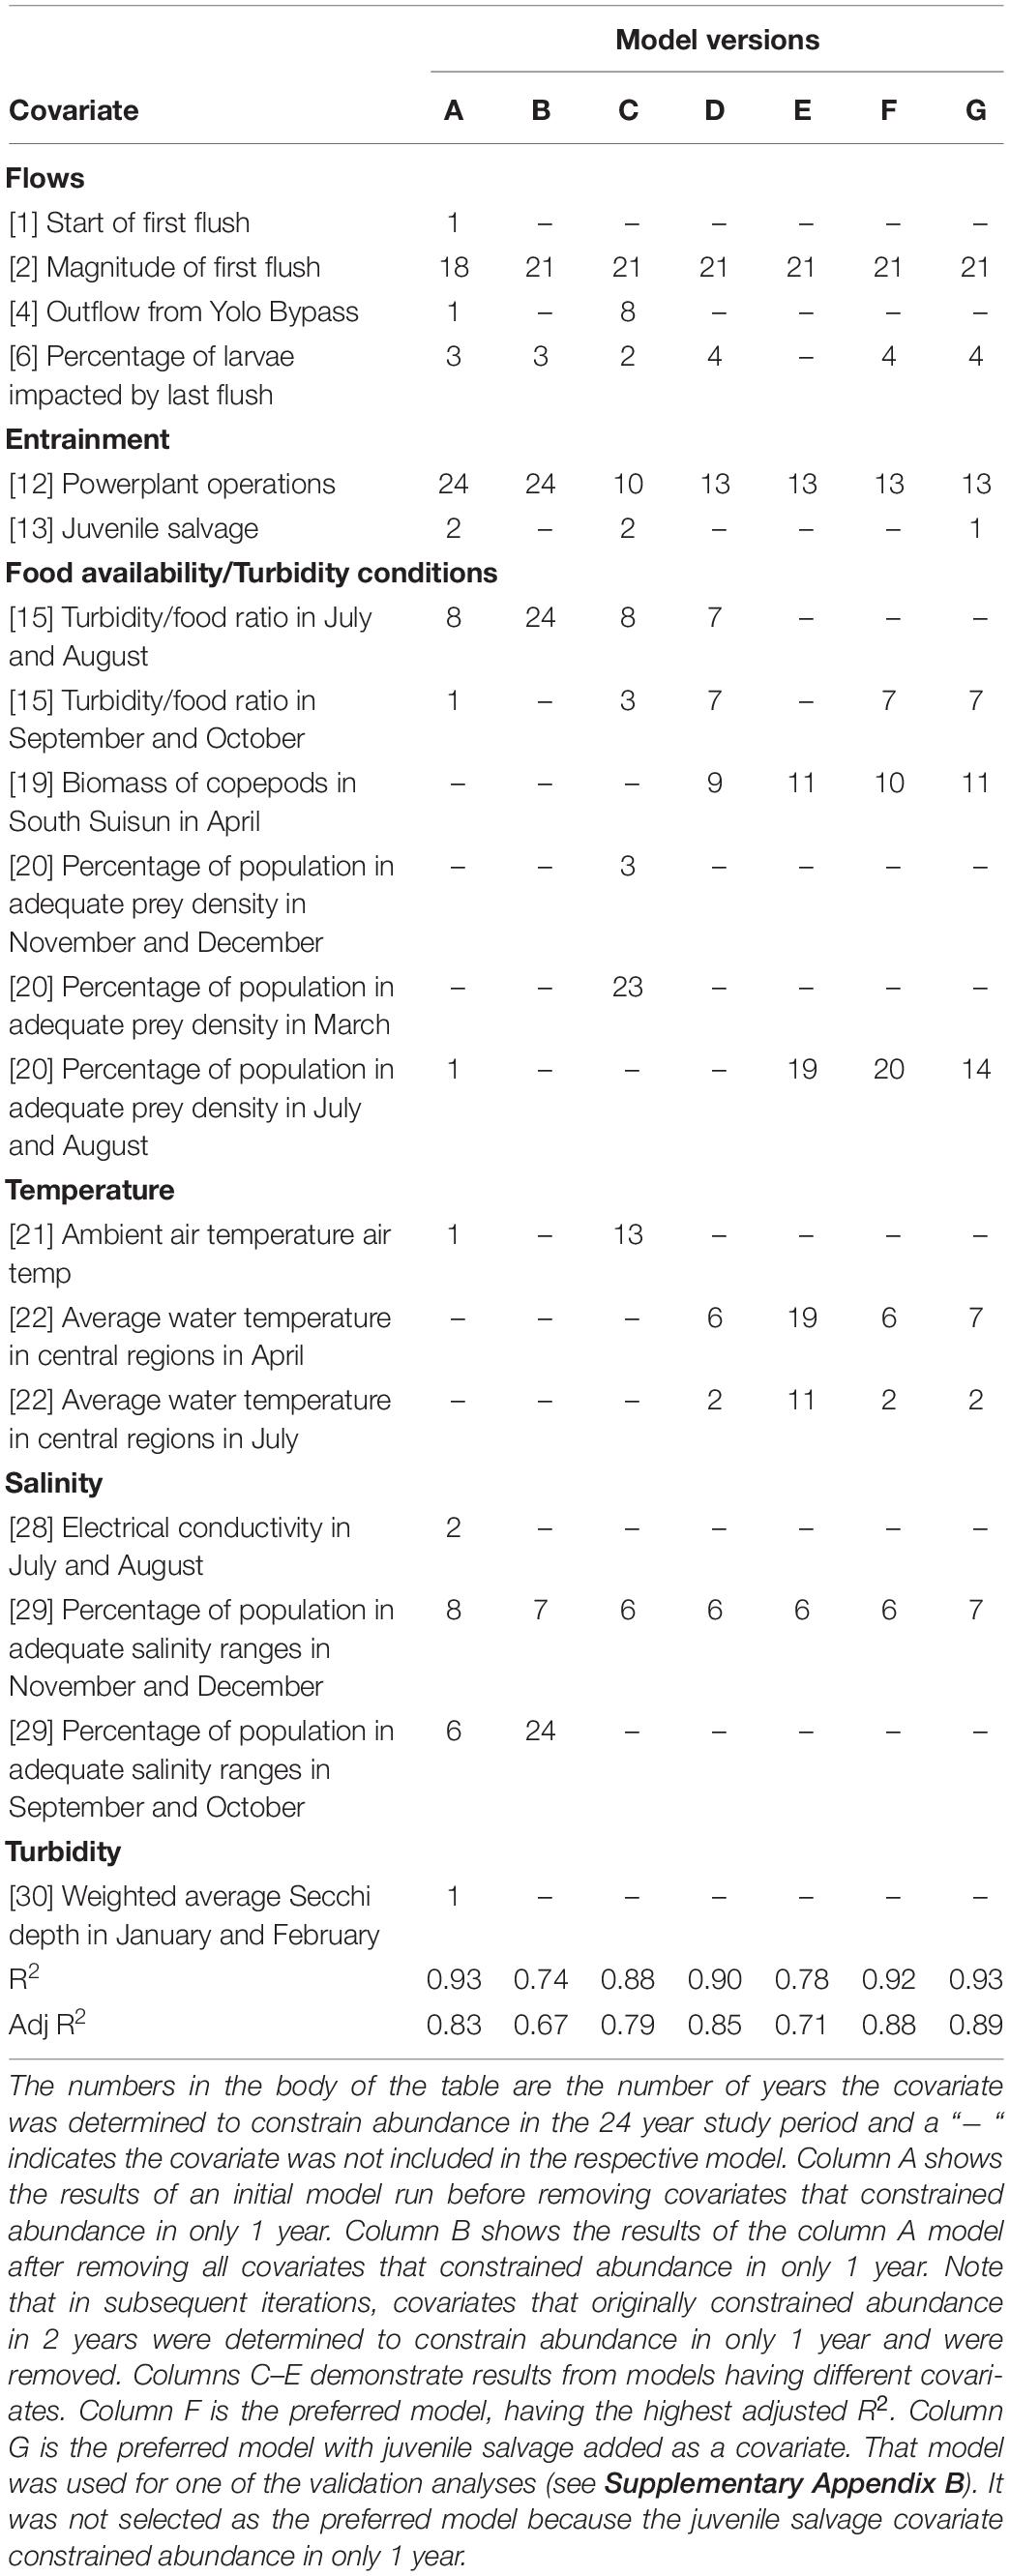
Table 4. Examples of representative model results.
The preferred model had an R2 of 0.92. The cross-validation analysis produced an R2 of 0.70. Given the sampling noise in survey returns that create uncertainty around abundance estimates (see Polansky et al., 2019), we consider the reported high R2 for the models to be a result of the technique effectively overfitting the data. We surmise that this occurs, in part, for the very reason the approach presented here mimics reality – not every covariate is influential every year. For example, unlike prey availability in summer that frequently constrains abundance, the impact of a late flush through the Delta was estimated to constrain abundance only rarely, in just four of 24 years, resulting in an effective and substantial reduction in the number of pertinent observations. Those 4 years necessarily are the years with the most severe impact of a late flush. The technique distinguished those years from other years in which there was no late flush, or a smaller percentage of the population was impacted by a late flush, but with no perceived impact on the population of delta smelt. The statistical consequence, in this example, is that one covariate must explain just four observations that are associated with constrained abundance and 20 that are not. With subsets of covariates in the preferred model explaining changes in abundance in any particular year, it is not surprising that the technique provides good fits. An additional reason for the high R2 might be the low degrees for freedom – we estimate 18 coefficients to explain 24 observations.
The frequency with which the environmental factors constrained abundance varied greatly. Most frequently limiting was the magnitude of the first flush of outflow through the Delta, constraining delta smelt abundance in 21 of 24 years (88%). This result was not surprising since flows into the Delta and within-Delta hydrodynamics are primary drivers of the Delta ecosystem, influencing food production from flood plains, salinity, turbidity, dilution of contaminants, and the abundance and distribution of aquatic weeds. The impact of the last flush through the Delta on larvae constrained delta smelt abundance in four of 24 years. Combined, these two findings help explain why some, but not all, wet years are good for delta smelt. Note that macro-hydrological manipulations are virtually impossible to effectuate through directed management actions. The average 30-day inflow following a first flush is 3.3 million acre feet of freshwater. With the winter draw down of upstream reservoirs to provide flood protection, it is not possible to simulate the volume of a substantial first flush through the Delta in dry years.
Food supply for delta smelt is manageable, by comparison with macro-hydrodynamics, by providing flows across floodplains and by restoring tidal marshlands. Food shortages in summer were projected to constrain delta smelt abundance in more than 80% of years in the study period (Table 5). Correcting lack of food availability in summer was projected to increase delta smelt abundance by 35%. Correcting low levels of turbidity and food availability in autumn was projected to increase abundance by 31%.
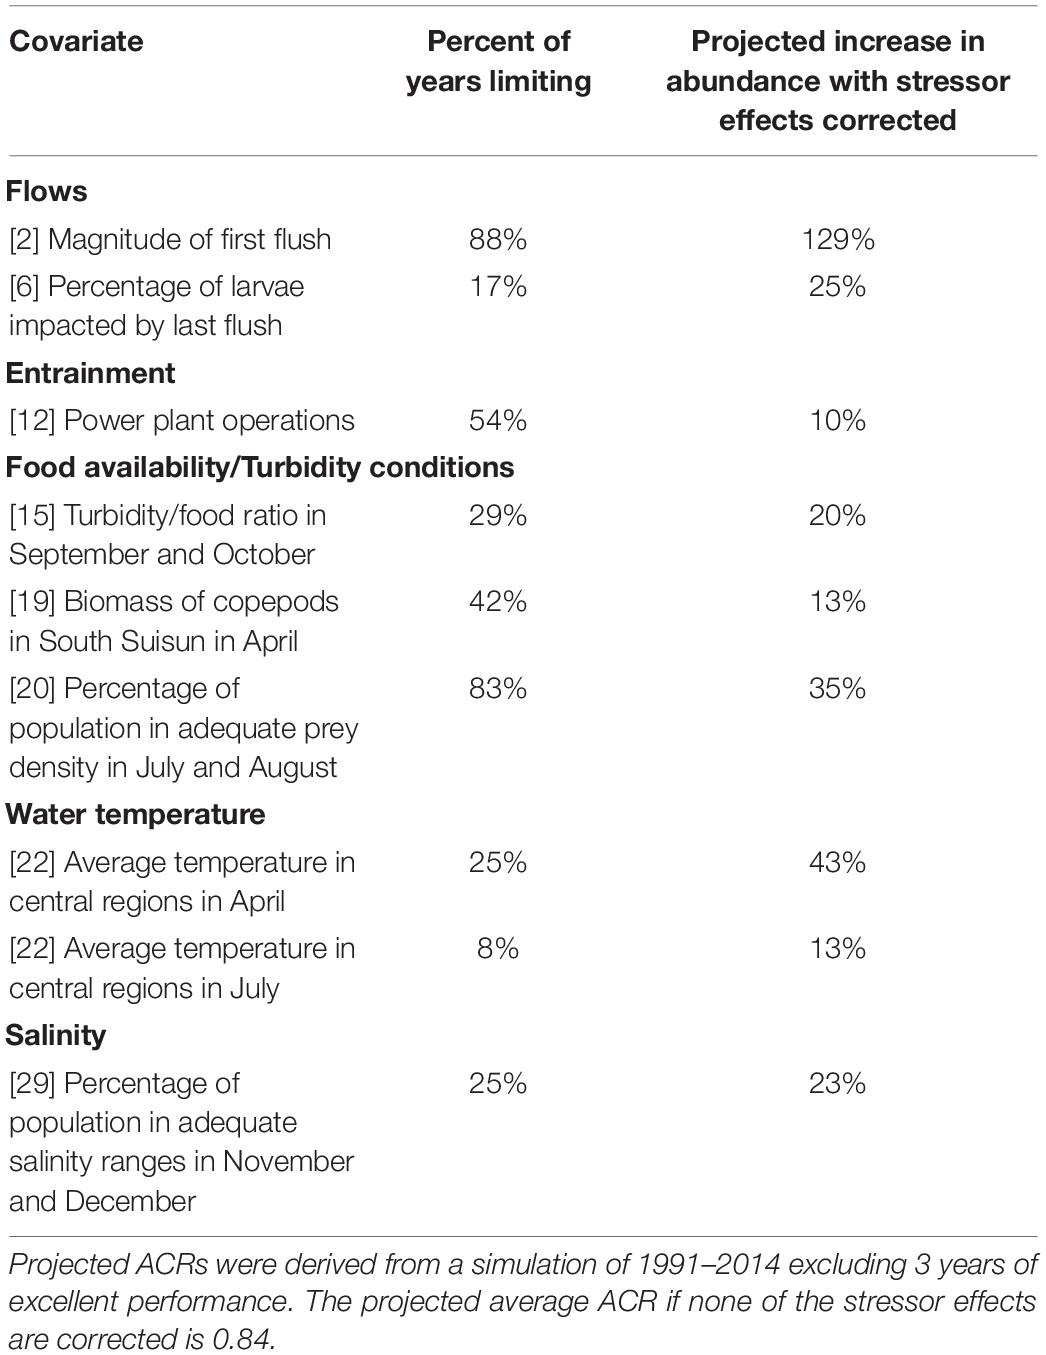
Table 5. Covariates that appear to constrain abundance of delta smelt, the percentage of years each covariate constrained abundance, and the projected average abundance change ratio (ACR) if inadequate factor conditions are corrected, therefore no longer limiting.
Water temperatures in both April and summer appear to constrain delta abundance. Water temperature in April, which influences the duration of the spawning season, was estimated to be the second most constraining of any individual covariate. If corrected, the average annual increase in delta smelt abundance was estimated to be 20%. Water temperatures in summer, a particular concern with climate change, were estimated to be constraining infrequently (8%) of the years.
Improving salinity in November-December period was projected to result in an average annual increase in delta smelt abundance of 23%. Salinity can be improved through increased reservoir releases or strategic operations of control gates that modulate salinity in Suisun Marsh.
Practitioners concerned with the efficient use of conservation-directed resources will be interested in knowing the point at which an action should be implemented to prevent a further decline delta smelt numbers. Using the estimated coefficients of the limiting factors in Eq. 6, we identified threshold environmental conditions at which population-level effects would commence, then compared them to conditions in years of excellent delta smelt performance (Table 6). The worst environmental factor conditions in years of excellent performance suggest that excellent performance can be achieved at those values although population level impacts may have occurred. And the values do not indicate how much “worse” the value may be and still achieve excellent delta smelt performance. We therefore use both sources of information to identify a “value triggering concern” in Table 6.
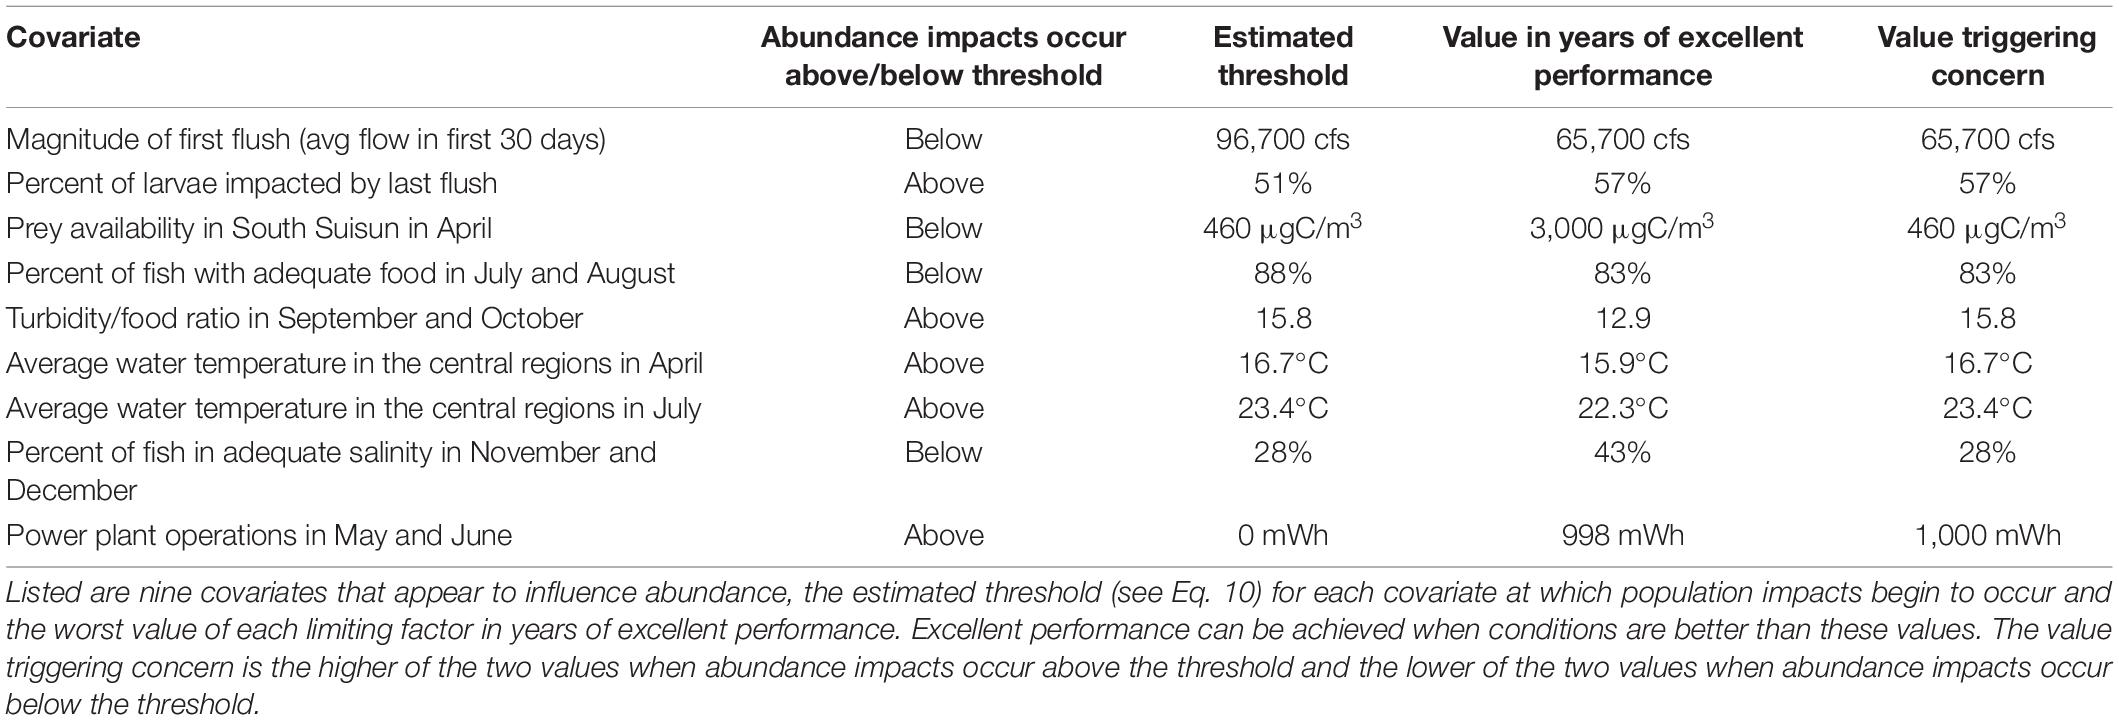
Table 6. Thresholds at which factor conditions likely influence abundance of delta smelt.
The triggering values in Table 6 have implications for conservation planners and resource managers. A triggering value of 83% for summer food indicates that relatively few delta smelt can experience food shortage in summer without impacting abundance; a relevant management action then should be carried out across much of the fish’s summer distribution. And actions to prolong spawning should aim to keep water temperatures in April below 16.5°C, although the management options to achieve that target may be limited. If that target cannot be reached, these results suggest the action will be ineffective.
Discussion
Identifying the environmental factors and conditions that are associated with the decline of delta smelt is the gateway to identifying appropriate management actions to protect and recover the species. Pernicious uncertainties pertaining to the effectiveness of management actions reflect an insufficient understanding of delta smelt population responses to environmental conditions. The consequence has manifested with valuable conservation resources expended on actions that have had no demonstrated benefits to delta smelt or its habitat. More important than the misappropriation of resources, with delta smelt abundance index values now less than 1% of those at the time of its listing under the federal Endangered Species Act, no time remains for in situ resource-management experiments that have spare empirical support.
The analytical technique employed in this study, a quantitative analysis utilizing non-linear optimization to identify the combination of limiting factors that best explain annual changes in delta smelt abundance, shows promise for resolving issues in relating environmental conditions to delta smelt performance. It recognizes limiting factors by mimicking ecological realities in the aquatic system – allowing environmental covariates to influence the fish’s abundance in some years and not others. It identifies environmental covariates that can explain changes in delta smelt abundance from many plausible candidate covariates that are highly correlated. Thresholds, environmental-factor-condition levels above or below which covariates begin to or cease to have an incremental effect on the population, are determined endogenously in this approach. Thresholds can be estimated from the covariate coefficients (see Eq. 10). Identification of thresholds can be helpful to conservation practitioners attempting to identify when and where environmental conditions may be inadequate for delta smelt within its brief, annual life cycle (see Table 6). Output from the technique allows years when environmental stressors do, and do not constrain a population response, to be identified (see Supplementary Appendix Table A4 for an illustration). The circumstances when the population increases in size in response to reductions in specific environmental stressors can be readily calculated. The poor explanatory power of many ecological models that do not consider limiting factors underscores the need to better simulate real world environmental conditions to identify the factors that limit recovery of endangered species.
We initiated this study with the question – What environmental conditions occurred in areas occupied by delta smelt in those years in which the fish experienced population decreases that did not occur in years when the population increased dramatically? Our results identified nine environmental factors that constrain the performance of delta smelt. The biological rationale for their inclusion is presented here, with additional supporting information provided in Supplementary Appendix C.
(1) Weaker storm events in the winter preceding the spawning period. Storm activity, particularly resulting in floodplain inundation, can increase in situ productivity, as well as delivering sediment and nutrients downstream, enhancing productivity there. The larger the first major storm of the season, the greater the inundation of Yolo Bypass, the primary flood plain that feeds the Delta. Delta smelt occupying Yolo Bypass spawn earlier and their offspring experience both higher-quality feeding conditions and growth rates (Mahardja et al., 2019).
(2) The occurrence of major storms late in the spring, which may transport delta smelt larvae and young juveniles into areas of the upper estuary that have poor habitat conditions or lack habitat altogether.
(3) Insufficient prey availability in Suisun Bay when delta smelt larvae and sub-juveniles are present in April. For many fishes, success at first feeding is believed to be critical to larval survival and a major cause of year-class variability (Leggett and DeBlois, 1994). The inclusion of this covariate in the preferred model suggests that early feeding influences delta smelt survival rates, with population-size consequences.
(4) Insufficient prey availability in areas of the upper estuary in July and August, as delta smelt seek refuge from warm water conditions. Survival of delta smelt juveniles from summer to fall is correlated with the standing biomass of copepods (Kimmerer, 2008; Maunder and Deriso, 2011; Hamilton and Murphy, 2018).
(5) Insufficient prey availability in fall combined with clearer water result in delta smelt having to spend more time searching for food, and an increased risk of predation.
(6) Elevated water temperature in April can truncate the delta smelt spawning period. Delta smelt may spawn multiple times in the spring if conditions are suitable. Delta smelt cease spawning when water temperatures become too warm.
(7) Elevated water temperatures in summer months stress delta smelt, increase their bioenergetic demands, and reduce survival rates.
(8) High salinity in Suisun Marsh in November and December. Delta smelt require low-salinity water for spawning. High salinity in November and December in Suisun Marsh may cause fewer delta smelt to move into Suisun Marsh for spawning, with alternative destination areas providing less successful conditions for recruitment.
(9) Power plant operations were previously associated with lower performance of delta smelt through high levels of direct entrainment and locally increased water temperatures (Matica and Sommer, 2005).
These limiting environmental factors can be compared to factors that have been identified as affecting delta smelt occupancy. Five recent studies considered a range of environmental (and other) factors influencing occupancy of delta smelt. Bever et al. (2016), using data for September through December (the peak period for the sub-adult life stage), concluded delta smelt catch was highest in areas of low salinity, low velocity, and low Secchi depths. Prey availability was not considered, although other factors were considered. LaTour (2016) also analyzed the September through December period, identifying year, month, geographic area, and Secchi depth as primary factors affecting patterns of landscape occupancy by delta smelt. Each of three subsequent investigations employed some version of a state-space modeling – an approach distinguishing factors that influence detection separate from factors that influence occupancy. Peterson and Barajas (2018) analyzed data from four surveys from March through December. Their best model attributed delta smelt occupancy to water temperature in summer, salinity, and the position of the low-salinity zone. Prey availability was not included as a candidate environmental covariate. Turbidity (Secchi depth) was included as a covariate in their detection model, not their occupancy model. Polansky et al. (2018) analyzed data for mature adults from January through May. Their best model included turbidity, salinity, tidal stage, and a regional component (geographic location) that varied by month. Temperature was not assessed (because the temperature range at that time of the year was well within the tolerance of adult delta smelt not significant in earlier model versions). Prey density was not considered. Simonis and Merz (2019) analyzed data from April through July, concluding that juvenile delta smelt are associated with slightly saline, turbid, generally slow-moving water with ample prey. Occupancy was strongly spatiotemporally autocorrelated (indicating that juveniles tend to be geographically anchored). They note that the distribution of delta smelt is related to Delta outflow – as outflow increases, density decreases, and the distribution of the fish moves downstream. Temperature was not considered because of its strong correlation with time of year.
In synthesizing the results of those five previous studies, occupancy, as opposed to detection, appears to be influenced by salinity and turbidity throughout the year, water temperature in the summer and fall, and food availability (from when delta smelt eggs hatch in spring through at least July). The results presented here indicate that while there is considerable overlap between the environmental factors that influence occupancy and those that determine delta smelt performance, the two sets of factors are not the same. Our results indicate that turbidity has an influence only in the autumn. Higher water temperature in summer has an adverse impact on both occupancy and performance. Cooler water temperature in April contributes to better performance by increasing the duration of spawning, but variation in water temperatures in the spring are not sufficient to influence occupancy. While salinity may influence occupancy year-round, our results indicate that salinity of water where delta smelt reside has little influence on performance except in November and December when the fish may be responding to a dispersal cue for spawning, rather than another physiological response. The only occupancy study to consider prey, that by Simonis and Merz (2019), concluded that juvenile delta smelt strongly track prey availability. While a continual supply of sufficient food might be an obvious factor influencing occupancy, our results indicate that the prey limits delta smelt abundance particularly in April, and then from July through October.
A new endeavor, the Collaborative Science and Adaptive Management Program (CSAMP), seeks to resolve scientific uncertainties and advance management actions to reverse the delta smelt’s downward population trajectory. That program has embarked on a comprehensive structured decision-making process – an approach that requires consensus on objectives, identification of the environmental factors that are preventing the species’ recovery, identification of candidate management actions to address those factors, and rigorous effects analysis using influence diagrams to evaluate the potential for targeted species-specific management actions to meet policy directives. While not all the deterministic environmental factors identified above as limiting factors can be manipulated with directed management actions, the results from this study have immediate applicability. The identification of a relatively small set of environmental factors limiting the recovery of delta smelt provides a critical link in the CSAMP structured decision-making process. It implores a strategy of implementing actions to modify influential and manageable factor conditions in geographic areas where conditions that cannot be manipulated are frequently adequate. Some examples of tractable resource management actions include manipulation of diversions from rivers to allow greater and more frequent flows across floodplains and marshlands, reoperation of salinity control gates in Suisun Marsh in November and December to improve abiotic (water quality) conditions in spawning areas, and habitat restoration to improve prey availability in summer, particularly in the western areas of the upper estuary where the water is typically cooler. Those targeted management actions might receive priority attention in efforts attempting to reverse the delta smelt’s attenuated population decline and the thresholds identified here might be used to develop targets for management actions. The results in this study indicate a need to focus on two critical periods for delta smelt – in April when water temperatures influence duration of spawning and when young delta smelt require abundant food, and in summer months when delta smelt appear to seek refuge from high water temperatures but when prey availability in many of those places is frequently insufficient to meet the delta smelt’s increased bioenergetic demands.
Accurately identifying environmental factors that constrain the recovery of a listed species is an essential enabling element of any conservation program. Our investigation identifies the environmental factors and factor conditions that appear to affect interannual changes in the performance of delta smelt and establishes how the impacts of those factors vary spatially and temporally within and between years. It also differentiates between factors that limit the size of the delta smelt population and other factors that do not, essential enabling steps in effects analysis (see Murphy and Weiland, 2011). Here we pursued a multiplicative limiting-factor analysis because it can assist in identifying environmental factors that influence the abundance indices for delta smelt in certain seasons and certain years, but not others, which is how environmental factors, including stressors, should be expected to affect an imperiled species. The approach advanced here, supported by simulation studies, suggests that it is possible to elicit environmental factors that are most likely to be controlling the abundance of delta smelt from a larger set of plausible candidate covariates.
Data Availability Statement
The original contributions presented in the study are included in the article/Supplementary Material, further inquiries can be directed to the corresponding author.
Author Contributions
DM was an ecologist and conservation biologist. SH was an expert in quantitative modeling and delta smelt and developed and implemented the modeling. Together they developed the idea of identifying the environmental factor conditions that distinguish years of population increase from population decrease. DM and SH shared in writing all text sections and approved the submitted version.
Funding
This study was funded by the Center for California Water Resources Policy and Management.
Conflict of Interest
The authors declare that the research was conducted in the absence of any commercial or financial relationships that could be construed as a potential conflict of interest.
Publisher’s Note
All claims expressed in this article are solely those of the authors and do not necessarily represent those of their affiliated organizations, or those of the publisher, the editors and the reviewers. Any product that may be evaluated in this article, or claim that may be made by its manufacturer, is not guaranteed or endorsed by the publisher.
Supplementary Material
The Supplementary Material for this article can be found online at: https://www.frontiersin.org/articles/10.3389/fevo.2022.826025/full#supplementary-material
Supplementary Appendix A | A simplified example of the implementation of the limiting factor approach with comparison to other forms of estimation.
Supplementary Appendix B | Model verification and validation.
Supplementary Appendix C | Synthetic review of influential environmental covariates.
Supplementary Appendix D | Review and specification of environmental factors potentially limiting the abundance and recovery of delta smelt.
References
Bever, A. J., MacWilliams, M. L., Herbold, B., Brown, L. R., and Feyrer, F. (2016). Linking hydrodynamic complexity to delta smelt (Hypomesus transpacificus) distribution in the San Francisco Estuary, USA. San Franc. Estuary Watershed Sci. 14, 1–27. doi: 10.15447/sfews.2016v14iss1art3
Cade, B. S., Terrell, J. W., and Schroeder, R. L. (1999). Estimating effects of limiting factors with regression quantiles. Ecology 80, 311–323. doi: 10.1890/0012-9658(1999)080[0311:EEOLFW]2.0.CO;2
Carlton, J. T., Thompson, J. K., Schemel, L. E., and Nichols, F. H. (1990). Remarkable invasion of San Francisco Bay (California, USA) by the Asian clam Potamocorbula amurensis. I. Introduction and dispersal. Mar. Ecol. Prog. Ser. 66, 81–94. doi: 10.3354/meps066081
Davis, B. E., Cocherell, D. E., Sommer, T., Baxter, R. D., Hung, T., Todgham, A. E., et al. (2019). Sensitivities of an endemic, endangered California smelt and two non-native fishes to serial increases in temperature and salinity: implications for shifting community structure with climate change. Conserv. Physiol. 7:coy076. doi: 10.1093/conphys/coy076
Dunham, J. B., Cade, B. S., and Terrell, J. W. (2002). Influences of spatial and temporal variation on fish-habitat relationships defined by regression quantiles. Tran. Am. Fish. Soc. 131, 86–98. doi: 10.1577/1548-8659(2002)131<0086:IOSATV>2.0.CO;2
Feyrer, F., Herbold, B., Matern, S. A., and Moyle, P. B. (2003). Dietary shifts in a stressed fish assemblage: consequences of a bivalve invasion in the San Francisco Estuary. Environ. Biol. Fishes 67, 277–288. doi: 10.1023/A:1025839132274
Feyrer, F., Newman, K. B., Nobriga, M. L., and Sommer, T. R. (2011). Modeling the effects of future outflow on the abiotic habitat of an imperiled estuarine fish. Estuaries and Coasts 34, 120–128. doi: 10.1007/s12237-010-9343-9
Feyrer, F., Nobriga, M. L., and Sommer, T. R. (2007). Multi-decadal trends for three declining fish species: habitat patterns and mechanisms in the San Francisco Estuary, California, U.S.A. Can. J. Fish. Aquat. Sci. 136, 1393–1405.
Grossman, G. D. (2016). Predation on fishes in the Sacramento-San Joaquin Delta: current knowledge and future directions. San Franc. Estuary Watershed Sci. 14, 1–23. doi: 10.15447/sfews.2016v14iss2art8
Hamilton, S. A., and Murphy, D. D. (2018). Analysis of limiting factors across the life cycle of delta smelt (Hypomesus transpacificus). Environ. Manage. 62, 365–382. doi: 10.1007/s00267-018-1014-9
Hamilton, S. A., and Murphy, D. D. (2020). Use of affinity analysis to guide habitat restoration and enhancement for the imperiled delta smelt (Hypomesus transpacificus). Endanger. Species Res. 43, 103–120. doi: 10.3354/esr01057
Hammock, B. G., Slater, S. B., Baxter, R. D., Fangue, N. A., Cocherell, D., Hennessy, A., et al. (2017). Foraging and metabolic consequences of semi-anadromy for an endangered estuarine fish. PLoS One 12:e0173497. doi: 10.1371/journal.pone.0173497
Hobbs, J. A. (2016). A Synthesis of Delta Smelt Growth and Life History Studies, Final Report. Davis, CA: University of California-Davis, Department of Wildlife, Fish and Conservation Biology. doi: 10.13140/RG.2.1.2427.8004
Hobbs, J. A., Lewis, L. S., Willmes, M., Denney, C., and Bush, E. (2019). Complex life histories discovered in a critically endangered fish. Sci. Rep. 9:16772. doi: 10.1038/s41598-019-52273-8
IEP MAST (2015). An Updated Conceptual Model of Delta Smelt Biology: Our Evolving Understanding of an Estuarine Fish (No. 90). Sacramento, CA: Interagency Ecological Program, California Department of Water Resources.
Johnson, M. (2007). Measuring habitat quality: a review. Condor 109, 489–504. doi: 10.1093/condor/109.3.489
Kimmerer, W. J. (2008). Losses of Sacramento River Chinook salmon and delta smelt to entrainment in water diversions in the Sacramento–San Joaquin Delta. San Franc. Estuary atershed Sci. 6:2. doi: 10.15447/sfews.2008v6iss2art2
Kimmerer, W. J., MacWilliams, M. L., and Gross, E. S. (2013). Variation of fish habitat and extent of the low-salinity zone with freshwater flow in the San Francisco Estuary. San Franc. Estuary Watershed Sci. 11, 1–16. doi: 10.15447/sfews.2013v11iss4art1
Komoroske, L. M., Connon, R. E., Lindberg, J., Cheng, B. S., Castillo, G., Hasenbein, M., et al. (2014). Ontogeny influences sensitivity to climate change stressors in an endangered fish. Conserv. Physiol. 2:cou008. doi: 10.1093/conphys/cou008
Komoroske, L. M., Jeffries, K. M., Connon, R. E., Dexter, J., Hasenbein, M., Verhille, C., et al. (2016). Sublethal salinity stress contributes to habitat limitation in an endangered estuarine fish. Evol. Appl. 9, 963–981. doi: 10.1111/eva.12385
LaTour, R. J. (2016). Explaining patterns of pelagic fish abundance in the Sacramento-San Joaquin Delta. Estuaries and Coasts 39, 233–247. doi: 10.1007/s12237-015-9968-9
Leggett, W. C., and DeBlois, E. (1994). Recruitment in marine fishes: is it regulated by starvation and predation in the egg and larval stages? Neth. J. Sea Res. 32, 119–134. doi: 10.1016/0077-7579(94)90036-1
Mac Nally, R., Thomson, J. R., Kimmerer, W. J., Feyrer, F., Newman, K. B., Sih, A., et al. (2010). Analysis of pelagic species decline in the upper San Francisco Estuary using multivariate autoregressive modeling (MAR). Ecol. Appl. 20, 1417–1430. doi: 10.1890/09-1724.1
Mager, R. C. (1996). Gametogenesis, Reproduction and Artificial Propagation of Delta Smelt, Hypomesus Transpacificus. Ph.D. thesis. Davis, CA: University of California.
Mahardja, B., Conrad, J. L., Lusher, L., and Schreier, B. (2016). Abundance trends, distribution, and habitat associations of the invasive Mississippi silversides (Menidia audens) in the Sacramento-San Joaquin Delta, California, USA. San Franc. Estuary Watershed Sci. 14, 1–16. doi: 10.15447/sfews.2016v14iss1art2
Mahardja, B., Hobbs, J. A., Ikemiyagi, N., Benjamin, A., and Finger, A. J. (2019). Role of freshwater floodplain-tidal slough complex in the persistence of the endangered delta smelt. PLoS One 14:e0208084. doi: 10.1371/journal.pone.0208084
Matica, Z., and Sommer, T. (2005). Aquatic impacts of the Pittsburg and Contra Costa Power Plants, Draft Report. Sacramento, CA: California Department of Water Resources.
Maunder, M. N., and Deriso, R. B. (2011). A state–space multistage life-cycle model to evaluate population impacts in the presence of density dependence: illustrated with application to delta smelt (Hypomesus transpacificus). Can J Fish Aquat Sci 68, 1285–1306. doi: 10.1139/f2011-071
Merz, J. M., Hamilton, S. A., Bergman, P. S., and Cavallo, B. (2011). Spatial perspective for delta smelt: a summary of contemporary survey data. Calif. Fish Game 97, 164–189.
Miller, W. J., Manly, B. F., Murphy, D. D., Fullerton, D., and Ramey, R. R. (2012). An investigation of factors affecting the decline of delta smelt (Hypomesus transpacificus) in the Sacramento-San Joaquin Estuary. Rev. Fish. Sci. 20, 1–19. doi: 10.1080/10641262.2011.634930
Moyle, P. B., Herbold, B., Stevens, D. E., and Miller, M. W. (1992). Life history of delta smelt in the Sacramento-San Joaquin Estuary, California. Trans. Am. Fish. Soc. 121, 67–77. doi: 10.1577/1548-8659(1992)121<0067:LHASOD>2.3.CO;2
Murphy, D. D., and Hamilton, S. A. (2013). Eastward migration or marshward dispersal: exercising survey data to elicit an understanding of seasonal movement of delta smelt. San Franc. Estuary Watershed Sci. 11, 1–20. doi: 10.15447/sfews.2013v11iss3art12
Murphy, D. D., and Weiland, P. S. (2011). The route to best science in implementation of the Endangered Species Act’s consultation mandate: the benefits of structured effects analysis. Environ. Manage. 47, 161–172. doi: 10.1007/s00267-010-9597-9
Murphy, D. D., and Weiland, P. S. (2019). The low-salinity zone in the San Francisco Estuary as a proxy for delta smelt habitat: a case study in the misuse of surrogates in conservation planning. Ecol. Indic. 105, 29–35. doi: 10.1016/j.ecolind.2019.05.053
Nobriga, M. L., Sommer, T. R., Feyrer, F., and Fleming, D. (2008). Long-term trends in summertime habitat suitability for delta smelt (Hypomesus transpacificus). San Franc. Estuary Watershed Sci. 6, 1–13. doi: 10.15447/sfews.2008v6iss1art1
Peterson, J. T., and Barajas, M. F. (2018). An evaluation of three fish surveys in the San Francisco Estuary, California, 1995-2015. San Franc. Estuary Watershed Sci. 16, 1–28. doi: 10.15447/sfews.2018v16iss4art2
Polansky, L., Mitchell, L., and Newman, K. B. (2019). Using multistage design-based methods to construct abundance indices and uncertainty measures for delta smelt. Trans. Am. Fish. Soc. 148, 710–724. doi: 10.1002/tafs.10166
Polansky, L., Mitchell, L., and Newman, K. B. (2021). Using multistage design-based methods to construct abundance indices and uncertainty measures for delta smelt. Trans. Am. Fish. Soc. 148, 710–724.
Polansky, L., Newman, K. B., Nobriga, M. L., and Mitchell, L. (2018). Spatiotemporal models of an estuarine fish species to identify patterns and factors impacting their distribution and abundance. Estuar. Coasts 41, 572–581. doi: 10.1007/s12237-017-0277-3
Reznick, D., Bryant, M. J., and Bashey, F. (2002). r-and K-selection revisited: the role of population regulation in life-history evolution. Ecology 83, 1509–1520. doi: 10.1890/0012-9658(2002)083[1509:RAKSRT]2.0.CO;2
Schreier, B., Baerwald, M. R., Conrad, J. L., Schumer, G., and May, B. (2016). Examination of predation on early life-stage delta smelt in the San Francisco Estuary using DNA diet analysis. Trans. Am. Fish. Soc. 145, 723–733. doi: 10.1080/00028487.2016.1152299
Simonis, J. L., and Merz, J. E. (2019). Prey availability, environmental constraints, and aggregation dictate population distribution of an imperiled fish. Ecosphere 10:e02634. doi: 10.1002/ecs2.2634
Smith, P. E., Donovan, J. M., and McNamara, B. J. (2018). Volumes and Areas of Subregions within the San Francisco Bay-Delta Estuary. USGS Open File Report. Reston VA: USGS.
Sommer, T., Armor, C., Baxter, R., Breuer, R., Brown, L., Chotkowski, M., et al. (2007). The collapse of pelagic fishes in the upper San Francisco Estuary. Fisheries 32, 270–277. doi: 10.1577/1548-8446(2007)32[270:TCOPFI]2.0.CO;2
Sommer, T. R., Harrell, W. R., Kurth, R., Feyrer, F., Zeug, S. C., and O’Leary, G. (2004). “Ecological patterns of early life stages of fishes in a river-floodplain of the San Francisco Estuary,” in Early Life History of Fishes in the San Francisco Estuary and Watershed, eds F. Feyrer, L. R. Brown, R. L. Brown, and J. J. Orsi (Bethesda, MD: American Fisheries Society), 111–123.
Thomson, J. R., Kimmerer, W. J., Brown, L. R., Newman, K. B., MacNally, R., Bennett, W. A., et al. (2010). Bayesian change point analysis of abundance trends for pelagic fishes in the upper San Francisco Estuary. Ecol. Appl. 20, 1431–1448. doi: 10.1890/09-0998.1
U.S. Fish and Wildlife Service (2004). Five-year review of the delta smelt. August 1, 2003. Federal Reg. 68, 45270–45271.
USFWS (1996). Sacramento-San Joaquin Delta Native Fishes Recovery Plan. Portland, OR: U.S. Fish and Wildlife Service.
USFWS (2008). Biological Opinion on the Effects of the Coordinated Operations of the CVP and SWP in California to the Threatened Delta Smelt (Hypomesus transpacificus) and its Designated Critical Habitat. Memo 12/15/2008 to Bureau of Reclamation from Region 8 Director. Sacramento, CA: U.S. Fish and Wildlife Service.
van Geen, A., and Luoma, S. N. (1999). The impact of human activities on sediments of San Francisco Bay, California: an overview. Mar. Chem. 64, 1–6.
Van Horne, B. (1983). Density as a misleading indicator of habitat quality. J. Wildl. Manage. 47, 893–901. doi: 10.2307/3808148
Keywords: delta smelt, environmental factors, limiting factors, habitat quality, multivariate analysis
Citation: Hamilton SA and Murphy DD (2022) Identifying Environmental Factors Limiting Recovery of an Imperiled Estuarine Fish. Front. Ecol. Evol. 10:826025. doi: 10.3389/fevo.2022.826025
Received: 30 November 2021; Accepted: 02 May 2022;
Published: 03 June 2022.
Edited by:
Renato Silvano, Federal University of Rio Grande do Sul, BrazilReviewed by:
Friedrich Keppeler, University of Wisconsin-Madison, United StatesJaime A. Collazo, North Carolina State University, United States
Copyright © 2022 Hamilton and Murphy. This is an open-access article distributed under the terms of the Creative Commons Attribution License (CC BY). The use, distribution or reproduction in other forums is permitted, provided the original author(s) and the copyright owner(s) are credited and that the original publication in this journal is cited, in accordance with accepted academic practice. No use, distribution or reproduction is permitted which does not comply with these terms.
*Correspondence: Scott A. Hamilton, U2NvdHRAUmVzb3VyY2VFY29ub21pY3MubmV0